
Investor Presentation Second Quarter 2026 September 3, 2026

DISCLAIMER FORWARD-LOOKING STATEMENTS This investor presentation includes “forward-looking statements” within the meaning of the Private Securities Litigation Reform Act of 1995. All statements, other than statements of historical facts included in this investor presentation, including statements concerning Duluth Trading’s plans, objectives, goals, beliefs, business strategies, future events, business conditions, its results of operations, financial position and its business outlook, business trends and certain other information herein, including statements under the heading “Fiscal 2026 Outlook” are forward-looking statements. You can identify forward-looking statements by the use of words such as “may,” ”might,” “will,” “should,” “expect,” “plan,” “anticipate,” “could,” “believe,” “estimate,” “project,” “target,” “predict,” “intend,” “future,” “budget,” “goals,” “potential,” “continue,” “design,” “objective,” “forecasted,” “would” and other similar expressions. The forward-looking statements are not historical facts, and are based upon Duluth Trading’s current expectations, beliefs, estimates, and projections, and various assumptions, many of which, by their nature, are inherently uncertain and beyond Duluth Trading’s control. Duluth Trading’s expectations, beliefs and projections are expressed in good faith, and Duluth Trading believes there is a reasonable basis for them. However, there can be no assurance that management’s expectations, beliefs, estimates, and projections will be achieved and actual results may vary materially from what is expressed in or indicated by the forward-looking statements. Forward-looking statements are subject to risks and uncertainties that could cause actual performance or results to differ materially from those expressed in the forward-looking statements, including, among others, the risks, uncertainties, and factors set forth under Part 1, Item 1A “Risk Factors” in the Company’s Annual Report on Form 10-K filed with the SEC on March 20, 2026 and other factors as may be periodically described in Duluth Trading’s subsequent filings with the SEC. These risks and uncertainties include, but are not limited to, the following: the impact of inflation and measures to control inflation on our results of operations; the prolonged effects of economic uncertainties on store and website traffic; the susceptibility of the price and availability of our merchandise to international trade conditions including tariffs; changes in U.S. and non-U.S. laws affecting the importation and taxation of goods, including imposition of unilateral tariffs on imported goods; our ability to secure the personal and/or financial information of our customers and employees; disruptions to our distribution network, supply chains and operations; failure to effectively manage inventory levels; our ability to maintain and enhance a strong brand and sub-brand image; adapting to declines in consumer confidence, inflation and decreases in consumer spending; disruptions to our e-commerce platform; our ability to meet customer delivery time expectations; our ability to properly allocate inventory throughout our distribution network to fulfill customer demand; our failure to meet our debt covenant ratios; natural disasters, unusually adverse weather conditions, boycotts, prolonged public health crises, epidemics or pandemics and unanticipated events; generating adequate cash from our existing stores and direct sales to support our growth; the impact of changes in corporate tax regulations and sales tax; identifying and responding to new and changing customer preferences; the success of the locations in which our stores are located; effectively relying on sources for merchandise located in foreign markets; transportation delays and interruptions, including port congestion; our inability to timely and effectively obtain shipments of products from our suppliers and deliver merchandise to our customers; the inability to maintain the performance of our maturing store portfolio; our inability to deploy marketing tactics and commit adequate resources to support marketing in order to retain and attract new customers; our ability to successfully open new stores; effectively adapting to new challenges associated with our expansion into new geographic markets; competing effectively in an environment of intense competition or elevated promotions; our ability to adapt to significant changes in sales due to the seasonality of our business; price reductions or inventory shortages resulting from failure to purchase the appropriate amount of inventory in advance of the season in which it will be sold; the potential for further increases in price and lack of availability of raw materials; our dependence on third-party vendors to provide us with sufficient quantities of merchandise at acceptable prices; failure of our vendors and their manufacturing sources to use acceptable labor or other practices; our dependence upon key executive management or our inability to hire or retain the talent required for our business; increases in costs of fuel or other energy, transportation or utility costs and in the costs of labor and employment; failure of our information technology systems to support our current and growing business, before and after our planned upgrades; disruptions in our supply chain and fulfillment centers; our inability to protect our trademarks or other intellectual property rights; infringement on the intellectual property of third parties; acts of war, terrorism or civil unrest; the impact of governmental laws and regulations and the outcomes of legal proceedings; failure to comply with data privacy regulation; our ability to comply with the security standards for the credit card industry; our failure to maintain adequate internal controls over our financial and management systems; acquisition, disposition, and development risks; and other factors that may be disclosed in our SEC filings or otherwise. Forward-looking statements speak only as of the date the statements are made. Duluth Trading assumes no obligation to update forward-looking statements to reflect actual results, subsequent events or circumstances or other changes affecting forward-looking information except to the extent required by applicable securities laws. 02
DISCLAIMER NON-GAAP MEASUREMENTS Management believes that non-GAAP financial measures may be useful in certain instances to provide additional meaningful comparisons between current results and results in prior operating periods. Within this presentation, including the tables attached hereto, reference is made to adjusted earnings before interest, taxes, depreciation and amortization (EBITDA), Adjusted Net Income (Loss), Adjusted EPS, and Forecasted Adjusted EBITDA. See attached table “Reconciliation of Net Income (Loss) to EBITDA and EBITDA to Adjusted EBITDA,” for a reconciliation of net income (loss) to EBITDA and EBITDA to Adjusted EBITDA and “Reconciliation of Net Income (Loss) to Adjusted Net Income (Loss) and EPS to Adjusted EPS” for a reconciliation of net income (loss) to adjusted net income (loss) and EPS to adjusted EPS for the three and six months ended August 2, 2026 and August 3, 2025. Also see attached table “Reconciliation of Forecasted Net Income (Loss) to Forecasted EBITDA and Forecasted EBITDA to Forecasted Adjusted EBITDA” for a reconciliation of forecasted Adjusted EBITDA for Fiscal 2026. Adjusted EBITDA is a metric used by management and frequently used by the financial community, which provides insight into an organization’s operating trends and facilitates comparisons between peer companies, since interest, taxes, depreciation and amortization can differ greatly between organizations as a result of differing capital structures and tax strategies. Adjusted EBITDA excludes certain items that are unusual in nature or not comparable from period to period. Adjusted Net Income (Loss) and Adjusted EPS are metrics used by management and frequently used by the financial community, which provides insight into the effectiveness of our business strategies and to compare our performance against that of peer companies. Adjusted Net Income (Loss) and Adjusted EPS exclude restructuring expenses and impairment expenses that are not comparable from period to period. The Company provides this information to investors to assist in comparisons of past, present and future operating results and to assist in highlighting the results of on-going operations. While the Company’s management believes that non-GAAP measurements are useful supplemental information, such adjusted results are not intended to replace the Company’s GAAP financial results and should be read in conjunction with those GAAP results. 03

INTRODUCTION TO DULUTH TRADING COMPANY 04

INTRODUCTION TO DULUTH TRADING COMPANY WHO WE ARE The Official Outfitter of Doers. We exist to champion the hands-on way of life. We build high-quality gear for hands-on folks who measure value by how long something lasts — not how much it costs. We are a No Bull Brand. We do what we say and make it right if we miss the mark. We poke average in the eye by finding a better way to create solution-based products for our customers. 05 66 STORES ACROSS 32 STATES

01 PRODUCT IS OUR PASSION. 02 THE CUSTOMER IS OUR COMPASS. 03 PEOPLE SET US APART. 04 ONWARD. ALWAYS. 05 WE POKE AVERAGE IN THE EYE. 06 OUR FIVE WELDS INTRODUCTION TO DULUTH TRADING COMPANY
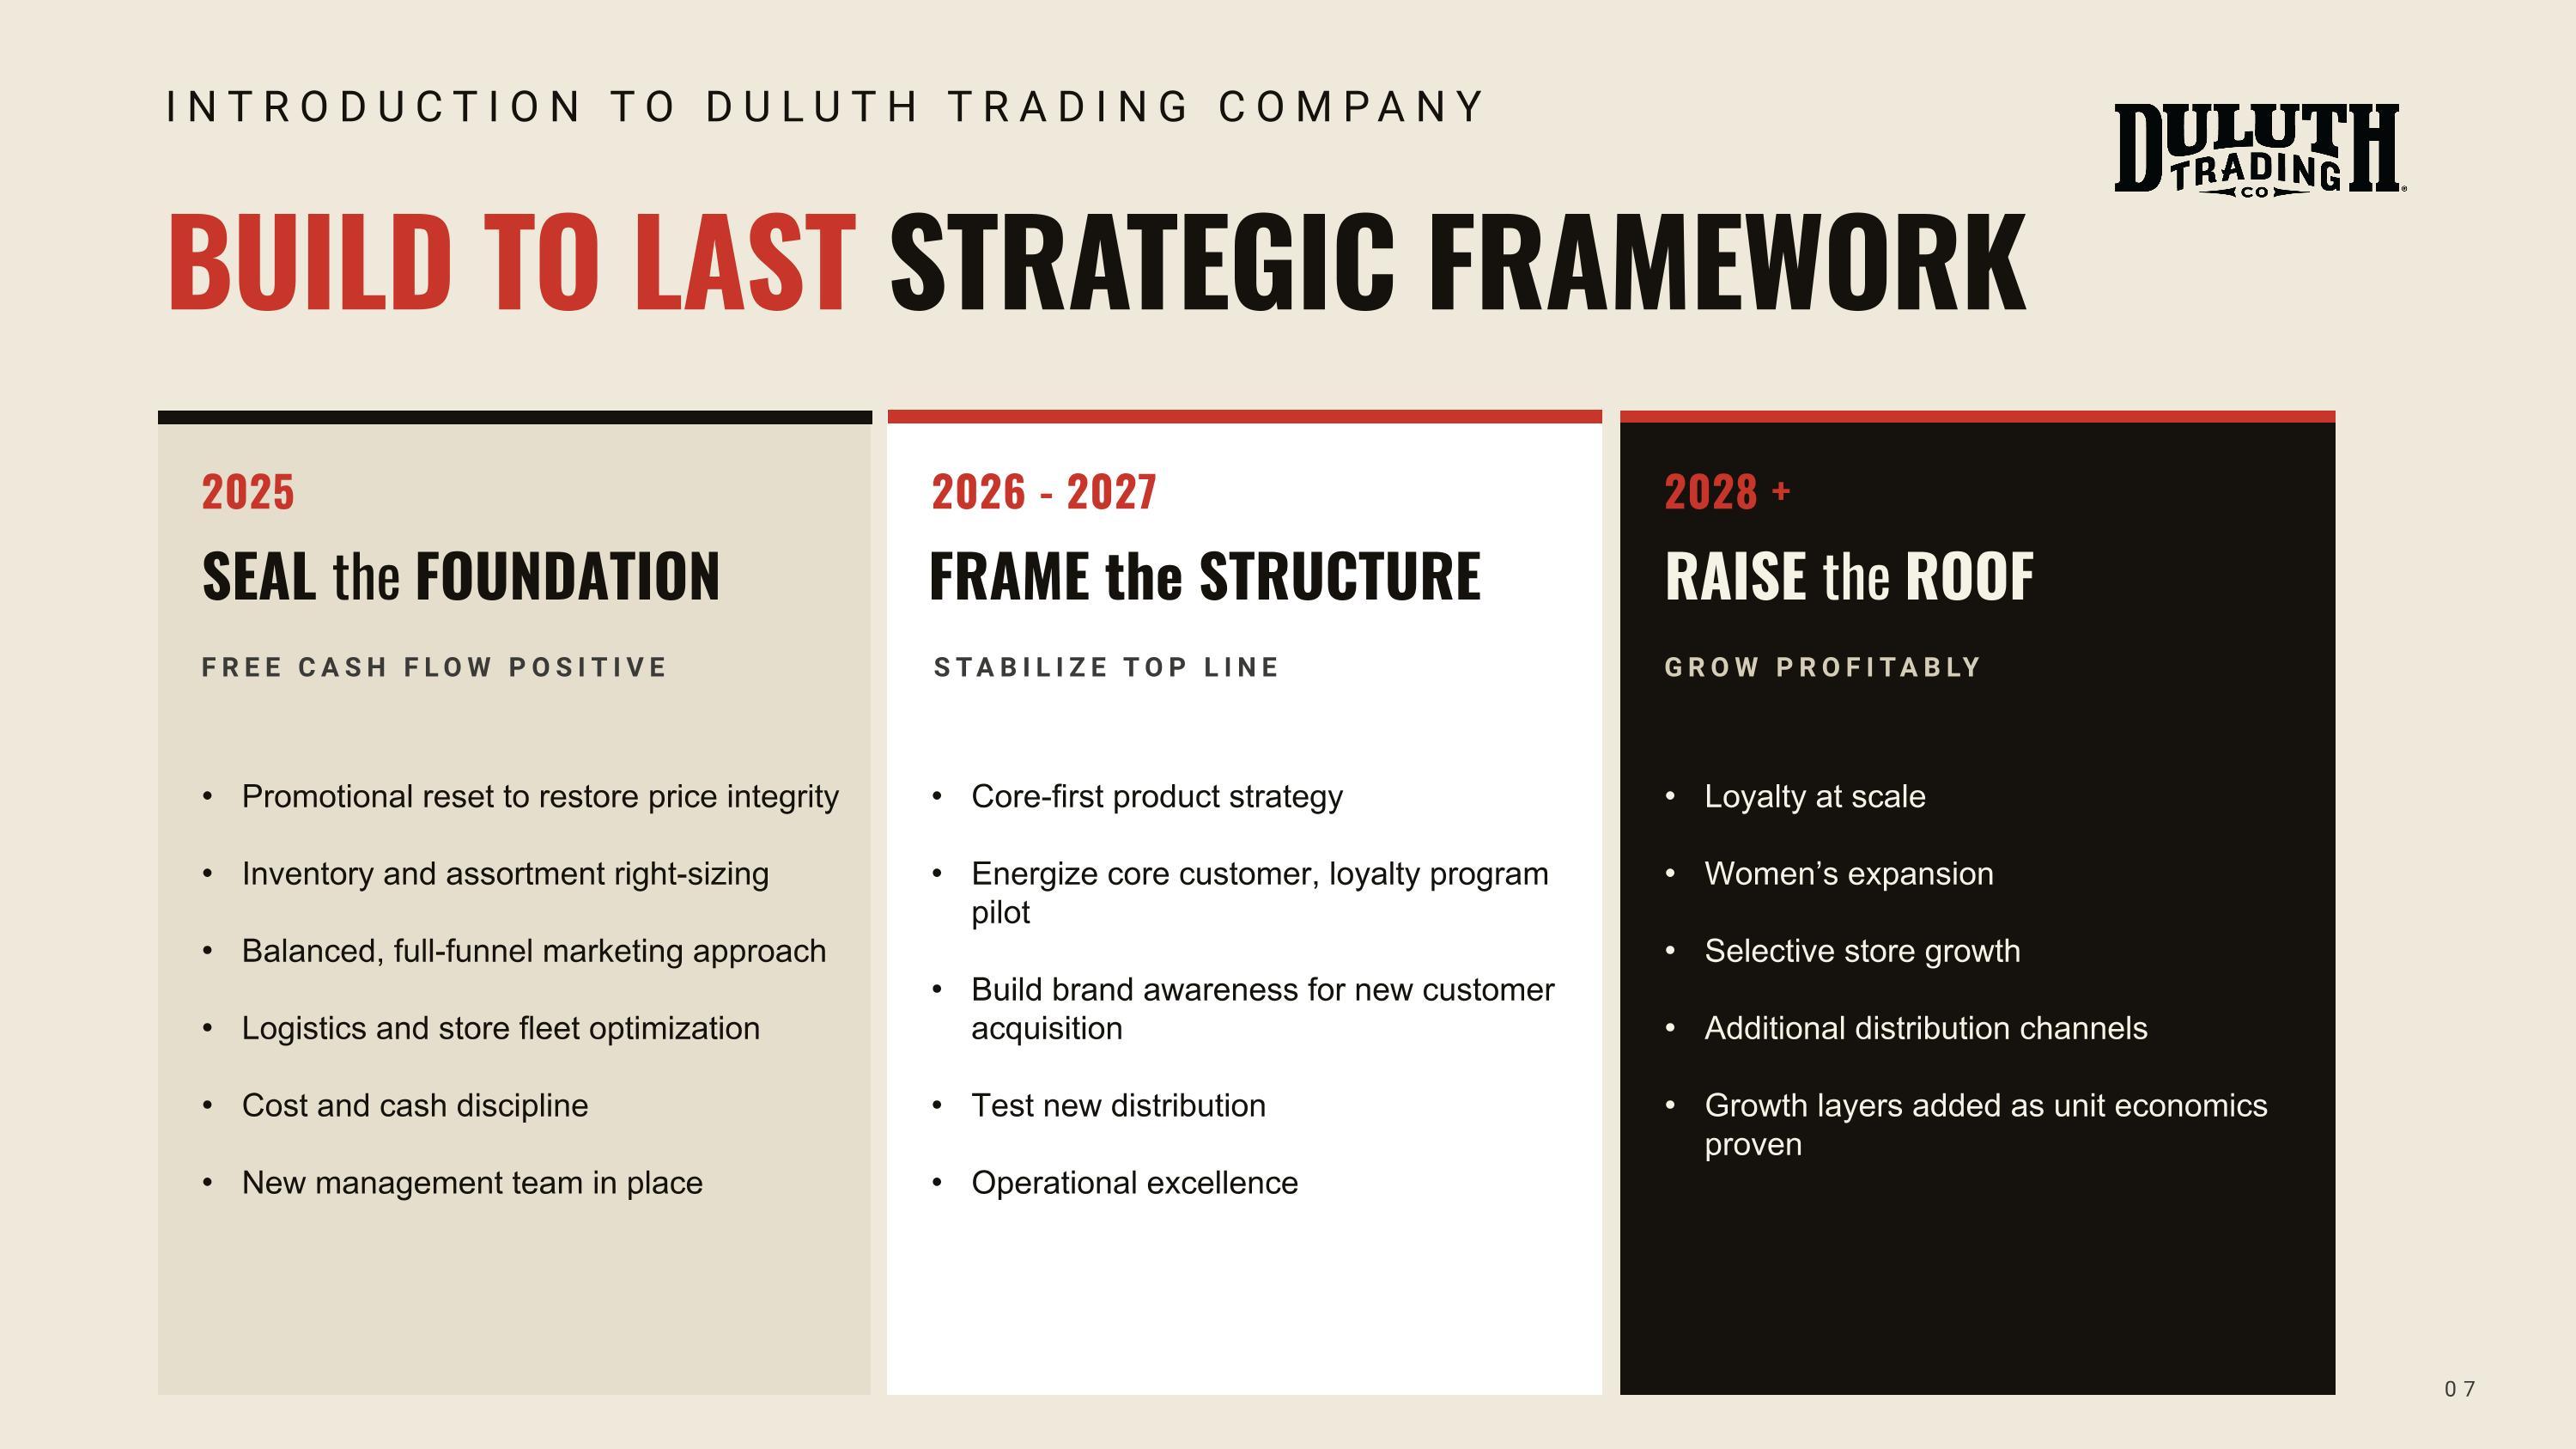
BUILD TO LAST STRATEGIC FRAMEWORK 2025 SEAL the FOUNDATION FREE CASH FLOW POSITIVE Promotional reset to restore price integrity Inventory and assortment right-sizing Balanced, full-funnel marketing approach Logistics and store fleet optimization Cost and cash discipline New management team in place 2028 + RAISE the ROOF GROW PROFITABLY Loyalty at scale Women’s expansion Selective store growth Additional distribution channels Growth layers added as unit economics proven 07 2026 — 2027 FRAME the STRUCTURE STABILIZE TOP LINE Core-first product strategy Energize core customer, loyalty program pilot Build brand awareness for new customer acquisition Test new distribution Operational excellence FRAME the STRUCTURE STABILIZE TOP LINE 2026 - 2027 INTRODUCTION TO DULUTH TRADING COMPANY
Q2 FINANCIAL REVIEW FISCAL 2026 08

EARNINGS PER SHARE 1 Reported and adjusted EPS of $0.50. This includes a $0.44 impact from tariff refunds. FISCAL 2026 SECOND QUARTER SUMMARY 09 NET INCOME Net income of $18.4 million compared to net income of $1.3 million in the prior year second quarter. This includes the impact of $16.3 million in tariff refunds. INVENTORY Inventory down $22.9 million or 15.5% vs. last year. NET LIQUIDITY Cash and cash equivalents of $26.8 million with net liquidity of $96.1 million. ADJUSTED EBITDA 2 Adjusted EBITDA of $27.0 million compared to $12.0 million in the prior year second quarter. This includes the impact of $16.3 million in tariff refunds. QUARTER ENDED AUGUST 2, 2026 1 See Reconciliation of net income / (loss) to adjusted net income / (loss) and adjusted net income / (loss) to adjusted EPS on slide 15 2 See Reconciliation of net income / (loss) to EBITDA and EBITDA to Adjusted EBITDA on slide 15
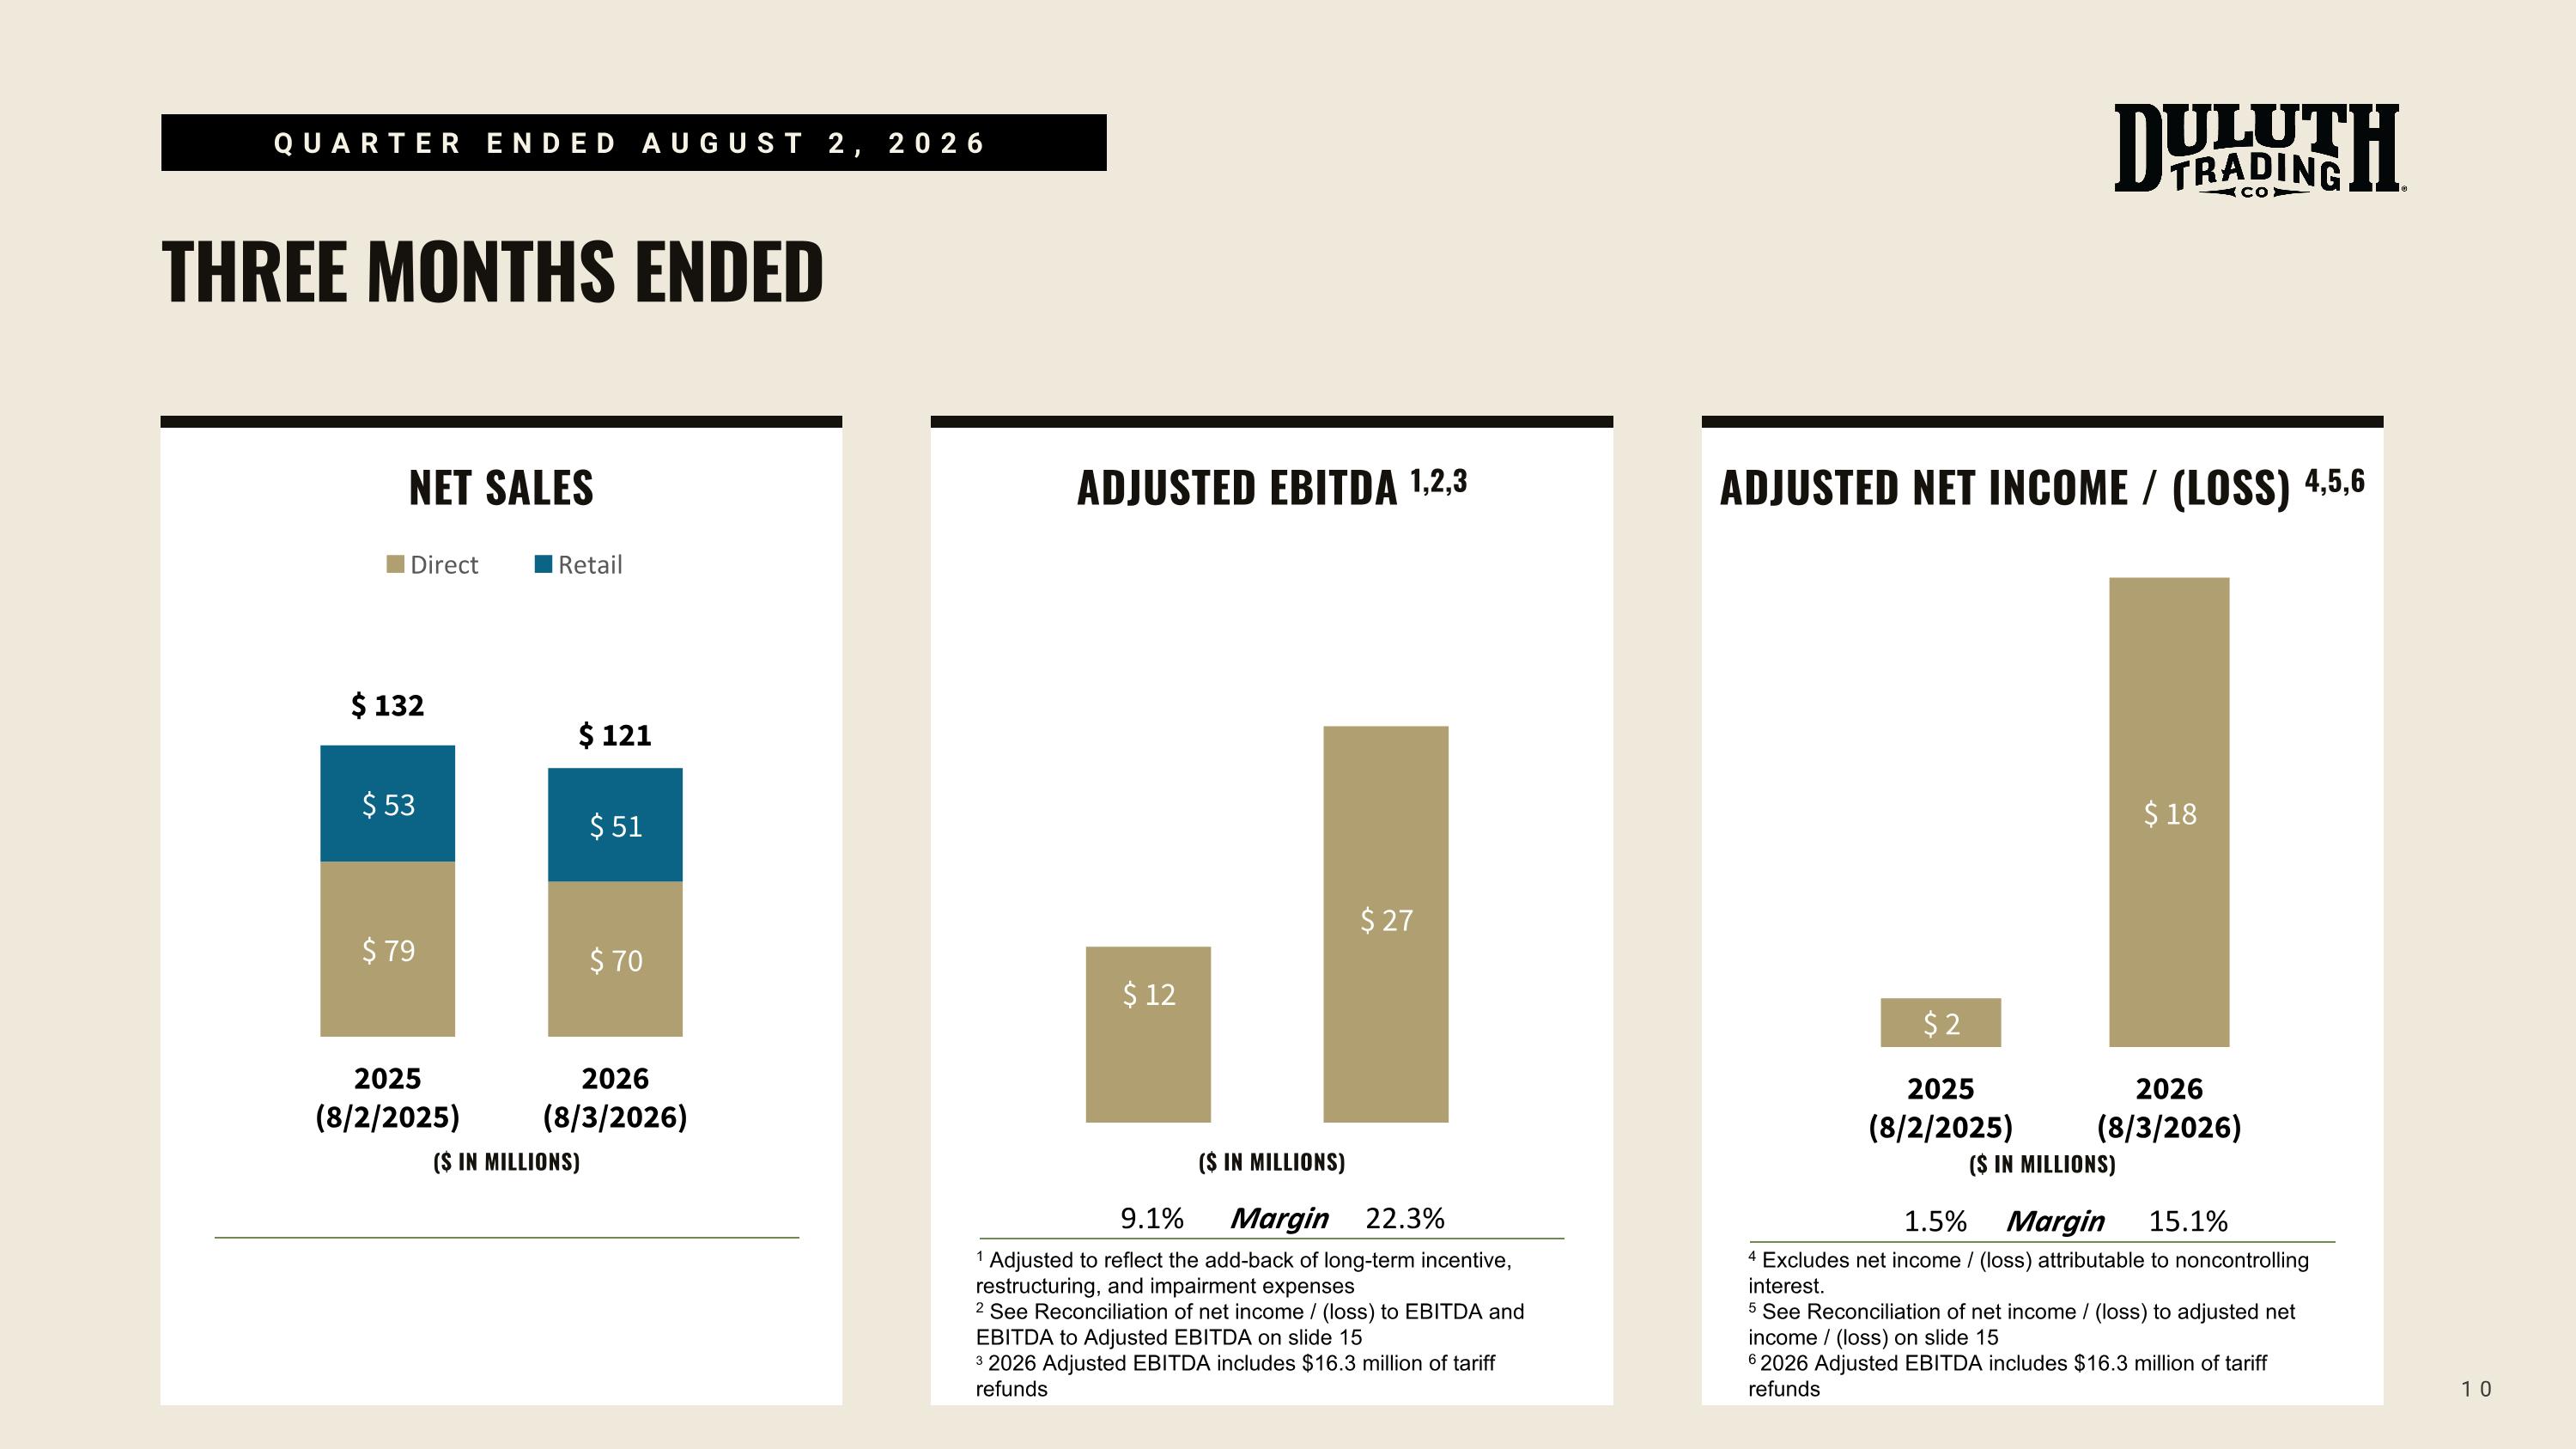
NET SALES THREE MONTHS ENDED 10 ADJUSTED EBITDA 1,2,3 1 Adjusted to reflect the add-back of long-term incentive, restructuring, and impairment expenses 2 See Reconciliation of net income / (loss) to EBITDA and EBITDA to Adjusted EBITDA on slide 15 3 2026 Adjusted EBITDA includes $16.3 million of tariff refunds ADJUSTED NET INCOME / (LOSS) 4,5,6 4 Excludes net income / (loss) attributable to noncontrolling interest. 5 See Reconciliation of net income / (loss) to adjusted net income / (loss) on slide 15 6 2026 Adjusted EBITDA includes $16.3 million of tariff refunds QUARTER ENDED AUGUST 2, 2026 ($ IN MILLIONS) ($ IN MILLIONS) ($ IN MILLIONS) 9.1% Margin 22.3% 1.5% Margin 15.1%
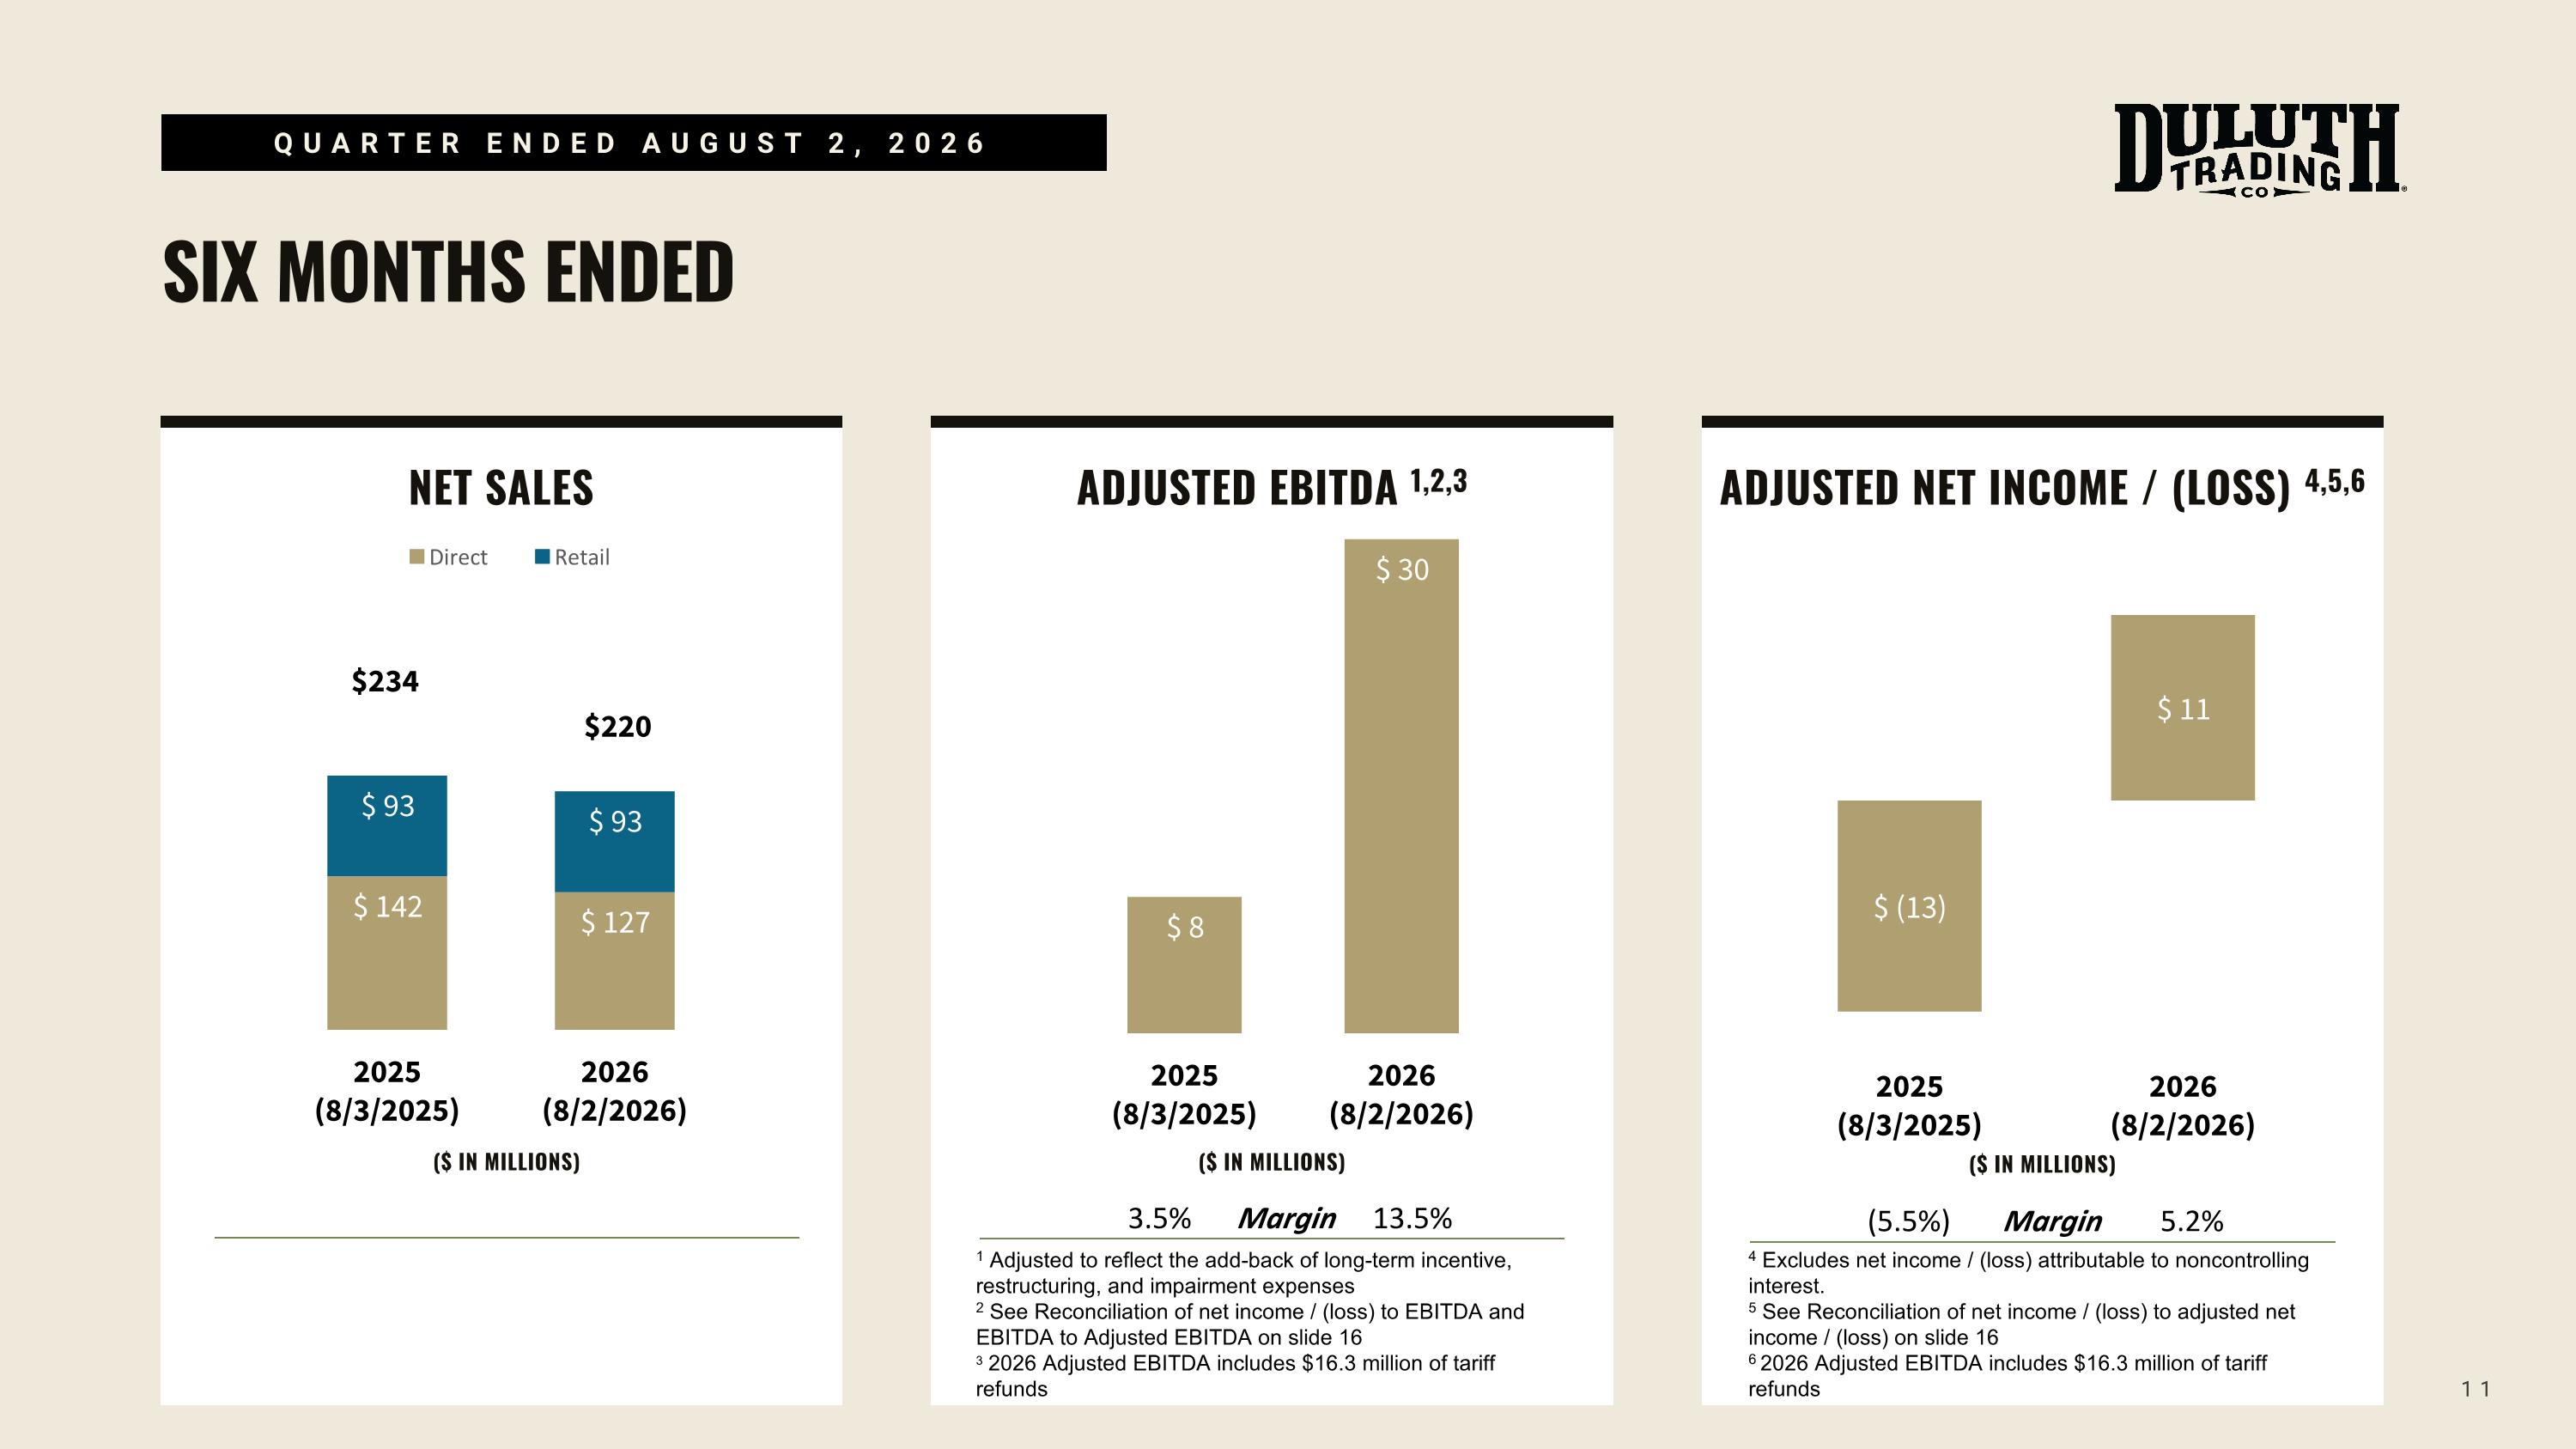
NET SALES SIX MONTHS ENDED 11 ADJUSTED EBITDA 1,2,3 ADJUSTED NET INCOME / (LOSS) 4,5,6 QUARTER ENDED AUGUST 2, 2026 ($ IN MILLIONS) ($ IN MILLIONS) ($ IN MILLIONS) 3.5% Margin 13.5% (5.5%) Margin 5.2% 1 Adjusted to reflect the add-back of long-term incentive, restructuring, and impairment expenses 2 See Reconciliation of net income / (loss) to EBITDA and EBITDA to Adjusted EBITDA on slide 16 3 2026 Adjusted EBITDA includes $16.3 million of tariff refunds 4 Excludes net income / (loss) attributable to noncontrolling interest. 5 See Reconciliation of net income / (loss) to adjusted net income / (loss) on slide 16 6 2026 Adjusted EBITDA includes $16.3 million of tariff refunds
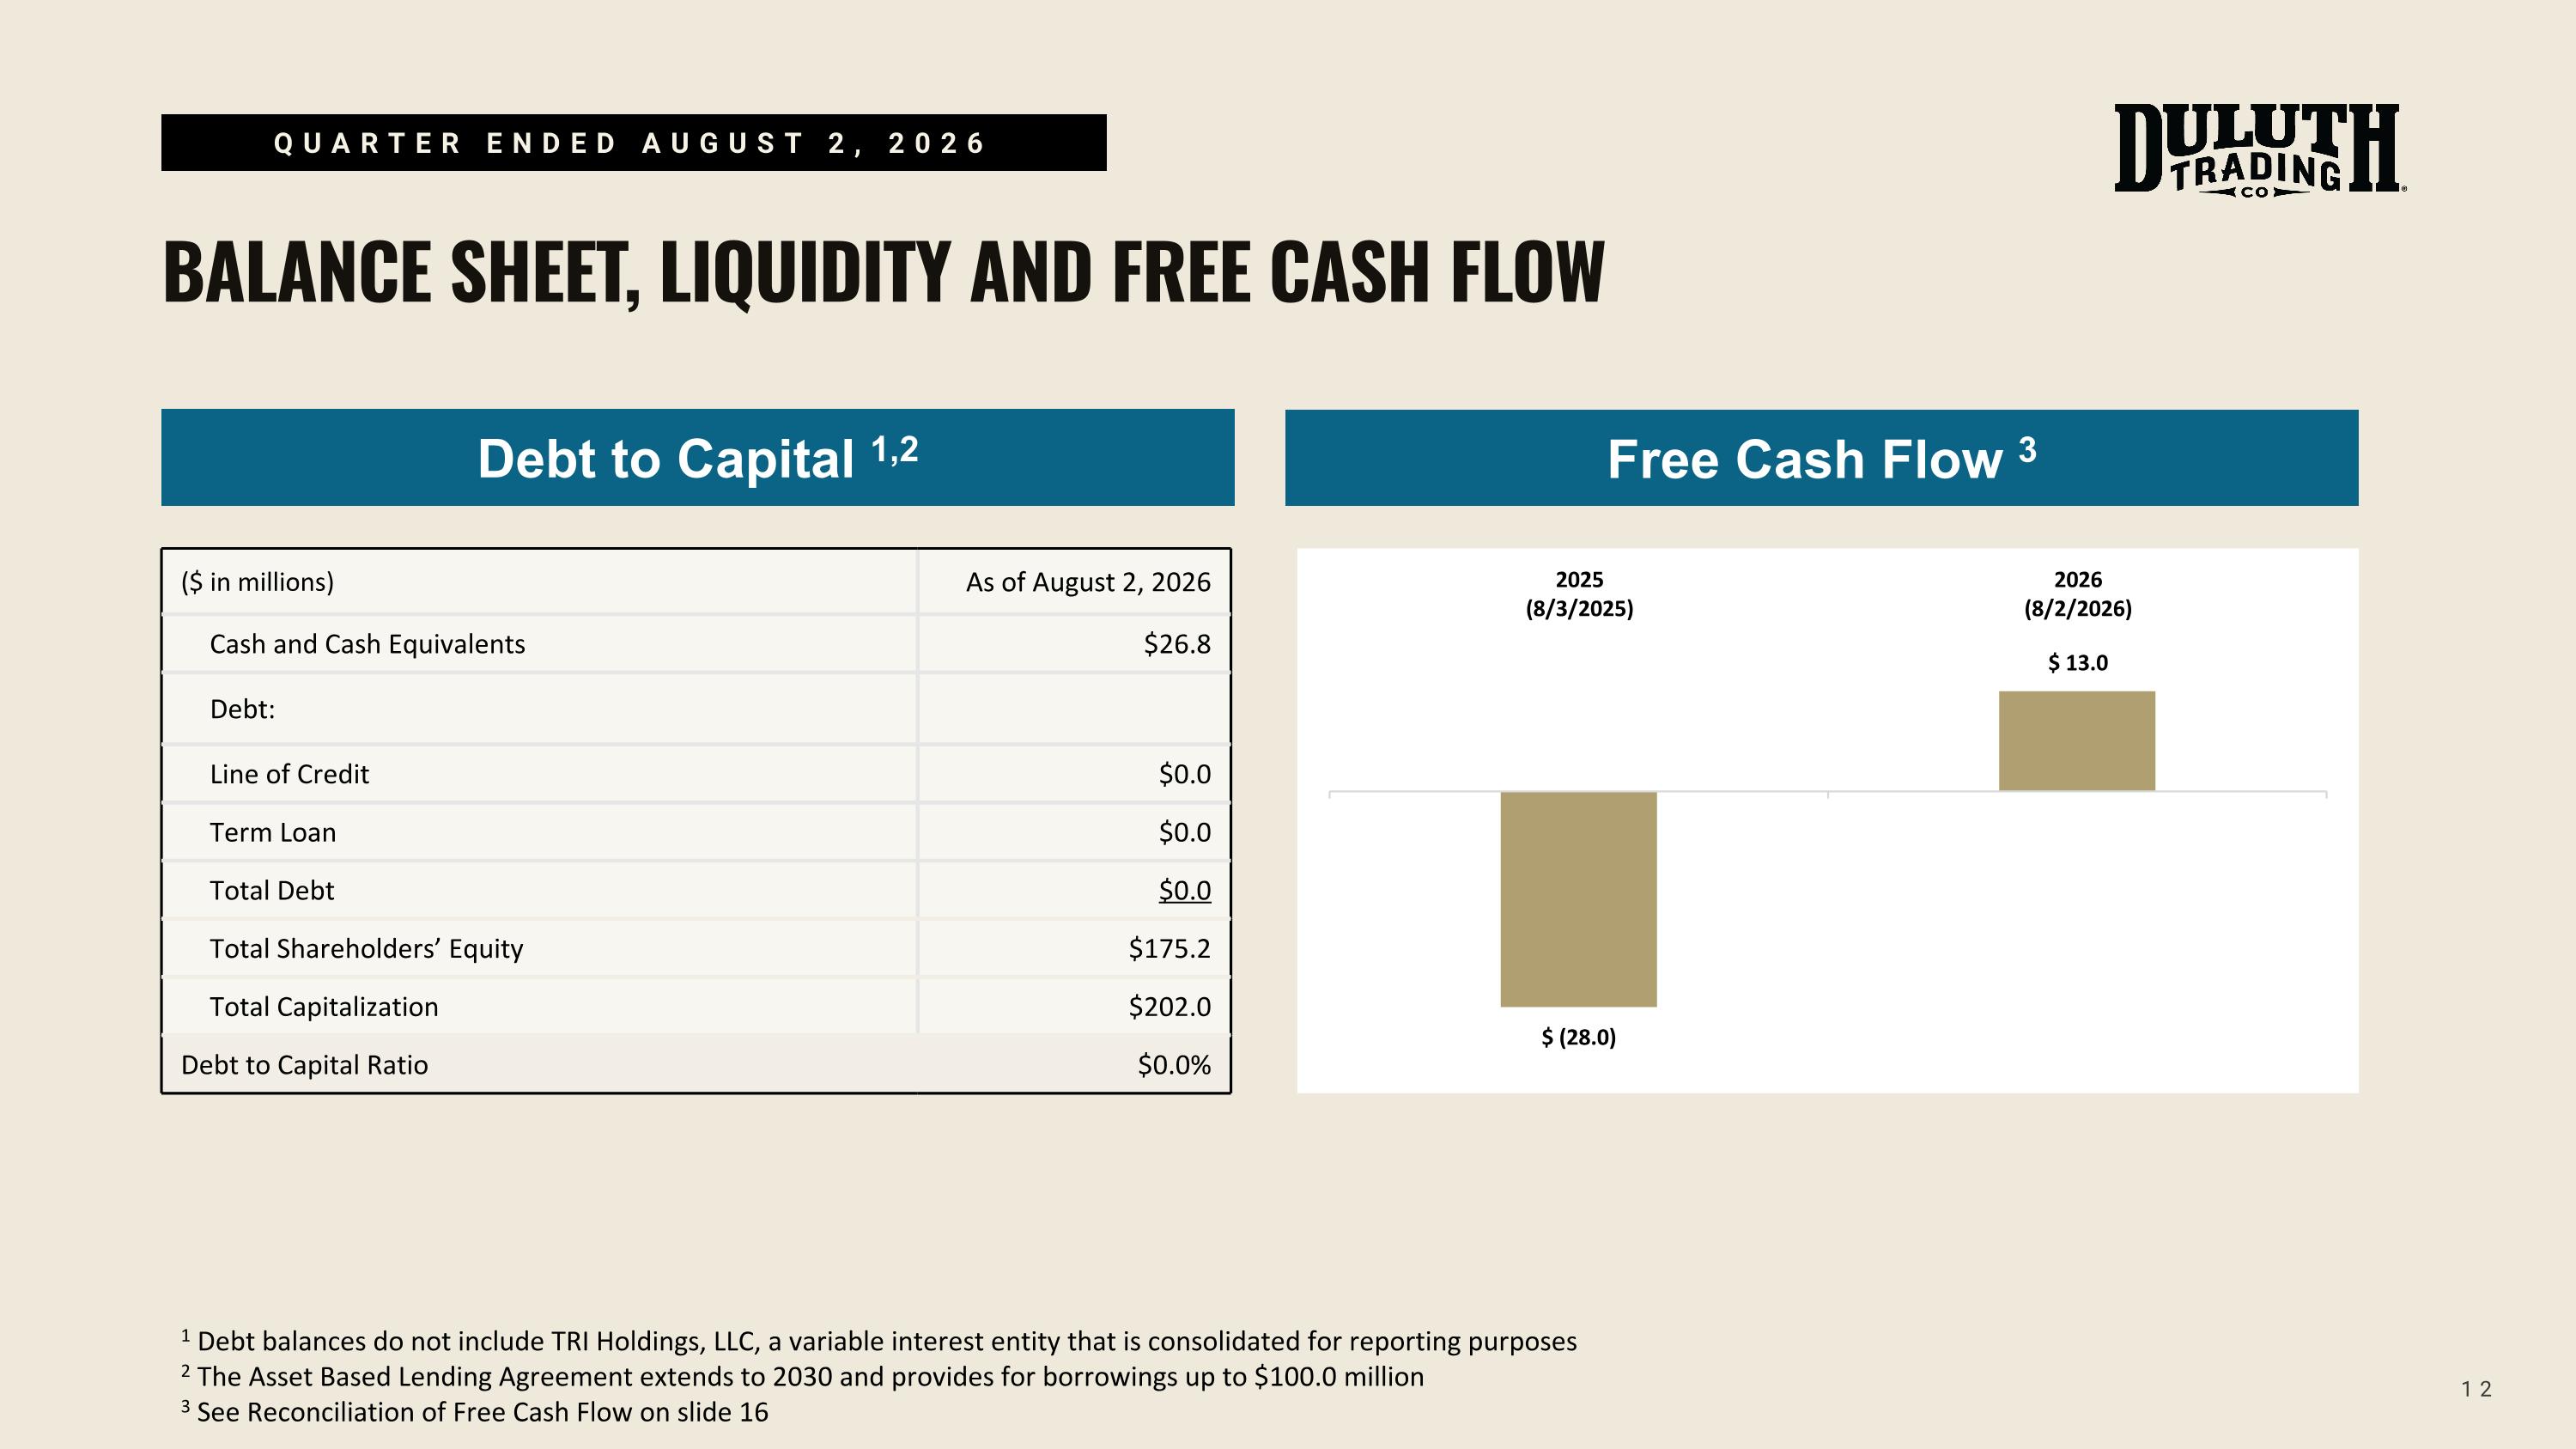
12 QUARTER ENDED AUGUST 2, 2026 BALANCE SHEET, LIQUIDITY AND FREE CASH FLOW Debt to Capital 1,2 ($ in millions) As of August 2, 2026 Cash and Cash Equivalents $26.8 Debt: Line of Credit $0.0 Term Loan $0.0 Total Debt $0.0 Total Shareholders’ Equity $175.2 Total Capitalization $202.0 Debt to Capital Ratio $0.0% Free Cash Flow 3 1 Debt balances do not include TRI Holdings, LLC, a variable interest entity that is consolidated for reporting purposes 2 The Asset Based Lending Agreement extends to 2030 and provides for borrowings up to $100.0 million 3 See Reconciliation of Free Cash Flow on slide 16
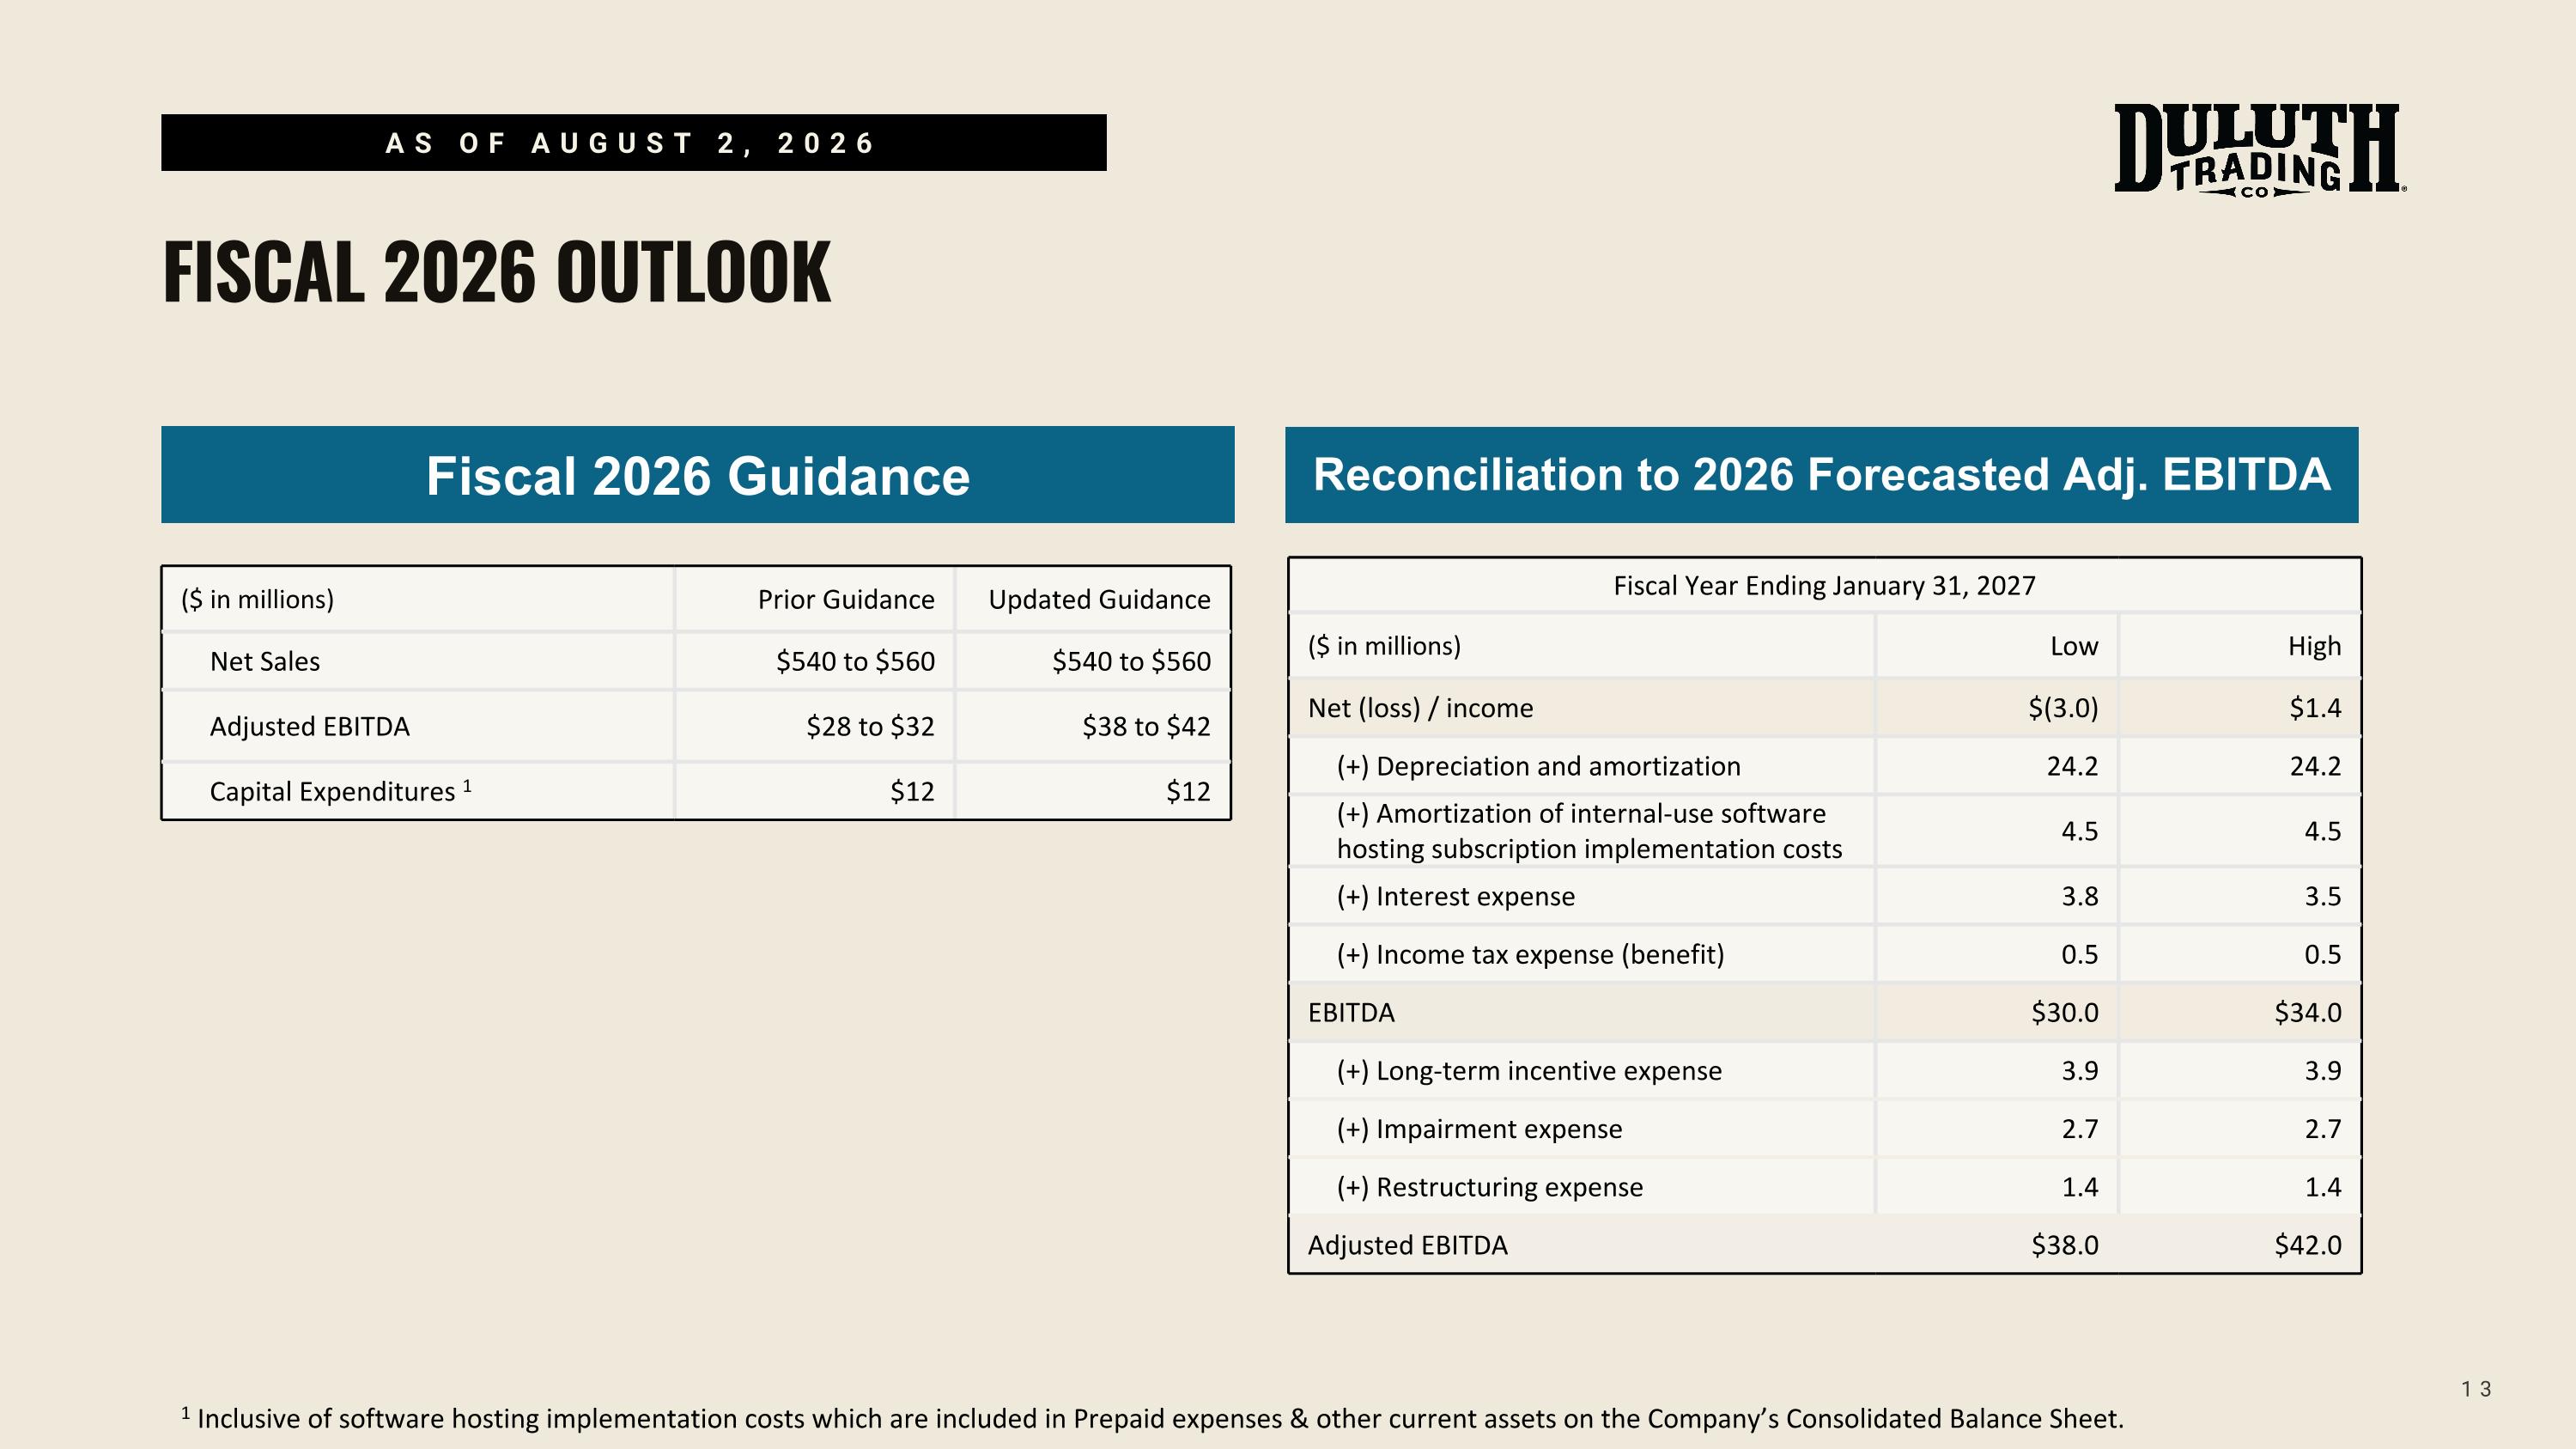
13 AS OF AUGUST 2, 2026 FISCAL 2026 OUTLOOK Fiscal 2026 Guidance Reconciliation to 2026 Forecasted Adj. EBITDA 1 Inclusive of software hosting implementation costs which are included in Prepaid expenses & other current assets on the Company’s Consolidated Balance Sheet. Fiscal Year Ending January 31, 2027 ($ in millions) Low High Net (loss) / income $(3.0) $1.4 (+) Depreciation and amortization 24.2 24.2 (+) Amortization of internal-use software hosting subscription implementation costs 4.5 4.5 (+) Interest expense 3.8 3.5 (+) Income tax expense (benefit) 0.5 0.5 EBITDA $30.0 $34.0 (+) Long-term incentive expense 3.9 3.9 (+) Impairment expense 2.7 2.7 (+) Restructuring expense 1.4 1.4 Adjusted EBITDA $38.0 $42.0 ($ in millions) Prior Guidance Updated Guidance Net Sales $540 to $560 $540 to $560 Adjusted EBITDA $28 to $32 $38 to $42 Capital Expenditures 1 $12 $12

THANK YOU
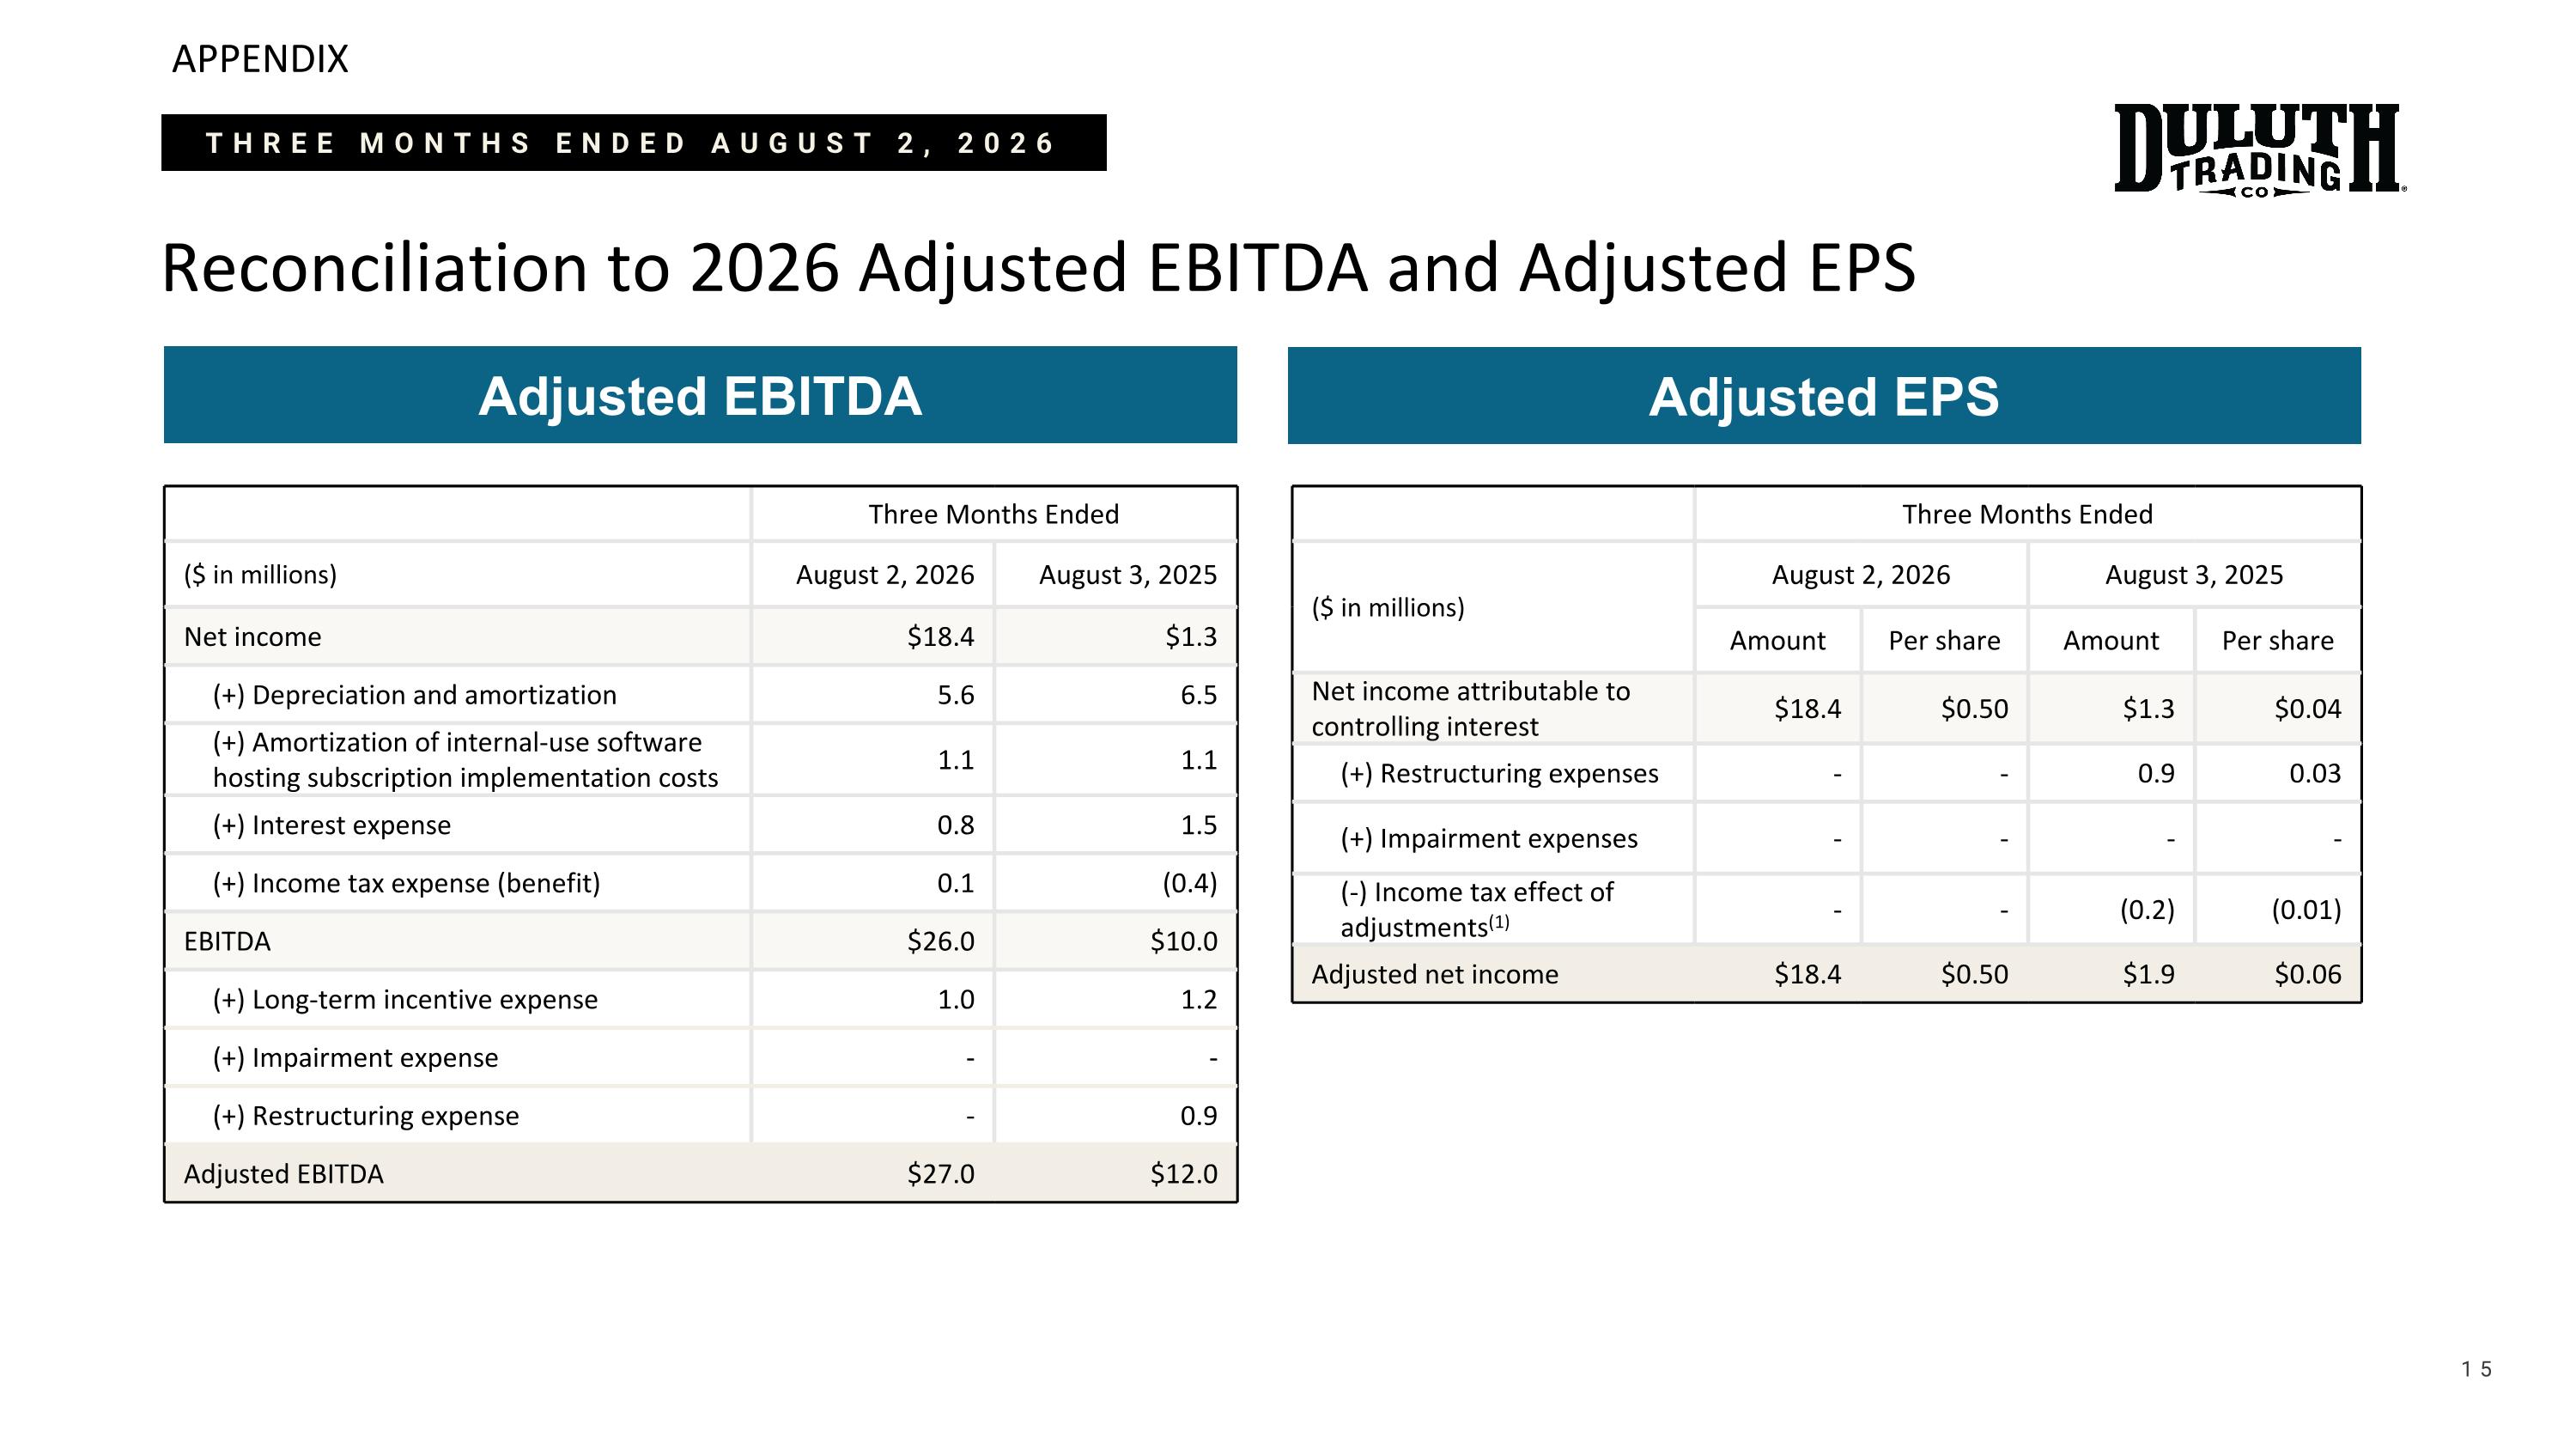
APPENDIX Reconciliation to 2026 Adjusted EBITDA and Adjusted EPS 15 Adjusted EBITDA Three Months Ended ($ in millions) August 2, 2026 August 3, 2025 Net income $18.4 $1.3 (+) Depreciation and amortization 5.6 6.5 (+) Amortization of internal-use software hosting subscription implementation costs 1.1 1.1 (+) Interest expense 0.8 1.5 (+) Income tax expense (benefit) 0.1 (0.4) EBITDA $26.0 $10.0 (+) Long-term incentive expense 1.0 1.2 (+) Impairment expense - - (+) Restructuring expense - 0.9 Adjusted EBITDA $27.0 $12.0 Adjusted EPS Three Months Ended ($ in millions) August 2, 2026 August 3, 2025 Amount Per share Amount Per share Net income attributable to controlling interest $18.4 $0.50 $1.3 $0.04 (+) Restructuring expenses - - 0.9 0.03 (+) Impairment expenses - - - - (-) Income tax effect of adjustments(1) - - (0.2) (0.01) Adjusted net income $18.4 $0.50 $1.9 $0.06 THREE MONTHS ENDED AUGUST 2, 2026
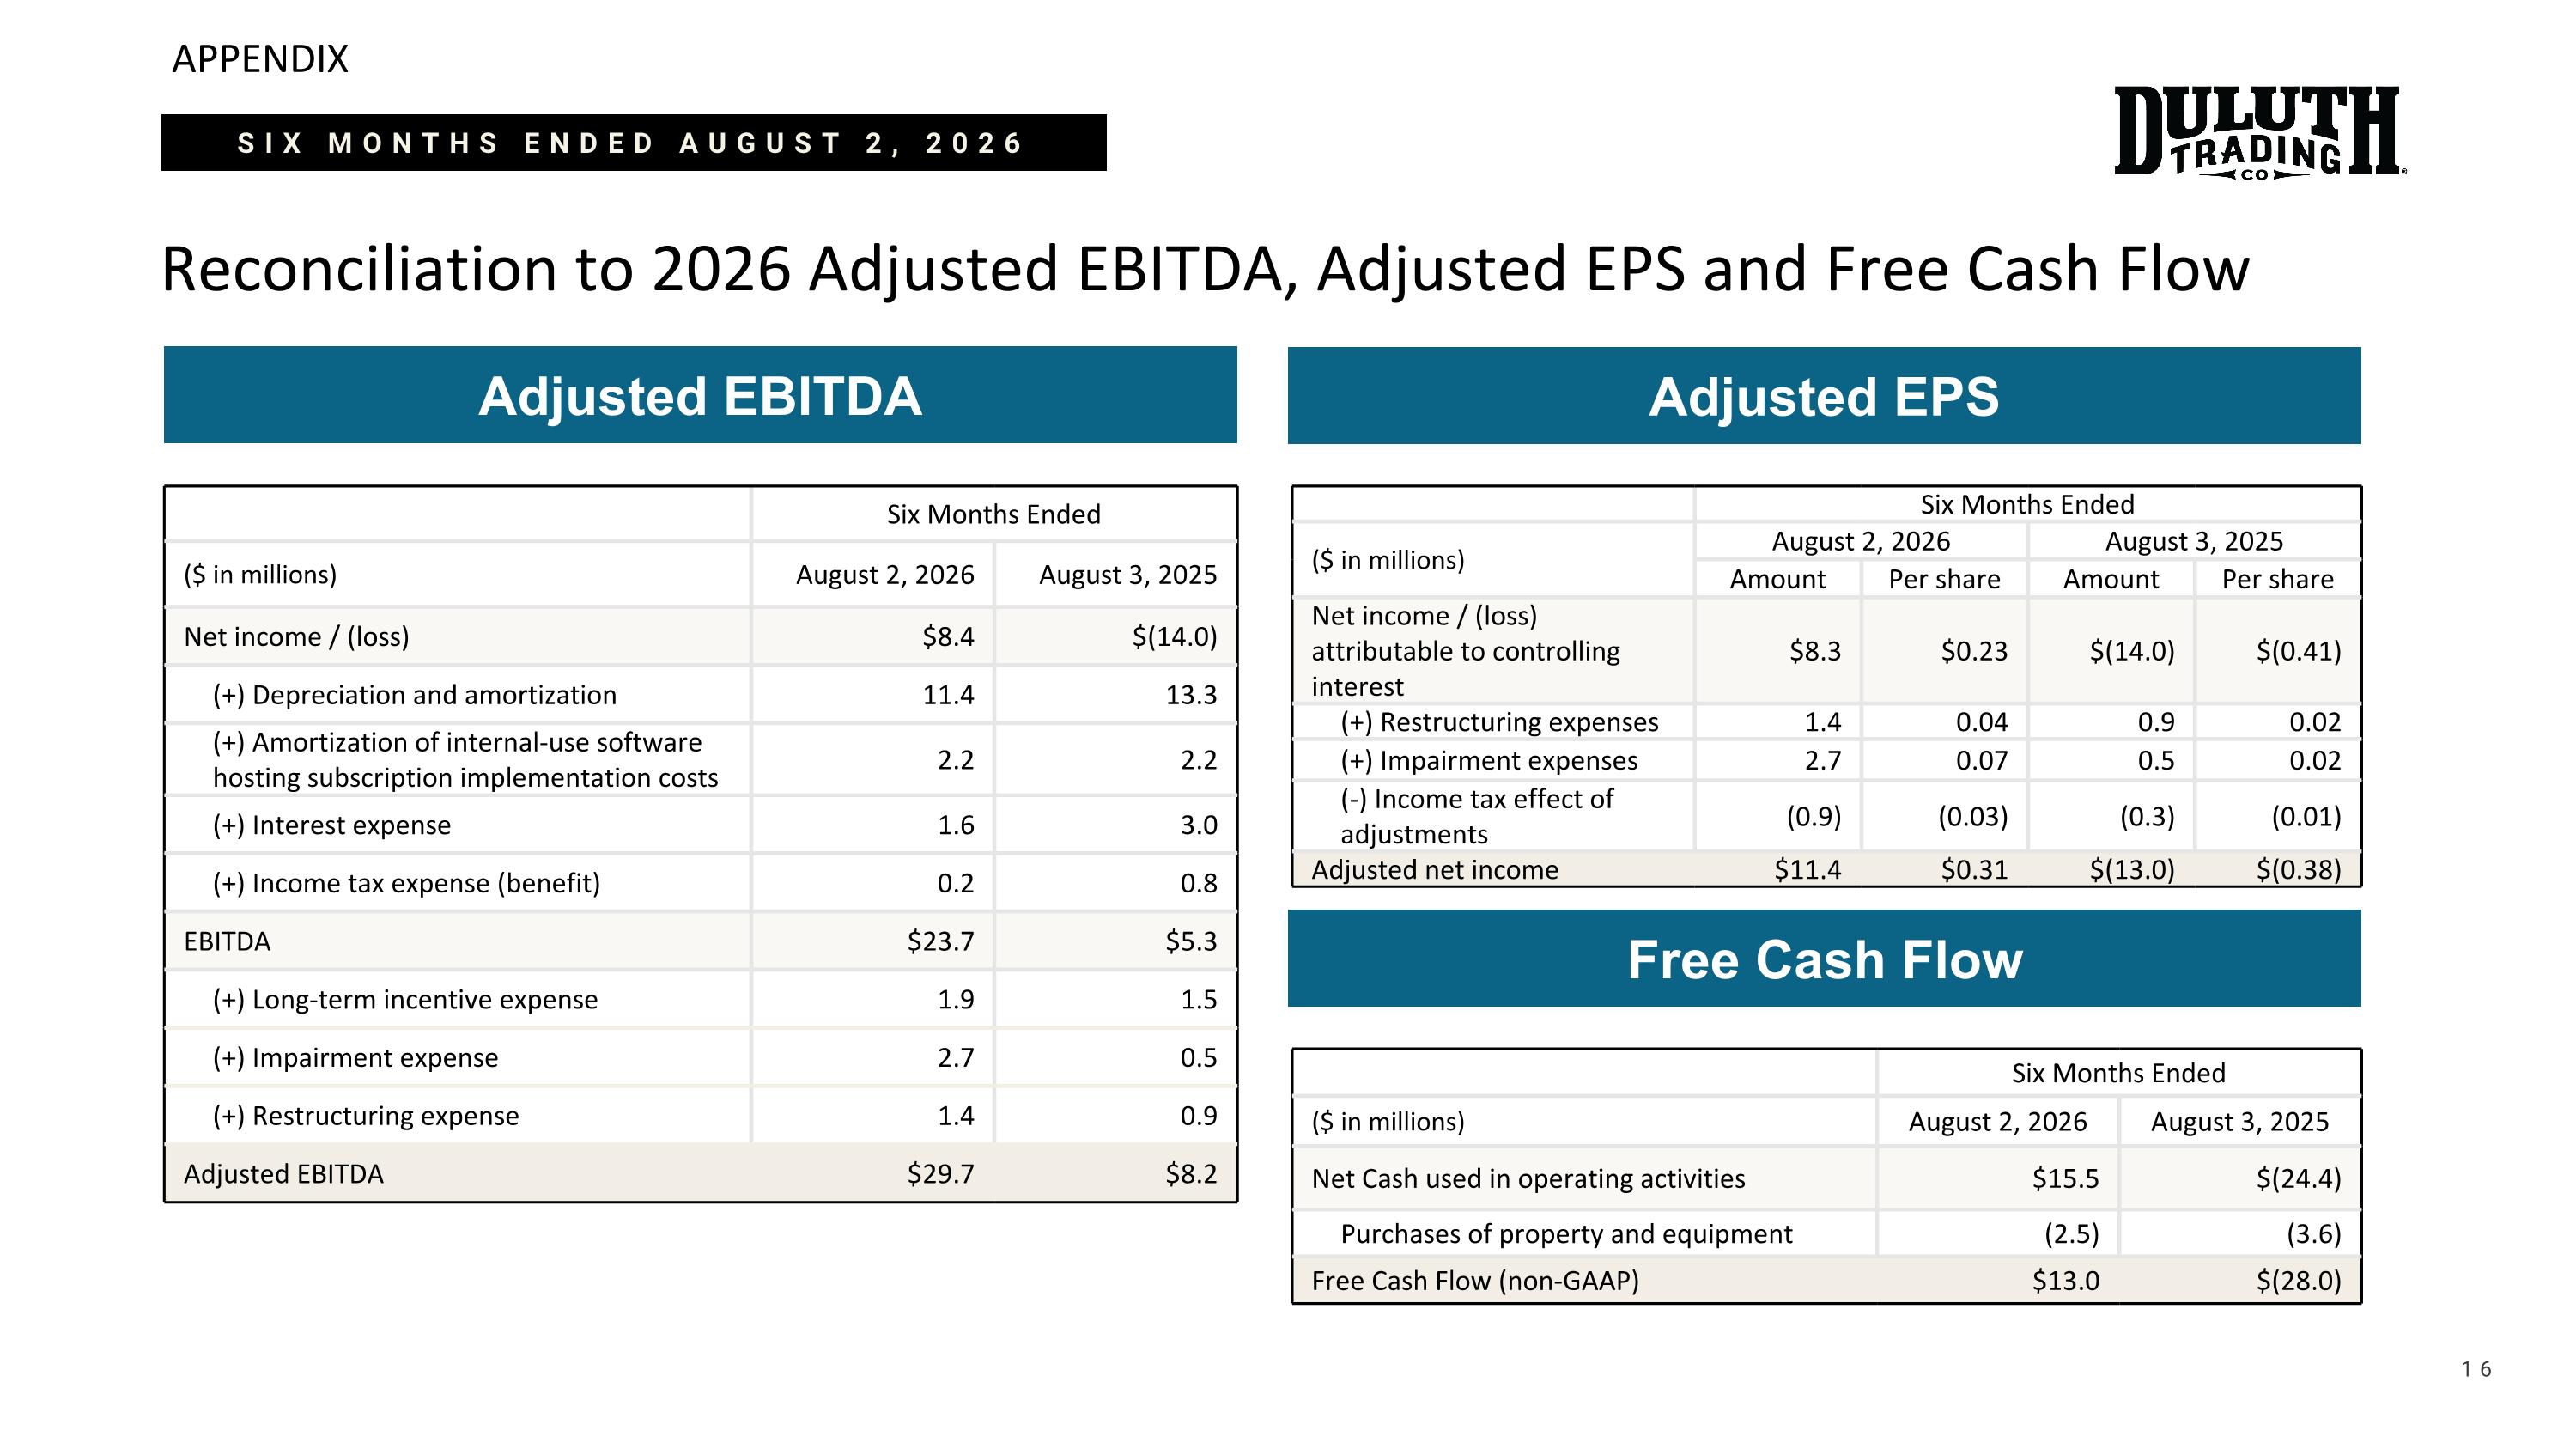
APPENDIX Reconciliation to 2026 Adjusted EBITDA, Adjusted EPS and Free Cash Flow 16 Adjusted EBITDA Six Months Ended ($ in millions) August 2, 2026 August 3, 2025 Net income / (loss) $8.4 $(14.0) (+) Depreciation and amortization 11.4 13.3 (+) Amortization of internal-use software hosting subscription implementation costs 2.2 2.2 (+) Interest expense 1.6 3.0 (+) Income tax expense (benefit) 0.2 0.8 EBITDA $23.7 $5.3 (+) Long-term incentive expense 1.9 1.5 (+) Impairment expense 2.7 0.5 (+) Restructuring expense 1.4 0.9 Adjusted EBITDA $29.7 $8.2 Adjusted EPS Six Months Ended ($ in millions) August 2, 2026 August 3, 2025 Amount Per share Amount Per share Net income / (loss) attributable to controlling interest $8.3 $0.23 $(14.0) $(0.41) (+) Restructuring expenses 1.4 0.04 0.9 0.02 (+) Impairment expenses 2.7 0.07 0.5 0.02 (-) Income tax effect of adjustments (0.9) (0.03) (0.3) (0.01) Adjusted net income $11.4 $0.31 $(13.0) $(0.38) SIX MONTHS ENDED AUGUST 2, 2026 Free Cash Flow Six Months Ended ($ in millions) August 2, 2026 August 3, 2025 Net Cash used in operating activities $15.5 $(24.4) Purchases of property and equipment (2.5) (3.6) Free Cash Flow (non-GAAP) $13.0 $(28.0)