What were the Fund costs for the past year?
(based on a hypothetical $10,000 investment)
|
Fund Name
|
Costs of a $10,000 investment
|
Costs paid as a percentage of a $10,000 investment
|
|---|---|---|
|
Blueprint Chesapeake Multi-Asset Trend ETF
|
$294
|
2.48%*
|
| * | Costs paid as a percentage of a $10,000 investment is an annualized figure. |
How did the Fund perform last year and what affected its performance?
For the period July 1, 2025 – June 30, 2026
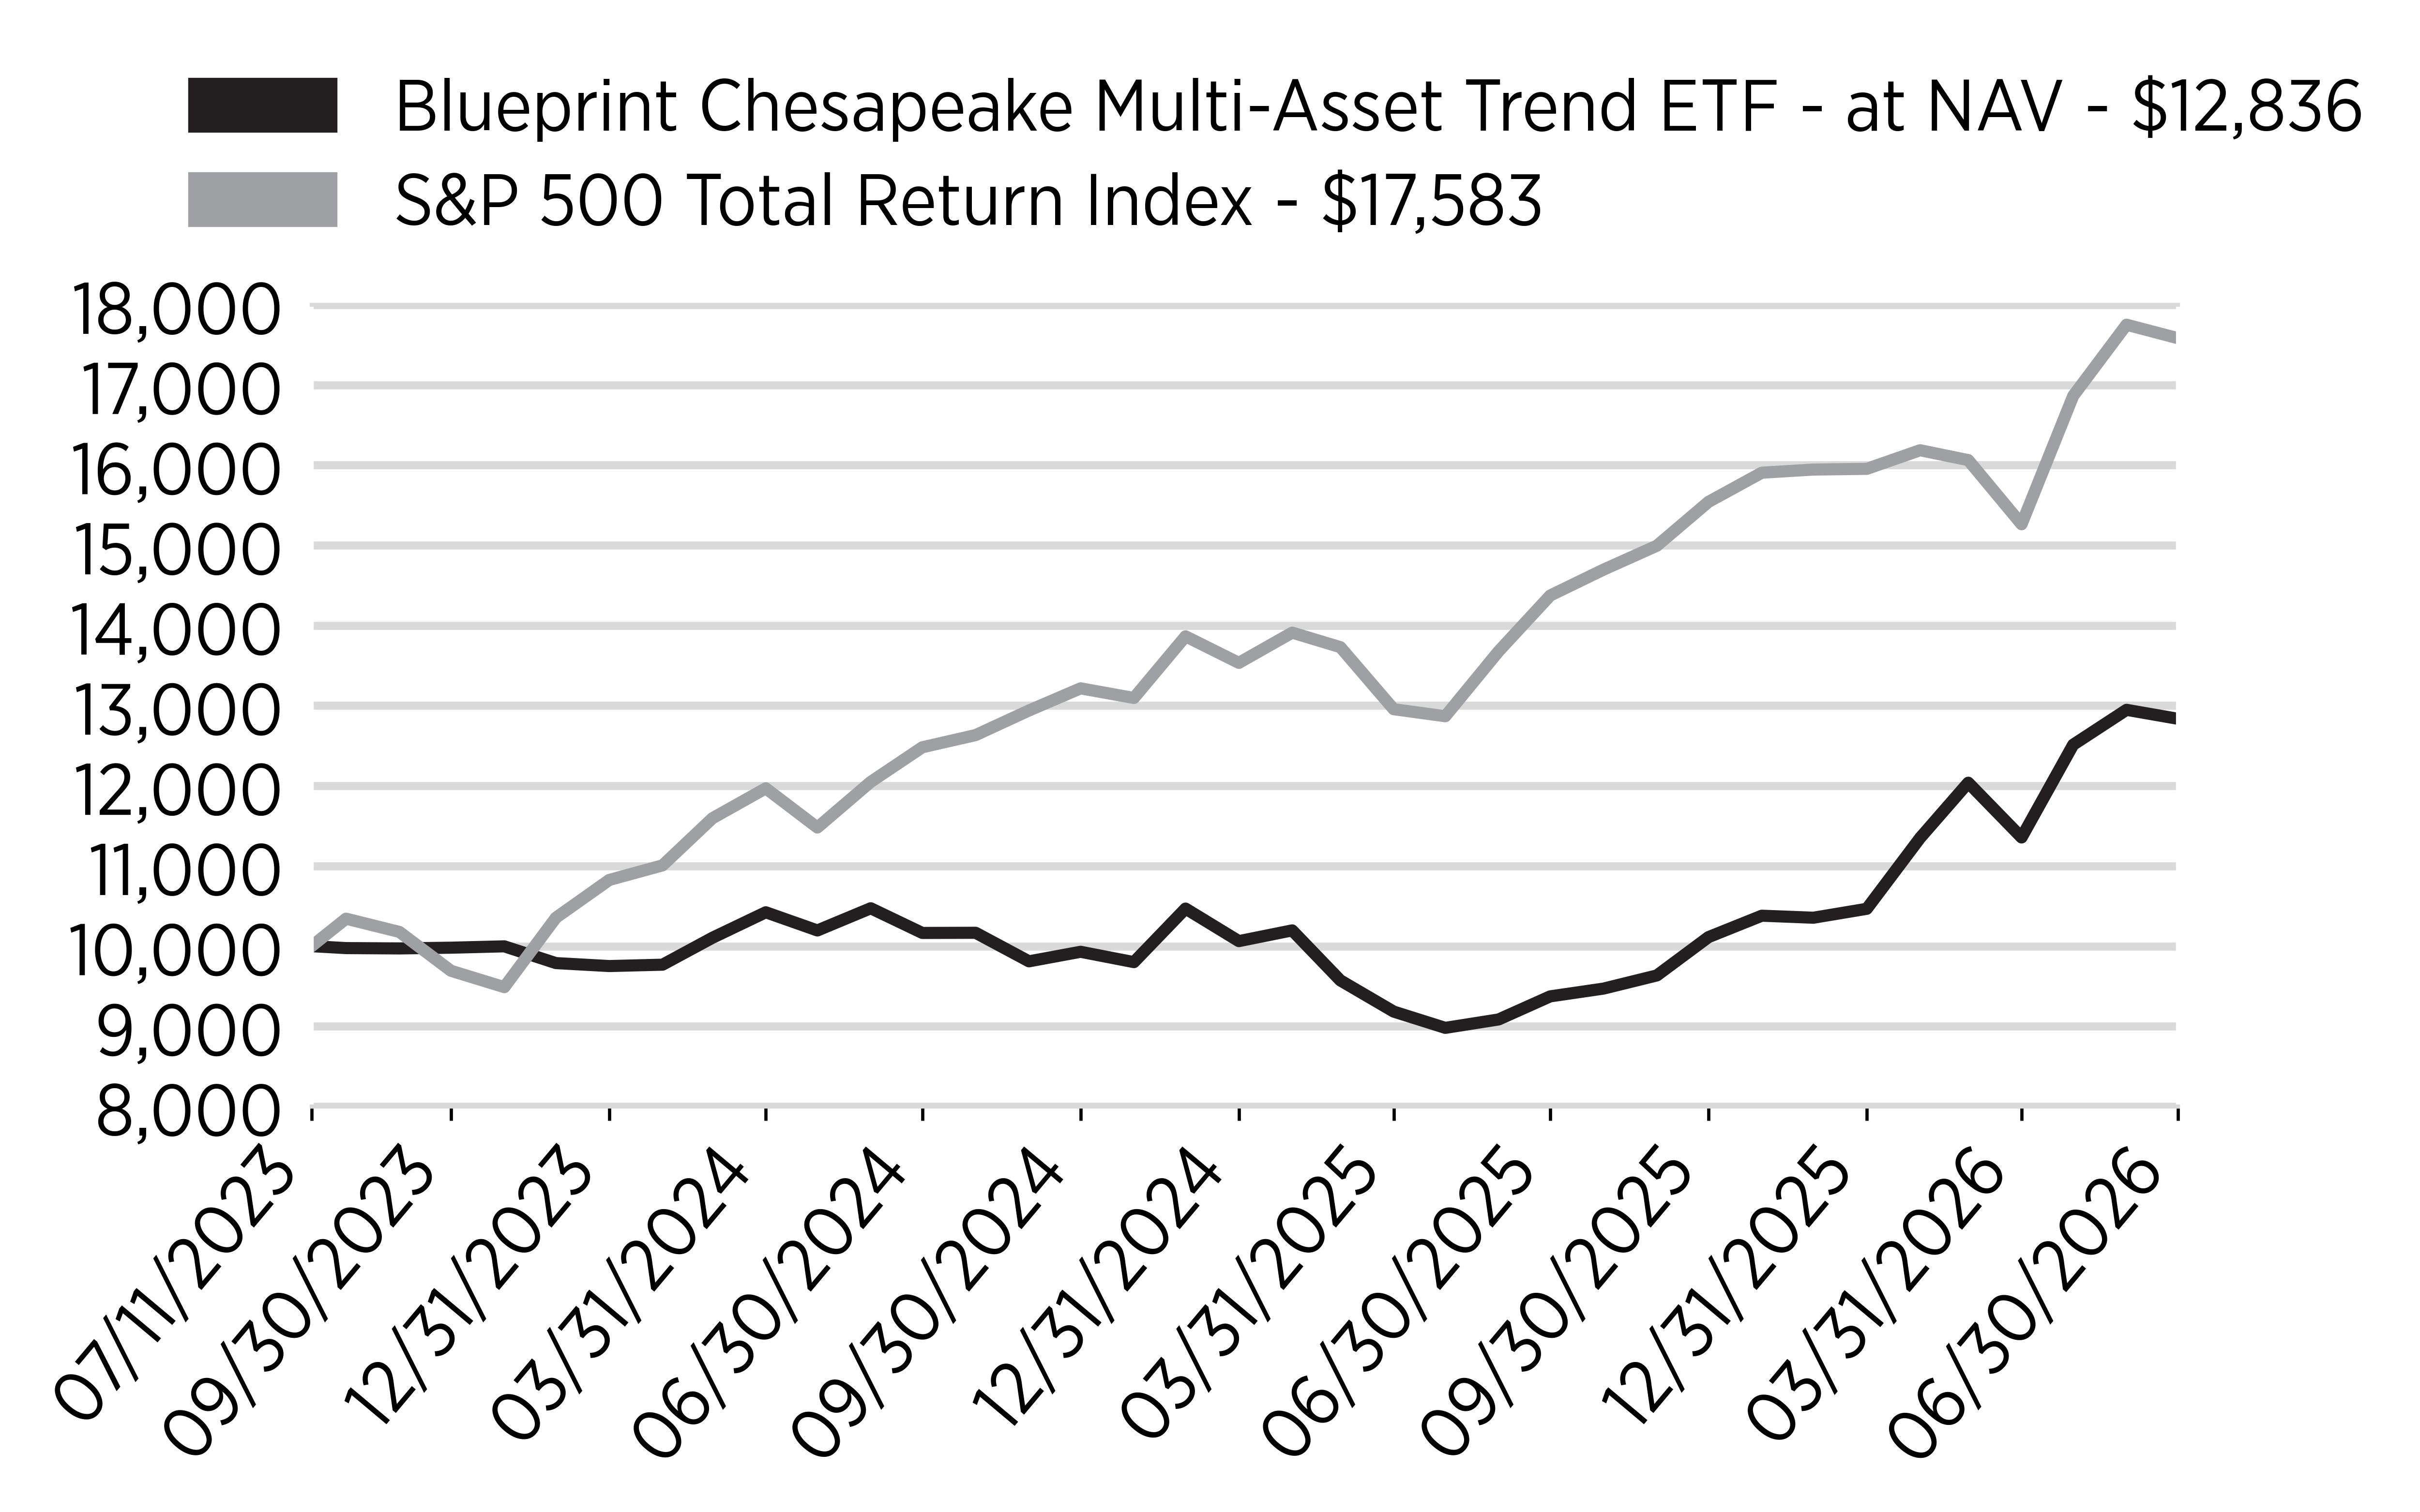
During the 12-month reporting period, the TFPN Fund returned 36.89% (NAV) and 37.33% (market price).
The Fund began the fiscal year with strong gains—benefiting from long positions in select commodities and trend-driven single equities. Trend signals remained persistent throughout the year contributing to a strong year of performance.
TFPN maintained its systematic approach throughout, adjusting exposures based on the strength and direction of price trends across asset classes. The strategy does not rely on predictions or discretionary decisions, instead following a rules-based process to identify opportunities and manage risk.
Performance Drivers
- Currencies: Net exposure to foreign currencies increased through the year as central bank paths diverged. Long positions in the Australian Dollar against the New Zealand Dollar and Canadian Dollar contributed early, and short Euro crosses against the Hungarian Forint and South African Rand led later in the period. Long emerging market exposure in the Colombian Peso and Brazilian Real also added.
- Commodities: Commodity results were mixed and roughly flat for the year. Metals led early, with gold becoming the Fund's largest single commodity holding by September and long exposure building in copper and silver. Energy took over later, as long positions in gas oil, heating oil, and Brent crude benefited from sustained trends. Precious metals and grains gave back much of the earlier gain as those trends reversed.
- Fixed Income: Fixed income remained the Fund's largest allocation by weight and contributed meaningfully early in the year, anchored by long short-duration positions in instruments such as STIP and SUB. The portfolio later moved short across the curve in both domestic and foreign bonds. Short-term interest rate futures and European sovereign shorts detracted as rate expectations shifted.
- Equities: Single stocks were the largest driver of the year's return, with the sleeve ending the period roughly four to one net long. Persistent longs in Strategy Inc., AZZ Inc., and Carpenter Technology contributed throughout. Semiconductors and semiconductor equipment led in the second half, including Western Digital, Micron Technology, and Lam Research, while long positions in Bloom Energy and Kodiak Gas Services also added.
Positioning as of June 30, 2026
At period-end, TFPN held:
- Long positions in energy, metals and mixed positioning in softs and livestock commodities
- Net long foreign currency exposure, long emerging market currencies and short the Euro and the Sterling
- Short positions across the curve in domestic and foreign bonds
- Net long single-stock positions (~4:1)
While the year included periods of disruption, the Fund remained consistent in applying its systematic process—reducing risk when trends weakened and scaling back in when trend strength improved. TFPN’s diversified, rules-based framework is designed to participate in sustained market trends while actively managing downside risk.
Cumulative Performance
Annual Performance
|
Average Annual Returns for the
Periods Ended June 30, 2026:
|
1 Year
|
Since Inception
(7/11/23)
|
|---|---|---|
|
Blueprint Chesapeake Multi-Asset
Trend ETF - at NAV
|
36.89%
|
8.76%
|
|
S&P 500 Total Return Index
|
22.32%
|
20.91%
|
Key Fund Statistics
(as of June 30, 2026)
|
Fund Size (Thousands)
|
$169,983
|
|
Number of Holdings
|
433
|
|
Total Advisory Fee Paid
|
$1,333,039
|
|
Portfolio Turnover Rate
|
66%
|
What did the Fund invest in?
(as of June 30, 2026)
Sector/Security Type - Investments (% of net assets)
(Excludes securities sold short and other financial instruments)
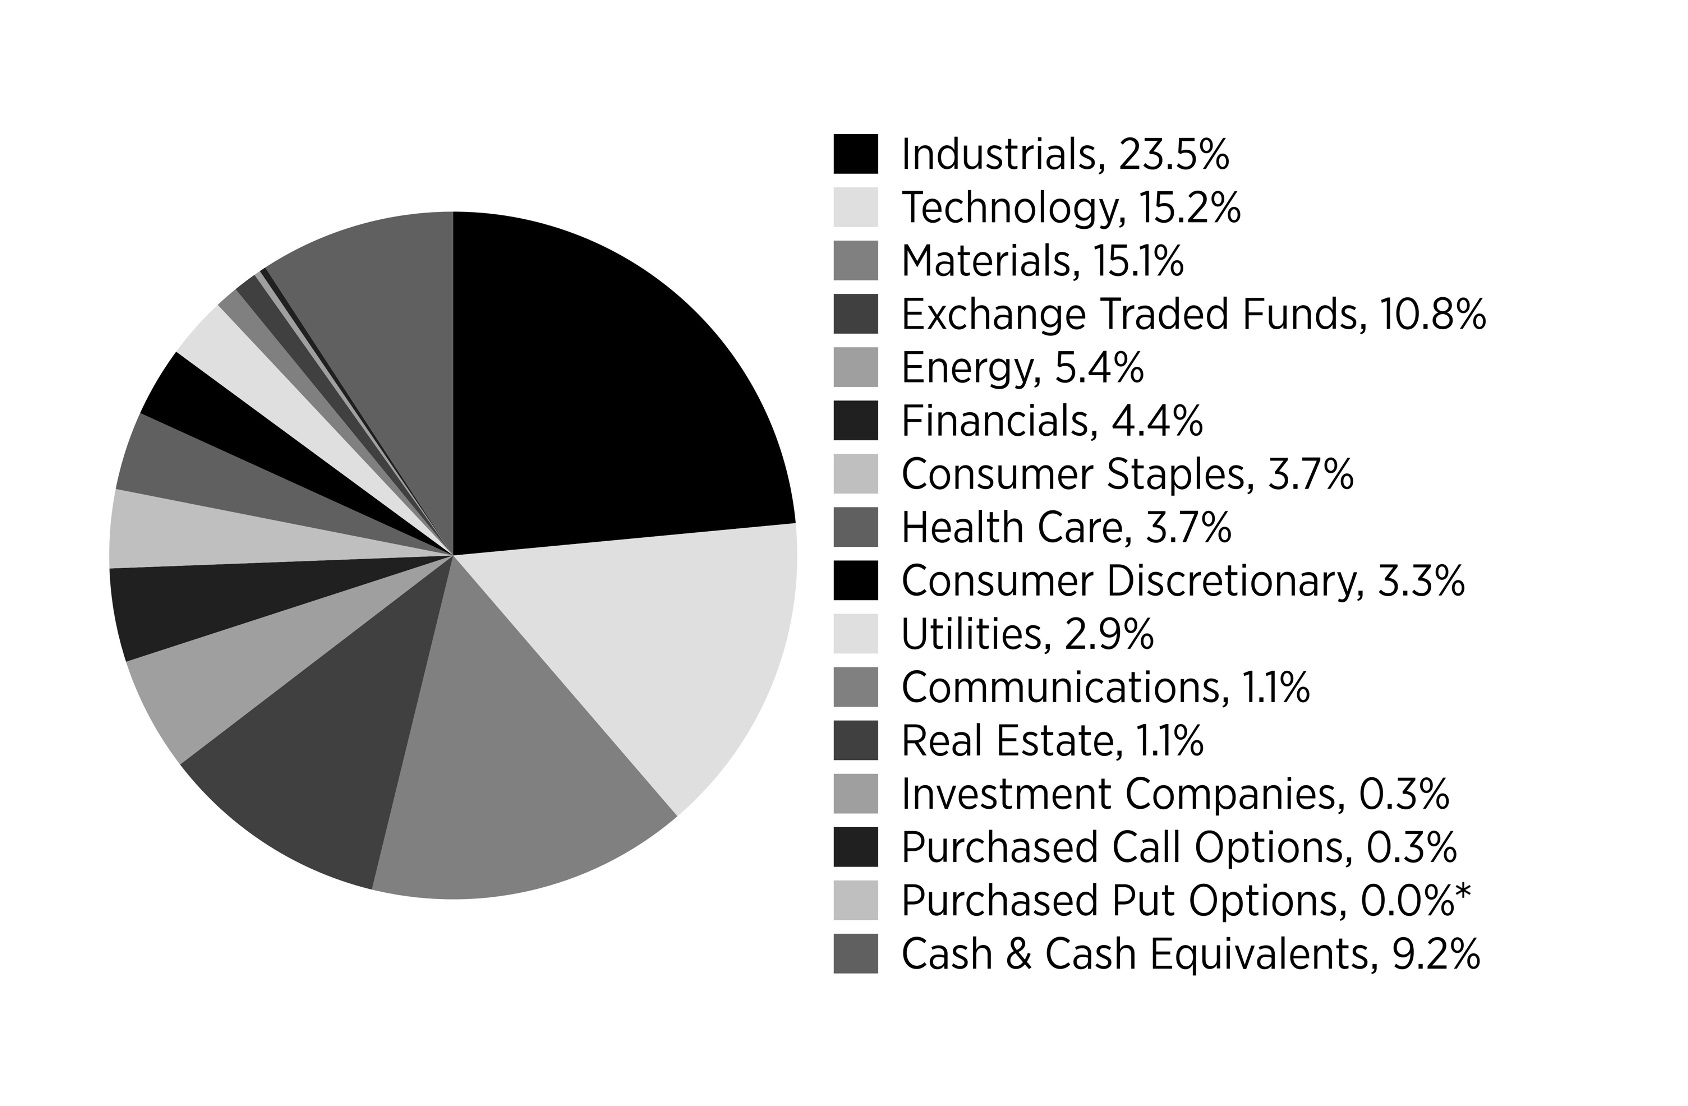
| * | Less than 0.05% of net assets. |
|
Top Holdings
|
(% of Total Net Assets)
|
|---|---|
|
First American Government
Obligations Fund - Class X, 3.57%
|
|
|
Western Digital Corp.
|
|
|
Lumentum Holdings, Inc.
|
|
|
iShares National Muni Bond ETF
|
|
|
Micron Technology, Inc.
|
|
|
iShares TIPS Bond ETF
|
|
|
Bloom Energy Corp. - Class A
|
|
|
Carpenter Technology Corp.
|
|
|
AZZ, Inc.
|
|
|
Lam Research Corp.
|
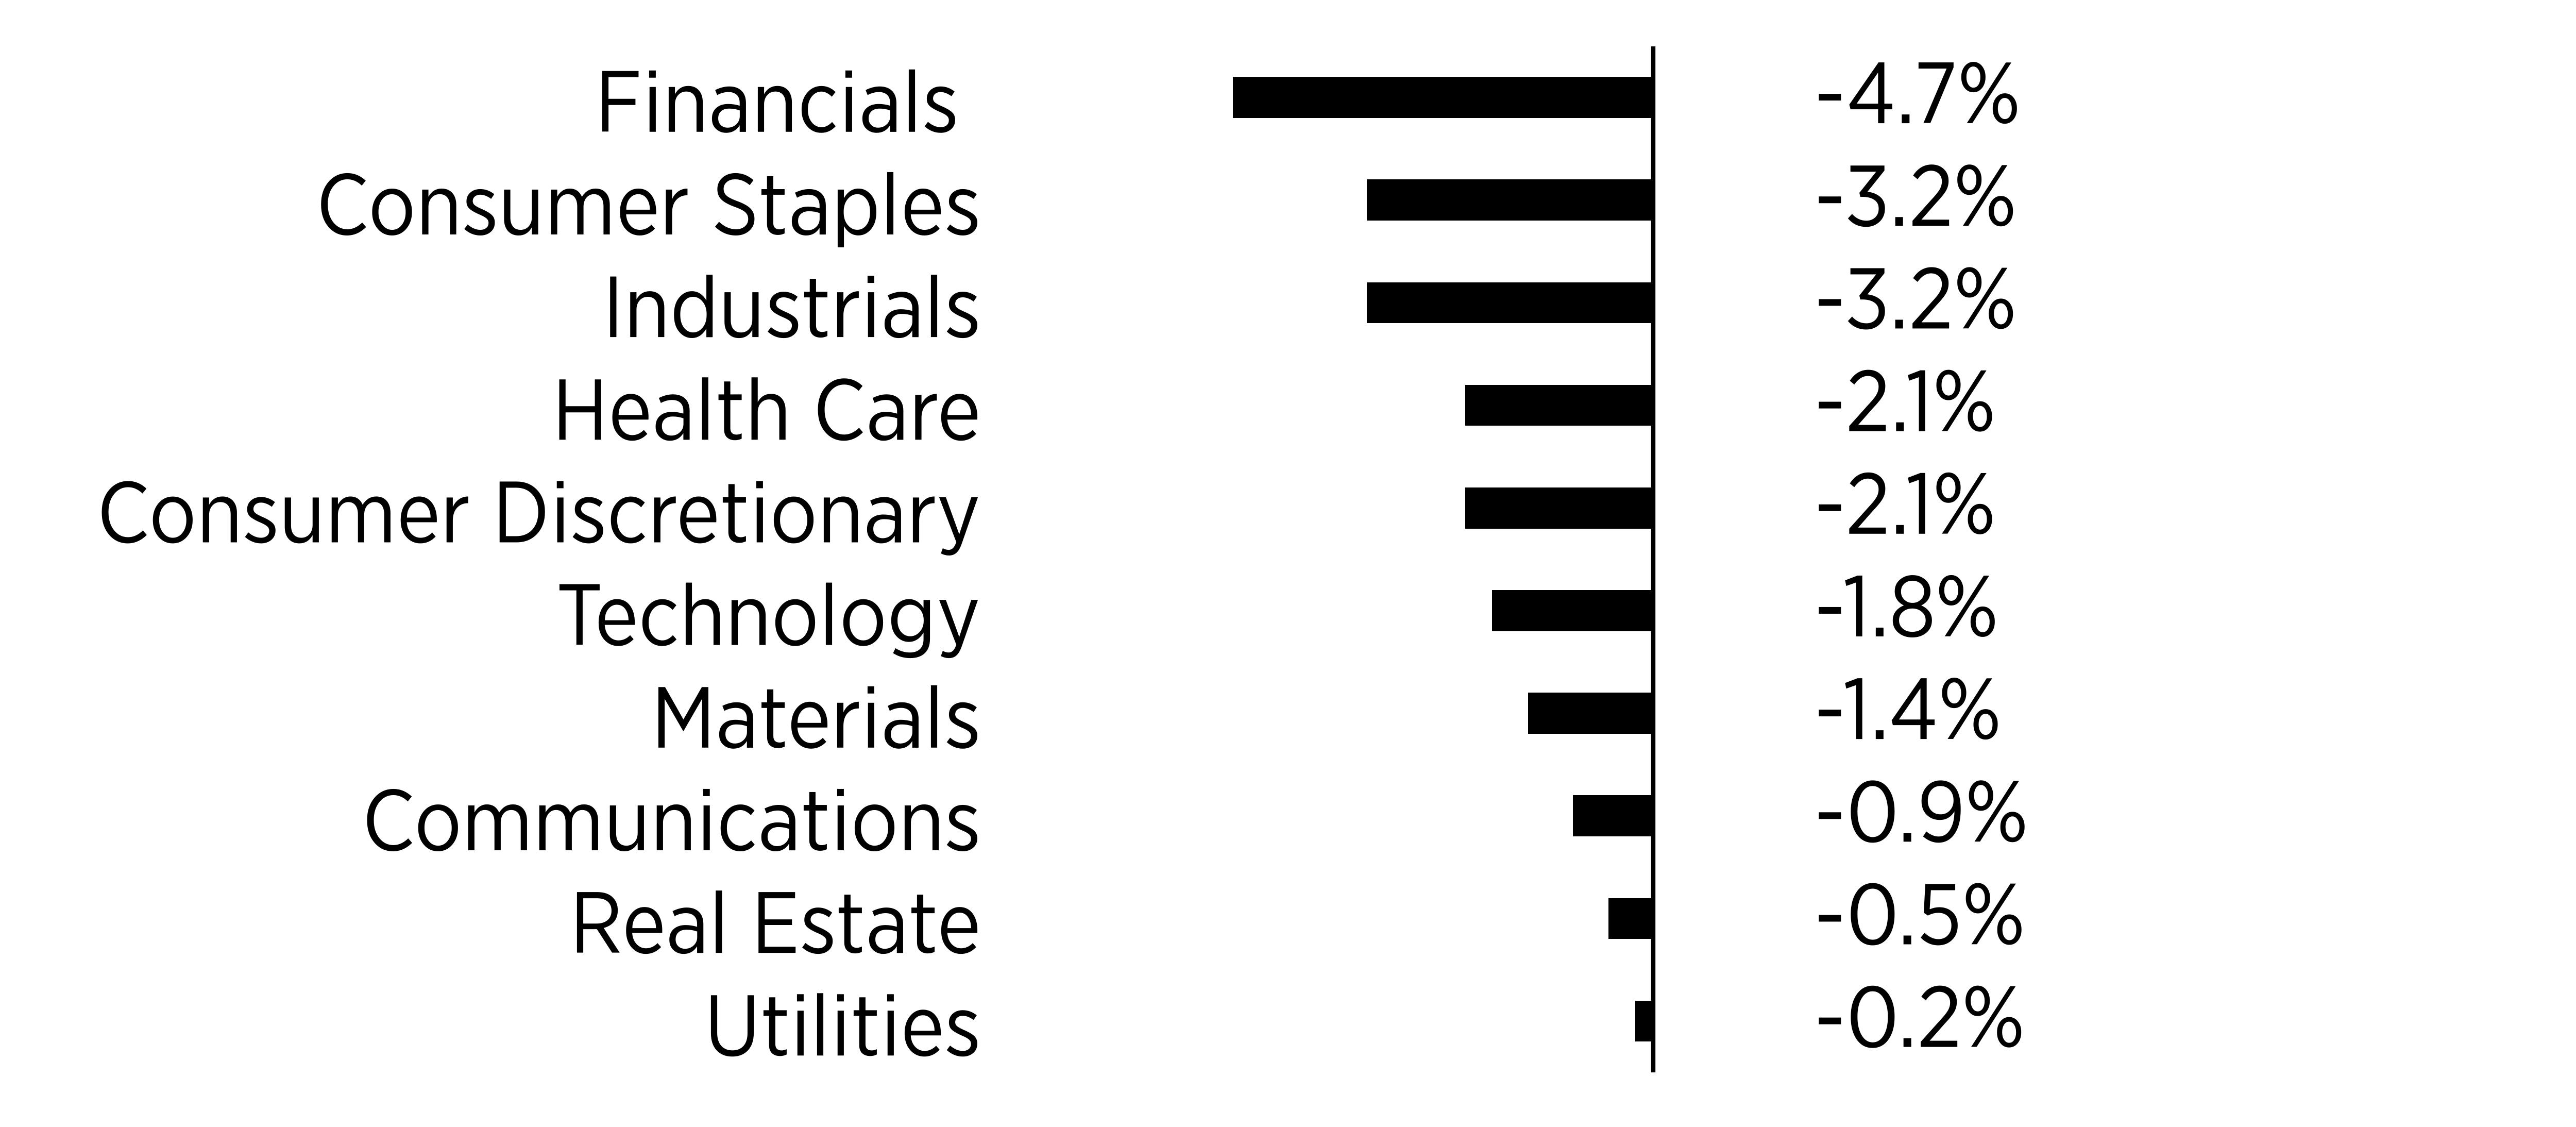
Sector/Security Type - Securities Sold Short
(% of net assets)
Security Type - Other Financial Instruments
(% of net assets)
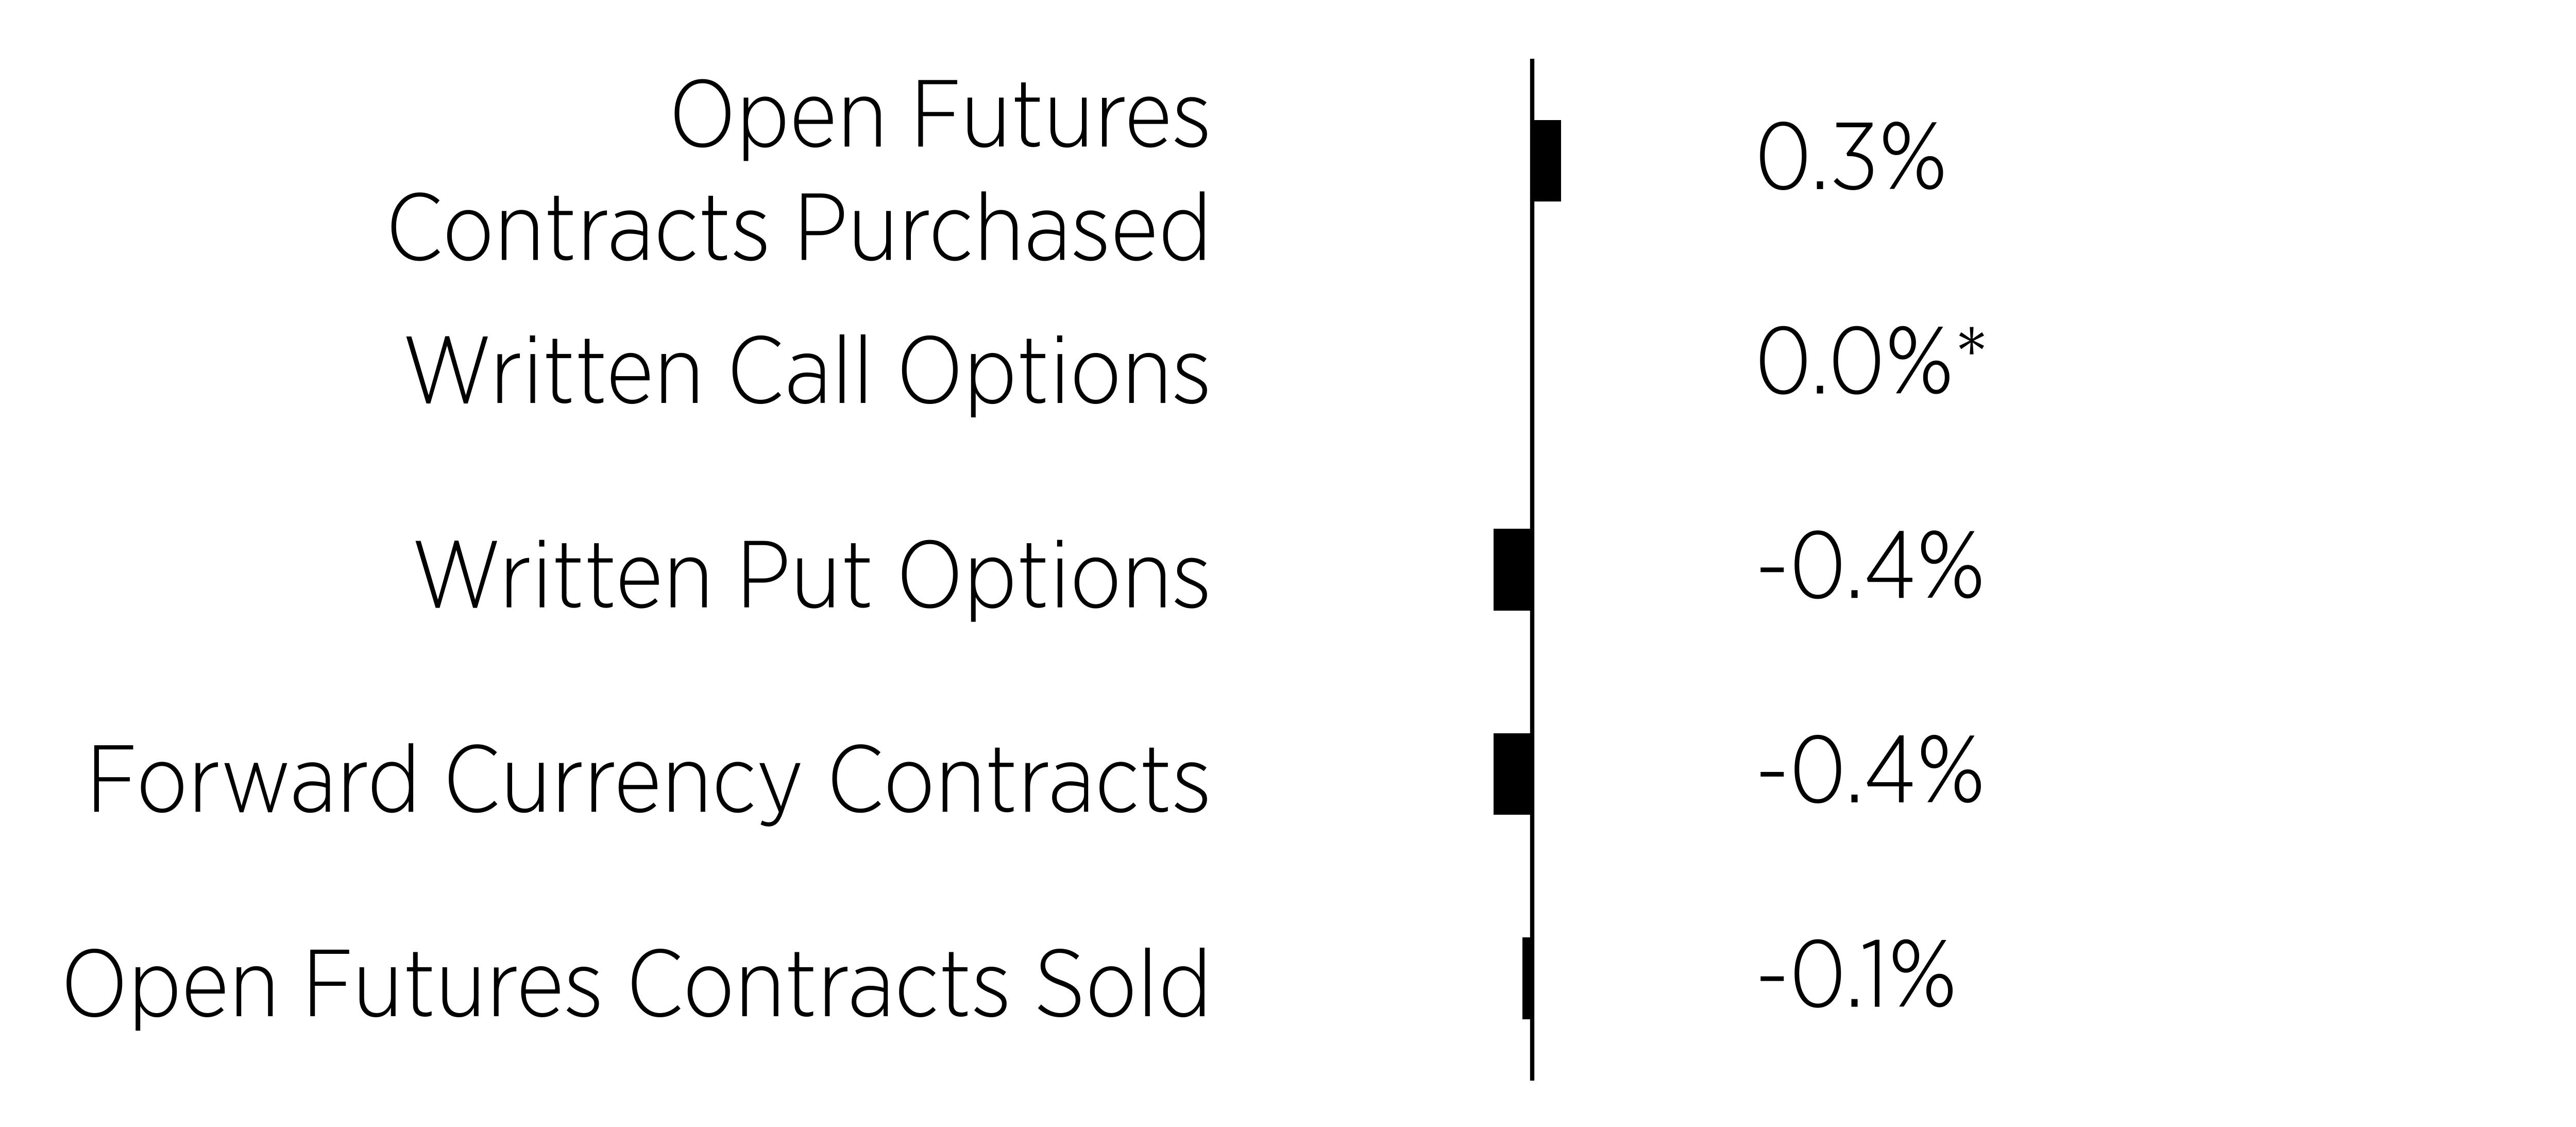
| * | Less than 0.05% of net assets. |
Percentages are based on total net assets, excluding Other Financial Instruments. Cash & Cash Equivalents represents cash, short-term investments and other assets in excess of liabilities. Futures contracts and Forward currency contracts percentages are based on unrealized appreciation (depreciation).
|
Top Holdings
|
(% of Total Net Assets)
|
|---|---|
|
First American Government
Obligations Fund - Class X, 3.57%
|
|
|
Western Digital Corp.
|
|
|
Lumentum Holdings, Inc.
|
|
|
iShares National Muni Bond ETF
|
|
|
Micron Technology, Inc.
|
|
|
iShares TIPS Bond ETF
|
|
|
Bloom Energy Corp. - Class A
|
|
|
Carpenter Technology Corp.
|
|
|
AZZ, Inc.
|
|
|
Lam Research Corp.
|
Fund Changes
Subsequent to the fiscal year end, the Fund discontinued the use of short sales and transitioned to derivative instruments to obtain certain investment exposures. As a result, the Fund revised the Other Expenses presented in its prospectus to reflect the expenses expected to be incurred under its current investment strategy. The revised Other Expenses became effective on July 17, 2026.
What were the Fund costs for the past year?
(based on a hypothetical $10,000 investment)
|
Fund Name
|
Costs of a $10,000 investment
|
Costs paid as a percentage of a $10,000 investment
|
|---|---|---|
|
Chesapeake Trend-Following Fixed Income ETF
|
$33*
|
0.95%**
|
| * | The Fund commenced operations on February 23, 2026. Expenses for a full reporting period would be higher than the figures shown. |
| ** | Costs paid as a percentage of a $10,000 investment is an annualized figure. |
How did the Fund perform last year and what affected its performance?
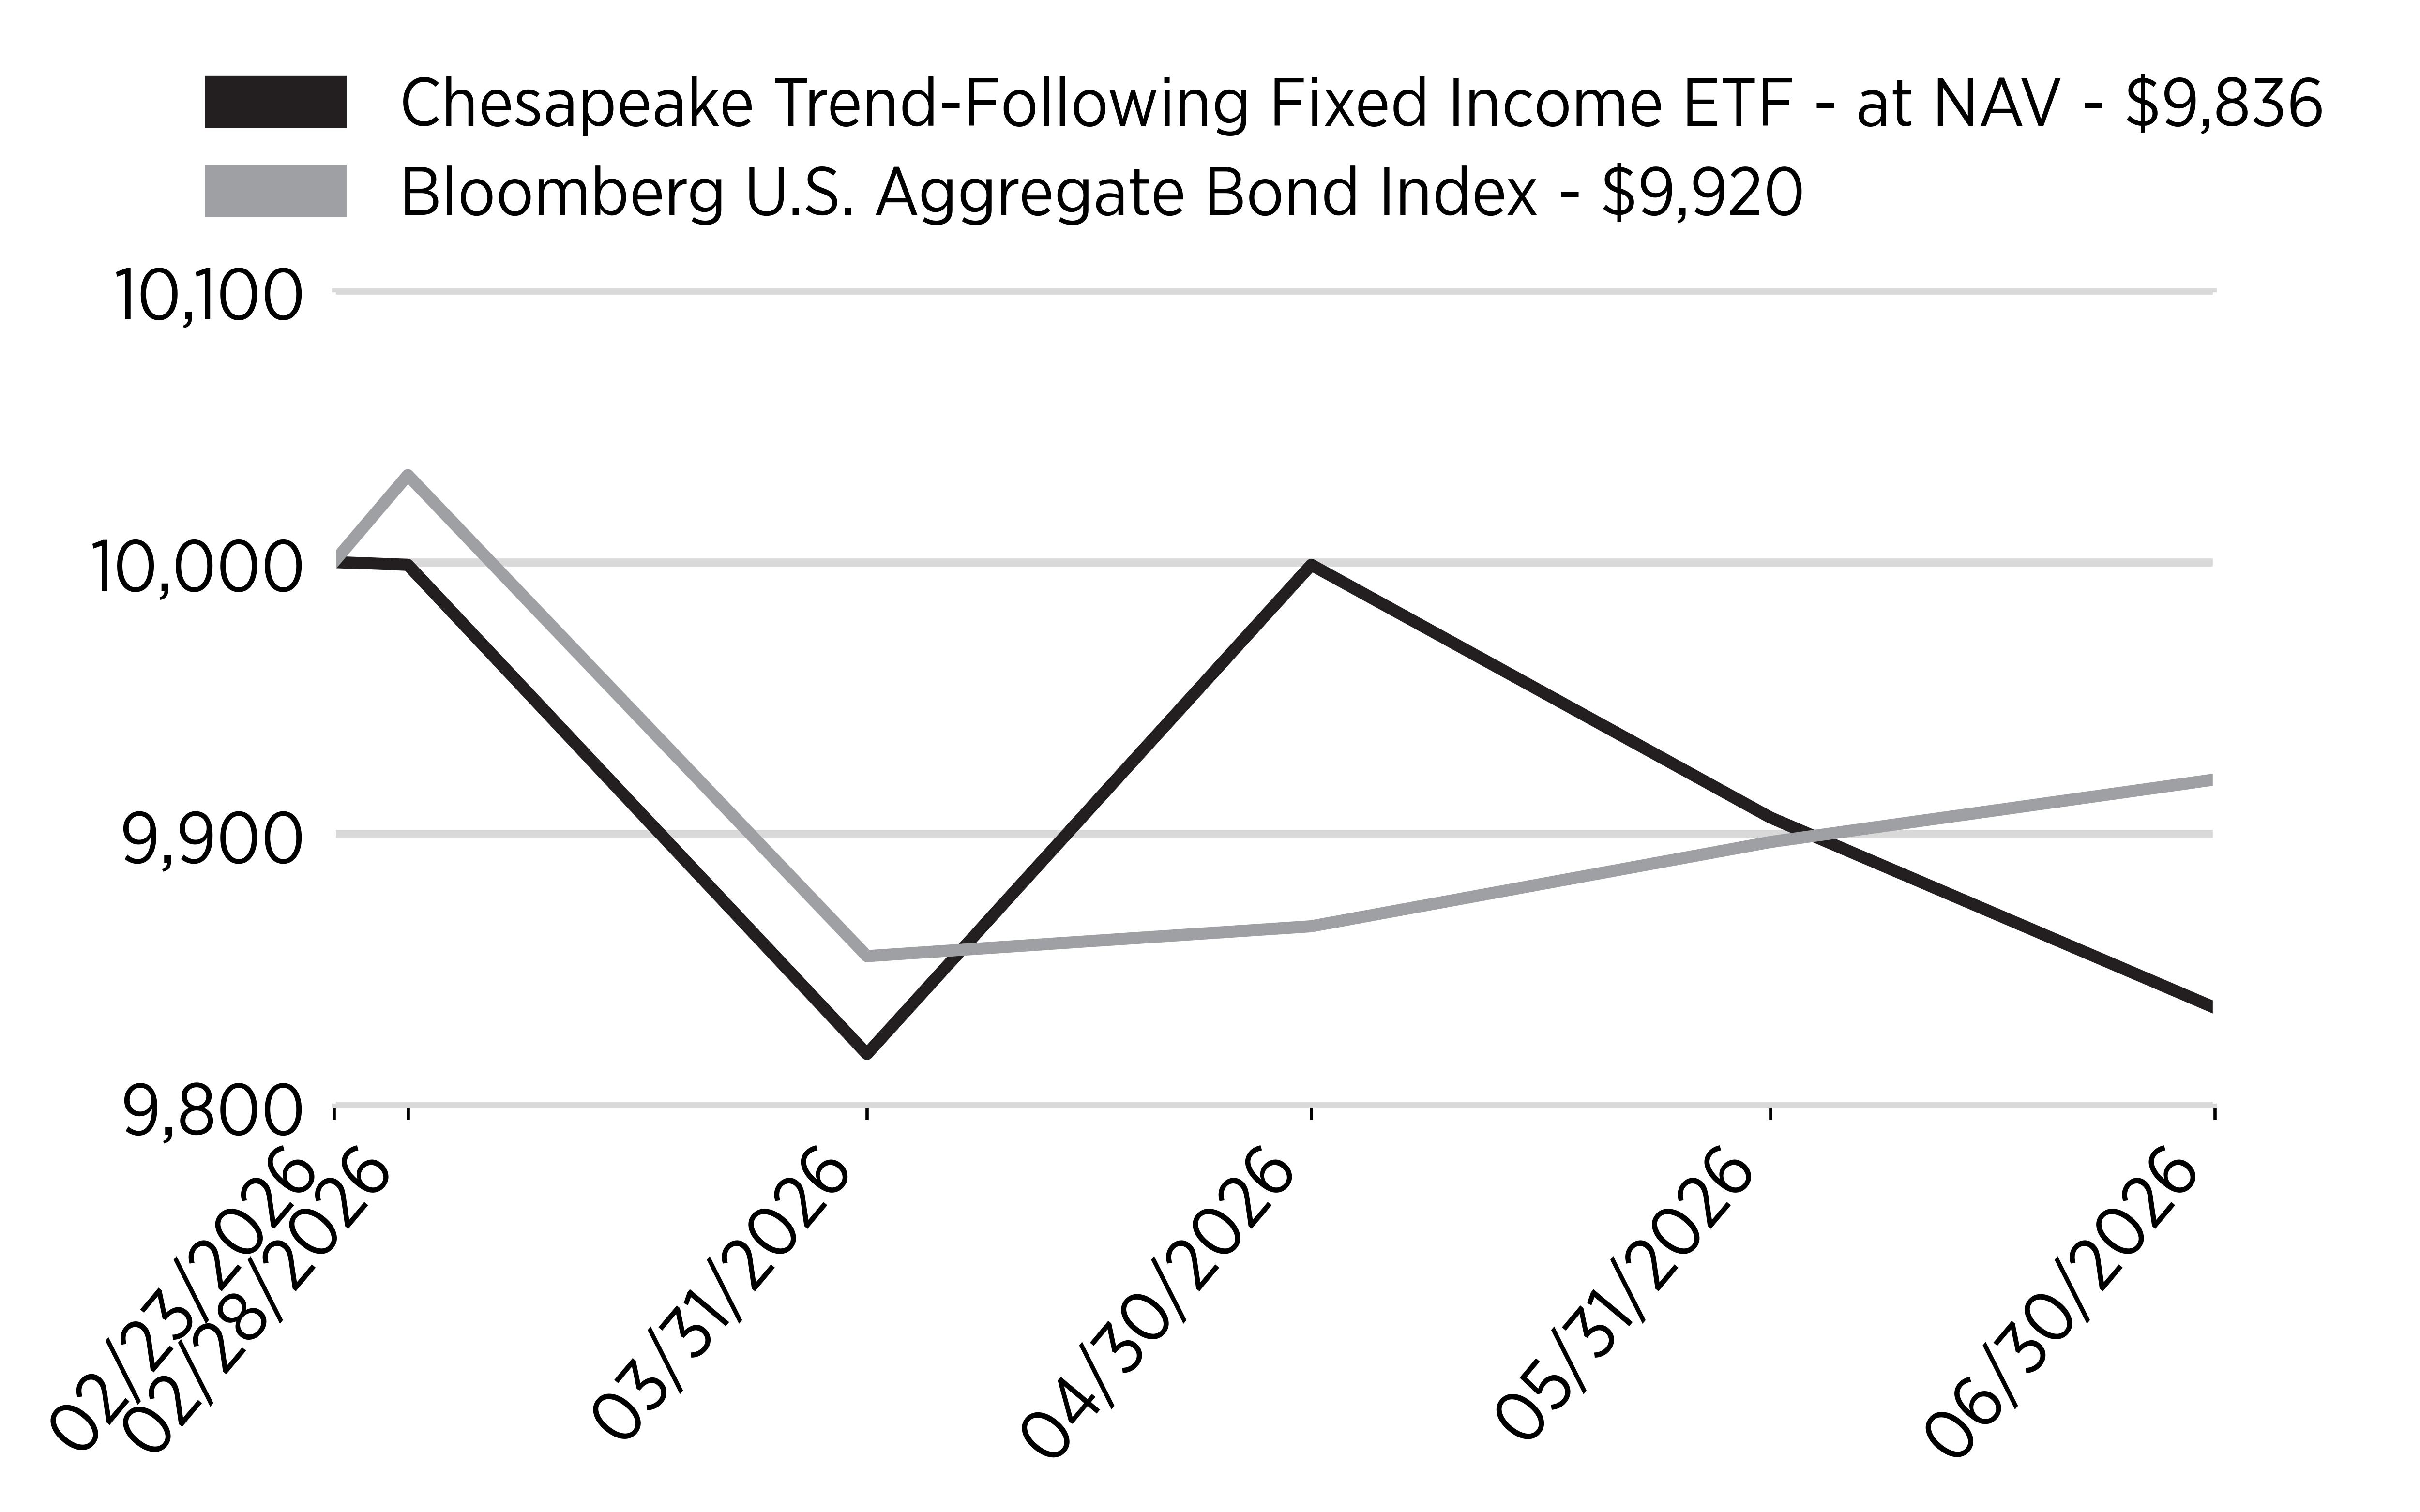
The Chesapeake Trend Following Fixed Income ETF (TFFI) commenced trading on February 23, 2026. The fund returned -1.64% for the period ending June 30th, 2026.
The strategy applies repeatable systematic investing rules to invest both long and short across four areas of the fixed income asset class:
- Sovereign duration
- Short-term rates
- Credit and spread products
- Inflation-sensitive and hybrid fixed income
Performance and Positioning: TFFI completed the period with a meaningful net short position in fixed income. Those positions developed as bond prices weakened, both across the US and global curve. The strategy responded systematically to observable price behavior—scaling exposure where trends persisted and cutting risk where they weakened. Fixed income remained net short following the significant shift in interest rate yields. Positioning included short exposure across U.S. Treasury and international government bond futures spanning several maturities, along with increased exposure to short-term Japanese interest-rate futures. The portfolio maintains a meaningful net short, fixed income position.
TFFI’s broad global exposure and long/short flexibility allow the ETF to adjust to all market cycles and interest rate environments.
Cumulative Performance
Annual Performance
|
|
Since Inception
(2/23/26)
|
|---|---|
|
Chesapeake Trend-Following
Fixed Income ETF - at NAV
|
-1.64%
|
|
Bloomberg U.S. Aggregate Bond Index
|
-0.80%
|
Key Fund Statistics
(as of June 30, 2026)
|
Fund Size (Thousands)
|
$36,886
|
|
Number of Holdings
|
48
|
|
Total Advisory Fee Paid
|
$90,371
|
|
Portfolio Turnover Rate
|
2%
|
What did the Fund invest in?
(as of June 30, 2026)
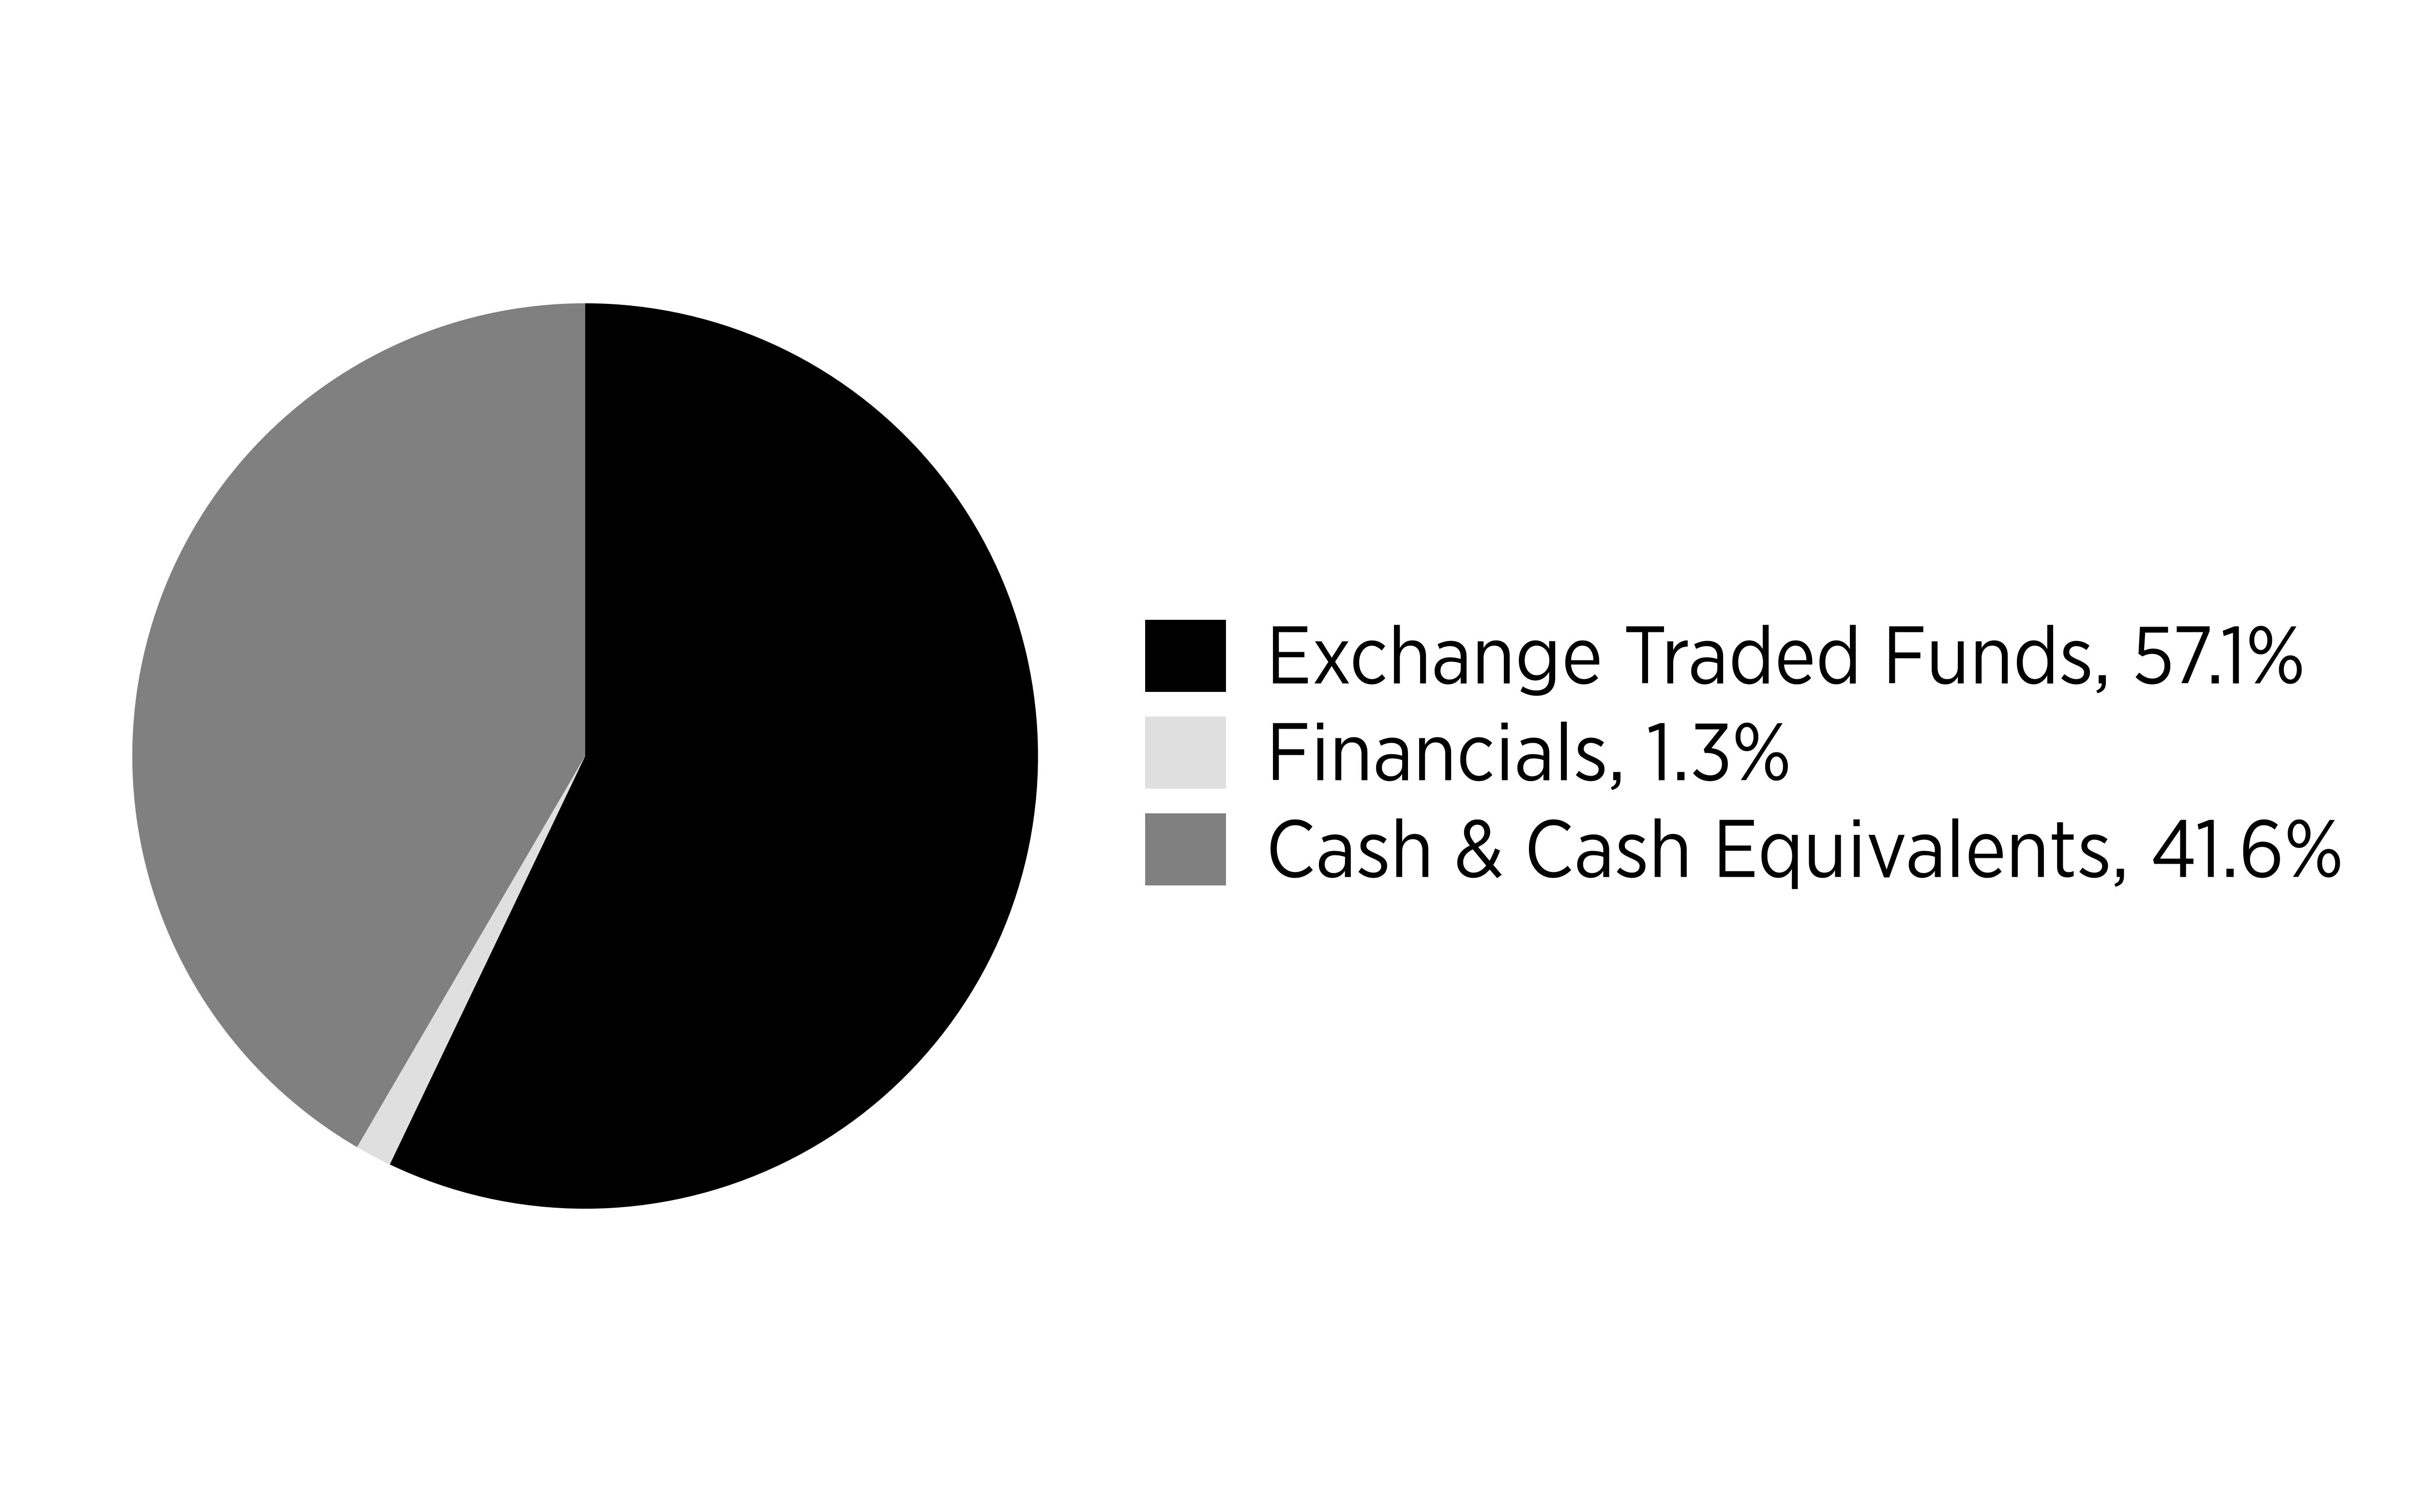
Sector/Security Type - Investments (% of net assets)
(Excludes securities sold short and other financial instruments)
|
Top Holdings
|
(% of Total
Net Assets)
|
|---|---|
|
First American Government
Obligations Fund - Class X, 3.57%
|
|
|
iShares National Muni Bond ETF
|
|
|
iShares TIPS Bond ETF
|
|
|
Vanguard Short-Term Corporate Bond ETF
|
|
|
SPDR Bloomberg Convertible Securities ETF
|
|
|
iShares Preferred and Income Securities ETF
|
|
|
Vanguard Intermediate-Term Corporate
Bond ETF
|
|
|
iShares MBS ETF
|
|
|
iShares J.P. Morgan USD Emerging Markets
Bond ETF
|
|
|
Blackstone Mortgage Trust, Inc. - REIT
|
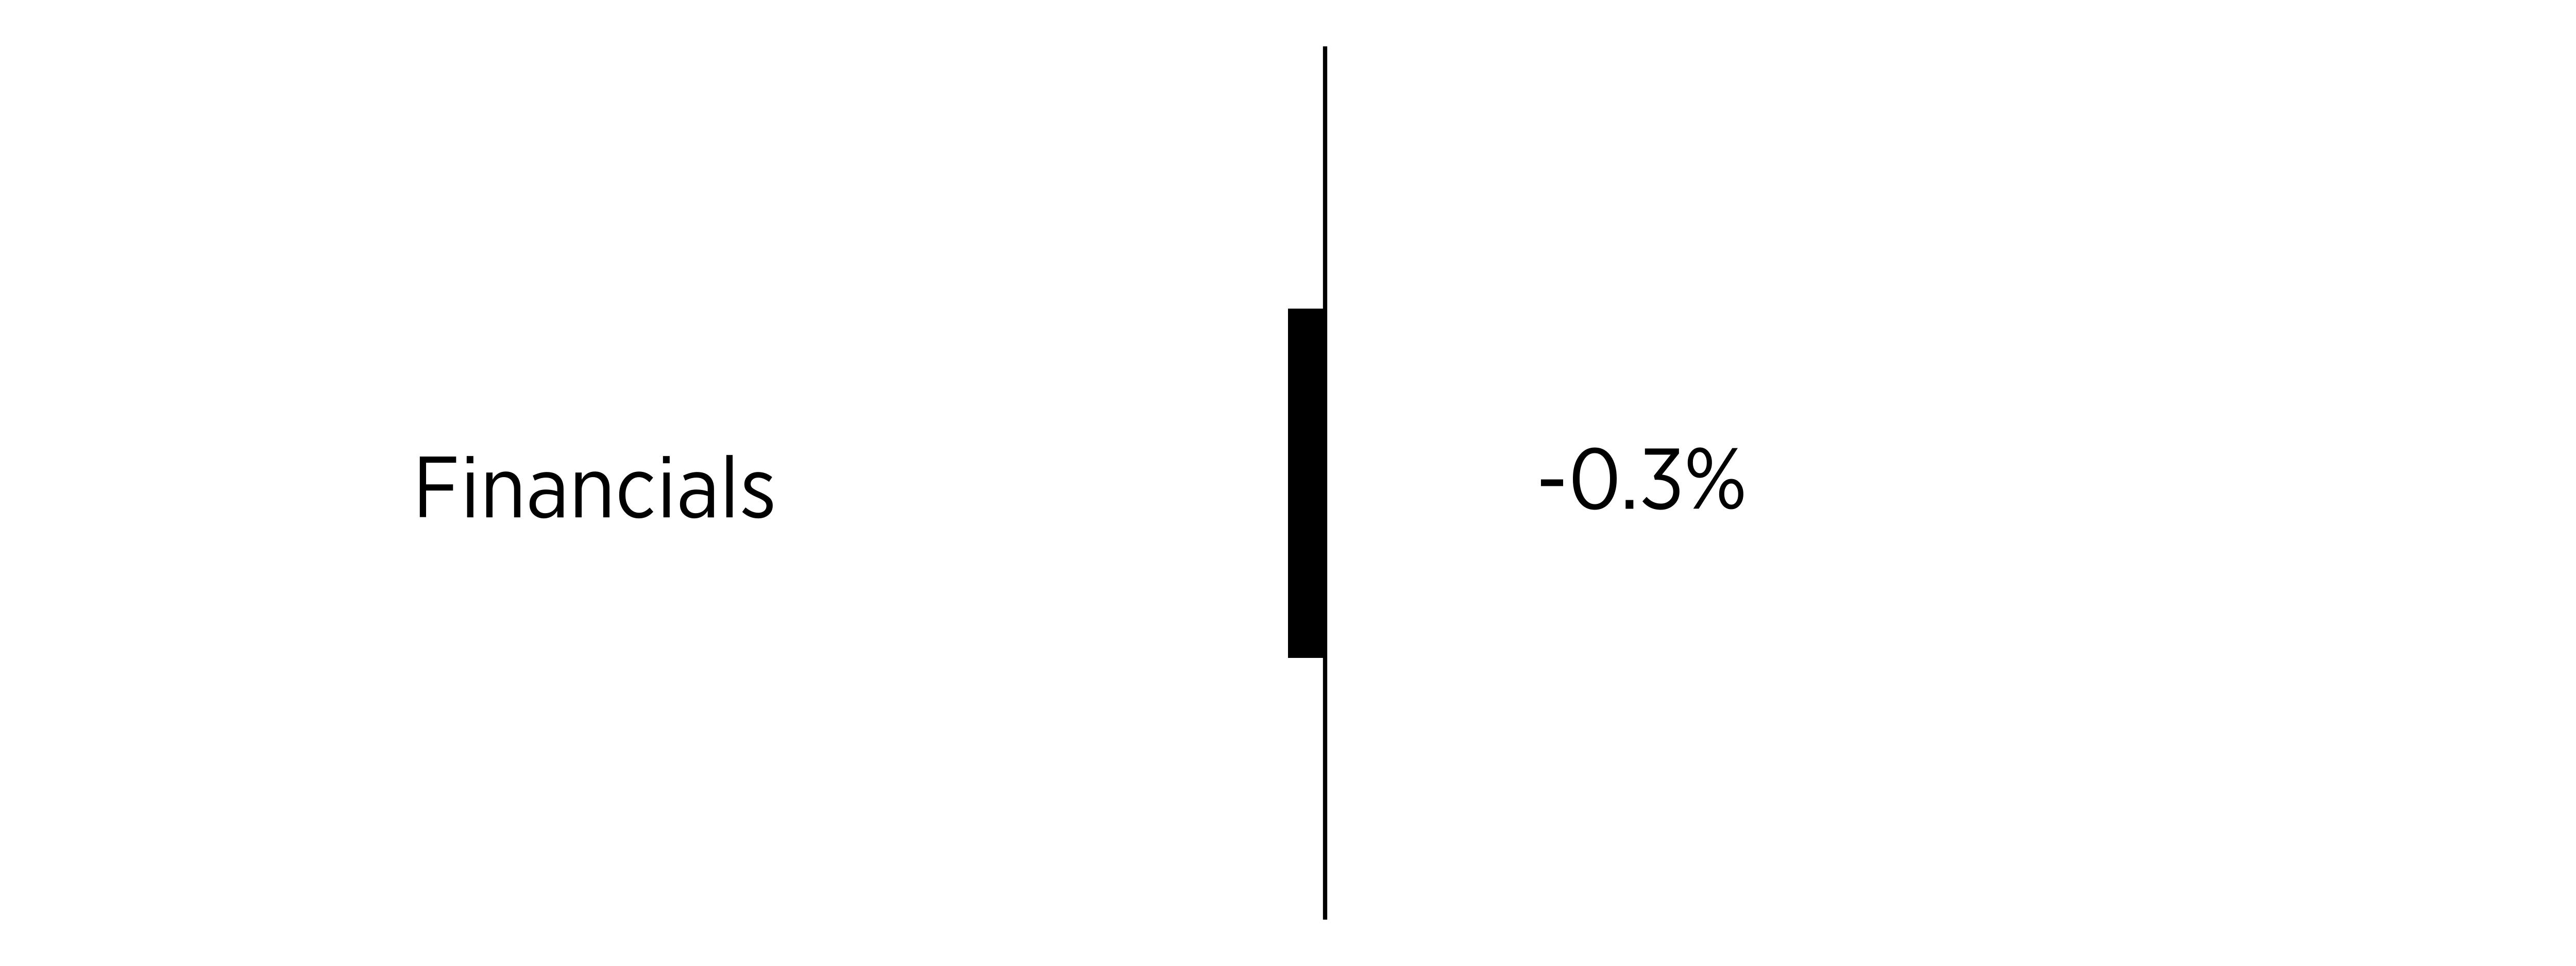
Sector/Security Type - Securities Sold Short
(% of net assets)
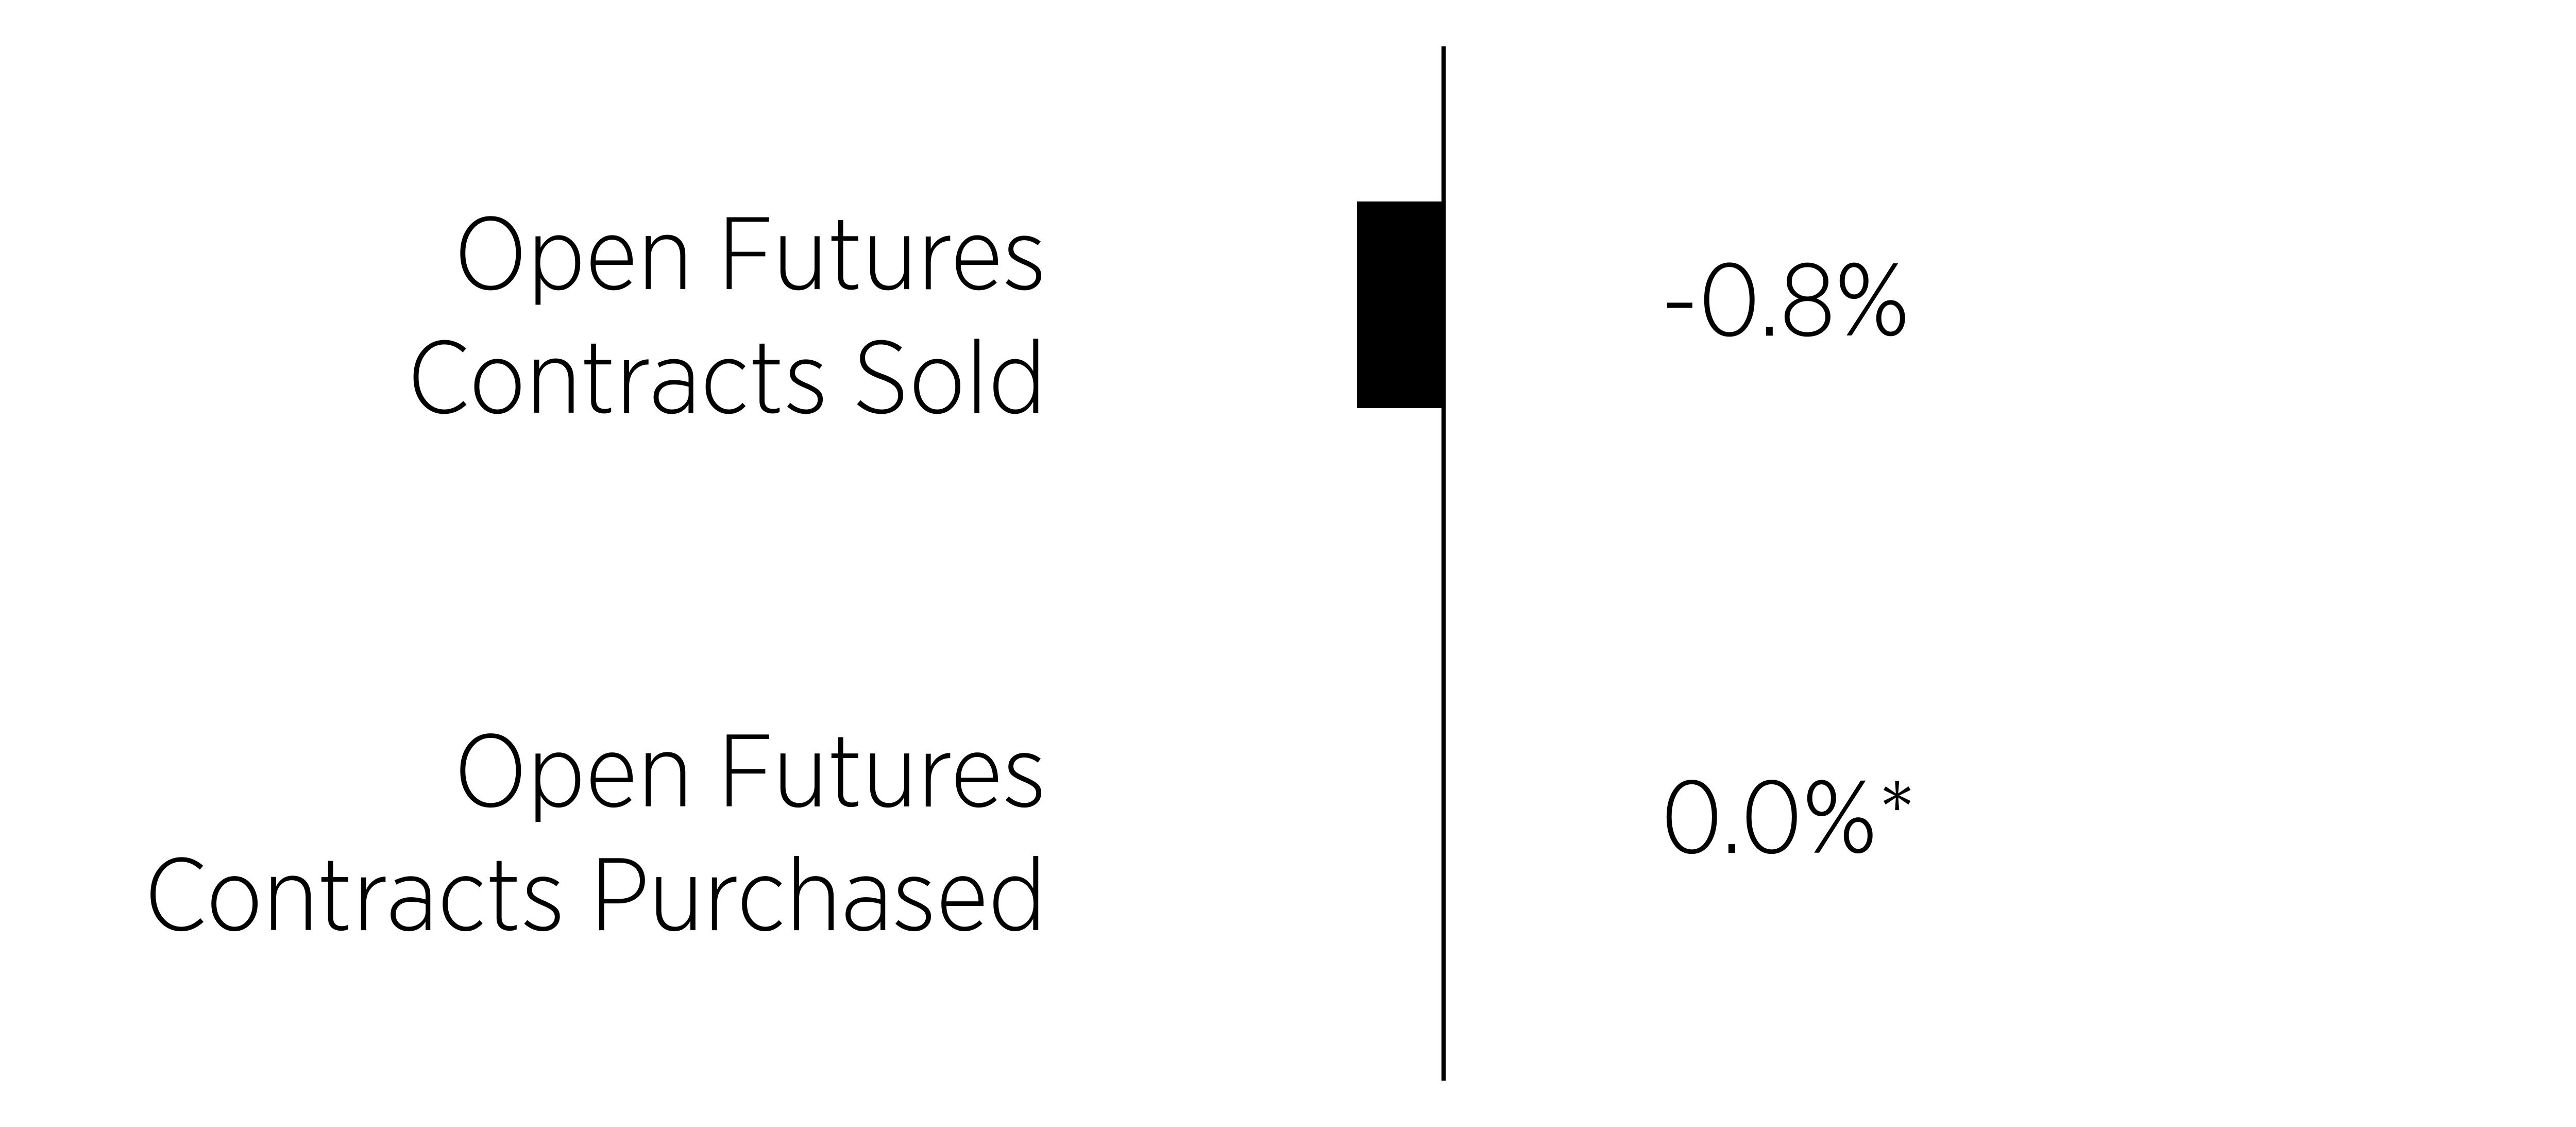
Security Type - Other Financial Instruments
(% of net assets)
| * | Less than 0.05% of net assets. |
|
Top Holdings
|
(% of Total
Net Assets)
|
|---|---|
|
First American Government
Obligations Fund - Class X, 3.57%
|
|
|
iShares National Muni Bond ETF
|
|
|
iShares TIPS Bond ETF
|
|
|
Vanguard Short-Term Corporate Bond ETF
|
|
|
SPDR Bloomberg Convertible Securities ETF
|
|
|
iShares Preferred and Income Securities ETF
|
|
|
Vanguard Intermediate-Term Corporate
Bond ETF
|
|
|
iShares MBS ETF
|
|
|
iShares J.P. Morgan USD Emerging Markets
Bond ETF
|
|
|
Blackstone Mortgage Trust, Inc. - REIT
|
Sector/Security Type - Securities Sold Short
(% of net assets)
Security Type - Other Financial Instruments
(% of net assets)
| * | Less than 0.05% of net assets. |
Fund Changes
There were no material changes during the reporting period.
| [1] | Costs paid as a percentage of a $10,000 investment is an annualized figure. |
| [2] | The Fund commenced operations on February 23, 2026. Expenses for a full reporting period would be higher than the figures shown. |
| [3] | Costs paid as a percentage of a $10,000 investment is an annualized figure. |