What were the Fund costs for the past year?
(based on a hypothetical $10,000 investment)
|
Fund Name
|
Costs of a $10,000 investment
|
Costs paid as a percentage of a $10,000 investment
|
|---|---|---|
|
Cambria Chesapeake Pure Trend ETF
|
$131
|
1.16%*
|
| * | Costs paid as a percentage of a $10,000 investment is an annualized figure. |
How did the Fund perform last year and what affected its performance?
For the period July 1, 2025 – June 30, 2026
During the 12-month reporting period, the MFUT Fund returned +25.93% (NAV) and 25.65% (market price).
The Fund began the fiscal year with strong gains—benefiting from long positions in select commodities and trend-driven single equities.
MFUT maintained its systematic approach throughout, adjusting exposures based on the strength and direction of price trends across asset classes. The strategy does not rely on predictions or discretionary decisions, instead following a rules-based process to identify opportunities and manage risk.
Performance Drivers
- Currencies: Net exposure to foreign currencies increased through the year as central bank paths diverged. Long positions in the Australian Dollar and the Canadian Dollar contributed early, and positions in long US dollar led later in the period. Long emerging market exposure also added gains.
- Commodities: Commodity results were mixed but positive for the year. Metals led early, with long gold exposure and copper and silver longs were added as trends developed and contributed profits as well. Energy took over later in the period, as long positions in gas oil, heating oil, and Brent crude benefited from sustained trends. Grains were mixed during the period but long exposure by year end provided positive results.
- Fixed Income: Fixed income remained the Fund's largest allocation by weight and contributed meaningfully early in the year, anchored by long short-duration positions in instruments. The portfolio later moved short across the curve in both domestic and foreign bonds. Short-term interest rate futures and European sovereign shorts detracted as rate expectations shifted.
- Equities: Single stocks were the largest driver of the year's return.As the market’s continued their trend higher and breaking record highs. The Fund continues to be net long Equities going into the new year.
Positioning as of June 30, 2026
At period-end of the period, MFUT held:
- Long positions in energy, metals, grains and mixed positioning in softs and livestock commodities
- Net long emerging market currencies and short the Euro and the Sterling.
- Short positions across the curve n domestic and foreign bonds
- Net long single-stock positions.
While the year included periods of disruption, the Fund remained consistent in applying its systematic process—reducing risk when trends weakened and scaling back in when trend strength improved. MFUT’s diversified, rules-based framework is designed to participate in sustained market trends while actively managing downside risk.
Cumulative Performance
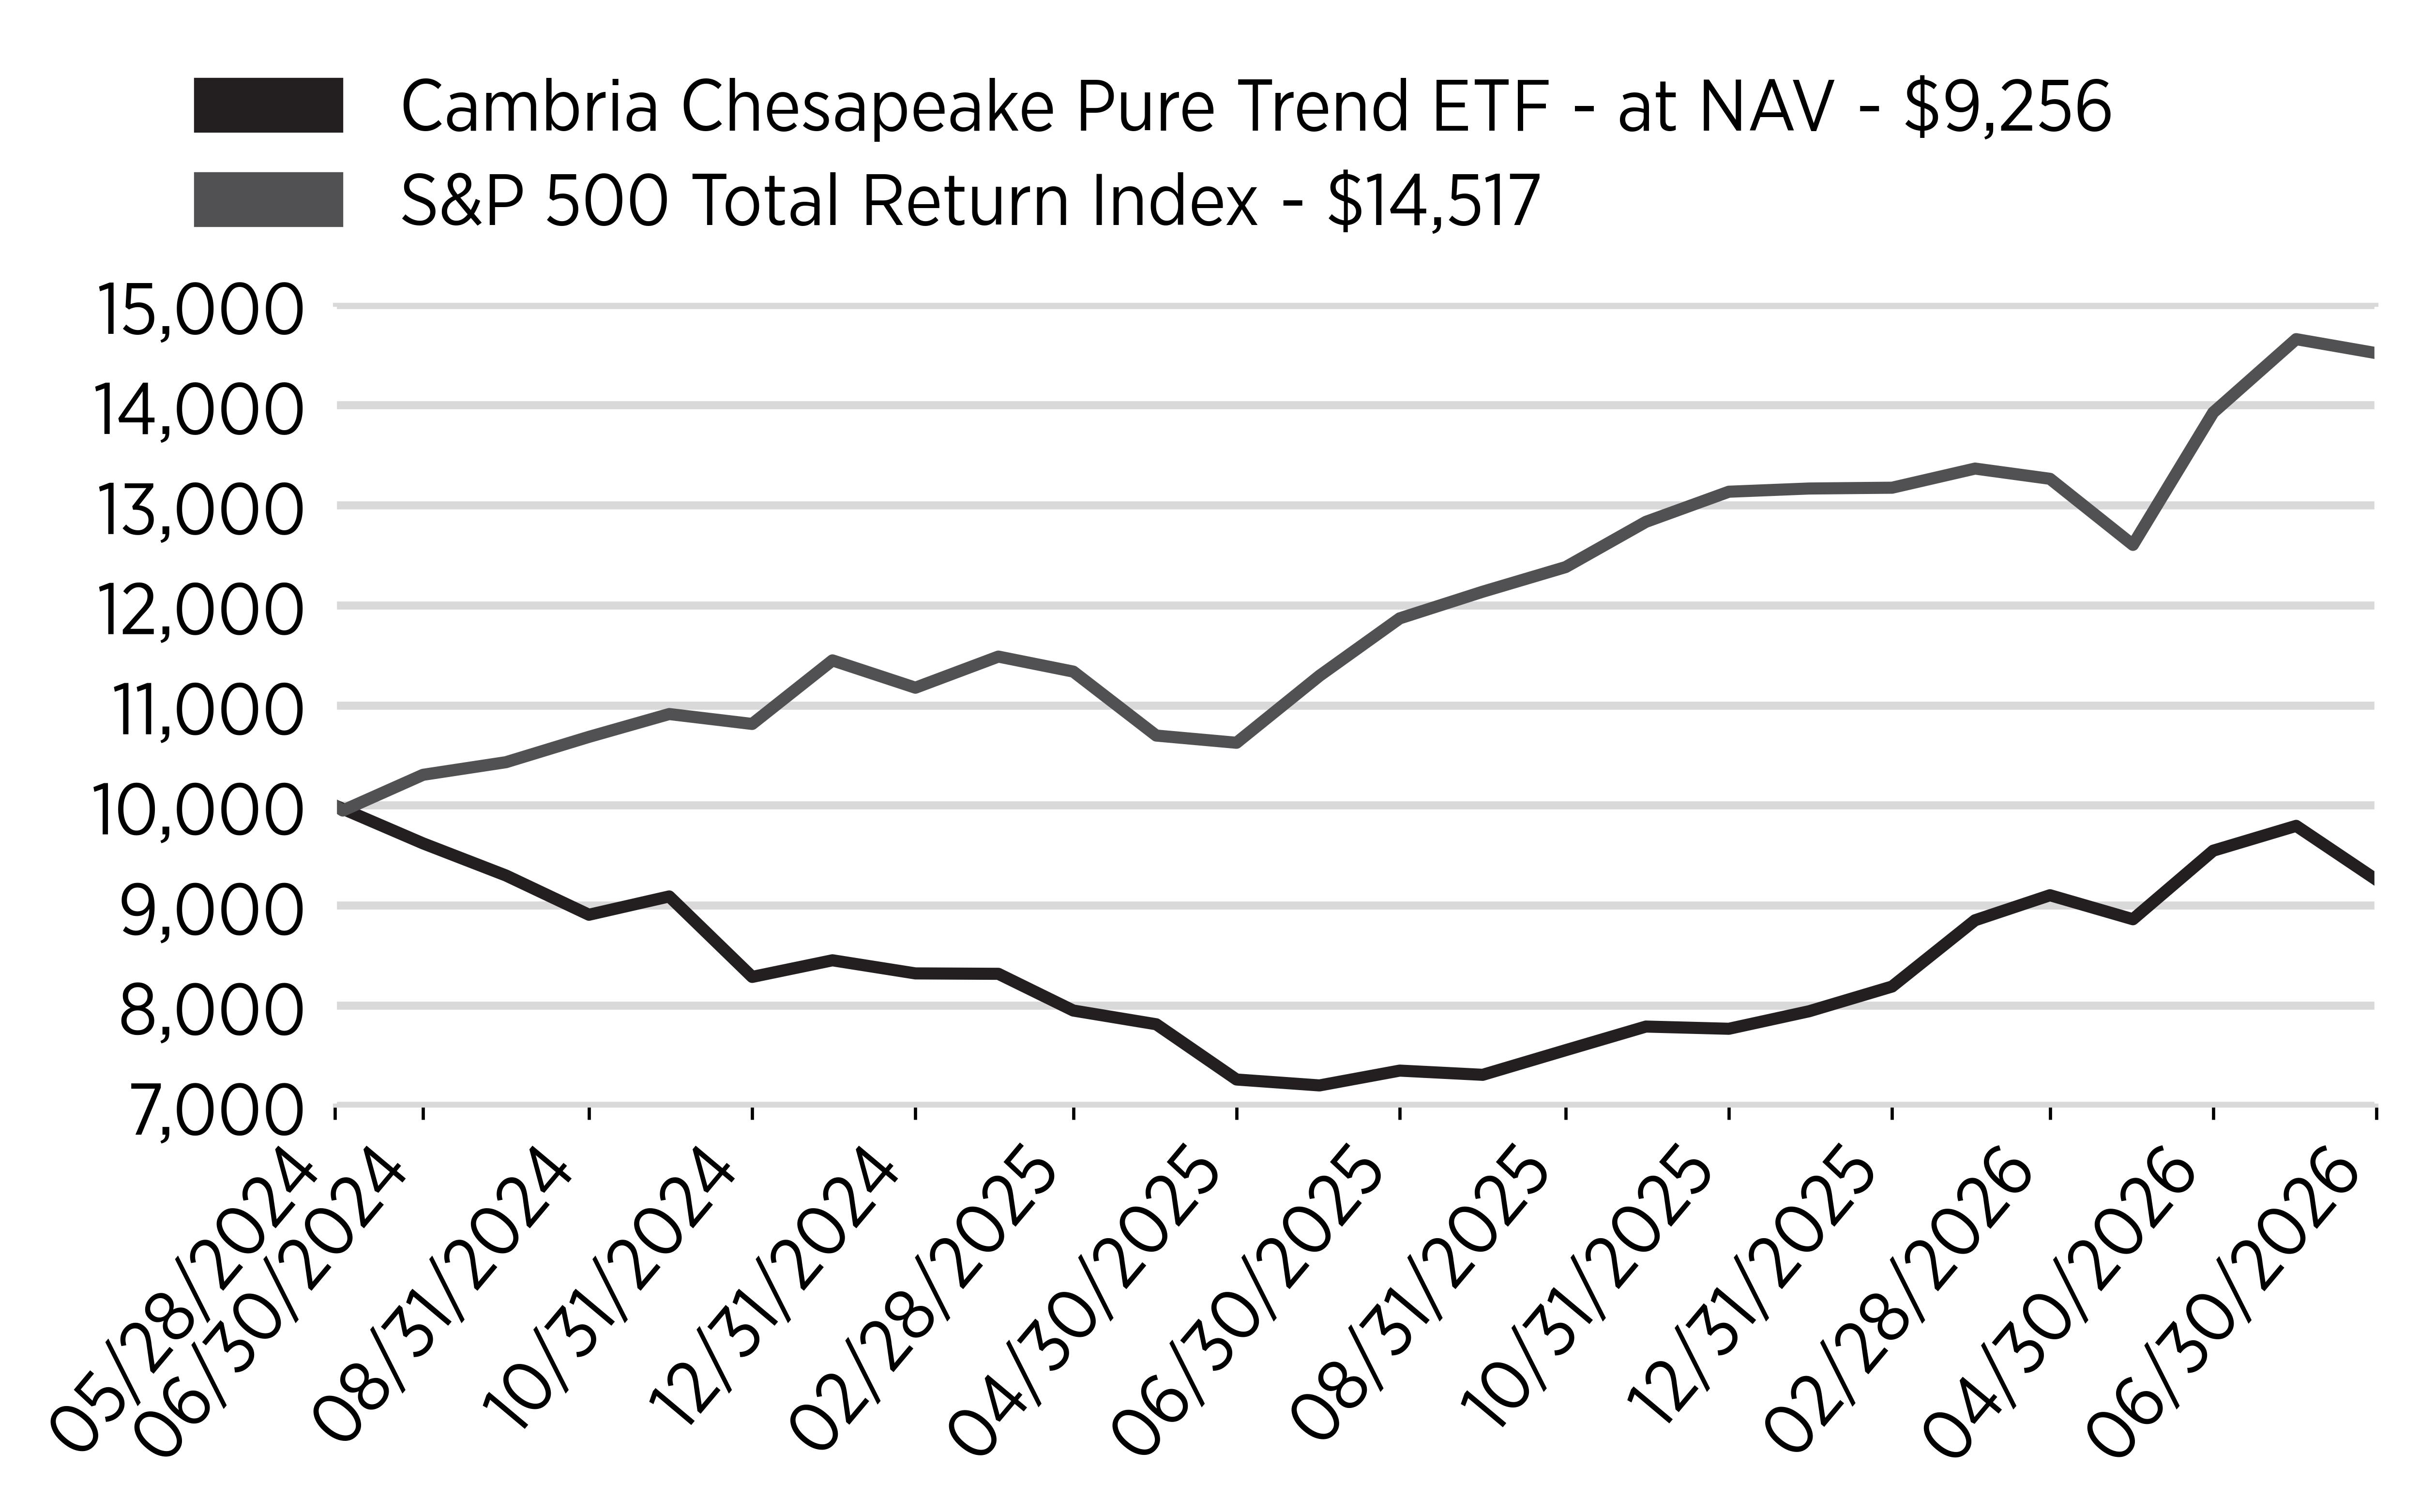
Annual Performance
|
Average Annual Returns for the
Periods Ended June 30, 2026:
|
1 Year
|
Since Inception
(5/28/24)
|
|---|---|---|
|
Cambria Chesapeake Pure
Trend ETF - at NAV
|
25.93%
|
-3.63%
|
|
S&P 500 Total Return Index
|
22.32%
|
19.52%
|
Key Fund Statistics
(as of June 30, 2026)
|
Fund Size (Thousands)
|
$39,210
|
|
Number of Holdings
|
131
|
|
Total Advisory Fee Paid
|
$201,647
|
|
Portfolio Turnover Rate
|
83%
|
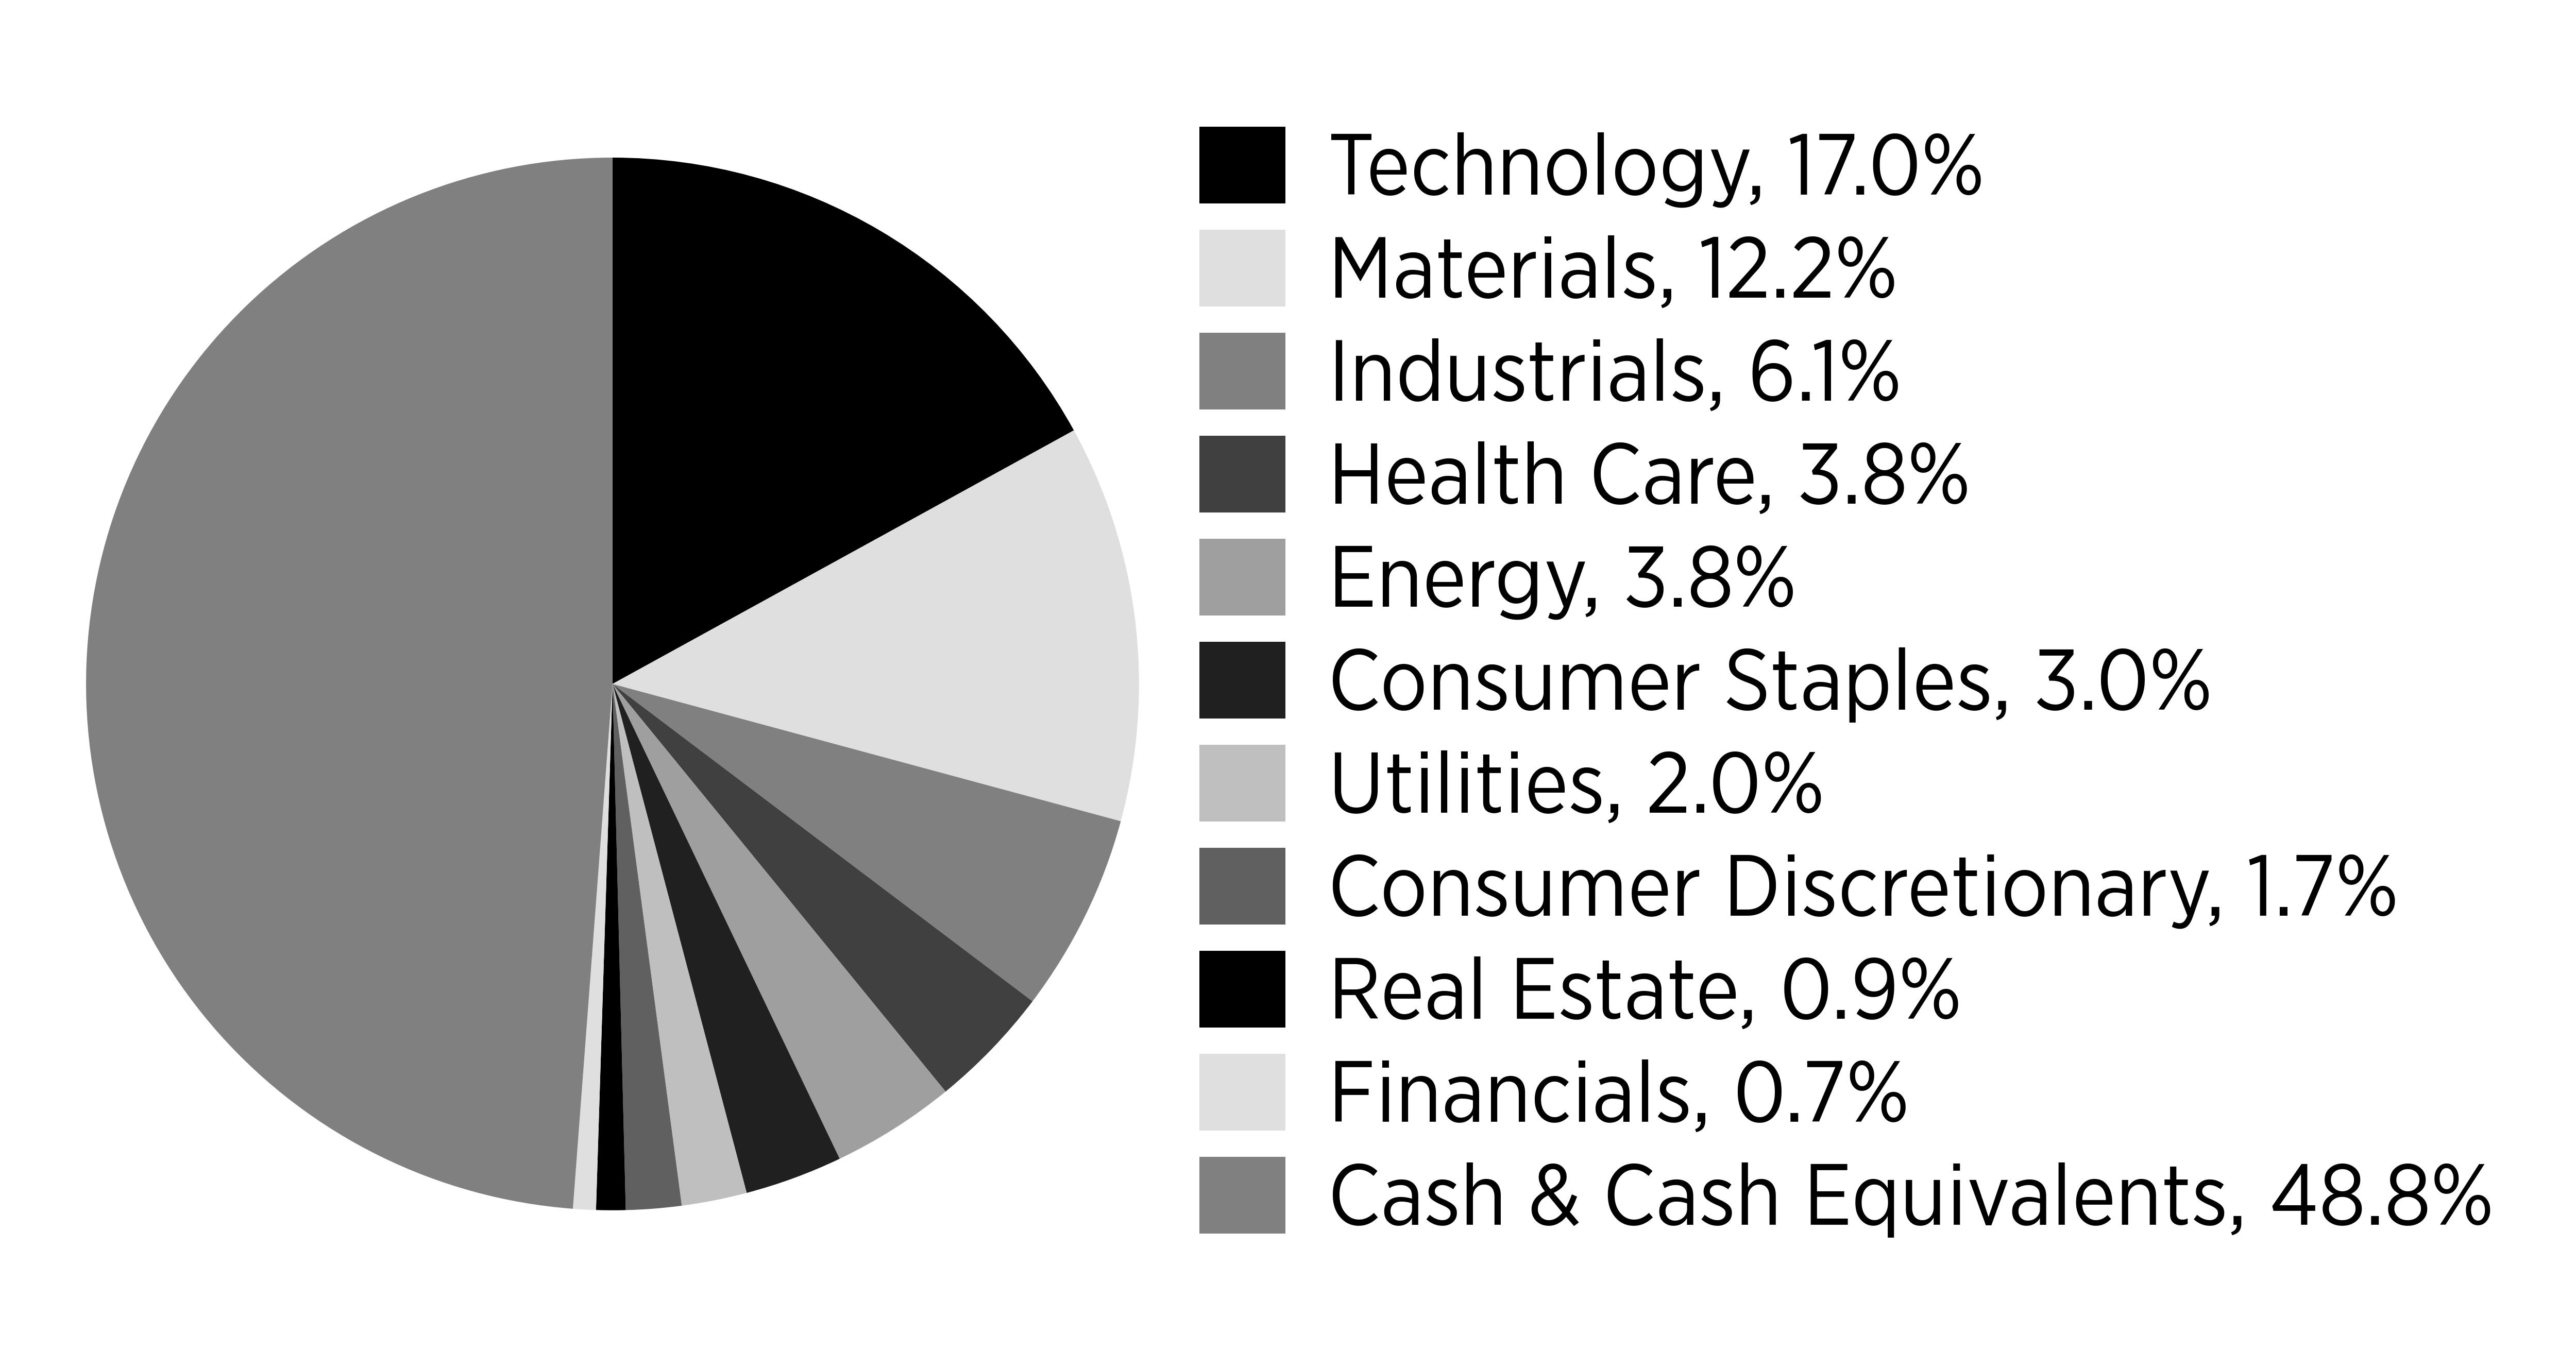
What did the Fund invest in?
(as of June 30, 2026)
Sector/Security Type - Investments (% of net assets)
(Excludes securities sold short and other financial instruments)
|
Top Holdings
|
(% of net assets)
|
|---|---|
|
First American Government
Obligations Fund - Class X, 3.57%
|
|
|
Micron Technology, Inc.
|
|
|
Cisco Systems, Inc.
|
|
|
NVIDIA Corp.
|
|
|
Advanced Micro Devices, Inc.
|
|
|
Deere & Co.
|
|
|
Corteva, Inc.
|
|
|
Rio Tinto PLC
|
|
|
ASML Holding NV
|
|
|
BHP Group Ltd.
|
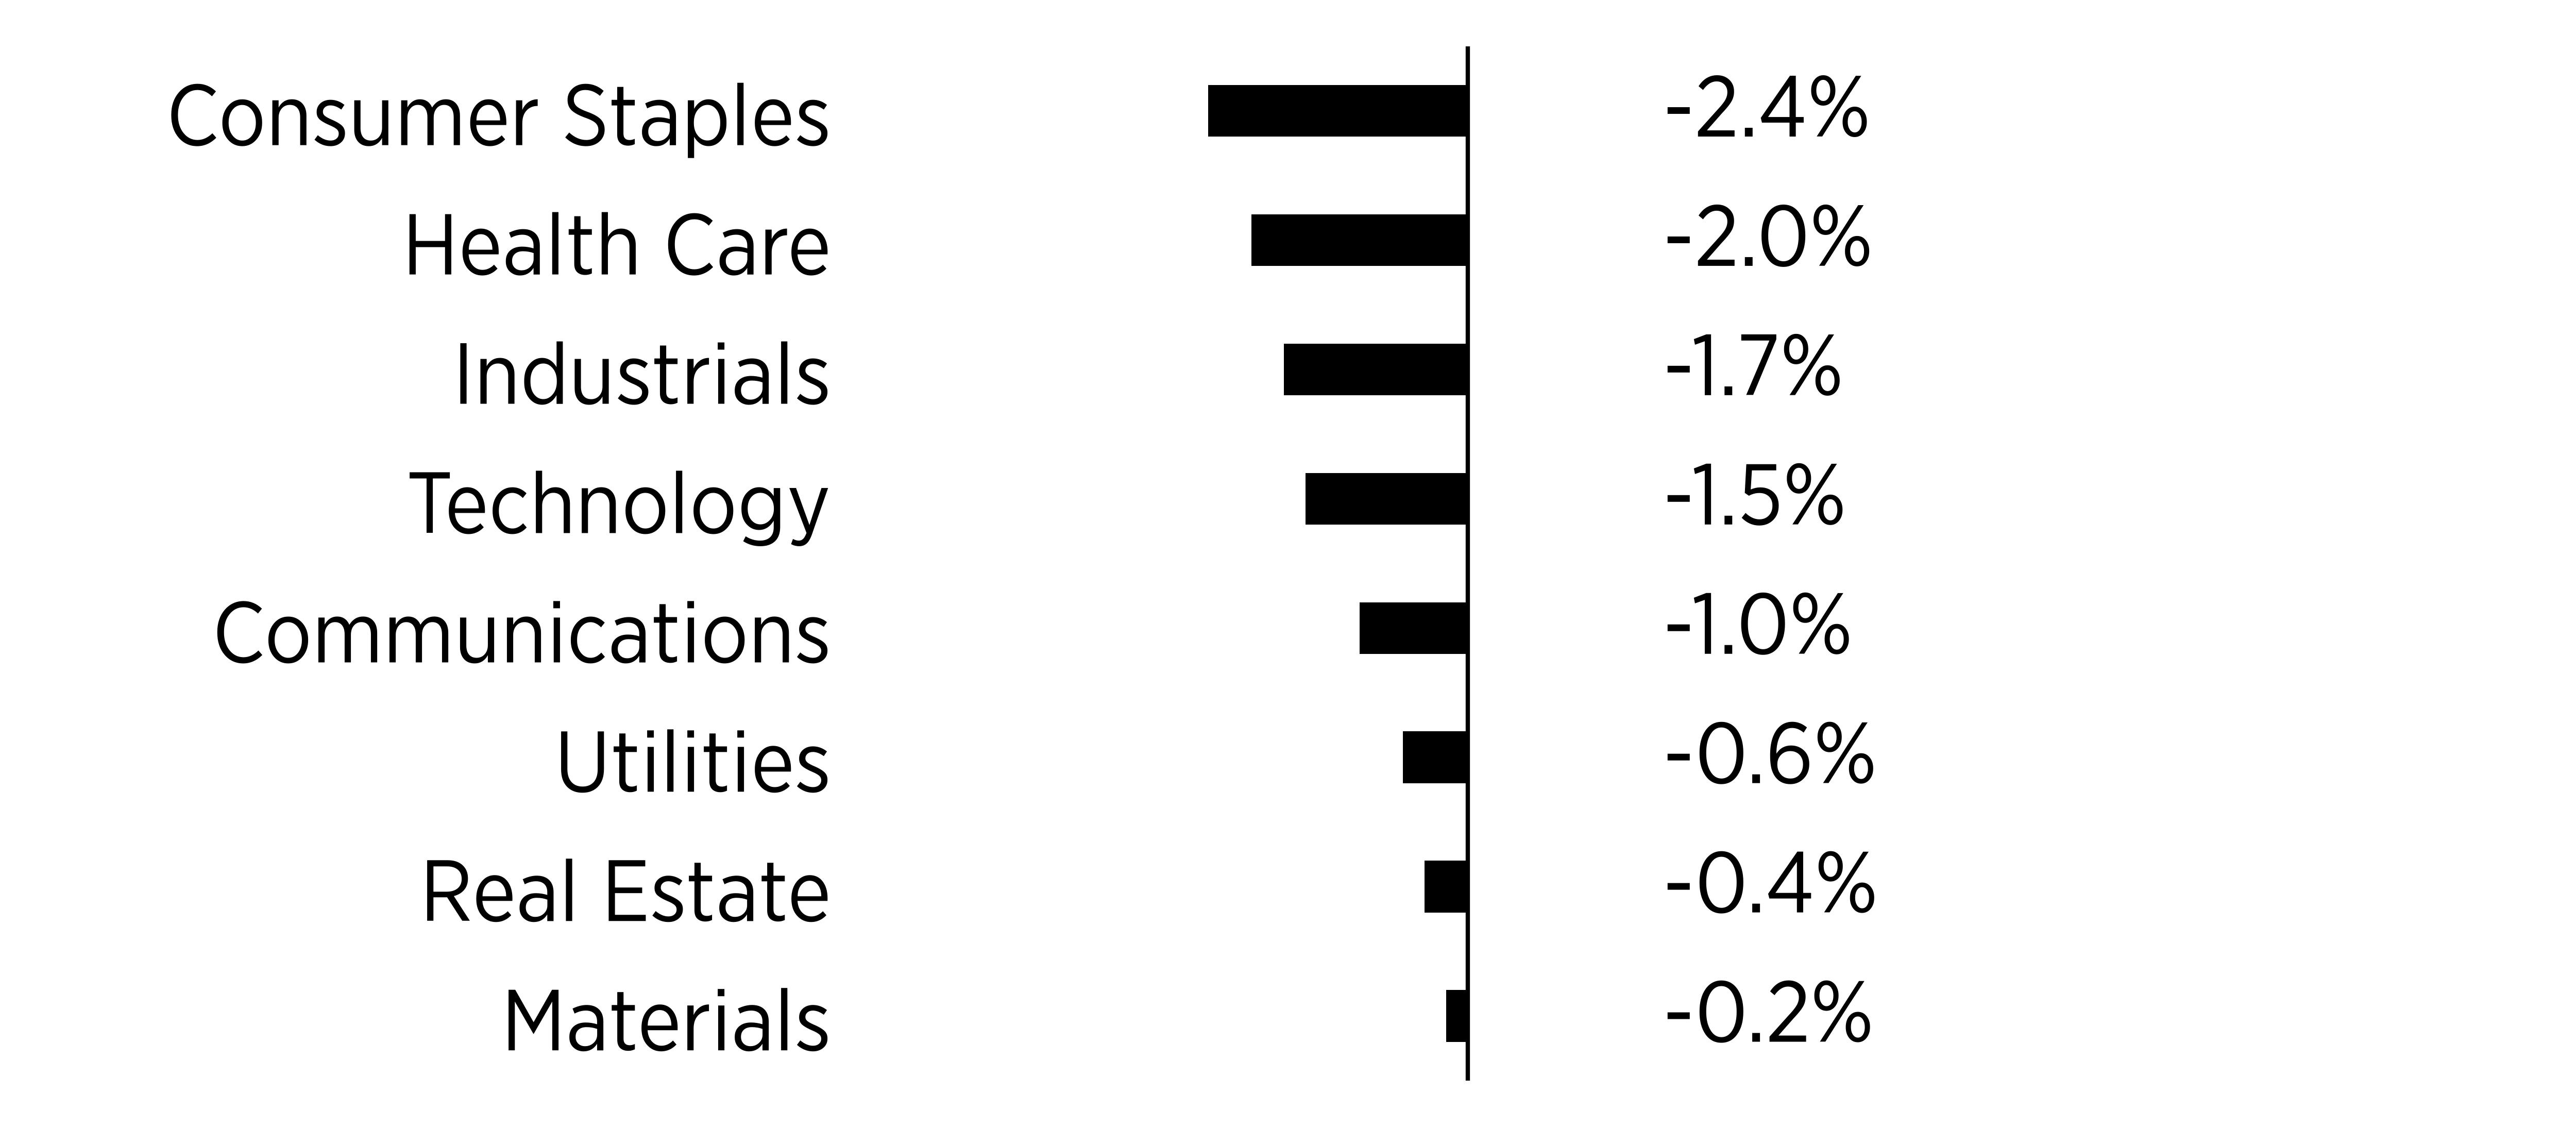
Sector/Security Type - Securities Sold Short
(% of net assets)
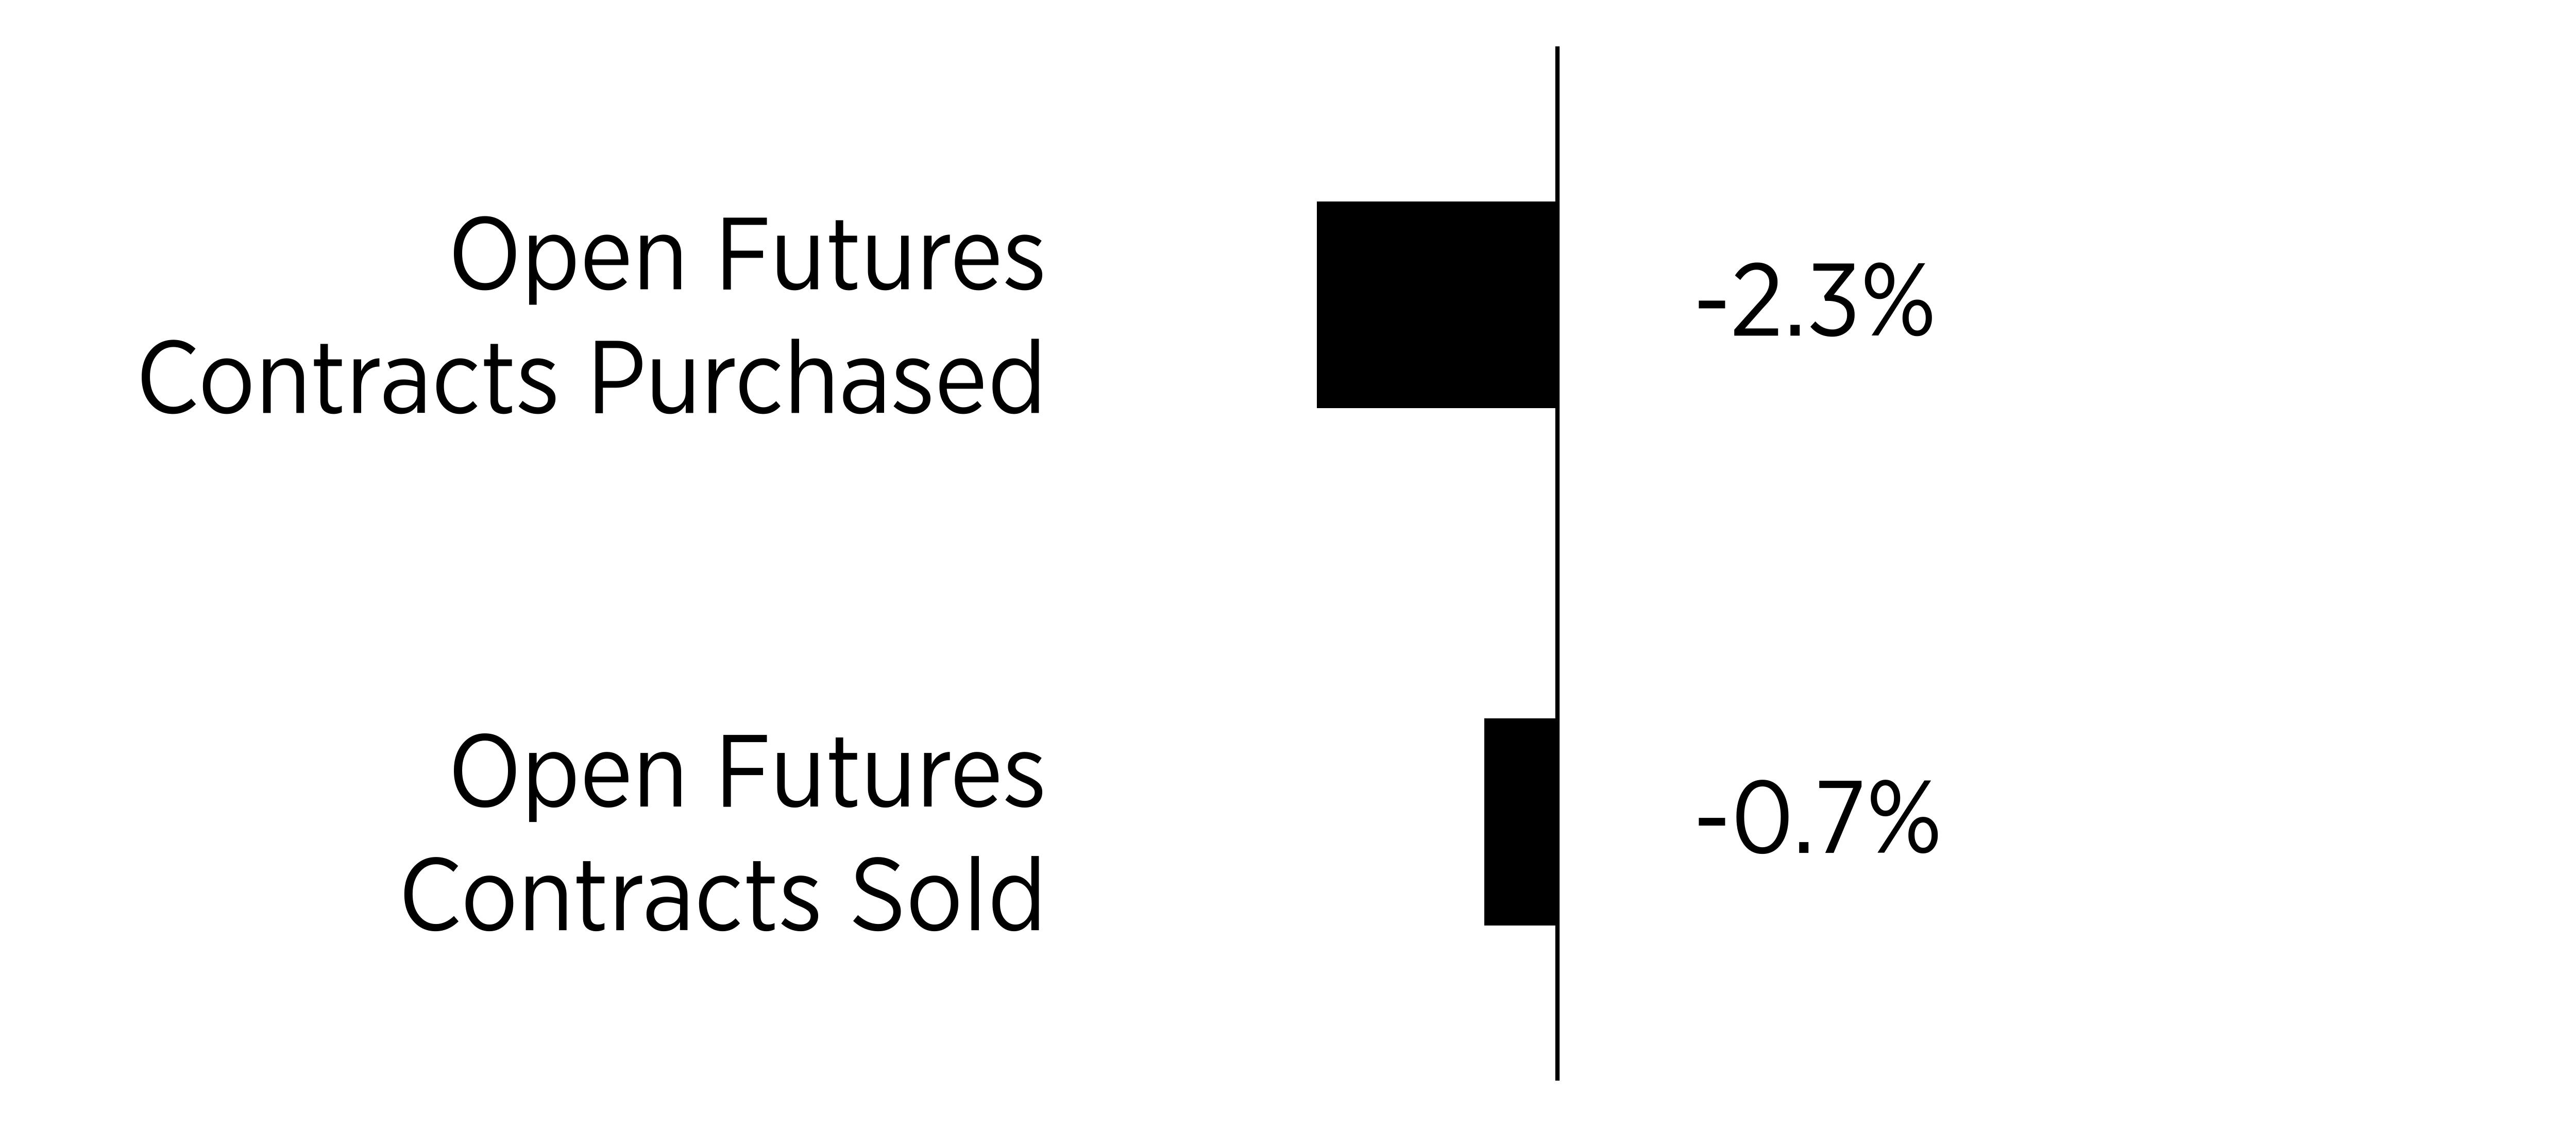
Security Type - Other Financial Instruments
(% of net assets)
| [1] | Costs paid as a percentage of a $10,000 investment is an annualized figure. |