Shareholder Report
Jun. 30, 2026
USD ($)
Holding
What were the Fund costs for the last year?
(Based on a hypothetical $10,000 investment)
| Fund (Class) | Costs of a $10,000 investment | Costs paid as a percentage of a $10,000 investment |
| Virtus Newfleet ABS MACS |
$0 | 0.00% |
What factors impacted Fund performance over the reporting period?
The Fund’s overweight positions in credit cards, timeshares, and unsecured consumer loans, that is, those without collateral, all contributed to performance relative to the ICE BofA 1-3 Year A-BBB U.S. Corporate Index (the "Index") for the 12-month period. Due to a strong economy, spending by U.S. consumers proved resilient during the period. The Fund’s exposure to the consumer, particularly through bonds that were lower in the capital structure, performed well as investor demand for these securities increased. Bonds that are lower in the capital structure have a lower likelihood of being repaid in the event of a default by the bond issuer. The following table outlines key factors that materially affected the Fund’s performance during the reporting period.
| FACTOR | IMPACT | SUMMARY |
| Bluegreen Timeshare |
Positive |
This mezzanine security that is collateralized by timeshare receivables contributed to Fund performance. A mezzanine security is in the middle of the capital structure. The bond’s credit spread compressed during the period, driven by positive performance of the underlying collateral and investor demand. Spread refers to the additional yield over the yield of a risk-free government bond, and credit spread compression generally leads to the prices of existing bonds rising. |
| Moment Home Improvement |
Positive |
This unsecured deal backed by home improvement loans contributed to Fund performance. This is a senior bond in the capital structure from a first-time issuer in the home improvement space. The Fund was given more attractive terms on the securitization because it was a new issuer, and this produced a strong total return for the Fund. |
| Tricolor Subprime Auto |
Negative |
A pool of subprime auto loans originated from Tricolor, which filed for bankruptcy protection in September 2025. The company fraudulently double-pledged its collateral to ABS securitizations and to warehouse lenders. As result, bond prices fell dramatically, driven by the uncertainty of recovering the assets. The bankruptcy case was ongoing as of the end of the reporting period, with an uncertain timeline for recovery. |
| Fat Brands Franchise | Negative | Fat Brands is a franchisor of several brands including Johnny Rockets, Fatburger, and Fazoli’s. Fat Brands filed for bankruptcy in January of 2026. Prior to the bankruptcy, performance of the collateral was negative, driven by an incompetent management team. Collateral underperformance coupled with the bankruptcy filing drove the prices of the bonds lower. However, another lender acquired Fat Brands, and indicated that the senior bonds within the ABS securitization would be paid back close to face value. |
The preceding information is the opinion of portfolio management only through the end of the period stated. Any such opinions are subject to change at any time based upon market or other conditions and should not be relied upon as investment advice. Performance figures assume reinvestment of distributions and exclude the effect of sales charges. Performance data quoted represents past results. Past performance is no guarantee of future results, and there is no guarantee that market forecasts will be realized.
How has the Fund historically performed?
The following graph compares the initial and subsequent account values at the end of each of the most recently completed fiscal years from inception (February 5, 2025). It assumes a $10,000 initial investment from inception, in appropriate broad-based securities market and style-specific indexes for the same period. Performance assumes reinvestment of dividends and capital gain distributions.
GROWTH OF $10,000
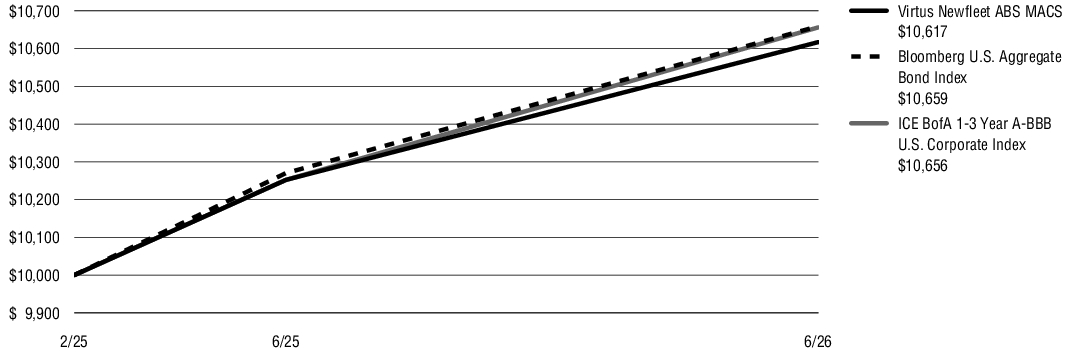
| AVERAGE ANNUAL TOTAL RETURNS for period ended 6/30/26 | 1 Year | Since Inception |
| Virtus Newfleet ABS MACS at NAV(1) | 3.56% | 4.38% |
| Bloomberg U.S. Aggregate Bond Index | 3.79 | 4.68 |
| ICE BofA 1-3 Year A-BBB U.S. Corporate Index | 3.94 | 4.65 |
| (1) |
“NAV” (Net Asset Value) total returns do not include the effect of any sales charge. |
KEY FUND STATISTICS (as of June 30, 2026)
| Fund net assets (‘000s) | $32,401 |
| Total number of portfolio holdings | 86 |
| Total advisory fee paid (‘000s) | $- |
| Portfolio turnover rate as of the end of the reporting period | 39% |
Asset Allocation(1)
| Asset-Backed Securities | 100 | % | |
| Total | 100 | % |
| (1) |
Percentage of total investments as of June 30, 2026. |
What were the Fund costs for the last year?
(Based on a hypothetical $10,000 investment)
| Fund (Class) | Costs of a $10,000 investment | Costs paid as a percentage of a $10,000 investment |
| Virtus Newfleet CMBS MACS |
$0 | 0.00% |
What factors impacted Fund performance over the reporting period?
The Fund slightly outperformed the Bloomberg CMBS Erisa Eligible Bond Index (the "Index"), driven by overall positive credit selection and an overall shorter duration relative to the Index. Duration measures a bond’s or fund’s sensitivity to interest rate or other changes (such as changes in a bond’s yield), and is expressed as several years or days. The higher the number, the greater the risk. The Fund’s exposure to Single Asset Single Borrower (SASB) deals, specifically those backed by trophy office buildings and hospitality properties, was a contributing factor for the period. In addition, the commercial real estate sector increased the availability of transactional data during the period. This provided increased transparency for property valuations, which improved demand for the asset class. The following table outlines key factors that materially affected the Fund’s performance during the reporting period.
| FACTOR | IMPACT | SUMMARY |
| Blackstone 2025-ROIC |
Positive |
A subordinate security that is collateralized by fee simple and leasehold interests in 93 retail properties contributed to Fund performance. Fee simple refers to the broadest possible form of property ownership, including the building, land, and any improvements upon the existing real estate. A leasehold interest is a tenant’s right to use and occupy the property under a lease agreement for a specified period. The portfolio of this security is granular and diverse, with no single asset contributing more than 5.5% of the cash flows. As a floating rate security, it benefited from interest rates moving materially higher during the 12-month period, which resulted in the security having a higher current coupon, or interest payment. |
| MSSG – 237 Park Avenue |
Positive |
A senior security collateralized by a fee simple interest in an office building located at 237 Park Avenue, New York, NY contributed to Fund performance. This security was purchased at a distressed price compared to its value, and rallied in price during the period, driven by the demand for NYC quality office properties. |
| Sort 2020-1 Amazon warehouses |
Negative |
This security is collateralized by newer production warehouses leased to Amazon. The negative performance stemmed from the fact that the security was not refinanced at the maturity date. It was issued in a very low-rate environment, and the sponsor elected to delay refinancing at a higher rate. Since the security carries a below-market coupon, the price dropped to reflect the difference, which caused the bond to underperform. |
| GSMS 2020-GC45 Conduit | Negative | In the context of commercial mortgage-backed securities (CMBS), conduit paper represents a pool of commercial mortgages packaged together for securitization. This conduit deal underperformed for the year, driven by a very low coupon coupled with the credit spread of the bond widening year-over-year. |
The preceding information is the opinion of portfolio management only through the end of the period stated. Any such opinions are subject to change at any time based upon market or other conditions and should not be relied upon as investment advice. Performance figures assume reinvestment of distributions and exclude the effect of sales charges. Performance data quoted represents past results. Past performance is no guarantee of future results, and there is no guarantee that market forecasts will be realized.
How has the Fund historically performed?
The following graph compares the initial and subsequent account values at the end of each of the most recently completed fiscal years from inception (February 5, 2025). It assumes a $10,000 initial investment from inception, in appropriate broad-based securities market and style-specific indexes for the same period. Performance assumes reinvestment of dividends and capital gain distributions.
GROWTH OF $10,000
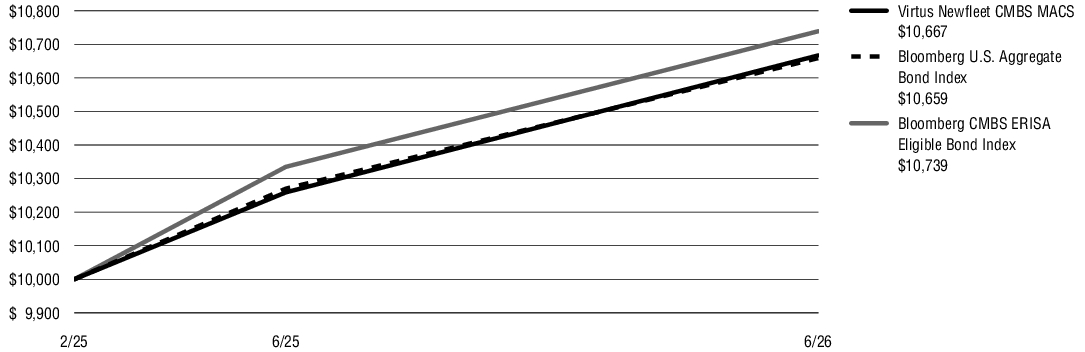
| AVERAGE ANNUAL TOTAL RETURNS for period ended 6/30/26 | 1 Year | Since Inception |
| Virtus Newfleet CMBS MACS at NAV(1) | 3.87% | 4.73% |
| Bloomberg U.S. Aggregate Bond Index | 3.79 | 4.68 |
| Bloomberg CMBS ERISA Eligible Bond Index | 3.91 | 5.23 |
| (1) |
“NAV” (Net Asset Value) total returns do not include the effect of any sales charge. |
KEY FUND STATISTICS (as of June 30, 2026)
| Fund net assets (‘000s) | $16,550 |
| Total number of portfolio holdings | 22 |
| Total advisory fee paid (‘000s) | $- |
| Portfolio turnover rate as of the end of the reporting period | 33% |
Asset Allocation(1)
| Mortgage-Backed Securities | 93 | % | |
| Asset-Backed Securities | 7 | ||
| Total | 100 | % |
| (1) |
Percentage of total investments as of June 30, 2026. |
What were the Fund costs for the last year?
(Based on a hypothetical $10,000 investment)
| Fund (Class) | Costs of a $10,000 investment | Costs paid as a percentage of a $10,000 investment |
| Virtus Newfleet Floating Rate MACS |
$0 | 0.00% |
What factors impacted Fund performance over the reporting period?
The Fund lagged the S&P UBS Leveraged Loan Index for the 12-month period. An overweight to higher-quality loans and an underweight to lower-rated credits added value as higher quality outperformed. Industry positioning was also additive, led by a meaningful underweight to technology, which reached new price lows and saw spreads widen amid concerns about artificial intelligence ("AI")-related disruption over the period. Spread refers to the additional yield over the yield of a risk-free government bond. Underperformance was driven almost entirely by issue selection in three food, packaging, and cable issues that underwent liability management exercises (LMEs). In an LME, a company proactively restructures its debt out of court, which could have negative implications for certain current loan holders. The Fund’s residual cash position was a modest drag during a period of positive loan returns. Selection was otherwise constructive across much of the quality spectrum—including BBB-, split BB-, BB-, and split B-rated issues—as well as in manufacturing, broadcasting, and chemicals. The following table outlines key factors that materially affected the Fund’s performance during the reporting period.
| FACTOR | IMPACT | SUMMARY |
| Positive supply/demand dynamics |
Positive |
The loan market experienced a supply shortfall during the period, which provided support for bond prices. Collateralized loan obligation issuance—which makes up most of the demand in the loan market—was healthy. Meanwhile, new issuance tied to mergers and acquisitions and leveraged buyout deals was muted during the period. |
| Industry positioning |
Positive |
An underweight to technology—the most challenged segment of the loan market over the reporting period—was the standout contributor, with energy, utilities, manufacturing, and chemicals also adding value. |
| Individual security performance |
Negative |
Issue selection was the primary source of underperformance, driven by three credits that underwent LMEs—in food, packaging, and cable. |
| Cash position | Negative | The Fund’s residual cash allocation modestly detracted during a period of positive total returns for the loan market. |
The preceding information is the opinion of portfolio management only through the end of the period stated. Any such opinions are subject to change at any time based upon market or other conditions and should not be relied upon as investment advice. Performance figures assume reinvestment of distributions and exclude the effect of sales charges. Performance data quoted represents past results. Past performance is no guarantee of future results, and there is no guarantee that market forecasts will be realized.
How has the Fund historically performed?
The following graph compares the initial and subsequent account values at the end of each of the most recently completed fiscal years from inception (February 5, 2025). It assumes a $10,000 initial investment from inception, in appropriate broad-based securities market and style-specific indexes for the same period. Performance assumes reinvestment of dividends and capital gain distributions.
GROWTH OF $10,000
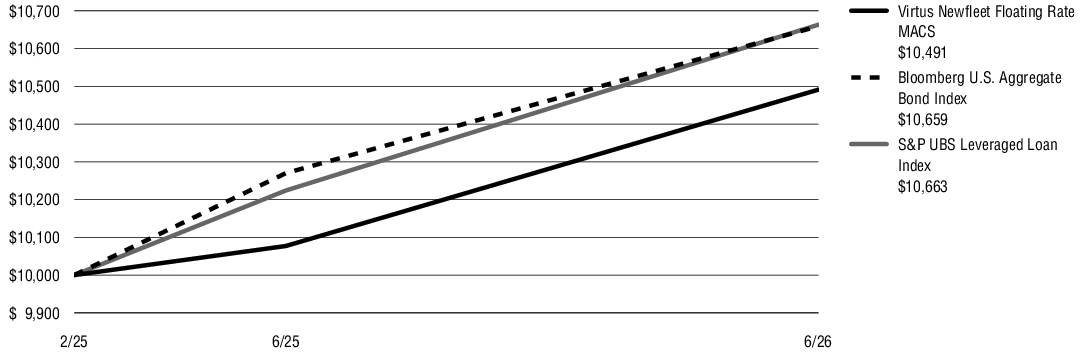
| AVERAGE ANNUAL TOTAL RETURNS for period ended 6/30/26 | 1 Year | Since Inception |
| Virtus Newfleet Floating Rate MACS at NAV(1) | 3.89% | 3.49% |
| Bloomberg U.S. Aggregate Bond Index | 3.79 | 4.68 |
| S&P UBS Leveraged Loan Index | 4.29 | 4.70 |
| (1) |
“NAV” (Net Asset Value) total returns do not include the effect of any sales charge. |
KEY FUND STATISTICS (as of June 30, 2026)
| Fund net assets (‘000s) | $15,622 |
| Total number of portfolio holdings | 179 |
| Total advisory fee paid (‘000s) | $- |
| Portfolio turnover rate as of the end of the reporting period | 49% |
Asset Allocation(1)
| Leveraged Loans | 97 | % | ||
| Health Care | 11 | |||
| Manufacturing | 9 | |||
| Media / Telecom - Cable/Wireless Video | 7 | |||
| Gaming / Leisure | 6 | |||
| Information Technology | 6 | |||
| Financials | 6 | |||
| Service | 5 | |||
| All other Leveraged Loans | 47 | |||
| Exchange-Traded Fund | 3 | |||
| Total | 100 | % |
| (1) |
Percentage of total investments as of June 30, 2026. |
What were the Fund costs for the last year?
(Based on a hypothetical $10,000 investment)
| Fund (Class) | Costs of a $10,000 investment | Costs paid as a percentage of a $10,000 investment |
| Virtus Newfleet High Yield MACS |
$0 | 0.00% |
What factors impacted Fund performance over the reporting period?
Positive issue selection in technology, financial/lease, and satellite, as well as positive issue selection within the single-B rating tier, contributed to the Fund’s outperformance relative to the Bloomberg U.S. High Yield 2% Issuer Capped Bond Index (the "Index"). Issue selection in media cable, consumer products, and industrial other hurt relative performance. The biggest contributors to absolute performance for the 12-month period were bonds issued by Rackspace Technology, Ferrellgas, Community Health, Texas Capital Bancshares, and Telesat Canada. The biggest detractors from absolute performance were bonds issued by CSC Holdings, Kronos Acquisition, Unifrax, SGUS LLC, and Ineos Quattro. The following table outlines key factors that materially affected the Fund’s performance during the reporting period.
| FACTOR | IMPACT | SUMMARY |
| Rally in artificial intelligence ("AI")-related issuers |
Positive |
During the first half of 2026, Rackspace announced several deals related to the company’s enterprise AI business. Investors viewed these announcements favorably, which led to a sharp rally higher in both the equity and bonds of Rackspace. |
| Rise in global oil and natural gas prices due to Middle East conflict |
Positive |
The partial closure of the Strait of Hormuz caused a spike in oil prices and natural gas prices in Europe and Asia. These higher prices led to higher earnings for numerous energy-related firms. Multiple bonds from energy-related issuers performed well during the year due to these improved results and outlook. |
| Cable exposure |
Negative |
Multiple cable issuers posted weaker than expected results during the period. Increased competition from fiber and wireless players caused declines in valuation multiples and higher debt-to-enterprise-value ratios, which generally are considered to indicate higher financial risk. The worsening credit metrics and higher level of uncertainty about future earnings resulted in poor performance by cable bonds, especially those of CSC Holdings. |
| Event risk | Negative | Lingering effects of a fire at one of Kronos Acquisition’s only two distribution centers led to poor earnings results and concerns that the company might run out of available cash. The firm’s large amount of debt and need for more funds caused lenders to become concerned that Kronos would seek to raise new debt that would rank ahead of them in payment priority, leading to a decline in the prices of the company’s outstanding bonds. |
The preceding information is the opinion of portfolio management only through the end of the period stated. Any such opinions are subject to change at any time based upon market or other conditions and should not be relied upon as investment advice. Performance figures assume reinvestment of distributions and exclude the effect of sales charges. Performance data quoted represents past results. Past performance is no guarantee of future results, and there is no guarantee that market forecasts will be realized.
How has the Fund historically performed?
The following graph compares the initial and subsequent account values at the end of each of the most recently completed fiscal years from inception (February 5, 2025). It assumes a $10,000 initial investment from inception, in appropriate broad-based securities market and style-specific indexes for the same period. Performance assumes reinvestment of dividends and capital gain distributions.
GROWTH OF $10,000
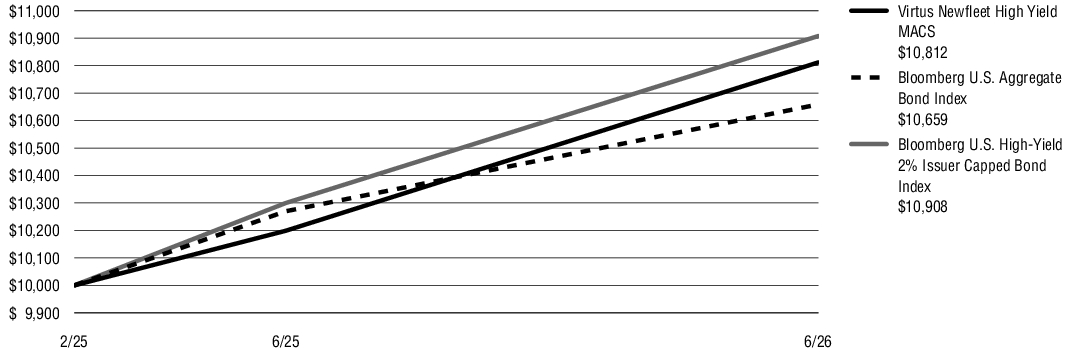
| AVERAGE ANNUAL TOTAL RETURNS for period ended 6/30/26 | 1 Year | Since Inception |
| Virtus Newfleet High Yield MACS at NAV(1) | 6.01% | 5.74% |
| Bloomberg U.S. Aggregate Bond Index | 3.79 | 4.68 |
| Bloomberg U.S. High-Yield 2% Issuer Capped Bond Index | 5.91 | 6.42 |
| (1) |
“NAV” (Net Asset Value) total returns do not include the effect of any sales charge. |
KEY FUND STATISTICS (as of June 30, 2026)
| Fund net assets (‘000s) | $20,596 |
| Total number of portfolio holdings | 213 |
| Total advisory fee paid (‘000s) | $- |
| Portfolio turnover rate as of the end of the reporting period | 48% |
Asset Allocation(1)
| Corporate Bonds and Notes | 99 | % | ||
| Financials | 24 | |||
| Energy | 15 | |||
| Industrials | 14 | |||
| All other Corporate Bonds and Notes | 46 | |||
| Preferred Stock | 1 | |||
| Total | 100 | % |
| (1) |
Percentage of total investments as of June 30, 2026. |
What were the Fund costs for the last year?
(Based on a hypothetical $10,000 investment)
| Fund (Class) | Costs of a $10,000 investment | Costs paid as a percentage of a $10,000 investment |
| Virtus Newfleet RMBS MACS |
$0 | 0.00% |
What factors impacted Fund performance over the reporting period?
The Fund’s yield curve positioning during the period emphasized shorter maturities in an effort to reduce exposure to interest rate risk. A yield curve is a line chart that compares the interest rates of bonds with the same credit quality but different maturity dates. This positioning, as well as an underweight to U.S. agency mortgage-backed securities (MBS), detracted from performance for the period relative to the Bloomberg U.S. Mortgage-Backed Securities Index (the "Index"). Short-term interest rates rose faster than long-term rates during the reporting period, causing the yield curve to flatten, an indicator of a potential economic downturn. The Fund’s yield curve positioning helped to mitigate losses. However, the Index’s agency MBS credit spreads tightened more than the Fund’s non-agency residential mortgage-backed securities (RMBS). Spread refers to the additional yield over the yield of a risk-free government bond. The Index’s holdings benefited from a government announcement launching a large $200 billion agency MBS purchase program, which drove spreads tighter. The Fund’s 100% exposure to RMBS over agency MBS offered competitive risk-adjusted yields but was met with record levels of new issue supply during the period. This weighed on new issue pricing levels versus the Index. A resilient economy and housing market caused valuations of RMBS to tighten and remain firm despite the record supply, allowing for positive total returns. The following table outlines key factors that materially affected the Fund’s performance during the reporting period.
| FACTOR | IMPACT | SUMMARY |
| New issue supply |
Negative |
Supply running roughly 52% higher than the same period in 2025 caused prices and credit spreads to remain near averages despite the solid demand. |
| Underweight to agency MBS while spreads tightened |
Negative |
The Index’s agency MBS credit spreads tightened more than the Fund’s non-agency RMBS holdings. This caused the prices of the agency MBS bonds to rise, and the Fund's lack of exposure to these securities detracted from relative performance. |
| Stringent mortgage underwriting |
Positive |
Prudent underwriting led to low delinquencies among the majority of non-agency RMBS. This resulted in strong credit performance with minimal expected credit losses. |
| Benign interest rate environment | Positive | Limited interest rate changes during the period led to stable mortgage prepayments, which benefited the valuations of mortgage-backed securities. |
The preceding information is the opinion of portfolio management only through the end of the period stated. Any such opinions are subject to change at any time based upon market or other conditions and should not be relied upon as investment advice. Performance figures assume reinvestment of distributions and exclude the effect of sales charges. Performance data quoted represents past results. Past performance is no guarantee of future results, and there is no guarantee that market forecasts will be realized.
How has the Fund historically performed?
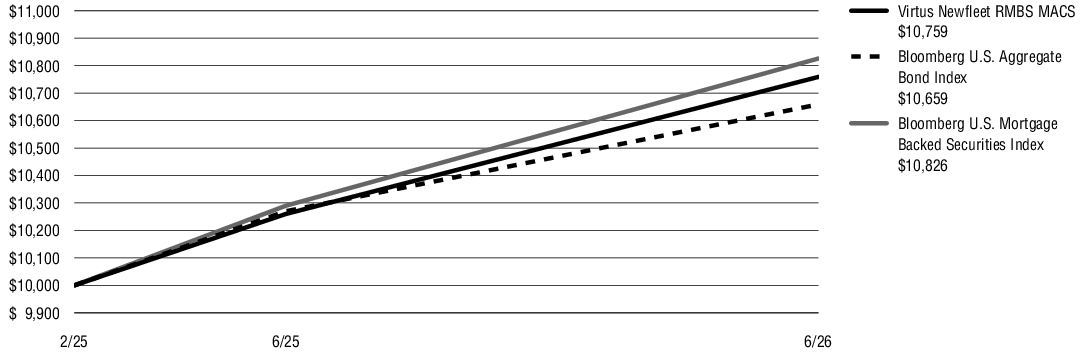
The following graph compares the initial and subsequent account values at the end of each of the most recently completed fiscal years from inception (February 5, 2025). It assumes a $10,000 initial investment from inception, in appropriate broad-based securities market and style-specific indexes for the same period. Performance assumes reinvestment of dividends and capital gain distributions.
GROWTH OF $10,000
| AVERAGE ANNUAL TOTAL RETURNS for period ended 6/30/26 | 1 Year | Since Inception |
| Virtus Newfleet RMBS MACS at NAV(1) | 4.76% | 5.37% |
| Bloomberg U.S. Aggregate Bond Index | 3.79 | 4.68 |
| Bloomberg U.S. Mortgage Backed Securities Index | 5.21 | 5.84 |
| (1) |
“NAV” (Net Asset Value) total returns do not include the effect of any sales charge. |
KEY FUND STATISTICS (as of June 30, 2026)
| Fund net assets (‘000s) | $31,858 |
| Total number of portfolio holdings | 80 |
| Total advisory fee paid (‘000s) | $- |
| Portfolio turnover rate as of the end of the reporting period | 16% |
Asset Allocation(1)
| Mortgage-Backed Securities | 100 | % | |
| Total | 100 | % |
| (1) |
Percentage of total investments as of June 30, 2026. |
What were the Fund costs for the last year?
(Based on a hypothetical $10,000 investment)
| Fund (Class) | Costs of a $10,000 investment | Costs paid as a percentage of a $10,000 investment |
| Virtus Seix High Yield MACS |
$0 | 0.00% |
What factors impacted Fund performance over the reporting period?
The Fund’s underweight to the riskiest parts of the high yield market, as well as security selection in the BB and single-B ratings cohorts led it to underperform the ICE BofA U.S. High Yield Index (the "Index") for the 12-month period. Lower-rated credits outpaced higher-rated credits for the fiscal year. Additionally, certain industries were negatively affected by a projected disruption to their business models from artificial intelligence ("AI"). The Fund focuses on higher-quality, non-registered issues within the high yield space. While the allocation to higher quality enabled the Fund to participate in the market’s performance overall, it was a detractor for the year on a relative basis. For the 12-month period, top industry contributors to relative performance included building construction, technology, and diversified manufacturing/other industrial. Industry detractors from relative performance included financials, services/environmental, and healthcare/pharmaceuticals. The following table outlines key factors that materially affected the Fund’s performance during the reporting period.
| FACTOR | IMPACT | SUMMARY |
| Ratings allocation |
Slightly negative |
The Fund’s underweight to single-B- and CCC-rated credits detracted from relative performance. This was partially offset by an underweight to CC-rated bonds. |
| Issue selection |
Negative |
The Fund’s issue selection detracted from performance relative to the Index. Negative issue selection within financials, services/environmental, and energy offset successful selection within building construction, consumer products/textile/tobacco, and technology. |
| Credit spreads tightened |
Positive |
Credit spread refers to the additional yield of a particular bond over the yield of a risk-free government bond. As spreads tighten, indicating that investors view a bond as less risky, the value of the bond goes up. While certain ratings groups performed better than others during the period – spreads tightened more in lower-quality than in higher-quality bonds – higher-quality issues also benefited from spread tightening, which improved the total return for the Fund. |
The preceding information is the opinion of portfolio management only through the end of the period stated. Any such opinions are subject to change at any time based upon market or other conditions and should not be relied upon as investment advice. Performance figures assume reinvestment of distributions and exclude the effect of sales charges. Performance data quoted represents past results. Past performance is no guarantee of future results, and there is no guarantee that market forecasts will be realized.
How has the Fund historically performed?
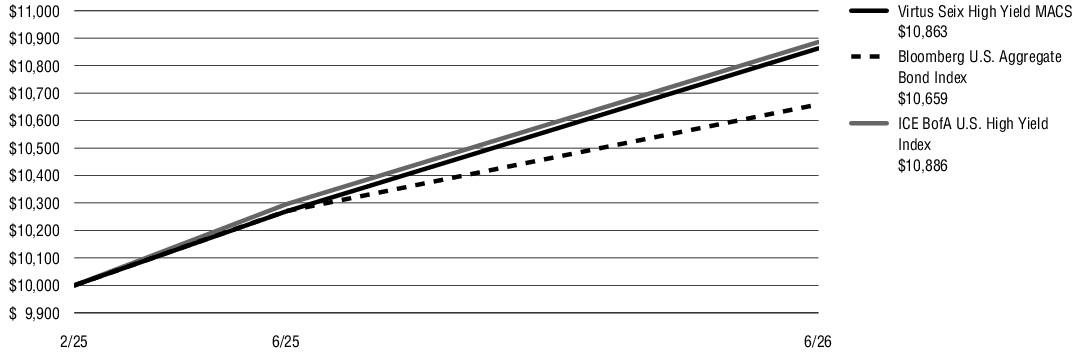
The following graph compares the initial and subsequent account values at the end of each of the most recently completed fiscal years from inception (February 5, 2025). It assumes a $10,000 initial investment from inception, in appropriate broad-based securities market and style-specific indexes for the same period. Performance assumes reinvestment of dividends and capital gain distributions.
GROWTH OF $10,000
| AVERAGE ANNUAL TOTAL RETURNS for period ended 6/30/26 | 1 Year | Since Inception |
| Virtus Seix High Yield MACS at NAV(1) | 5.68% | 6.10% |
| Bloomberg U.S. Aggregate Bond Index | 3.79 | 4.68 |
| ICE BofA U.S. High Yield Index | 5.74 | 6.27 |
| (1) |
“NAV” (Net Asset Value) total returns do not include the effect of any sales charge. |
KEY FUND STATISTICS (as of June 30, 2026)
| Fund net assets (‘000s) | $8,488 |
| Total number of portfolio holdings | 126 |
| Total advisory fee paid (‘000s) | $- |
| Portfolio turnover rate as of the end of the reporting period | 36% |
Asset Allocation(1)
| Corporate Bonds and Notes | 100 | % | ||
| Industrials | 21 | |||
| Consumer Discretionary | 17 | |||
| Financials | 14 | |||
| Energy | 14 | |||
| Health Care | 7 | |||
| Communication Services | 7 | |||
| Information Technology | 7 | |||
| All other Corporate Bonds and Notes | 13 | |||
| Total | 100 | % |
| (1) |
Percentage of total investments as of June 30, 2026. |
What were the Fund costs for the last year?
(Based on a hypothetical $10,000 investment)
| Fund (Class) | Costs of a $10,000 investment | Costs paid as a percentage of a $10,000 investment |
| Virtus Stone Harbor EMD MACS |
$0 | 0.00% |
What factors impacted Fund performance over the reporting period?
Country and issue selection decisions had a positive impact on performance relative to the J.P. Morgan CEMBI Broad Diversified Index (the "Index"), for the reporting period. Exposures in all regions contributed to performance. Issue selection in Argentina was the single largest contributor, while overweights in Ghana and Ukraine were also significant contributors. In terms of industry attribution, an overweight to energy exploration & production (E&P) was a large contributor to performance, as was issue selection in the electric industry. The Fund’s overweight to Brazil negatively impacted performance, as did issue selection in the services/other industry. Overweight exposure to lower-quality credits had a positive impact, as did the Fund’s underweight to higher-rated credits. Issue selection within BB-rated bonds detracted from relative returns. The following table outlines key factors that materially affected the Fund’s performance during the reporting period.
| FACTOR | IMPACT | SUMMARY |
| Argentina |
Positive |
Issue selection, particularly in Albanesi, a thermal power and gas generator in Argentina, contributed to performance relative to the Index. |
| India |
Positive |
Issue selection in Vedanta, India’s leading diversified natural resources company, and Adani, an integrated business conglomerate, enhanced relative performance during the period. |
| Brazil |
Negative |
An overweight to Brazil and issue selection, particularly in Ambipar, a global environmental solutions provider, and Raizen, an energy company, detracted from relative performance. |
| Services/other | Negative | An underweight to and issue selection in Hong Kong detracted from relative performance. |
The preceding information is the opinion of portfolio management only through the end of the period stated. Any such opinions are subject to change at any time based upon market or other conditions and should not be relied upon as investment advice. Performance figures assume reinvestment of distributions and exclude the effect of sales charges. Performance data quoted represents past results. Past performance is no guarantee of future results, and there is no guarantee that market forecasts will be realized.
How has the Fund historically performed?
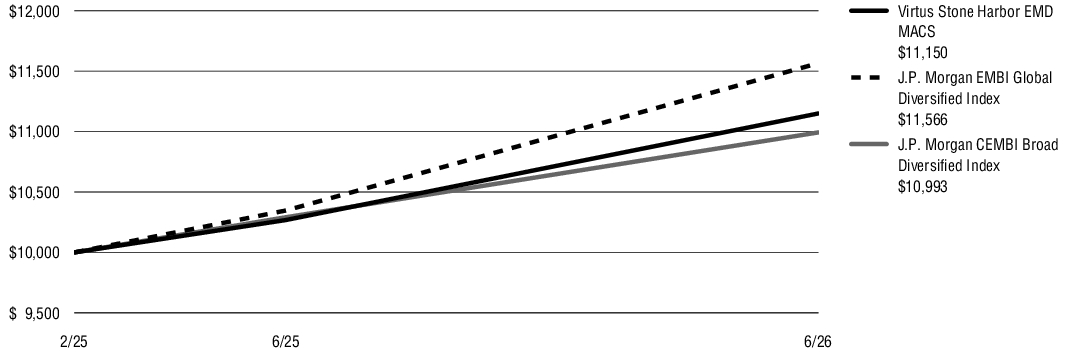
The following graph compares the initial and subsequent account values at the end of each of the most recently completed fiscal years from inception (February 5, 2025). It assumes a $10,000 initial investment from inception, in appropriate broad-based securities market and style-specific indexes for the same period. Performance assumes reinvestment of dividends and capital gain distributions.
GROWTH OF $10,000
| AVERAGE ANNUAL TOTAL RETURNS for period ended 6/30/26 | 1 Year | Since Inception |
| Virtus Stone Harbor EMD MACS at NAV(1) | 8.59% | 8.10% |
| J.P. Morgan EMBI Global Diversified Index | 11.78 | 10.97 |
| J.P. Morgan CEMBI Broad Diversified Index | 6.82 | 7.01 |
| (1) |
“NAV” (Net Asset Value) total returns do not include the effect of any sales charge. |
KEY FUND STATISTICS (as of June 30, 2026)
| Fund net assets (‘000s) | $5,196 |
| Total number of portfolio holdings | 146 |
| Total advisory fee paid (‘000s) | $- |
| Portfolio turnover rate as of the end of the reporting period | 40% |
Asset Allocation(1)
| Corporate Bonds and Notes | 96 | % | ||
| Electric | 15 | |||
| Financial & Lease | 13 | |||
| Exploration & Production | 11 | |||
| Wireless | 9 | |||
| Financials | 7 | |||
| Industrial Other | 4 | |||
| Gaming | 4 | |||
| Metals, Mining & Steel | 4 | |||
| Technology | 3 | |||
| Media Cable | 2 | |||
| All other Corporate Bonds and Notes | 24 | |||
| Foreign Government Security | 4 | |||
| Total | 100 | % |
| (1) |
Percentage of total investments as of June 30, 2026. |