Shareholder Report
Jun. 30, 2026
USD ($)
Holding
This report describes changes to the Fund that occurred during the reporting period.
What were the Fund costs for the last year? (based on a hypothetical $10,000 investment)
| Cost of a $10,000 investment | Costs paid as a percentage of $10,000 investment* | |||
| Class I Shares |
$80 | 0.73% | ||
| * | Annualized for period less than one year. |
How did the Fund perform last year? What affected the Fund’s performance?
| Performance Highlights The Nuveen International Value Fund returned 18.80% for Class I Shares at net asset value (NAV) for the 12 months ended June 30, 2026. The Fund underperformed the MSCI EAFE Index (Net), which returned 20.23%. Top contributors to relative performance • Security selection and an overweight allocation to the financials sector, led by overweights to ING Groep N.V. and Societe Generale S.A., as well as an out-of-benchmark position in UBS Group AG. • Out-of-benchmark position in Taiwan Semiconductor Manufacturing Co., Ltd. • Underweight allocation to the communication services sector, including lack of exposure to Nintendo Co. Ltd and Spotify Technology SA. Top detractors from relative performance • Security selection and an underweight allocation to the information technology sector, including lack of exposure to ASML Holding NV and an overweight to Capgemini SE. • Security selection in the industrials sector, including overweights to Alstom SA, Thales SA and Wolters Kluwer N.V. • Security selection in the energy sector, including an out-of-benchmark position in Technip Energies NV. |
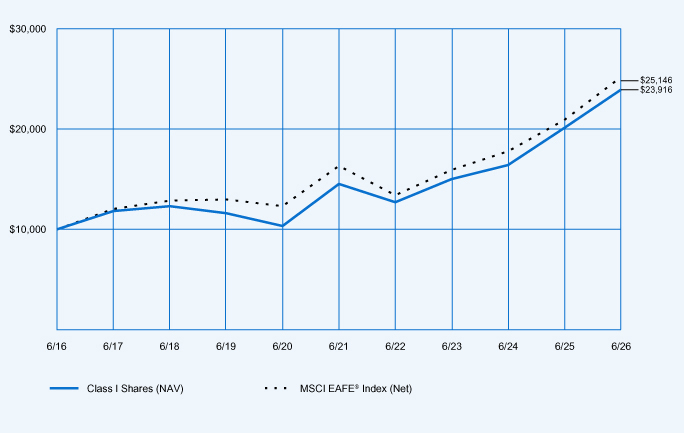
Average Annual Total Returns
| 1-Year | 5-Year | 10-Year | ||||||||||
| Class I Shares at NAV |
18.80 | % | 10.47 | % | 9.11 | % | ||||||
| MSCI EAFE® Index (Net) |
20.23 | % | 9.05 | % | 9.66 | % | ||||||
| Lipper International Multi-Cap Value Funds Classification Average |
23.72 | % | 10.60 | % | 9.54 | % | ||||||
Fund Statistics (as of June 30, 2026)
| Fund net assets |
$1,220,935,747 | |||
| Total number of portfolio holdings |
55 | |||
| Portfolio turnover (%) |
38% | |||
| Total management fees paid for the year |
$ 6,387,785 | |||
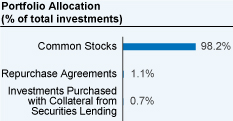 |
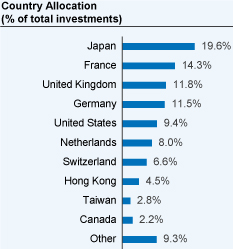 |
How has the Fund changed?
For more complete information, you may review the Fund’s next prospectus, which is expected to be available by October 30, 2026 at https://www.nuveen.com/en-us/mutual-funds/prospectuses or upon request at (800) 257-8787.
For more complete information, you may review the Fund’s next prospectus, which is expected to be available by October 30, 2026 at https://www.nuveen.com/en-us/mutual-funds/prospectuses or upon request at (800) 257-8787.
This report describes changes to the Fund that occurred during the reporting period.
What were the Fund costs for the last year? (based on a hypothetical $10,000 investment)
| Cost of a $10,000 investment | Costs paid as a percentage of $10,000 investment* | |||
| Class C Shares |
$188 | 1.73% | ||
| * | Annualized for period less than one year. |
How did the Fund perform last year? What affected the Fund’s performance?
| Performance Highlights The Nuveen International Value Fund returned 17.64% for Class C Shares at net asset value (NAV) for the 12 months ended June 30, 2026. The Fund underperformed the MSCI EAFE Index (Net), which returned 20.23%. Top contributors to relative performance • Security selection and an overweight allocation to the financials sector, led by overweights to ING Groep N.V. and Societe Generale S.A., as well as an out-of-benchmark position in UBS Group AG. • Out-of-benchmark position in Taiwan Semiconductor Manufacturing Co., Ltd. • Underweight allocation to the communication services sector, including lack of exposure to Nintendo Co. Ltd and Spotify Technology SA. Top detractors from relative performance • Security selection and an underweight allocation to the information technology sector, including lack of exposure to ASML Holding NV and an overweight to Capgemini SE. • Security selection in the industrials sector, including overweights to Alstom SA, Thales SA and Wolters Kluwer N.V. • Security selection in the energy sector, including an out-of-benchmark position in Technip Energies NV. |
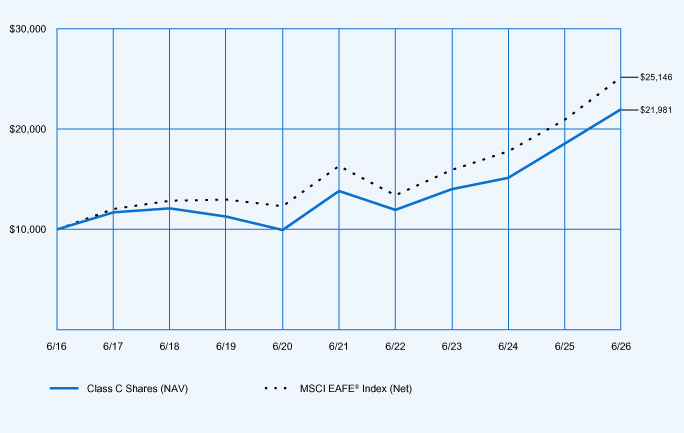
Average Annual Total Returns
| 1-Year | 5-Year | 10-Year | ||||||||||
| Class C Shares at NAV (excluding maximum sales charge) |
17.64 | % | 9.37 | % | 8.19 | % | ||||||
| MSCI EAFE® Index (Net) |
20.23 | % | 9.05 | % | 9.66 | % | ||||||
| Lipper International Multi-Cap Value Funds Classification Average |
23.72 | % | 10.60 | % | 9.54 | % | ||||||
Fund Statistics (as of June 30, 2026)
| Fund net assets |
$1,220,935,747 | |||
| Total number of portfolio holdings |
55 | |||
| Portfolio turnover (%) |
38% | |||
| Total management fees paid for the year |
$ 6,387,785 | |||
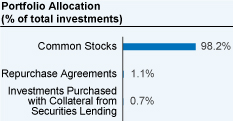 |
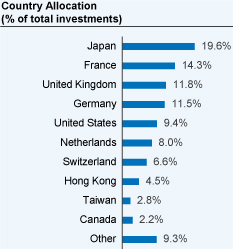 |
How has the Fund changed?
For more complete information, you may review the Fund’s next prospectus, which is expected to be available by October 30, 2026 at https://www.nuveen.com/en-us/mutual-funds/prospectuses or upon request at (800) 257-8787.
For more complete information, you may review the Fund’s next prospectus, which is expected to be available by October 30, 2026 at https://www.nuveen.com/en-us/mutual-funds/prospectuses or upon request at (800) 257-8787.
This report describes changes to the Fund that occurred during the reporting period.
What were the Fund costs for the last year? (based on a hypothetical $10,000 investment)
| Cost of a $10,000 investment | Costs paid as a percentage of $10,000 investment* | |||
| Class A Shares |
$107 | 0.98% | ||
| * | Annualized for period less than one year. |
How did the Fund perform last year? What affected the Fund’s performance?
| Performance Highlights The Nuveen International Value Fund returned 18.54% for Class A Shares at net asset value (NAV) for the 12 months ended June 30, 2026. The Fund underperformed the MSCI EAFE Index (Net), which returned 20.23%. Top contributors to relative performance • Security selection and an overweight allocation to the financials sector, led by overweights to ING Groep N.V. and Societe Generale S.A., as well as an out-of-benchmark position in UBS Group AG. • Out-of-benchmark position in Taiwan Semiconductor Manufacturing Co., Ltd. • Underweight allocation to the communication services sector, including lack of exposure to Nintendo Co. Ltd and Spotify Technology SA. Top detractors from relative performance • Security selection and an underweight allocation to the information technology sector, including lack of exposure to ASML Holding NV and an overweight to Capgemini SE. • Security selection in the industrials sector, including overweights to Alstom SA, Thales SA and Wolters Kluwer N.V. • Security selection in the energy sector, including an out-of-benchmark position in Technip Energies NV. |
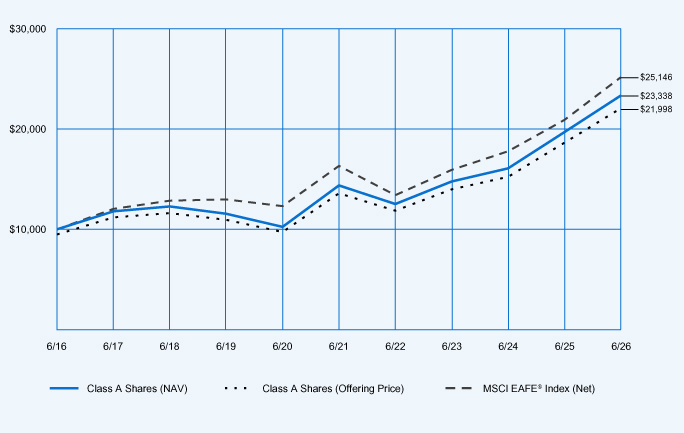
Average Annual Total Returns
| 1-Year | 5-Year | 10-Year | ||||||||||
| Class A Shares at NAV (excluding maximum sales charge) |
18.54 | % | 10.20 | % | 8.84 | % | ||||||
| Class A Shares at maximum sales charge (Offering Price) |
11.73 | % | 8.90 | % | 8.20 | % | ||||||
| MSCI EAFE® Index (Net) |
20.23 | % | 9.05 | % | 9.66 | % | ||||||
| Lipper International Multi-Cap Value Funds Classification Average |
23.72 | % | 10.60 | % | 9.54 | % | ||||||
Fund Statistics (as of June 30, 2026)
| Fund net assets |
$1,220,935,747 | |||
| Total number of portfolio holdings |
55 | |||
| Portfolio turnover (%) |
38% | |||
| Total management fees paid for the year |
$ 6,387,785 | |||
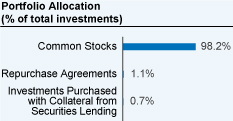 |
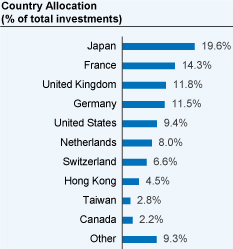 |
How has the Fund changed?
For more complete information, you may review the Fund’s next prospectus, which is expected to be available by October 30, 2026 at https://www.nuveen.com/en-us/mutual-funds/prospectuses or upon request at (800) 257-8787.
For more complete information, you may review the Fund’s next prospectus, which is expected to be available by October 30, 2026 at https://www.nuveen.com/en-us/mutual-funds/prospectuses or upon request at (800) 257-8787.
| [1] | Annualized for period less than one year. |
| [2] | Annualized for period less than one year. |
| [3] | Annualized for period less than one year. |