Shareholder Report
|
6 Months Ended |
|
Jun. 30, 2026
USD ($)
Holding
|
|---|
| Shareholder Report [Line Items] |
|
| Document Type |
N-CSRS
|
| Amendment Flag |
false
|
| Registrant Name |
Pacific Select Fund
|
| Entity Central Index Key |
0000813900
|
| Entity Investment Company Type |
N-1A
|
| Document Period End Date |
Jun. 30, 2026
|
| Shareholder Report Annual or Semi-Annual |
Semi-Annual Shareholder Report
|
| C000253928 |
|
| Shareholder Report [Line Items] |
|
| Fund Name |
Bond Plus Portfolio
|
| Class Name |
Class I
|
| No Trading Symbol [Flag] |
true
|
| Annual or Semi-Annual Statement [Text Block] |
This semi-annual shareholder report contains important information about the Bond Plus Portfolio (the "Fund") for the period of January 1, 2026 to June 30, 2026.
|
| Additional Information [Text Block] |
You can find additional information about the Fund at http://www.pacificlife.com/pacificselectfund.html. You can also request this information free of charge by contacting us toll-free at 800-722-4448 or sending an email request to PSFdocumentrequest@pacificlife.com.
|
| Additional Information Phone Number |
800-722-4448
|
| Additional Information Email |
<span style="box-sizing: border-box; color: rgb(0, 0, 0); display: inline; flex-wrap: nowrap; font-size: 12px; font-weight: 400; grid-area: auto; line-height: 14.4px; margin: 0px; overflow: visible; text-align: left; text-align-last: auto; white-space-collapse: preserve-breaks;">PSFdocumentrequest@pacificlife.com</span>
|
| Additional Information Website |
<span style="box-sizing: border-box; color: rgb(0, 0, 0); display: inline; flex-wrap: nowrap; font-size: 12px; font-weight: 400; grid-area: auto; line-height: 14.4px; margin: 0px; overflow: visible; text-align: left; text-align-last: auto; white-space-collapse: preserve-breaks;">http://www.pacificlife.com/pacificselectfund.html</span>
|
| Expenses [Text Block] |
What were the Fund costs for the last six months?(based on a hypothetical $10,000 investment; costs paid as a percentage of a $10,000 investment is annualized) Table SummaryClass Name | Cost of a $10,000 investment | Costs paid as a percentage of a $10,000 investment |
|---|
Class I | $33 | 0.66% |
|---|
|
| Expenses Paid, Amount |
$ 33
|
| Expense Ratio, Percent |
0.66%
|
| AssetsNet |
$ 523,975,569
|
| Holdings Count | Holding |
416
|
| InvestmentCompanyPortfolioTurnover |
14.00%
|
| Additional Fund Statistics [Text Block] |
Key Fund Statistics as of June 30, 2026- Total Net Assets$523,975,569
- # of Portfolio Holdings416
- Year-to-Date Total Return0.40%
- Portfolio Turnover Rate14%
Returns provided do not reflect fees and expenses of any variable annuity contract or variable life insurance policy; if these fees and expenses were included, the returns shown would be lower. |
| Holdings [Text Block] |
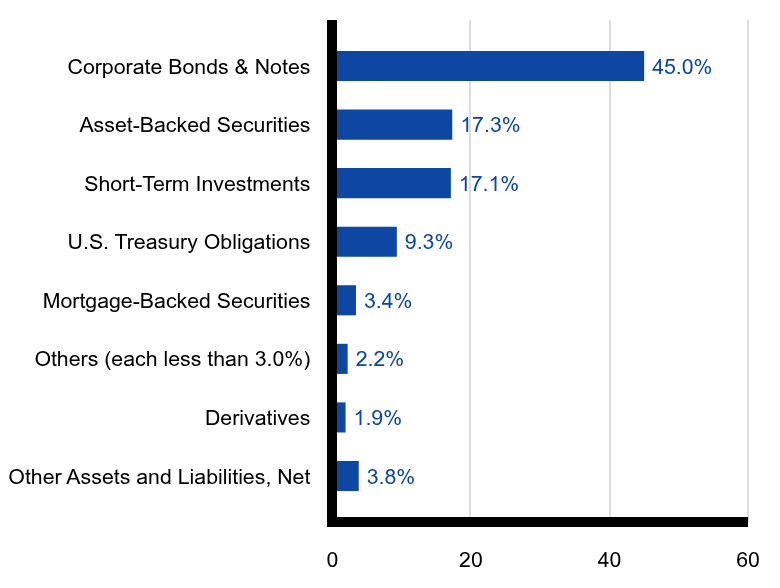
Fund's Composition (% of Total Net Assets)Table SummaryValue | Value |
|---|
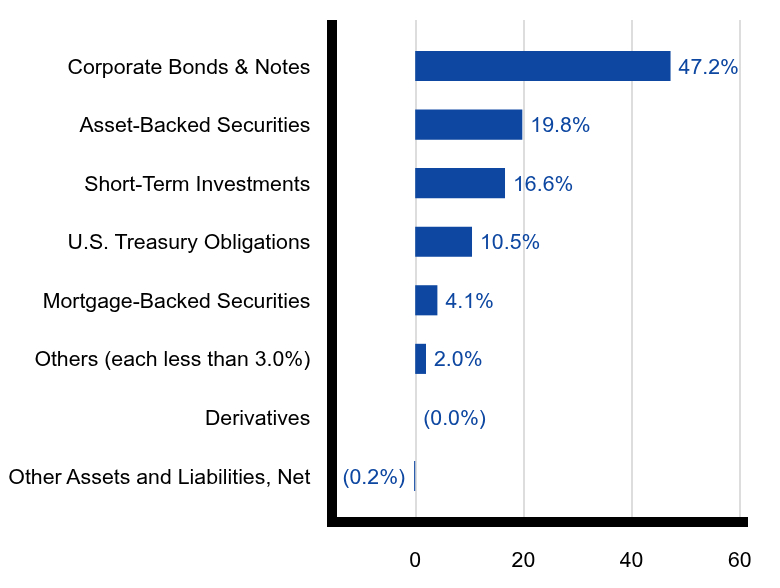
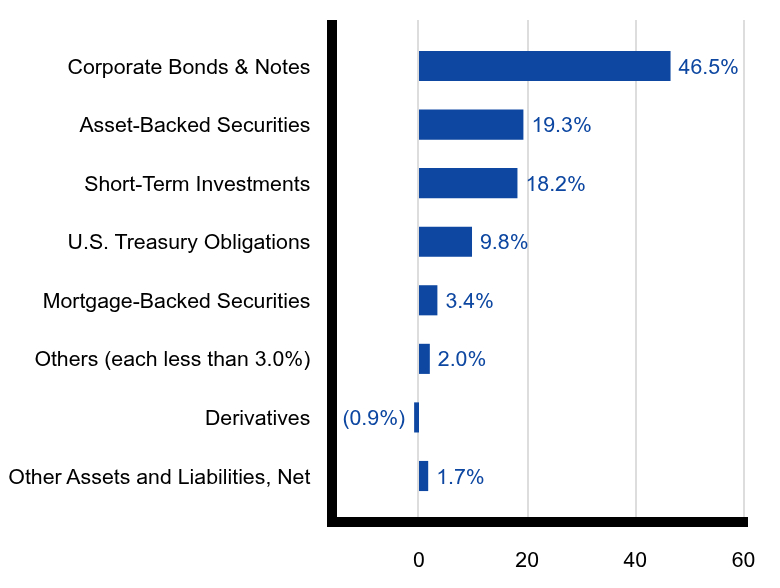
Other Assets and Liabilities, Net | (0.2%) | Derivatives | (0.0%) | Others (each less than 3.0%) | 2.0% | Mortgage-Backed Securities | 4.1% | U.S. Treasury Obligations | 10.5% | Short-Term Investments | 16.6% | Asset-Backed Securities | 19.8% | Corporate Bonds & Notes | 47.2% | |
| C000253927 |
|
| Shareholder Report [Line Items] |
|
| Fund Name |
Bond Plus Portfolio
|
| Class Name |
Class P
|
| No Trading Symbol [Flag] |
true
|
| Annual or Semi-Annual Statement [Text Block] |
This semi-annual shareholder report contains important information about the Bond Plus Portfolio (the "Fund") for the period of January 1, 2026 to June 30, 2026.
|
| Additional Information [Text Block] |
You can find additional information about the Fund at http://www.pacificlife.com/pacificselectfund.html. You can also request this information free of charge by contacting us toll-free at 800-722-4448 or sending an email request to PSFdocumentrequest@pacificlife.com.
|
| Additional Information Phone Number |
800-722-4448
|
| Additional Information Email |
<span style="box-sizing: border-box; color: rgb(0, 0, 0); display: inline; flex-wrap: nowrap; font-size: 12px; font-weight: 400; grid-area: auto; line-height: 14.4px; margin: 0px; overflow: visible; text-align: left; text-align-last: auto; white-space-collapse: preserve-breaks;">PSFdocumentrequest@pacificlife.com</span>
|
| Additional Information Website |
<span style="box-sizing: border-box; color: rgb(0, 0, 0); display: inline; flex-wrap: nowrap; font-size: 12px; font-weight: 400; grid-area: auto; line-height: 14.4px; margin: 0px; overflow: visible; text-align: left; text-align-last: auto; white-space-collapse: preserve-breaks;">http://www.pacificlife.com/pacificselectfund.html</span>
|
| Expenses [Text Block] |
What were the Fund costs for the last six months?(based on a hypothetical $10,000 investment; costs paid as a percentage of a $10,000 investment is annualized) Table SummaryClass Name | Cost of a $10,000 investment | Costs paid as a percentage of a $10,000 investment |
|---|
Class P | $23 | 0.46% |
|---|
|
| Expenses Paid, Amount |
$ 23
|
| Expense Ratio, Percent |
0.46%
|
| AssetsNet |
$ 523,975,569
|
| Holdings Count | Holding |
416
|
| InvestmentCompanyPortfolioTurnover |
14.00%
|
| Additional Fund Statistics [Text Block] |
Key Fund Statistics as of June 30, 2026- Total Net Assets$523,975,569
- # of Portfolio Holdings416
- Year-to-Date Total Return0.50%
- Portfolio Turnover Rate14%
Returns provided do not reflect fees and expenses of any variable annuity contract or variable life insurance policy; if these fees and expenses were included, the returns shown would be lower. |
| Holdings [Text Block] |
Fund's Composition (% of Total Net Assets)Table SummaryValue | Value |
|---|
Other Assets and Liabilities, Net | (0.2%) | Derivatives | (0.0%) | Others (each less than 3.0%) | 2.0% | Mortgage-Backed Securities | 4.1% | U.S. Treasury Obligations | 10.5% | Short-Term Investments | 16.6% | Asset-Backed Securities | 19.8% | Corporate Bonds & Notes | 47.2% | |
| C000153750 |
|
| Shareholder Report [Line Items] |
|
| Fund Name |
Core Income Portfolio
|
| Class Name |
Class I
|
| No Trading Symbol [Flag] |
true
|
| Annual or Semi-Annual Statement [Text Block] |
This semi-annual shareholder report contains important information about the Core Income Portfolio (the "Fund") for the period of January 1, 2026 to June 30, 2026.
|
| Additional Information [Text Block] |
You can find additional information about the Fund at http://www.pacificlife.com/pacificselectfund.html. You can also request this information free of charge by contacting us toll-free at 800-722-4448 or sending an email request to PSFdocumentrequest@pacificlife.com.
|
| Additional Information Phone Number |
800-722-4448
|
| Additional Information Email |
<span style="box-sizing: border-box; color: rgb(0, 0, 0); display: inline; flex-wrap: nowrap; font-size: 12px; font-weight: 400; grid-area: auto; line-height: 14.4px; margin: 0px; overflow: visible; text-align: left; text-align-last: auto; white-space-collapse: preserve-breaks;">PSFdocumentrequest@pacificlife.com</span>
|
| Additional Information Website |
<span style="box-sizing: border-box; color: rgb(0, 0, 0); display: inline; flex-wrap: nowrap; font-size: 12px; font-weight: 400; grid-area: auto; line-height: 14.4px; margin: 0px; overflow: visible; text-align: left; text-align-last: auto; white-space-collapse: preserve-breaks;">http://www.pacificlife.com/pacificselectfund.html</span>
|
| Expenses [Text Block] |
What were the Fund costs for the last six months?(based on a hypothetical $10,000 investment; costs paid as a percentage of a $10,000 investment is annualized) Table SummaryClass Name | Cost of a $10,000 investment | Costs paid as a percentage of a $10,000 investment |
|---|
Class I | $38 | 0.76% |
|---|
|
| Expenses Paid, Amount |
$ 38
|
| Expense Ratio, Percent |
0.76%
|
| AssetsNet |
$ 324,342,335
|
| Holdings Count | Holding |
377
|
| InvestmentCompanyPortfolioTurnover |
46.00%
|
| Additional Fund Statistics [Text Block] |
Key Fund Statistics as of June 30, 2026- Total Net Assets$324,342,335
- # of Portfolio Holdings377
- Year-to-Date Total Return0.81%
- Portfolio Turnover Rate46%
Returns provided do not reflect fees and expenses of any variable annuity contract or variable life insurance policy; if these fees and expenses were included, the returns shown would be lower. |
| Holdings [Text Block] |
Fund's Composition (% of Total Net Assets)Table SummaryValue | Value |
|---|
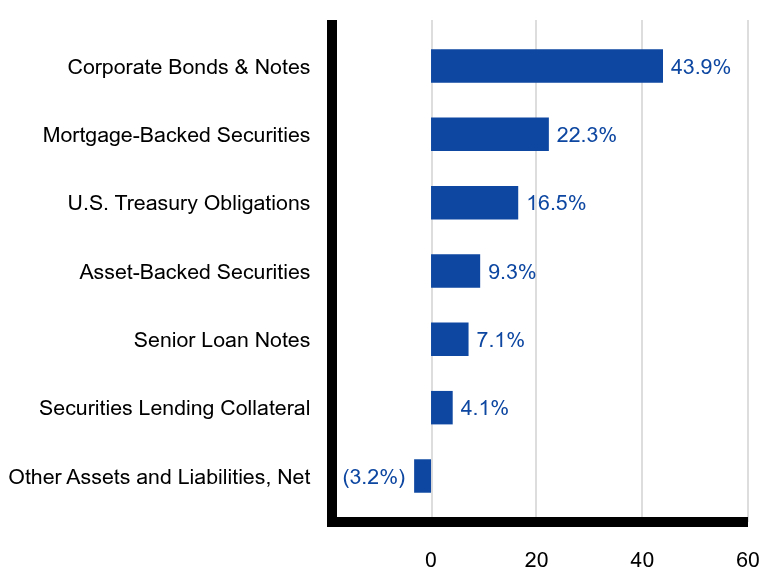
Other Assets and Liabilities, Net | (3.2%) | Securities Lending Collateral | 4.1% | Senior Loan Notes | 7.1% | Asset-Backed Securities | 9.3% | U.S. Treasury Obligations | 16.5% | Mortgage-Backed Securities | 22.3% | Corporate Bonds & Notes | 43.9% | |
| C000153751 |
|
| Shareholder Report [Line Items] |
|
| Fund Name |
Core Income Portfolio
|
| Class Name |
Class P
|
| No Trading Symbol [Flag] |
true
|
| Annual or Semi-Annual Statement [Text Block] |
This semi-annual shareholder report contains important information about the Core Income Portfolio (the "Fund") for the period of January 1, 2026 to June 30, 2026.
|
| Additional Information [Text Block] |
You can find additional information about the Fund at http://www.pacificlife.com/pacificselectfund.html. You can also request this information free of charge by contacting us toll-free at 800-722-4448 or sending an email request to PSFdocumentrequest@pacificlife.com.
|
| Additional Information Phone Number |
800-722-4448
|
| Additional Information Email |
<span style="box-sizing: border-box; color: rgb(0, 0, 0); display: inline; flex-wrap: nowrap; font-size: 12px; font-weight: 400; grid-area: auto; line-height: 14.4px; margin: 0px; overflow: visible; text-align: left; text-align-last: auto; white-space-collapse: preserve-breaks;">PSFdocumentrequest@pacificlife.com</span>
|
| Additional Information Website |
<span style="box-sizing: border-box; color: rgb(0, 0, 0); display: inline; flex-wrap: nowrap; font-size: 12px; font-weight: 400; grid-area: auto; line-height: 14.4px; margin: 0px; overflow: visible; text-align: left; text-align-last: auto; white-space-collapse: preserve-breaks;">http://www.pacificlife.com/pacificselectfund.html</span>
|
| Expenses [Text Block] |
What were the Fund costs for the last six months?(based on a hypothetical $10,000 investment; costs paid as a percentage of a $10,000 investment is annualized) Table SummaryClass Name | Cost of a $10,000 investment | Costs paid as a percentage of a $10,000 investment |
|---|
Class P | $28 | 0.56% |
|---|
|
| Expenses Paid, Amount |
$ 28
|
| Expense Ratio, Percent |
0.56%
|
| AssetsNet |
$ 324,342,335
|
| Holdings Count | Holding |
377
|
| InvestmentCompanyPortfolioTurnover |
46.00%
|
| Additional Fund Statistics [Text Block] |
Key Fund Statistics as of June 30, 2026- Total Net Assets$324,342,335
- # of Portfolio Holdings377
- Year-to-Date Total Return0.91%
- Portfolio Turnover Rate46%
Returns provided do not reflect fees and expenses of any variable annuity contract or variable life insurance policy; if these fees and expenses were included, the returns shown would be lower. |
| Holdings [Text Block] |
Fund's Composition (% of Total Net Assets)Table SummaryValue | Value |
|---|
Other Assets and Liabilities, Net | (3.2%) | Securities Lending Collateral | 4.1% | Senior Loan Notes | 7.1% | Asset-Backed Securities | 9.3% | U.S. Treasury Obligations | 16.5% | Mortgage-Backed Securities | 22.3% | Corporate Bonds & Notes | 43.9% | |
| C000078095 |
|
| Shareholder Report [Line Items] |
|
| Fund Name |
Diversified Bond Portfolio
|
| Class Name |
Class I
|
| No Trading Symbol [Flag] |
true
|
| Annual or Semi-Annual Statement [Text Block] |
This semi-annual shareholder report contains important information about the Diversified Bond Portfolio (the "Fund") for the period of January 1, 2026 to June 30, 2026.
|
| Additional Information [Text Block] |
You can find additional information about the Fund at http://www.pacificlife.com/pacificselectfund.html. You can also request this information free of charge by contacting us toll-free at 800-722-4448 or sending an email request to PSFdocumentrequest@pacificlife.com.
|
| Additional Information Phone Number |
800-722-4448
|
| Additional Information Email |
<span style="box-sizing: border-box; color: rgb(0, 0, 0); display: inline; flex-wrap: nowrap; font-size: 12px; font-weight: 400; grid-area: auto; line-height: 14.4px; margin: 0px; overflow: visible; text-align: left; text-align-last: auto; white-space-collapse: preserve-breaks;">PSFdocumentrequest@pacificlife.com</span>
|
| Additional Information Website |
<span style="box-sizing: border-box; color: rgb(0, 0, 0); display: inline; flex-wrap: nowrap; font-size: 12px; font-weight: 400; grid-area: auto; line-height: 14.4px; margin: 0px; overflow: visible; text-align: left; text-align-last: auto; white-space-collapse: preserve-breaks;">http://www.pacificlife.com/pacificselectfund.html</span>
|
| Expenses [Text Block] |
What were the Fund costs for the last six months?(based on a hypothetical $10,000 investment; costs paid as a percentage of a $10,000 investment is annualized) Table SummaryClass Name | Cost of a $10,000 investment | Costs paid as a percentage of a $10,000 investment |
|---|
Class I | $33 | 0.66% |
|---|
|
| Expenses Paid, Amount |
$ 33
|
| Expense Ratio, Percent |
0.66%
|
| AssetsNet |
$ 1,339,500,786
|
| Holdings Count | Holding |
1,193
|
| InvestmentCompanyPortfolioTurnover |
77.00%
|
| Additional Fund Statistics [Text Block] |
Key Fund Statistics as of June 30, 2026- Total Net Assets$1,339,500,786
- # of Portfolio Holdings1,193
- Year-to-Date Total Return0.93%
- Portfolio Turnover Rate77%
Returns provided do not reflect fees and expenses of any variable annuity contract or variable life insurance policy; if these fees and expenses were included, the returns shown would be lower. |
| Holdings [Text Block] |
Fund's Composition (% of Total Net Assets)Table SummaryValue | Value |
|---|
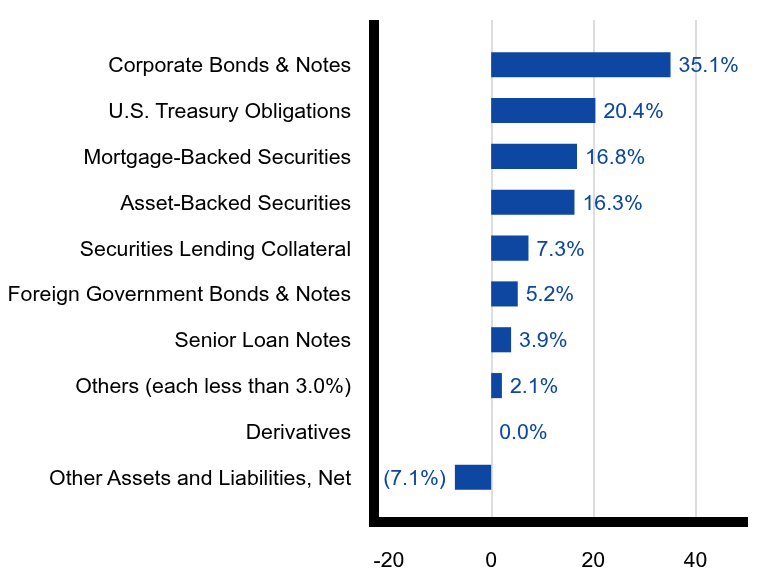
Other Assets and Liabilities, Net | (7.1%) | Derivatives | 0.0% | Others (each less than 3.0%) | 2.1% | Senior Loan Notes | 3.9% | Foreign Government Bonds & Notes | 5.2% | Securities Lending Collateral | 7.3% | Asset-Backed Securities | 16.3% | Mortgage-Backed Securities | 16.8% | U.S. Treasury Obligations | 20.4% | Corporate Bonds & Notes | 35.1% | |
| C000098966 |
|
| Shareholder Report [Line Items] |
|
| Fund Name |
Diversified Bond Portfolio
|
| Class Name |
Class P
|
| No Trading Symbol [Flag] |
true
|
| Annual or Semi-Annual Statement [Text Block] |
This semi-annual shareholder report contains important information about the Diversified Bond Portfolio (the "Fund") for the period of January 1, 2026 to June 30, 2026.
|
| Additional Information [Text Block] |
You can find additional information about the Fund at http://www.pacificlife.com/pacificselectfund.html. You can also request this information free of charge by contacting us toll-free at 800-722-4448 or sending an email request to PSFdocumentrequest@pacificlife.com.
|
| Additional Information Phone Number |
800-722-4448
|
| Additional Information Email |
<span style="box-sizing: border-box; color: rgb(0, 0, 0); display: inline; flex-wrap: nowrap; font-size: 12px; font-weight: 400; grid-area: auto; line-height: 14.4px; margin: 0px; overflow: visible; text-align: left; text-align-last: auto; white-space-collapse: preserve-breaks;">PSFdocumentrequest@pacificlife.com</span>
|
| Additional Information Website |
<span style="box-sizing: border-box; color: rgb(0, 0, 0); display: inline; flex-wrap: nowrap; font-size: 12px; font-weight: 400; grid-area: auto; line-height: 14.4px; margin: 0px; overflow: visible; text-align: left; text-align-last: auto; white-space-collapse: preserve-breaks;">http://www.pacificlife.com/pacificselectfund.html</span>
|
| Expenses [Text Block] |
What were the Fund costs for the last six months?(based on a hypothetical $10,000 investment; costs paid as a percentage of a $10,000 investment is annualized) Table SummaryClass Name | Cost of a $10,000 investment | Costs paid as a percentage of a $10,000 investment |
|---|
Class P | $23 | 0.46% |
|---|
|
| Expenses Paid, Amount |
$ 23
|
| Expense Ratio, Percent |
0.46%
|
| AssetsNet |
$ 1,339,500,786
|
| Holdings Count | Holding |
1,193
|
| InvestmentCompanyPortfolioTurnover |
77.00%
|
| Additional Fund Statistics [Text Block] |
Key Fund Statistics as of June 30, 2026- Total Net Assets$1,339,500,786
- # of Portfolio Holdings1,193
- Year-to-Date Total Return1.03%
- Portfolio Turnover Rate77%
Returns provided do not reflect fees and expenses of any variable annuity contract or variable life insurance policy; if these fees and expenses were included, the returns shown would be lower. |
| Holdings [Text Block] |
Fund's Composition (% of Total Net Assets)Table SummaryValue | Value |
|---|
Other Assets and Liabilities, Net | (7.1%) | Derivatives | 0.0% | Others (each less than 3.0%) | 2.1% | Senior Loan Notes | 3.9% | Foreign Government Bonds & Notes | 5.2% | Securities Lending Collateral | 7.3% | Asset-Backed Securities | 16.3% | Mortgage-Backed Securities | 16.8% | U.S. Treasury Obligations | 20.4% | Corporate Bonds & Notes | 35.1% | |
| C000111629 |
|
| Shareholder Report [Line Items] |
|
| Fund Name |
Floating Rate Income Portfolio
|
| Class Name |
Class I
|
| No Trading Symbol [Flag] |
true
|
| Annual or Semi-Annual Statement [Text Block] |
This semi-annual shareholder report contains important information about the Floating Rate Income Portfolio (the "Fund") for the period of January 1, 2026 to June 30, 2026.
|
| Additional Information [Text Block] |
You can find additional information about the Fund at http://www.pacificlife.com/pacificselectfund.html. You can also request this information free of charge by contacting us toll-free at 800-722-4448 or sending an email request to PSFdocumentrequest@pacificlife.com.
|
| Additional Information Phone Number |
800-722-4448
|
| Additional Information Email |
<span style="box-sizing: border-box; color: rgb(0, 0, 0); display: inline; flex-wrap: nowrap; font-size: 12px; font-weight: 400; grid-area: auto; line-height: 14.4px; margin: 0px; overflow: visible; text-align: left; text-align-last: auto; white-space-collapse: preserve-breaks;">PSFdocumentrequest@pacificlife.com</span>
|
| Additional Information Website |
<span style="box-sizing: border-box; color: rgb(0, 0, 0); display: inline; flex-wrap: nowrap; font-size: 12px; font-weight: 400; grid-area: auto; line-height: 14.4px; margin: 0px; overflow: visible; text-align: left; text-align-last: auto; white-space-collapse: preserve-breaks;">http://www.pacificlife.com/pacificselectfund.html</span>
|
| Expenses [Text Block] |
What were the Fund costs for the last six months?(based on a hypothetical $10,000 investment; costs paid as a percentage of a $10,000 investment is annualized) Table SummaryClass Name | Cost of a $10,000 investment | Costs paid as a percentage of a $10,000 investment |
|---|
Class I | $47 | 0.94% |
|---|
|
| Expenses Paid, Amount |
$ 47
|
| Expense Ratio, Percent |
0.94%
|
| AssetsNet |
$ 411,641,601
|
| Holdings Count | Holding |
128
|
| InvestmentCompanyPortfolioTurnover |
80.00%
|
| Additional Fund Statistics [Text Block] |
Key Fund Statistics as of June 30, 2026- Total Net Assets$411,641,601
- # of Portfolio Holdings128
- Year-to-Date Total Return1.22%
- Portfolio Turnover Rate80%
Returns provided do not reflect fees and expenses of any variable annuity contract or variable life insurance policy; if these fees and expenses were included, the returns shown would be lower. |
| Holdings [Text Block] |
Fund's Composition (% of Total Net Assets)Table SummaryValue | Value |
|---|
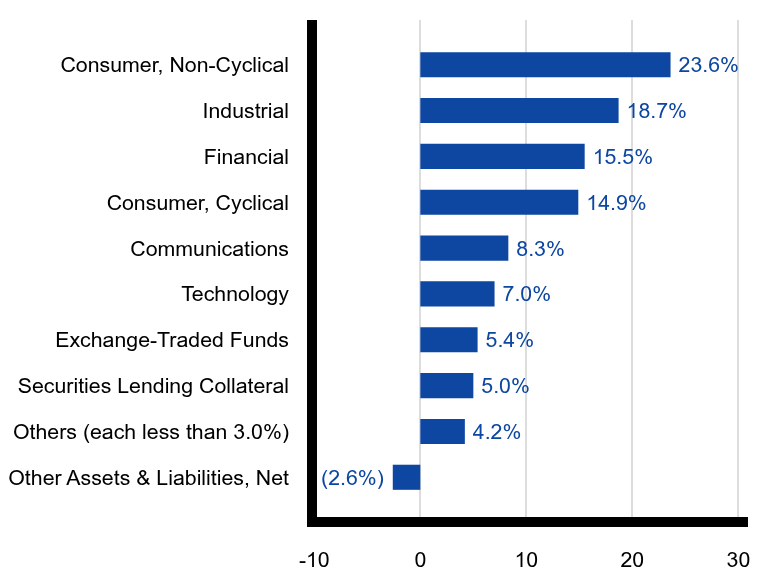
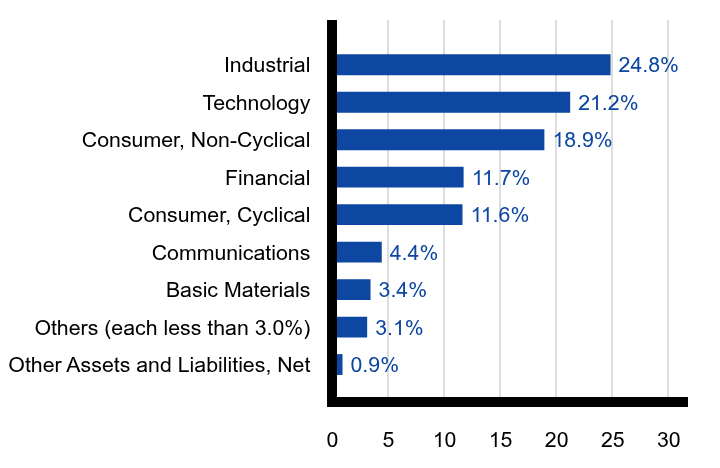
Other Assets & Liabilities, Net | (2.6%) | Others (each less than 3.0%) | 4.2% | Securities Lending Collateral | 5.0% | Exchange-Traded Funds | 5.4% | Technology | 7.0% | Communications | 8.3% | Consumer, Cyclical | 14.9% | Financial | 15.5% | Industrial | 18.7% | Consumer, Non-Cyclical | 23.6% | |
| C000111630 |
|
| Shareholder Report [Line Items] |
|
| Fund Name |
Floating Rate Income Portfolio
|
| Class Name |
Class P
|
| No Trading Symbol [Flag] |
true
|
| Annual or Semi-Annual Statement [Text Block] |
This semi-annual shareholder report contains important information about the Floating Rate Income Portfolio (the "Fund") for the period of January 1, 2026 to June 30, 2026.
|
| Additional Information [Text Block] |
You can find additional information about the Fund at http://www.pacificlife.com/pacificselectfund.html. You can also request this information free of charge by contacting us toll-free at 800-722-4448 or sending an email request to PSFdocumentrequest@pacificlife.com.
|
| Additional Information Phone Number |
800-722-4448
|
| Additional Information Email |
<span style="box-sizing: border-box; color: rgb(0, 0, 0); display: inline; flex-wrap: nowrap; font-size: 12px; font-weight: 400; grid-area: auto; line-height: 14.4px; margin: 0px; overflow: visible; text-align: left; text-align-last: auto; white-space-collapse: preserve-breaks;">PSFdocumentrequest@pacificlife.com</span>
|
| Additional Information Website |
<span style="box-sizing: border-box; color: rgb(0, 0, 0); display: inline; flex-wrap: nowrap; font-size: 12px; font-weight: 400; grid-area: auto; line-height: 14.4px; margin: 0px; overflow: visible; text-align: left; text-align-last: auto; white-space-collapse: preserve-breaks;">http://www.pacificlife.com/pacificselectfund.html</span>
|
| Expenses [Text Block] |
What were the Fund costs for the last six months?(based on a hypothetical $10,000 investment; costs paid as a percentage of a $10,000 investment is annualized) Table SummaryClass Name | Cost of a $10,000 investment | Costs paid as a percentage of a $10,000 investment |
|---|
Class P | $37 | 0.74% |
|---|
|
| Expenses Paid, Amount |
$ 37
|
| Expense Ratio, Percent |
0.74%
|
| AssetsNet |
$ 411,641,601
|
| Holdings Count | Holding |
128
|
| InvestmentCompanyPortfolioTurnover |
80.00%
|
| Additional Fund Statistics [Text Block] |
Key Fund Statistics as of June 30, 2026- Total Net Assets$411,641,601
- # of Portfolio Holdings128
- Year-to-Date Total Return1.32%
- Portfolio Turnover Rate80%
Returns provided do not reflect fees and expenses of any variable annuity contract or variable life insurance policy; if these fees and expenses were included, the returns shown would be lower. |
| Holdings [Text Block] |
Fund's Composition (% of Total Net Assets)Table SummaryValue | Value |
|---|
Other Assets & Liabilities, Net | (2.6%) | Others (each less than 3.0%) | 4.2% | Securities Lending Collateral | 5.0% | Exchange-Traded Funds | 5.4% | Technology | 7.0% | Communications | 8.3% | Consumer, Cyclical | 14.9% | Financial | 15.5% | Industrial | 18.7% | Consumer, Non-Cyclical | 23.6% | |
| C000078079 |
|
| Shareholder Report [Line Items] |
|
| Fund Name |
High Yield Bond Portfolio
|
| Class Name |
Class I
|
| No Trading Symbol [Flag] |
true
|
| Annual or Semi-Annual Statement [Text Block] |
This semi-annual shareholder report contains important information about the High Yield Bond Portfolio (the "Fund") for the period of January 1, 2026 to June 30, 2026.
|
| Additional Information [Text Block] |
You can find additional information about the Fund at http://www.pacificlife.com/pacificselectfund.html. You can also request this information free of charge by contacting us toll-free at 800-722-4448 or sending an email request to PSFdocumentrequest@pacificlife.com.
|
| Additional Information Phone Number |
800-722-4448
|
| Additional Information Email |
<span style="box-sizing: border-box; color: rgb(0, 0, 0); display: inline; flex-wrap: nowrap; font-size: 12px; font-weight: 400; grid-area: auto; line-height: 14.4px; margin: 0px; overflow: visible; text-align: left; text-align-last: auto; white-space-collapse: preserve-breaks;">PSFdocumentrequest@pacificlife.com</span>
|
| Additional Information Website |
<span style="box-sizing: border-box; color: rgb(0, 0, 0); display: inline; flex-wrap: nowrap; font-size: 12px; font-weight: 400; grid-area: auto; line-height: 14.4px; margin: 0px; overflow: visible; text-align: left; text-align-last: auto; white-space-collapse: preserve-breaks;">http://www.pacificlife.com/pacificselectfund.html</span>
|
| Expenses [Text Block] |
What were the Fund costs for the last six months?(based on a hypothetical $10,000 investment; costs paid as a percentage of a $10,000 investment is annualized) Table SummaryClass Name | Cost of a $10,000 investment | Costs paid as a percentage of a $10,000 investment |
|---|
Class I | $33 | 0.65% |
|---|
|
| Expenses Paid, Amount |
$ 33
|
| Expense Ratio, Percent |
0.65%
|
| AssetsNet |
$ 712,732,448
|
| Holdings Count | Holding |
236
|
| InvestmentCompanyPortfolioTurnover |
39.00%
|
| Additional Fund Statistics [Text Block] |
Key Fund Statistics as of June 30, 2026- Total Net Assets$712,732,448
- # of Portfolio Holdings236
- Year-to-Date Total Return1.85%
- Portfolio Turnover Rate39%
Returns provided do not reflect fees and expenses of any variable annuity contract or variable life insurance policy; if these fees and expenses were included, the returns shown would be lower. |
| Holdings [Text Block] |
Fund's Composition (% of Total Net Assets)Table SummaryValue | Value |
|---|
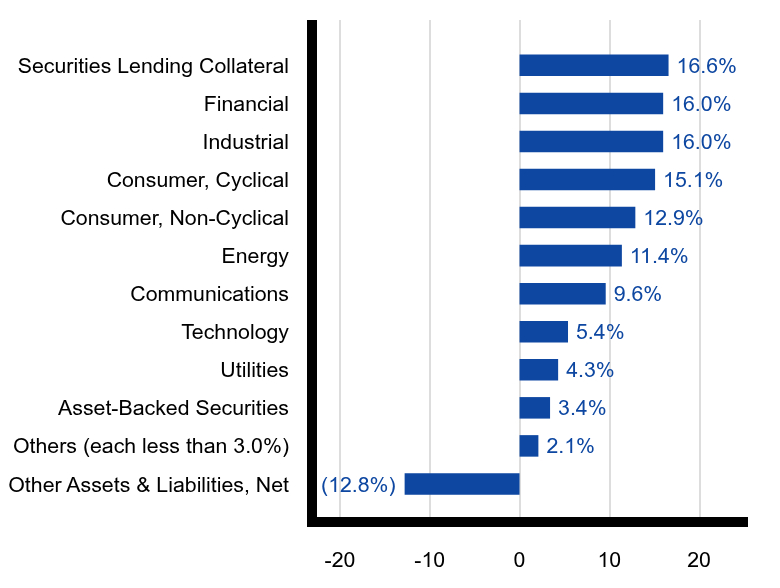
Other Assets & Liabilities, Net | (12.8%) | Others (each less than 3.0%) | 2.1% | Asset-Backed Securities | 3.4% | Utilities | 4.3% | Technology | 5.4% | Communications | 9.6% | Energy | 11.4% | Consumer, Non-Cyclical | 12.9% | Consumer, Cyclical | 15.1% | Industrial | 16.0% | Financial | 16.0% | Securities Lending Collateral | 16.6% | |
| C000098951 |
|
| Shareholder Report [Line Items] |
|
| Fund Name |
High Yield Bond Portfolio
|
| Class Name |
Class P
|
| No Trading Symbol [Flag] |
true
|
| Annual or Semi-Annual Statement [Text Block] |
This semi-annual shareholder report contains important information about the High Yield Bond Portfolio (the "Fund") for the period of January 1, 2026 to June 30, 2026.
|
| Additional Information [Text Block] |
You can find additional information about the Fund at http://www.pacificlife.com/pacificselectfund.html. You can also request this information free of charge by contacting us toll-free at 800-722-4448 or sending an email request to PSFdocumentrequest@pacificlife.com.
|
| Additional Information Phone Number |
800-722-4448
|
| Additional Information Email |
<span style="box-sizing: border-box; color: rgb(0, 0, 0); display: inline; flex-wrap: nowrap; font-size: 12px; font-weight: 400; grid-area: auto; line-height: 14.4px; margin: 0px; overflow: visible; text-align: left; text-align-last: auto; white-space-collapse: preserve-breaks;">PSFdocumentrequest@pacificlife.com</span>
|
| Additional Information Website |
<span style="box-sizing: border-box; color: rgb(0, 0, 0); display: inline; flex-wrap: nowrap; font-size: 12px; font-weight: 400; grid-area: auto; line-height: 14.4px; margin: 0px; overflow: visible; text-align: left; text-align-last: auto; white-space-collapse: preserve-breaks;">http://www.pacificlife.com/pacificselectfund.html</span>
|
| Expenses [Text Block] |
What were the Fund costs for the last six months?(based on a hypothetical $10,000 investment; costs paid as a percentage of a $10,000 investment is annualized) Table SummaryClass Name | Cost of a $10,000 investment | Costs paid as a percentage of a $10,000 investment |
|---|
Class P | $23 | 0.45% |
|---|
|
| Expenses Paid, Amount |
$ 23
|
| Expense Ratio, Percent |
0.45%
|
| AssetsNet |
$ 712,732,448
|
| Holdings Count | Holding |
236
|
| InvestmentCompanyPortfolioTurnover |
39.00%
|
| Additional Fund Statistics [Text Block] |
Key Fund Statistics as of June 30, 2026- Total Net Assets$712,732,448
- # of Portfolio Holdings236
- Year-to-Date Total Return1.95%
- Portfolio Turnover Rate39%
Returns provided do not reflect fees and expenses of any variable annuity contract or variable life insurance policy; if these fees and expenses were included, the returns shown would be lower. |
| Holdings [Text Block] |
Fund's Composition (% of Total Net Assets)Table SummaryValue | Value |
|---|
Other Assets & Liabilities, Net | (12.8%) | Others (each less than 3.0%) | 2.1% | Asset-Backed Securities | 3.4% | Utilities | 4.3% | Technology | 5.4% | Communications | 9.6% | Energy | 11.4% | Consumer, Non-Cyclical | 12.9% | Consumer, Cyclical | 15.1% | Industrial | 16.0% | Financial | 16.0% | Securities Lending Collateral | 16.6% | |
| C000078081 |
|
| Shareholder Report [Line Items] |
|
| Fund Name |
Inflation Managed Portfolio
|
| Class Name |
Class I
|
| No Trading Symbol [Flag] |
true
|
| Annual or Semi-Annual Statement [Text Block] |
This semi-annual shareholder report contains important information about the Inflation Managed Portfolio (the "Fund") for the period of January 1, 2026 to June 30, 2026.
|
| Additional Information [Text Block] |
You can find additional information about the Fund at http://www.pacificlife.com/pacificselectfund.html. You can also request this information free of charge by contacting us toll-free at 800-722-4448 or sending an email request to PSFdocumentrequest@pacificlife.com.
|
| Additional Information Phone Number |
800-722-4448
|
| Additional Information Email |
<span style="box-sizing: border-box; color: rgb(0, 0, 0); display: inline; flex-wrap: nowrap; font-size: 12px; font-weight: 400; grid-area: auto; line-height: 14.4px; margin: 0px; overflow: visible; text-align: left; text-align-last: auto; white-space-collapse: preserve-breaks;">PSFdocumentrequest@pacificlife.com</span>
|
| Additional Information Website |
<span style="box-sizing: border-box; color: rgb(0, 0, 0); display: inline; flex-wrap: nowrap; font-size: 12px; font-weight: 400; grid-area: auto; line-height: 14.4px; margin: 0px; overflow: visible; text-align: left; text-align-last: auto; white-space-collapse: preserve-breaks;">http://www.pacificlife.com/pacificselectfund.html</span>
|
| Expenses [Text Block] |
What were the Fund costs for the last six months?(based on a hypothetical $10,000 investment; costs paid as a percentage of a $10,000 investment is annualized) Table SummaryClass Name | Cost of a $10,000 investment | Costs paid as a percentage of a $10,000 investment |
|---|
Class I | $79 | 1.59% |
|---|
|
| Expenses Paid, Amount |
$ 79
|
| Expense Ratio, Percent |
1.59%
|
| AssetsNet |
$ 401,967,771
|
| Holdings Count | Holding |
321
|
| InvestmentCompanyPortfolioTurnover |
72.00%
|
| Additional Fund Statistics [Text Block] |
Key Fund Statistics as of June 30, 2026- Total Net Assets$401,967,771
- # of Portfolio Holdings321
- Year-to-Date Total Return0.96%
- Portfolio Turnover Rate72%
Returns provided do not reflect fees and expenses of any variable annuity contract or variable life insurance policy; if these fees and expenses were included, the returns shown would be lower. |
| Holdings [Text Block] |
Fund's Composition (% of Total Net Assets)Table SummaryValue | Value |
|---|
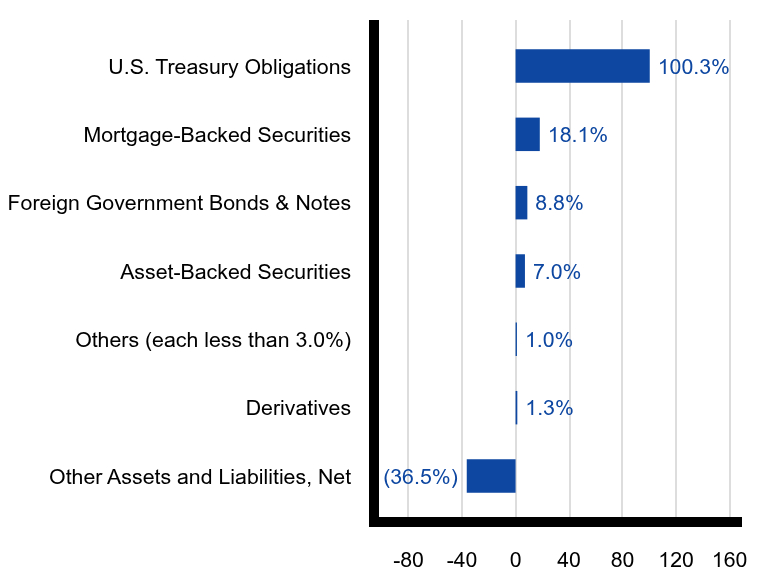
Other Assets and Liabilities, Net | (36.5%) | Derivatives | 1.3% | Others (each less than 3.0%) | 1.0% | Asset-Backed Securities | 7.0% | Foreign Government Bonds & Notes | 8.8% | Mortgage-Backed Securities | 18.1% | U.S. Treasury Obligations | 100.3% | |
| C000098953 |
|
| Shareholder Report [Line Items] |
|
| Fund Name |
Inflation Managed Portfolio
|
| Class Name |
Class P
|
| No Trading Symbol [Flag] |
true
|
| Annual or Semi-Annual Statement [Text Block] |
This semi-annual shareholder report contains important information about the Inflation Managed Portfolio (the "Fund") for the period of January 1, 2026 to June 30, 2026.
|
| Additional Information [Text Block] |
You can find additional information about the Fund at http://www.pacificlife.com/pacificselectfund.html. You can also request this information free of charge by contacting us toll-free at 800-722-4448 or sending an email request to PSFdocumentrequest@pacificlife.com.
|
| Additional Information Phone Number |
800-722-4448
|
| Additional Information Email |
<span style="box-sizing: border-box; color: rgb(0, 0, 0); display: inline; flex-wrap: nowrap; font-size: 12px; font-weight: 400; grid-area: auto; line-height: 14.4px; margin: 0px; overflow: visible; text-align: left; text-align-last: auto; white-space-collapse: preserve-breaks;">PSFdocumentrequest@pacificlife.com</span>
|
| Additional Information Website |
<span style="box-sizing: border-box; color: rgb(0, 0, 0); display: inline; flex-wrap: nowrap; font-size: 12px; font-weight: 400; grid-area: auto; line-height: 14.4px; margin: 0px; overflow: visible; text-align: left; text-align-last: auto; white-space-collapse: preserve-breaks;">http://www.pacificlife.com/pacificselectfund.html</span>
|
| Expenses [Text Block] |
What were the Fund costs for the last six months?(based on a hypothetical $10,000 investment; costs paid as a percentage of a $10,000 investment is annualized) Table SummaryClass Name | Cost of a $10,000 investment | Costs paid as a percentage of a $10,000 investment |
|---|
Class P | $69 | 1.39% |
|---|
|
| Expenses Paid, Amount |
$ 69
|
| Expense Ratio, Percent |
1.39%
|
| AssetsNet |
$ 401,967,771
|
| Holdings Count | Holding |
321
|
| InvestmentCompanyPortfolioTurnover |
72.00%
|
| Additional Fund Statistics [Text Block] |
Key Fund Statistics as of June 30, 2026- Total Net Assets$401,967,771
- # of Portfolio Holdings321
- Year-to-Date Total Return1.06%
- Portfolio Turnover Rate72%
Returns provided do not reflect fees and expenses of any variable annuity contract or variable life insurance policy; if these fees and expenses were included, the returns shown would be lower. |
| Holdings [Text Block] |
Fund's Composition (% of Total Net Assets)Table SummaryValue | Value |
|---|
Other Assets and Liabilities, Net | (36.5%) | Derivatives | 1.3% | Others (each less than 3.0%) | 1.0% | Asset-Backed Securities | 7.0% | Foreign Government Bonds & Notes | 8.8% | Mortgage-Backed Securities | 18.1% | U.S. Treasury Obligations | 100.3% | |
| C000222604 |
|
| Shareholder Report [Line Items] |
|
| Fund Name |
Intermediate Bond Portfolio
|
| Class Name |
Class I
|
| No Trading Symbol [Flag] |
true
|
| Annual or Semi-Annual Statement [Text Block] |
This semi-annual shareholder report contains important information about the Intermediate Bond Portfolio (the "Fund") for the period of January 1, 2026 to June 30, 2026.
|
| Additional Information [Text Block] |
You can find additional information about the Fund at http://www.pacificlife.com/pacificselectfund.html. You can also request this information free of charge by contacting us toll-free at 800-722-4448 or sending an email request to PSFdocumentrequest@pacificlife.com.
|
| Additional Information Phone Number |
800-722-4448
|
| Additional Information Email |
<span style="box-sizing: border-box; color: rgb(0, 0, 0); display: inline; flex-wrap: nowrap; font-size: 12px; font-weight: 400; grid-area: auto; line-height: 14.4px; margin: 0px; overflow: visible; text-align: left; text-align-last: auto; white-space-collapse: preserve-breaks;">PSFdocumentrequest@pacificlife.com</span>
|
| Additional Information Website |
<span style="box-sizing: border-box; color: rgb(0, 0, 0); display: inline; flex-wrap: nowrap; font-size: 12px; font-weight: 400; grid-area: auto; line-height: 14.4px; margin: 0px; overflow: visible; text-align: left; text-align-last: auto; white-space-collapse: preserve-breaks;">http://www.pacificlife.com/pacificselectfund.html</span>
|
| Expenses [Text Block] |
What were the Fund costs for the last six months?(based on a hypothetical $10,000 investment; costs paid as a percentage of a $10,000 investment is annualized) Table SummaryClass Name | Cost of a $10,000 investment | Costs paid as a percentage of a $10,000 investment |
|---|
Class I | $32 | 0.64% |
|---|
|
| Expenses Paid, Amount |
$ 32
|
| Expense Ratio, Percent |
0.64%
|
| AssetsNet |
$ 1,209,580,947
|
| Holdings Count | Holding |
707
|
| InvestmentCompanyPortfolioTurnover |
78.00%
|
| Additional Fund Statistics [Text Block] |
Key Fund Statistics as of June 30, 2026- Total Net Assets$1,209,580,947
- # of Portfolio Holdings707
- Year-to-Date Total Return0.52%
- Portfolio Turnover Rate78%
Returns provided do not reflect fees and expenses of any variable annuity contract or variable life insurance policy; if these fees and expenses were included, the returns shown would be lower. |
| Holdings [Text Block] |
Fund's Composition (% of Total Net Assets)Table SummaryValue | Value |
|---|
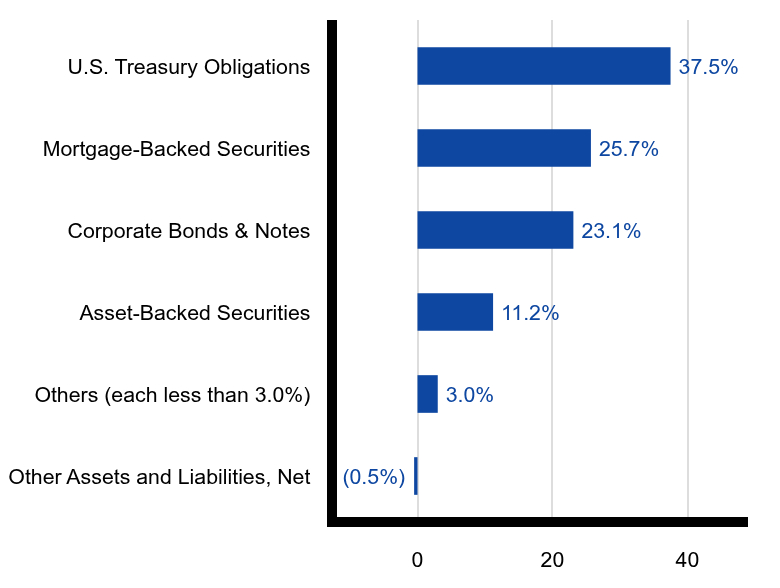
Other Assets and Liabilities, Net | (0.5%) | Others (each less than 3.0%) | 3.0% | Asset-Backed Securities | 11.2% | Corporate Bonds & Notes | 23.1% | Mortgage-Backed Securities | 25.7% | U.S. Treasury Obligations | 37.5% | |
| C000222605 |
|
| Shareholder Report [Line Items] |
|
| Fund Name |
Intermediate Bond Portfolio
|
| Class Name |
Class P
|
| No Trading Symbol [Flag] |
true
|
| Annual or Semi-Annual Statement [Text Block] |
This semi-annual shareholder report contains important information about the Intermediate Bond Portfolio (the "Fund") for the period of January 1, 2026 to June 30, 2026.
|
| Additional Information [Text Block] |
You can find additional information about the Fund at http://www.pacificlife.com/pacificselectfund.html. You can also request this information free of charge by contacting us toll-free at 800-722-4448 or sending an email request to PSFdocumentrequest@pacificlife.com.
|
| Additional Information Phone Number |
800-722-4448
|
| Additional Information Email |
<span style="box-sizing: border-box; color: rgb(0, 0, 0); display: inline; flex-wrap: nowrap; font-size: 12px; font-weight: 400; grid-area: auto; line-height: 14.4px; margin: 0px; overflow: visible; text-align: left; text-align-last: auto; white-space-collapse: preserve-breaks;">PSFdocumentrequest@pacificlife.com</span>
|
| Additional Information Website |
<span style="box-sizing: border-box; color: rgb(0, 0, 0); display: inline; flex-wrap: nowrap; font-size: 12px; font-weight: 400; grid-area: auto; line-height: 14.4px; margin: 0px; overflow: visible; text-align: left; text-align-last: auto; white-space-collapse: preserve-breaks;">http://www.pacificlife.com/pacificselectfund.html</span>
|
| Expenses [Text Block] |
What were the Fund costs for the last six months?(based on a hypothetical $10,000 investment; costs paid as a percentage of a $10,000 investment is annualized) Table SummaryClass Name | Cost of a $10,000 investment | Costs paid as a percentage of a $10,000 investment |
|---|
Class P | $22 | 0.44% |
|---|
|
| Expenses Paid, Amount |
$ 22
|
| Expense Ratio, Percent |
0.44%
|
| AssetsNet |
$ 1,209,580,947
|
| Holdings Count | Holding |
707
|
| InvestmentCompanyPortfolioTurnover |
78.00%
|
| Additional Fund Statistics [Text Block] |
Key Fund Statistics as of June 30, 2026- Total Net Assets$1,209,580,947
- # of Portfolio Holdings707
- Year-to-Date Total Return0.61%
- Portfolio Turnover Rate78%
Returns provided do not reflect fees and expenses of any variable annuity contract or variable life insurance policy; if these fees and expenses were included, the returns shown would be lower. |
| Holdings [Text Block] |
Fund's Composition (% of Total Net Assets)Table SummaryValue | Value |
|---|
Other Assets and Liabilities, Net | (0.5%) | Others (each less than 3.0%) | 3.0% | Asset-Backed Securities | 11.2% | Corporate Bonds & Notes | 23.1% | Mortgage-Backed Securities | 25.7% | U.S. Treasury Obligations | 37.5% | |
| C000078082 |
|
| Shareholder Report [Line Items] |
|
| Fund Name |
Short Duration Bond Portfolio
|
| Class Name |
Class I
|
| No Trading Symbol [Flag] |
true
|
| Annual or Semi-Annual Statement [Text Block] |
This semi-annual shareholder report contains important information about the Short Duration Bond Portfolio (the "Fund") for the period of January 1, 2026 to June 30, 2026.
|
| Additional Information [Text Block] |
You can find additional information about the Fund at http://www.pacificlife.com/pacificselectfund.html. You can also request this information free of charge by contacting us toll-free at 800-722-4448 or sending an email request to PSFdocumentrequest@pacificlife.com.
|
| Additional Information Phone Number |
800-722-4448
|
| Additional Information Email |
<span style="box-sizing: border-box; color: rgb(0, 0, 0); display: inline; flex-wrap: nowrap; font-size: 12px; font-weight: 400; grid-area: auto; line-height: 14.4px; margin: 0px; overflow: visible; text-align: left; text-align-last: auto; white-space-collapse: preserve-breaks;">PSFdocumentrequest@pacificlife.com</span>
|
| Additional Information Website |
<span style="box-sizing: border-box; color: rgb(0, 0, 0); display: inline; flex-wrap: nowrap; font-size: 12px; font-weight: 400; grid-area: auto; line-height: 14.4px; margin: 0px; overflow: visible; text-align: left; text-align-last: auto; white-space-collapse: preserve-breaks;">http://www.pacificlife.com/pacificselectfund.html</span>
|
| Expenses [Text Block] |
What were the Fund costs for the last six months?(based on a hypothetical $10,000 investment; costs paid as a percentage of a $10,000 investment is annualized) Table SummaryClass Name | Cost of a $10,000 investment | Costs paid as a percentage of a $10,000 investment |
|---|
Class I | $32 | 0.65% |
|---|
|
| Expenses Paid, Amount |
$ 32
|
| Expense Ratio, Percent |
0.65%
|
| AssetsNet |
$ 1,118,123,942
|
| Holdings Count | Holding |
769
|
| InvestmentCompanyPortfolioTurnover |
62.00%
|
| Additional Fund Statistics [Text Block] |
Key Fund Statistics as of June 30, 2026- Total Net Assets$1,118,123,942
- # of Portfolio Holdings769
- Year-to-Date Total Return0.90%
- Portfolio Turnover Rate62%
Returns provided do not reflect fees and expenses of any variable annuity contract or variable life insurance policy; if these fees and expenses were included, the returns shown would be lower. |
| Holdings [Text Block] |
Fund's Composition (% of Total Net Assets)Table SummaryValue | Value |
|---|
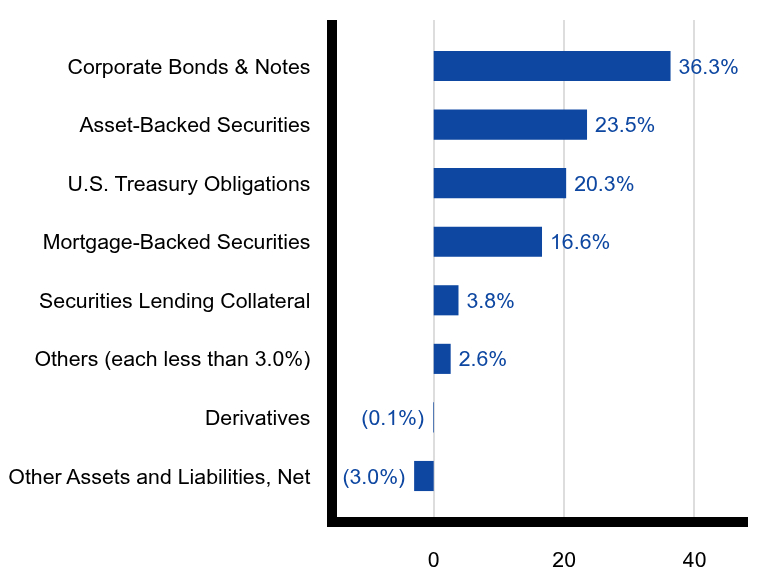
Other Assets and Liabilities, Net | (3.0%) | Derivatives | (0.1%) | Others (each less than 3.0%) | 2.6% | Securities Lending Collateral | 3.8% | Mortgage-Backed Securities | 16.6% | U.S. Treasury Obligations | 20.3% | Asset-Backed Securities | 23.5% | Corporate Bonds & Notes | 36.3% | |
| C000098954 |
|
| Shareholder Report [Line Items] |
|
| Fund Name |
Short Duration Bond Portfolio
|
| Class Name |
Class P
|
| No Trading Symbol [Flag] |
true
|
| Annual or Semi-Annual Statement [Text Block] |
This semi-annual shareholder report contains important information about the Short Duration Bond Portfolio (the "Fund") for the period of January 1, 2026 to June 30, 2026.
|
| Additional Information [Text Block] |
You can find additional information about the Fund at http://www.pacificlife.com/pacificselectfund.html. You can also request this information free of charge by contacting us toll-free at 800-722-4448 or sending an email request to PSFdocumentrequest@pacificlife.com.
|
| Additional Information Phone Number |
800-722-4448
|
| Additional Information Email |
<span style="box-sizing: border-box; color: rgb(0, 0, 0); display: inline; flex-wrap: nowrap; font-size: 12px; font-weight: 400; grid-area: auto; line-height: 14.4px; margin: 0px; overflow: visible; text-align: left; text-align-last: auto; white-space-collapse: preserve-breaks;">PSFdocumentrequest@pacificlife.com</span>
|
| Additional Information Website |
<span style="box-sizing: border-box; color: rgb(0, 0, 0); display: inline; flex-wrap: nowrap; font-size: 12px; font-weight: 400; grid-area: auto; line-height: 14.4px; margin: 0px; overflow: visible; text-align: left; text-align-last: auto; white-space-collapse: preserve-breaks;">http://www.pacificlife.com/pacificselectfund.html</span>
|
| Expenses [Text Block] |
What were the Fund costs for the last six months?(based on a hypothetical $10,000 investment; costs paid as a percentage of a $10,000 investment is annualized) Table SummaryClass Name | Cost of a $10,000 investment | Costs paid as a percentage of a $10,000 investment |
|---|
Class P | $22 | 0.45% |
|---|
|
| Expenses Paid, Amount |
$ 22
|
| Expense Ratio, Percent |
0.45%
|
| AssetsNet |
$ 1,118,123,942
|
| Holdings Count | Holding |
769
|
| InvestmentCompanyPortfolioTurnover |
62.00%
|
| Additional Fund Statistics [Text Block] |
Key Fund Statistics as of June 30, 2026- Total Net Assets$1,118,123,942
- # of Portfolio Holdings769
- Year-to-Date Total Return1.00%
- Portfolio Turnover Rate62%
Returns provided do not reflect fees and expenses of any variable annuity contract or variable life insurance policy; if these fees and expenses were included, the returns shown would be lower. |
| Holdings [Text Block] |
Fund's Composition (% of Total Net Assets)Table SummaryValue | Value |
|---|
Other Assets and Liabilities, Net | (3.0%) | Derivatives | (0.1%) | Others (each less than 3.0%) | 2.6% | Securities Lending Collateral | 3.8% | Mortgage-Backed Securities | 16.6% | U.S. Treasury Obligations | 20.3% | Asset-Backed Securities | 23.5% | Corporate Bonds & Notes | 36.3% | |
| C000078080 |
|
| Shareholder Report [Line Items] |
|
| Fund Name |
Total Return Portfolio
|
| Class Name |
Class I
|
| No Trading Symbol [Flag] |
true
|
| Annual or Semi-Annual Statement [Text Block] |
This semi-annual shareholder report contains important information about the Total Return Portfolio (the "Fund") for the period of January 1, 2026 to June 30, 2026.
|
| Additional Information [Text Block] |
You can find additional information about the Fund at http://www.pacificlife.com/pacificselectfund.html. You can also request this information free of charge by contacting us toll-free at 800-722-4448 or sending an email request to PSFdocumentrequest@pacificlife.com.
|
| Additional Information Phone Number |
800-722-4448
|
| Additional Information Email |
<span style="box-sizing: border-box; color: rgb(0, 0, 0); display: inline; flex-wrap: nowrap; font-size: 12px; font-weight: 400; grid-area: auto; line-height: 14.4px; margin: 0px; overflow: visible; text-align: left; text-align-last: auto; white-space-collapse: preserve-breaks;">PSFdocumentrequest@pacificlife.com</span>
|
| Additional Information Website |
<span style="box-sizing: border-box; color: rgb(0, 0, 0); display: inline; flex-wrap: nowrap; font-size: 12px; font-weight: 400; grid-area: auto; line-height: 14.4px; margin: 0px; overflow: visible; text-align: left; text-align-last: auto; white-space-collapse: preserve-breaks;">http://www.pacificlife.com/pacificselectfund.html</span>
|
| Expenses [Text Block] |
What were the Fund costs for the last six months?(based on a hypothetical $10,000 investment; costs paid as a percentage of a $10,000 investment is annualized) Table SummaryClass Name | Cost of a $10,000 investment | Costs paid as a percentage of a $10,000 investment |
|---|
Class I | $47 | 0.95% |
|---|
|
| Expenses Paid, Amount |
$ 47
|
| Expense Ratio, Percent |
0.95%
|
| AssetsNet |
$ 1,558,849,654
|
| Holdings Count | Holding |
1,336
|
| InvestmentCompanyPortfolioTurnover |
244.00%
|
| Additional Fund Statistics [Text Block] |
Key Fund Statistics as of June 30, 2026- Total Net Assets$1,558,849,654
- # of Portfolio Holdings1,336
- Year-to-Date Total Return1.01%
- Portfolio Turnover Rate244%
Returns provided do not reflect fees and expenses of any variable annuity contract or variable life insurance policy; if these fees and expenses were included, the returns shown would be lower. |
| Holdings [Text Block] |
Fund's Composition (% of Total Net Assets)Table SummaryValue | Value |
|---|
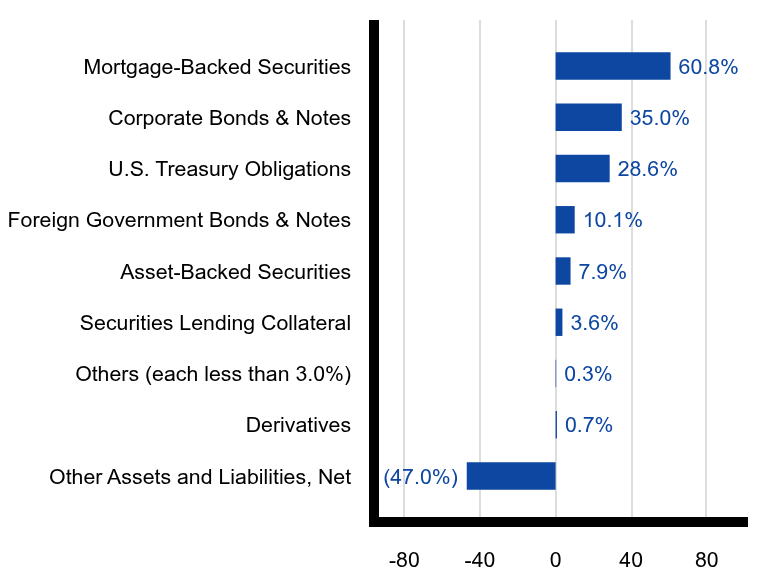
Other Assets and Liabilities, Net | (47.0%) | Derivatives | 0.7% | Others (each less than 3.0%) | 0.3% | Securities Lending Collateral | 3.6% | Asset-Backed Securities | 7.9% | Foreign Government Bonds & Notes | 10.1% | U.S. Treasury Obligations | 28.6% | Corporate Bonds & Notes | 35.0% | Mortgage-Backed Securities | 60.8% | |
| C000098952 |
|
| Shareholder Report [Line Items] |
|
| Fund Name |
Total Return Portfolio
|
| Class Name |
Class P
|
| No Trading Symbol [Flag] |
true
|
| Annual or Semi-Annual Statement [Text Block] |
This semi-annual shareholder report contains important information about the Total Return Portfolio (the "Fund") for the period of January 1, 2026 to June 30, 2026.
|
| Additional Information [Text Block] |
You can find additional information about the Fund at http://www.pacificlife.com/pacificselectfund.html. You can also request this information free of charge by contacting us toll-free at 800-722-4448 or sending an email request to PSFdocumentrequest@pacificlife.com.
|
| Additional Information Phone Number |
800-722-4448
|
| Additional Information Email |
<span style="box-sizing: border-box; color: rgb(0, 0, 0); display: inline; flex-wrap: nowrap; font-size: 12px; font-weight: 400; grid-area: auto; line-height: 14.4px; margin: 0px; overflow: visible; text-align: left; text-align-last: auto; white-space-collapse: preserve-breaks;">PSFdocumentrequest@pacificlife.com</span>
|
| Additional Information Website |
<span style="box-sizing: border-box; color: rgb(0, 0, 0); display: inline; flex-wrap: nowrap; font-size: 12px; font-weight: 400; grid-area: auto; line-height: 14.4px; margin: 0px; overflow: visible; text-align: left; text-align-last: auto; white-space-collapse: preserve-breaks;">http://www.pacificlife.com/pacificselectfund.html</span>
|
| Expenses [Text Block] |
What were the Fund costs for the last six months?(based on a hypothetical $10,000 investment; costs paid as a percentage of a $10,000 investment is annualized) Table SummaryClass Name | Cost of a $10,000 investment | Costs paid as a percentage of a $10,000 investment |
|---|
Class P | $37 | 0.75% |
|---|
|
| Expenses Paid, Amount |
$ 37
|
| Expense Ratio, Percent |
0.75%
|
| AssetsNet |
$ 1,558,849,654
|
| Holdings Count | Holding |
1,336
|
| InvestmentCompanyPortfolioTurnover |
244.00%
|
| Additional Fund Statistics [Text Block] |
Key Fund Statistics as of June 30, 2026- Total Net Assets$1,558,849,654
- # of Portfolio Holdings1,336
- Year-to-Date Total Return1.11%
- Portfolio Turnover Rate244%
Returns provided do not reflect fees and expenses of any variable annuity contract or variable life insurance policy; if these fees and expenses were included, the returns shown would be lower. |
| Holdings [Text Block] |
Fund's Composition (% of Total Net Assets)Table SummaryValue | Value |
|---|
Other Assets and Liabilities, Net | (47.0%) | Derivatives | 0.7% | Others (each less than 3.0%) | 0.3% | Securities Lending Collateral | 3.6% | Asset-Backed Securities | 7.9% | Foreign Government Bonds & Notes | 10.1% | U.S. Treasury Obligations | 28.6% | Corporate Bonds & Notes | 35.0% | Mortgage-Backed Securities | 60.8% | |
| C000111627 |
|
| Shareholder Report [Line Items] |
|
| Fund Name |
Emerging Markets Debt Portfolio
|
| Class Name |
Class I
|
| No Trading Symbol [Flag] |
true
|
| Annual or Semi-Annual Statement [Text Block] |
This semi-annual shareholder report contains important information about the Emerging Markets Debt Portfolio (the "Fund") for the period of January 1, 2026 to June 30, 2026.
|
| Additional Information [Text Block] |
You can find additional information about the Fund at http://www.pacificlife.com/pacificselectfund.html. You can also request this information free of charge by contacting us toll-free at 800-722-4448 or sending an email request to PSFdocumentrequest@pacificlife.com.
|
| Additional Information Phone Number |
800-722-4448
|
| Additional Information Email |
<span style="box-sizing: border-box; color: rgb(0, 0, 0); display: inline; flex-wrap: nowrap; font-size: 12px; font-weight: 400; grid-area: auto; line-height: 18px; margin: 0px; overflow: visible; text-align: left; text-align-last: auto; white-space-collapse: preserve-breaks;">PSFdocumentrequest@pacificlife.com</span>
|
| Additional Information Website |
<span style="box-sizing: border-box; color: rgb(0, 0, 0); display: inline; flex-wrap: nowrap; font-size: 12px; font-weight: 400; grid-area: auto; line-height: 18px; margin: 0px; overflow: visible; text-align: left; text-align-last: auto; white-space-collapse: preserve-breaks;">http://www.pacificlife.com/pacificselectfund.html</span>
|
| Expenses [Text Block] |
What were the Fund costs for the last six months?(based on a hypothetical $10,000 investment; costs paid as a percentage of a $10,000 investment is annualized) Table SummaryClass Name | Cost of a $10,000 investment | Costs paid as a percentage of a $10,000 investment |
|---|
Class I | $54 | 1.07% |
|---|
|
| Expenses Paid, Amount |
$ 54
|
| Expense Ratio, Percent |
1.07%
|
| AssetsNet |
$ 242,092,458
|
| Holdings Count | Holding |
234
|
| InvestmentCompanyPortfolioTurnover |
73.00%
|
| Additional Fund Statistics [Text Block] |
Key Fund Statistics as of June 30, 2026- Total Net Assets$242,092,458
- # of Portfolio Holdings234
- Year-to-Date Total Return2.99%
- Portfolio Turnover Rate73%
Returns provided do not reflect fees and expenses of any variable annuity contract or variable life insurance policy; if these fees and expenses were included, the returns shown would be lower. |
| Holdings [Text Block] |
Fund's Composition (% of Total Net Assets)Table SummaryValue | Value |
|---|
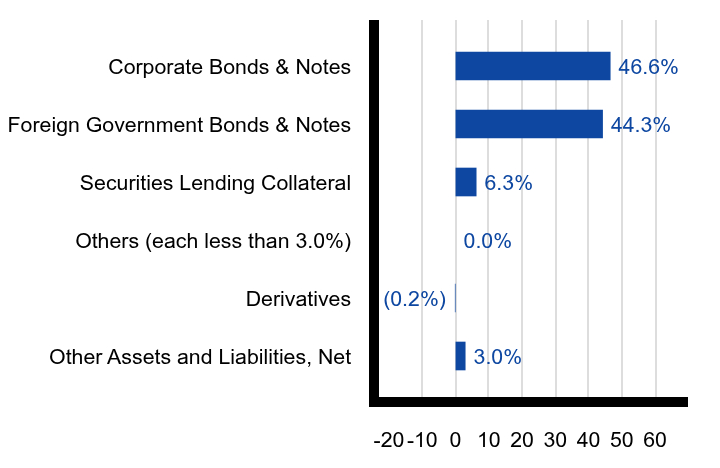
Other Assets and Liabilities, Net | 3.0% | Derivatives | (0.2%) | Others (each less than 3.0%) | 0.0% | Securities Lending Collateral | 6.3% | Foreign Government Bonds & Notes | 44.3% | Corporate Bonds & Notes | 46.6% | Top 5 Countries of Risk (% of Total Net Assets)Table SummaryValue | Value |
|---|
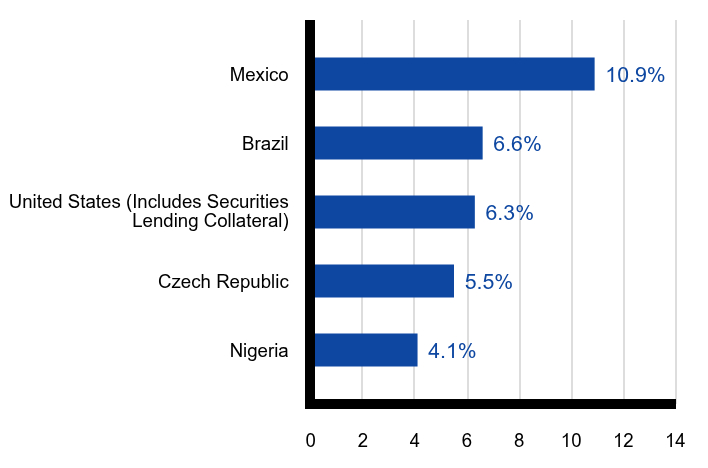
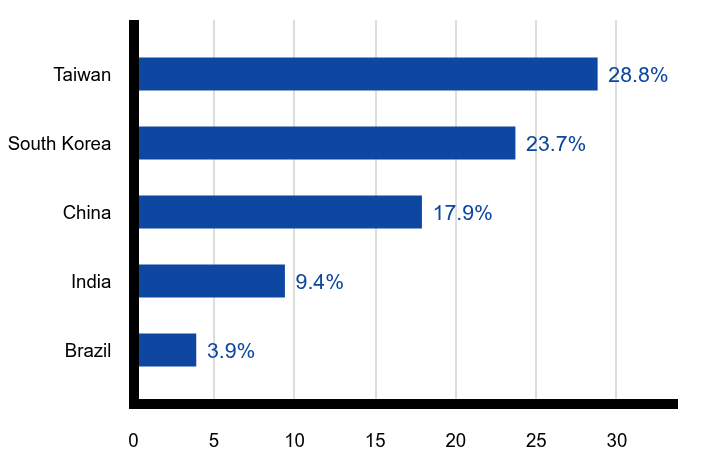
Nigeria | 4.1% | Czech Republic | 5.5% | United States (Includes Securities Lending Collateral) | 6.3% | Brazil | 6.6% | Mexico | 10.9% | |
| C000111628 |
|
| Shareholder Report [Line Items] |
|
| Fund Name |
Emerging Markets Debt Portfolio
|
| Class Name |
Class P
|
| No Trading Symbol [Flag] |
true
|
| Annual or Semi-Annual Statement [Text Block] |
This semi-annual shareholder report contains important information about the Emerging Markets Debt Portfolio (the "Fund") for the period of January 1, 2026 to June 30, 2026.
|
| Additional Information [Text Block] |
You can find additional information about the Fund at http://www.pacificlife.com/pacificselectfund.html. You can also request this information free of charge by contacting us toll-free at 800-722-4448 or sending an email request to PSFdocumentrequest@pacificlife.com.
|
| Additional Information Phone Number |
800-722-4448
|
| Additional Information Email |
<span style="box-sizing: border-box; color: rgb(0, 0, 0); display: inline; flex-wrap: nowrap; font-size: 12px; font-weight: 400; grid-area: auto; line-height: 18px; margin: 0px; overflow: visible; text-align: left; text-align-last: auto; white-space-collapse: preserve-breaks;">PSFdocumentrequest@pacificlife.com</span>
|
| Additional Information Website |
<span style="box-sizing: border-box; color: rgb(0, 0, 0); display: inline; flex-wrap: nowrap; font-size: 12px; font-weight: 400; grid-area: auto; line-height: 18px; margin: 0px; overflow: visible; text-align: left; text-align-last: auto; white-space-collapse: preserve-breaks;">http://www.pacificlife.com/pacificselectfund.html</span>
|
| Expenses [Text Block] |
What were the Fund costs for the last six months?(based on a hypothetical $10,000 investment; costs paid as a percentage of a $10,000 investment is annualized) Table SummaryClass Name | Cost of a $10,000 investment | Costs paid as a percentage of a $10,000 investment |
|---|
Class P | $44 | 0.87% |
|---|
|
| Expenses Paid, Amount |
$ 44
|
| Expense Ratio, Percent |
0.87%
|
| AssetsNet |
$ 242,092,458
|
| Holdings Count | Holding |
234
|
| InvestmentCompanyPortfolioTurnover |
73.00%
|
| Additional Fund Statistics [Text Block] |
Key Fund Statistics as of June 30, 2026- Total Net Assets$242,092,458
- # of Portfolio Holdings234
- Year-to-Date Total Return3.09%
- Portfolio Turnover Rate73%
Returns provided do not reflect fees and expenses of any variable annuity contract or variable life insurance policy; if these fees and expenses were included, the returns shown would be lower. |
| Holdings [Text Block] |
Fund's Composition (% of Total Net Assets)Table SummaryValue | Value |
|---|
Other Assets and Liabilities, Net | 3.0% | Derivatives | (0.2%) | Others (each less than 3.0%) | 0.0% | Securities Lending Collateral | 6.3% | Foreign Government Bonds & Notes | 44.3% | Corporate Bonds & Notes | 46.6% | Top 5 Countries of Risk (% of Total Net Assets)Table SummaryValue | Value |
|---|
Nigeria | 4.1% | Czech Republic | 5.5% | United States (Includes Securities Lending Collateral) | 6.3% | Brazil | 6.6% | Mexico | 10.9% | |
| C000078089 |
|
| Shareholder Report [Line Items] |
|
| Fund Name |
Dividend Growth Portfolio
|
| Class Name |
Class I
|
| No Trading Symbol [Flag] |
true
|
| Annual or Semi-Annual Statement [Text Block] |
This semi-annual shareholder report contains important information about the Dividend Growth Portfolio (the "Fund") for the period of January 1, 2026 to June 30, 2026.
|
| Additional Information [Text Block] |
You can find additional information about the Fund at http://www.pacificlife.com/pacificselectfund.html. You can also request this information free of charge by contacting us toll-free at 800-722-4448 or sending an email request to PSFdocumentrequest@pacificlife.com.
|
| Additional Information Phone Number |
800-722-4448
|
| Additional Information Email |
<span style="box-sizing: border-box; color: rgb(0, 0, 0); display: inline; flex-wrap: nowrap; font-size: 12px; font-weight: 400; grid-area: auto; line-height: 14.4px; margin: 0px; overflow: visible; text-align: left; text-align-last: auto; white-space-collapse: preserve-breaks;">PSFdocumentrequest@pacificlife.com</span>
|
| Additional Information Website |
<span style="box-sizing: border-box; color: rgb(0, 0, 0); display: inline; flex-wrap: nowrap; font-size: 12px; font-weight: 400; grid-area: auto; line-height: 14.4px; margin: 0px; overflow: visible; text-align: left; text-align-last: auto; white-space-collapse: preserve-breaks;">http://www.pacificlife.com/pacificselectfund.html</span>
|
| Expenses [Text Block] |
What were the Fund costs for the last six months?(based on a hypothetical $10,000 investment; costs paid as a percentage of a $10,000 investment is annualized) Table SummaryClass Name | Cost of a $10,000 investment | Costs paid as a percentage of a $10,000 investment |
|---|
Class I | $46 | 0.88% |
|---|
|
| Expenses Paid, Amount |
$ 46
|
| Expense Ratio, Percent |
0.88%
|
| AssetsNet |
$ 782,511,005
|
| Holdings Count | Holding |
97
|
| InvestmentCompanyPortfolioTurnover |
5.00%
|
| Additional Fund Statistics [Text Block] |
Key Fund Statistics as of June 30, 2026- Total Net Assets$782,511,005
- # of Portfolio Holdings97
- Year-to-Date Total Return9.36%
- Portfolio Turnover Rate5%
Returns provided do not reflect fees and expenses of any variable annuity contract or variable life insurance policy; if these fees and expenses were included, the returns shown would be lower. |
| Holdings [Text Block] |
Fund's Composition (% of Total Net Assets)Table SummaryValue | Value |
|---|
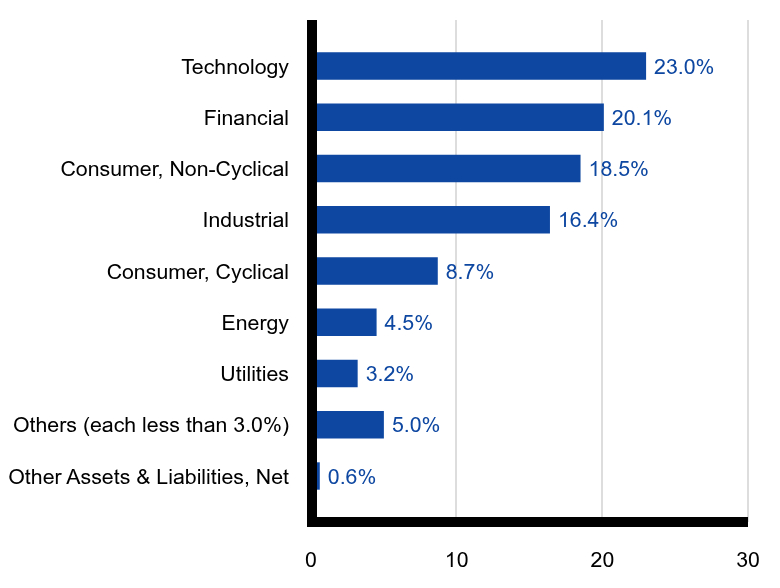
Other Assets & Liabilities, Net | 0.6% | Others (each less than 3.0%) | 5.0% | Utilities | 3.2% | Energy | 4.5% | Consumer, Cyclical | 8.7% | Industrial | 16.4% | Consumer, Non-Cyclical | 18.5% | Financial | 20.1% | Technology | 23.0% | |
| C000098960 |
|
| Shareholder Report [Line Items] |
|
| Fund Name |
Dividend Growth Portfolio
|
| Class Name |
Class P
|
| No Trading Symbol [Flag] |
true
|
| Annual or Semi-Annual Statement [Text Block] |
This semi-annual shareholder report contains important information about the Dividend Growth Portfolio (the "Fund") for the period of January 1, 2026 to June 30, 2026.
|
| Additional Information [Text Block] |
You can find additional information about the Fund at http://www.pacificlife.com/pacificselectfund.html. You can also request this information free of charge by contacting us toll-free at 800-722-4448 or sending an email request to PSFdocumentrequest@pacificlife.com.
|
| Additional Information Phone Number |
800-722-4448
|
| Additional Information Email |
<span style="box-sizing: border-box; color: rgb(0, 0, 0); display: inline; flex-wrap: nowrap; font-size: 12px; font-weight: 400; grid-area: auto; line-height: 14.4px; margin: 0px; overflow: visible; text-align: left; text-align-last: auto; white-space-collapse: preserve-breaks;">PSFdocumentrequest@pacificlife.com</span>
|
| Additional Information Website |
<span style="box-sizing: border-box; color: rgb(0, 0, 0); display: inline; flex-wrap: nowrap; font-size: 12px; font-weight: 400; grid-area: auto; line-height: 14.4px; margin: 0px; overflow: visible; text-align: left; text-align-last: auto; white-space-collapse: preserve-breaks;">http://www.pacificlife.com/pacificselectfund.html</span>
|
| Expenses [Text Block] |
What were the Fund costs for the last six months?(based on a hypothetical $10,000 investment; costs paid as a percentage of a $10,000 investment is annualized) Table SummaryClass Name | Cost of a $10,000 investment | Costs paid as a percentage of a $10,000 investment |
|---|
Class P | $35 | 0.68% |
|---|
|
| Expenses Paid, Amount |
$ 35
|
| Expense Ratio, Percent |
0.68%
|
| AssetsNet |
$ 782,511,005
|
| Holdings Count | Holding |
97
|
| InvestmentCompanyPortfolioTurnover |
5.00%
|
| Additional Fund Statistics [Text Block] |
Key Fund Statistics as of June 30, 2026- Total Net Assets$782,511,005
- # of Portfolio Holdings97
- Year-to-Date Total Return9.47%
- Portfolio Turnover Rate5%
Returns provided do not reflect fees and expenses of any variable annuity contract or variable life insurance policy; if these fees and expenses were included, the returns shown would be lower. |
| Holdings [Text Block] |
Fund's Composition (% of Total Net Assets)Table SummaryValue | Value |
|---|
Other Assets & Liabilities, Net | 0.6% | Others (each less than 3.0%) | 5.0% | Utilities | 3.2% | Energy | 4.5% | Consumer, Cyclical | 8.7% | Industrial | 16.4% | Consumer, Non-Cyclical | 18.5% | Financial | 20.1% | Technology | 23.0% | |
| C000078115 |
|
| Shareholder Report [Line Items] |
|
| Fund Name |
Equity Index Portfolio
|
| Class Name |
Class I
|
| No Trading Symbol [Flag] |
true
|
| Annual or Semi-Annual Statement [Text Block] |
This semi-annual shareholder report contains important information about the Equity Index Portfolio (the "Fund") for the period of January 1, 2026 to June 30, 2026.
|
| Additional Information [Text Block] |
You can find additional information about the Fund at http://www.pacificlife.com/pacificselectfund.html. You can also request this information free of charge by contacting us toll-free at 800-722-4448 or sending an email request to PSFdocumentrequest@pacificlife.com.
|
| Additional Information Phone Number |
800-722-4448
|
| Additional Information Email |
<span style="box-sizing: border-box; color: rgb(0, 0, 0); display: inline; flex-wrap: nowrap; font-size: 12px; font-weight: 400; grid-area: auto; line-height: 14.4px; margin: 0px; overflow: visible; text-align: left; text-align-last: auto; white-space-collapse: preserve-breaks;">PSFdocumentrequest@pacificlife.com</span>
|
| Additional Information Website |
<span style="box-sizing: border-box; color: rgb(0, 0, 0); display: inline; flex-wrap: nowrap; font-size: 12px; font-weight: 400; grid-area: auto; line-height: 14.4px; margin: 0px; overflow: visible; text-align: left; text-align-last: auto; white-space-collapse: preserve-breaks;">http://www.pacificlife.com/pacificselectfund.html</span>
|
| Expenses [Text Block] |
What were the Fund costs for the last six months?(based on a hypothetical $10,000 investment; costs paid as a percentage of a $10,000 investment is annualized) Table SummaryClass Name | Cost of a $10,000 investment | Costs paid as a percentage of a $10,000 investment |
|---|
Class I | $15 | 0.28% |
|---|
|
| Expenses Paid, Amount |
$ 15
|
| Expense Ratio, Percent |
0.28%
|
| AssetsNet |
$ 6,785,522,518
|
| Holdings Count | Holding |
508
|
| InvestmentCompanyPortfolioTurnover |
8.00%
|
| Additional Fund Statistics [Text Block] |
Key Fund Statistics as of June 30, 2026- Total Net Assets$6,785,522,518
- # of Portfolio Holdings508
- Year-to-Date Total Return10.04%
- Portfolio Turnover Rate8%
Returns provided do not reflect fees and expenses of any variable annuity contract or variable life insurance policy; if these fees and expenses were included, the returns shown would be lower. |
| Holdings [Text Block] |
Fund's Composition (% of Total Net Assets)Table SummaryValue | Value |
|---|
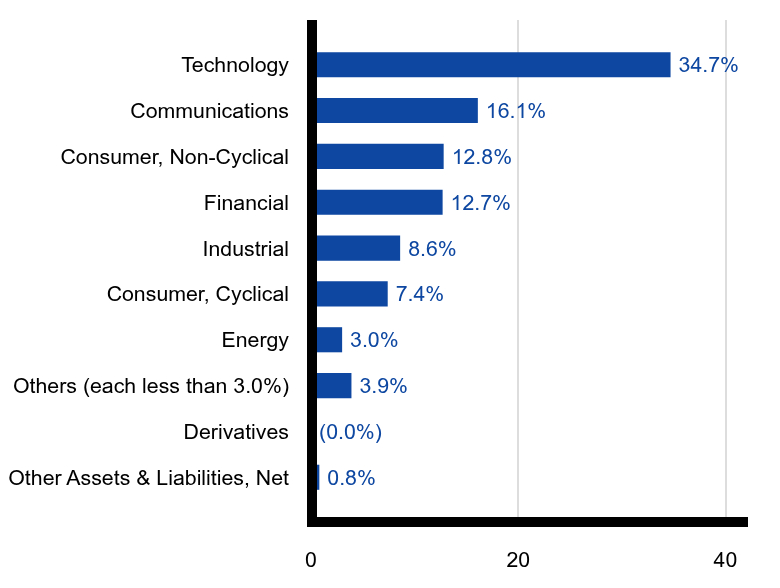
Other Assets & Liabilities, Net | 0.8% | Derivatives | (0.0%) | Others (each less than 3.0%) | 3.9% | Energy | 3.0% | Consumer, Cyclical | 7.4% | Industrial | 8.6% | Financial | 12.7% | Consumer, Non-Cyclical | 12.8% | Communications | 16.1% | Technology | 34.7% | |
| C000098974 |
|
| Shareholder Report [Line Items] |
|
| Fund Name |
Equity Index Portfolio
|
| Class Name |
Class P
|
| No Trading Symbol [Flag] |
true
|
| Annual or Semi-Annual Statement [Text Block] |
This semi-annual shareholder report contains important information about the Equity Index Portfolio (the "Fund") for the period of January 1, 2026 to June 30, 2026.
|
| Additional Information [Text Block] |
You can find additional information about the Fund at http://www.pacificlife.com/pacificselectfund.html. You can also request this information free of charge by contacting us toll-free at 800-722-4448 or sending an email request to PSFdocumentrequest@pacificlife.com.
|
| Additional Information Phone Number |
800-722-4448
|
| Additional Information Email |
<span style="box-sizing: border-box; color: rgb(0, 0, 0); display: inline; flex-wrap: nowrap; font-size: 12px; font-weight: 400; grid-area: auto; line-height: 14.4px; margin: 0px; overflow: visible; text-align: left; text-align-last: auto; white-space-collapse: preserve-breaks;">PSFdocumentrequest@pacificlife.com</span>
|
| Additional Information Website |
<span style="box-sizing: border-box; color: rgb(0, 0, 0); display: inline; flex-wrap: nowrap; font-size: 12px; font-weight: 400; grid-area: auto; line-height: 14.4px; margin: 0px; overflow: visible; text-align: left; text-align-last: auto; white-space-collapse: preserve-breaks;">http://www.pacificlife.com/pacificselectfund.html</span>
|
| Expenses [Text Block] |
What were the Fund costs for the last six months?(based on a hypothetical $10,000 investment; costs paid as a percentage of a $10,000 investment is annualized) Table SummaryClass Name | Cost of a $10,000 investment | Costs paid as a percentage of a $10,000 investment |
|---|
Class P | $4 | 0.08% |
|---|
|
| Expenses Paid, Amount |
$ 4
|
| Expense Ratio, Percent |
0.08%
|
| AssetsNet |
$ 6,785,522,518
|
| Holdings Count | Holding |
508
|
| InvestmentCompanyPortfolioTurnover |
8.00%
|
| Additional Fund Statistics [Text Block] |
Key Fund Statistics as of June 30, 2026- Total Net Assets$6,785,522,518
- # of Portfolio Holdings508
- Year-to-Date Total Return10.15%
- Portfolio Turnover Rate8%
Returns provided do not reflect fees and expenses of any variable annuity contract or variable life insurance policy; if these fees and expenses were included, the returns shown would be lower. |
| Holdings [Text Block] |
Fund's Composition (% of Total Net Assets)Table SummaryValue | Value |
|---|
Other Assets & Liabilities, Net | 0.8% | Derivatives | (0.0%) | Others (each less than 3.0%) | 3.9% | Energy | 3.0% | Consumer, Cyclical | 7.4% | Industrial | 8.6% | Financial | 12.7% | Consumer, Non-Cyclical | 12.8% | Communications | 16.1% | Technology | 34.7% | |
| C000078104 |
|
| Shareholder Report [Line Items] |
|
| Fund Name |
Focused Growth Portfolio
|
| Class Name |
Class I
|
| No Trading Symbol [Flag] |
true
|
| Annual or Semi-Annual Statement [Text Block] |
This semi-annual shareholder report contains important information about the Focused Growth Portfolio (the "Fund") for the period of January 1, 2026 to June 30, 2026.
|
| Additional Information [Text Block] |
You can find additional information about the Fund at http://www.pacificlife.com/pacificselectfund.html. You can also request this information free of charge by contacting us toll-free at 800-722-4448 or sending an email request to PSFdocumentrequest@pacificlife.com.
|
| Additional Information Phone Number |
800-722-4448
|
| Additional Information Email |
<span style="box-sizing: border-box; color: rgb(0, 0, 0); display: inline; flex-wrap: nowrap; font-size: 12px; font-weight: 400; grid-area: auto; line-height: 14.4px; margin: 0px; overflow: visible; text-align: left; text-align-last: auto; white-space-collapse: preserve-breaks;">PSFdocumentrequest@pacificlife.com</span>
|
| Additional Information Website |
<span style="box-sizing: border-box; color: rgb(0, 0, 0); display: inline; flex-wrap: nowrap; font-size: 12px; font-weight: 400; grid-area: auto; line-height: 14.4px; margin: 0px; overflow: visible; text-align: left; text-align-last: auto; white-space-collapse: preserve-breaks;">http://www.pacificlife.com/pacificselectfund.html</span>
|
| Expenses [Text Block] |
What were the Fund costs for the last six months?(based on a hypothetical $10,000 investment; costs paid as a percentage of a $10,000 investment is annualized) Table SummaryClass Name | Cost of a $10,000 investment | Costs paid as a percentage of a $10,000 investment |
|---|
Class I | $49 | 0.96% |
|---|
|
| Expenses Paid, Amount |
$ 49
|
| Expense Ratio, Percent |
0.96%
|
| AssetsNet |
$ 521,246,082
|
| Holdings Count | Holding |
39
|
| InvestmentCompanyPortfolioTurnover |
28.00%
|
| Additional Fund Statistics [Text Block] |
Key Fund Statistics as of June 30, 2026- Total Net Assets$521,246,082
- # of Portfolio Holdings39
- Year-to-Date Total Return7.95%
- Portfolio Turnover Rate28%
Returns provided do not reflect fees and expenses of any variable annuity contract or variable life insurance policy; if these fees and expenses were included, the returns shown would be lower. |
| Holdings [Text Block] |
Fund's Composition (% of Total Net Assets)Table SummaryValue | Value |
|---|
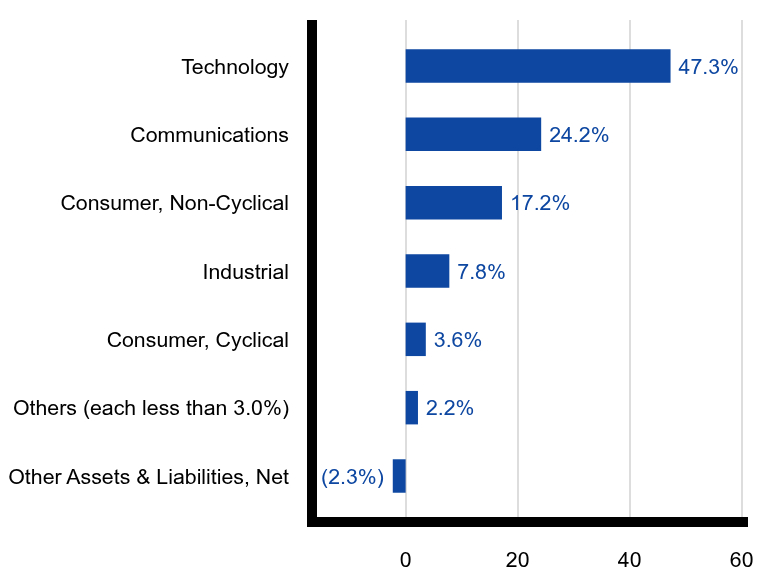
Other Assets & Liabilities, Net | (2.3%) | Others (each less than 3.0%) | 2.2% | Consumer, Cyclical | 3.6% | Industrial | 7.8% | Consumer, Non-Cyclical | 17.2% | Communications | 24.2% | Technology | 47.3% | |
| C000098970 |
|
| Shareholder Report [Line Items] |
|
| Fund Name |
Focused Growth Portfolio
|
| Class Name |
Class P
|
| No Trading Symbol [Flag] |
true
|
| Annual or Semi-Annual Statement [Text Block] |
This semi-annual shareholder report contains important information about the Focused Growth Portfolio (the "Fund") for the period of January 1, 2026 to June 30, 2026.
|
| Additional Information [Text Block] |
You can find additional information about the Fund at http://www.pacificlife.com/pacificselectfund.html. You can also request this information free of charge by contacting us toll-free at 800-722-4448 or sending an email request to PSFdocumentrequest@pacificlife.com.
|
| Additional Information Phone Number |
800-722-4448
|
| Additional Information Email |
<span style="box-sizing: border-box; color: rgb(0, 0, 0); display: inline; flex-wrap: nowrap; font-size: 12px; font-weight: 400; grid-area: auto; line-height: 14.4px; margin: 0px; overflow: visible; text-align: left; text-align-last: auto; white-space-collapse: preserve-breaks;">PSFdocumentrequest@pacificlife.com</span>
|
| Additional Information Website |
<span style="box-sizing: border-box; color: rgb(0, 0, 0); display: inline; flex-wrap: nowrap; font-size: 12px; font-weight: 400; grid-area: auto; line-height: 14.4px; margin: 0px; overflow: visible; text-align: left; text-align-last: auto; white-space-collapse: preserve-breaks;">http://www.pacificlife.com/pacificselectfund.html</span>
|
| Expenses [Text Block] |
What were the Fund costs for the last six months?(based on a hypothetical $10,000 investment; costs paid as a percentage of a $10,000 investment is annualized) Table SummaryClass Name | Cost of a $10,000 investment | Costs paid as a percentage of a $10,000 investment |
|---|
Class P | $39 | 0.76% |
|---|
|
| Expenses Paid, Amount |
$ 39
|
| Expense Ratio, Percent |
0.76%
|
| AssetsNet |
$ 521,246,082
|
| Holdings Count | Holding |
39
|
| InvestmentCompanyPortfolioTurnover |
28.00%
|
| Additional Fund Statistics [Text Block] |
Key Fund Statistics as of June 30, 2026- Total Net Assets$521,246,082
- # of Portfolio Holdings39
- Year-to-Date Total Return8.06%
- Portfolio Turnover Rate28%
Returns provided do not reflect fees and expenses of any variable annuity contract or variable life insurance policy; if these fees and expenses were included, the returns shown would be lower. |
| Holdings [Text Block] |
Fund's Composition (% of Total Net Assets)Table SummaryValue | Value |
|---|
Other Assets & Liabilities, Net | (2.3%) | Others (each less than 3.0%) | 2.2% | Consumer, Cyclical | 3.6% | Industrial | 7.8% | Consumer, Non-Cyclical | 17.2% | Communications | 24.2% | Technology | 47.3% | |
| C000078093 |
|
| Shareholder Report [Line Items] |
|
| Fund Name |
Growth Portfolio
|
| Class Name |
Class I
|
| No Trading Symbol [Flag] |
true
|
| Annual or Semi-Annual Statement [Text Block] |
This semi-annual shareholder report contains important information about the Growth Portfolio (the "Fund") for the period of January 1, 2026 to June 30, 2026.
|
| Additional Information [Text Block] |
You can find additional information about the Fund at http://www.pacificlife.com/pacificselectfund.html. You can also request this information free of charge by contacting us toll-free at 800-722-4448 or sending an email request to PSFdocumentrequest@pacificlife.com.
|
| Additional Information Phone Number |
800-722-4448
|
| Additional Information Email |
<span style="box-sizing: border-box; color: rgb(0, 0, 0); display: inline; flex-wrap: nowrap; font-size: 12px; font-weight: 400; grid-area: auto; line-height: 14.4px; margin: 0px; overflow: visible; text-align: left; text-align-last: auto; white-space-collapse: preserve-breaks;">PSFdocumentrequest@pacificlife.com</span>
|
| Additional Information Website |
<span style="box-sizing: border-box; color: rgb(0, 0, 0); display: inline; flex-wrap: nowrap; font-size: 12px; font-weight: 400; grid-area: auto; line-height: 14.4px; margin: 0px; overflow: visible; text-align: left; text-align-last: auto; white-space-collapse: preserve-breaks;">http://www.pacificlife.com/pacificselectfund.html</span>
|
| Expenses [Text Block] |
What were the Fund costs for the last six months?(based on a hypothetical $10,000 investment; costs paid as a percentage of a $10,000 investment is annualized) Table SummaryClass Name | Cost of a $10,000 investment | Costs paid as a percentage of a $10,000 investment |
|---|
Class I | $40 | 0.79% |
|---|
|
| Expenses Paid, Amount |
$ 40
|
| Expense Ratio, Percent |
0.79%
|
| AssetsNet |
$ 1,690,633,150
|
| Holdings Count | Holding |
79
|
| InvestmentCompanyPortfolioTurnover |
35.00%
|
| Additional Fund Statistics [Text Block] |
Key Fund Statistics as of June 30, 2026- Total Net Assets$1,690,633,150
- # of Portfolio Holdings79
- Year-to-Date Total Return4.02%
- Portfolio Turnover Rate35%
Returns provided do not reflect fees and expenses of any variable annuity contract or variable life insurance policy; if these fees and expenses were included, the returns shown would be lower. |
| Holdings [Text Block] |
Fund's Composition (% of Total Net Assets)Table SummaryValue | Value |
|---|
Other Assets & Liabilities, Net | (2.2%) | Others (each less than 3.0%) | 5.9% | Consumer, Cyclical | 5.2% | Financial | 5.8% | Consumer, Non-Cyclical | 7.5% | Industrial | 12.4% | Communications | 22.1% | Technology | 43.3% | |
| C000098964 |
|
| Shareholder Report [Line Items] |
|
| Fund Name |
Growth Portfolio
|
| Class Name |
Class P
|
| No Trading Symbol [Flag] |
true
|
| Annual or Semi-Annual Statement [Text Block] |
This semi-annual shareholder report contains important information about the Growth Portfolio (the "Fund") for the period of January 1, 2026 to June 30, 2026.
|
| Additional Information [Text Block] |
You can find additional information about the Fund at http://www.pacificlife.com/pacificselectfund.html. You can also request this information free of charge by contacting us toll-free at 800-722-4448 or sending an email request to PSFdocumentrequest@pacificlife.com.
|
| Additional Information Phone Number |
800-722-4448
|
| Additional Information Email |
<span style="box-sizing: border-box; color: rgb(0, 0, 0); display: inline; flex-wrap: nowrap; font-size: 12px; font-weight: 400; grid-area: auto; line-height: 14.4px; margin: 0px; overflow: visible; text-align: left; text-align-last: auto; white-space-collapse: preserve-breaks;">PSFdocumentrequest@pacificlife.com</span>
|
| Additional Information Website |
<span style="box-sizing: border-box; color: rgb(0, 0, 0); display: inline; flex-wrap: nowrap; font-size: 12px; font-weight: 400; grid-area: auto; line-height: 14.4px; margin: 0px; overflow: visible; text-align: left; text-align-last: auto; white-space-collapse: preserve-breaks;">http://www.pacificlife.com/pacificselectfund.html</span>
|
| Expenses [Text Block] |
What were the Fund costs for the last six months?(based on a hypothetical $10,000 investment; costs paid as a percentage of a $10,000 investment is annualized) Table SummaryClass Name | Cost of a $10,000 investment | Costs paid as a percentage of a $10,000 investment |
|---|
Class P | $30 | 0.59% |
|---|
|
| Expenses Paid, Amount |
$ 30
|
| Expense Ratio, Percent |
0.59%
|
| AssetsNet |
$ 1,690,633,150
|
| Holdings Count | Holding |
79
|
| InvestmentCompanyPortfolioTurnover |
35.00%
|
| Additional Fund Statistics [Text Block] |
Key Fund Statistics as of June 30, 2026- Total Net Assets$1,690,633,150
- # of Portfolio Holdings79
- Year-to-Date Total Return4.13%
- Portfolio Turnover Rate35%
Returns provided do not reflect fees and expenses of any variable annuity contract or variable life insurance policy; if these fees and expenses were included, the returns shown would be lower. |
| Holdings [Text Block] |
Fund's Composition (% of Total Net Assets)Table SummaryValue | Value |
|---|
Other Assets & Liabilities, Net | (2.2%) | Others (each less than 3.0%) | 5.9% | Consumer, Cyclical | 5.2% | Financial | 5.8% | Consumer, Non-Cyclical | 7.5% | Industrial | 12.4% | Communications | 22.1% | Technology | 43.3% | |
| C000226479 |
|
| Shareholder Report [Line Items] |
|
| Fund Name |
Hedged Equity Portfolio
|
| Class Name |
Class I
|
| No Trading Symbol [Flag] |
true
|
| Annual or Semi-Annual Statement [Text Block] |
This semi-annual shareholder report contains important information about the Hedged Equity Portfolio (the "Fund") for the period of January 1, 2026 to June 30, 2026.
|
| Additional Information [Text Block] |
You can find additional information about the Fund at http://www.pacificlife.com/pacificselectfund.html. You can also request this information free of charge by contacting us toll-free at 800-722-4448 or sending an email request to PSFdocumentrequest@pacificlife.com.
|
| Additional Information Phone Number |
800-722-4448
|
| Additional Information Email |
<span style="box-sizing: border-box; color: rgb(0, 0, 0); display: inline; flex-wrap: nowrap; font-size: 12px; font-weight: 400; grid-area: auto; line-height: 14.4px; margin: 0px; overflow: visible; text-align: left; text-align-last: auto; white-space-collapse: preserve-breaks;">PSFdocumentrequest@pacificlife.com</span>
|
| Additional Information Website |
<span style="box-sizing: border-box; color: rgb(0, 0, 0); display: inline; flex-wrap: nowrap; font-size: 12px; font-weight: 400; grid-area: auto; line-height: 14.4px; margin: 0px; overflow: visible; text-align: left; text-align-last: auto; white-space-collapse: preserve-breaks;">http://www.pacificlife.com/pacificselectfund.html</span>
|
| Expenses [Text Block] |
What were the Fund costs for the last six months?(based on a hypothetical $10,000 investment; costs paid as a percentage of a $10,000 investment is annualized) Table SummaryClass Name | Cost of a $10,000 investment | Costs paid as a percentage of a $10,000 investment |
|---|
Class I | $42 | 0.86% |
|---|
|
| Expenses Paid, Amount |
$ 42
|
| Expense Ratio, Percent |
0.86%
|
| AssetsNet |
$ 457,784,181
|
| Holdings Count | Holding |
155
|
| InvestmentCompanyPortfolioTurnover |
14.00%
|
| Additional Fund Statistics [Text Block] |
Key Fund Statistics as of June 30, 2026- Total Net Assets$457,784,181
- # of Portfolio Holdings155
- Year-to-Date Total Return(1.95%)
- Portfolio Turnover Rate14%
Returns provided do not reflect fees and expenses of any variable annuity contract or variable life insurance policy; if these fees and expenses were included, the returns shown would be lower. |
| Holdings [Text Block] |
Fund's Composition (% of Total Net Assets)Table SummaryValue | Value |
|---|
Other Assets & Liabilities, Net | 1.2% | Derivatives | 0.0% | Others (each less than 3.0%) | 6.6% | Consumer, Cyclical | 6.8% | Industrial | 8.8% | Consumer, Non-Cyclical | 12.5% | Financial | 12.6% | Communications | 15.9% | Technology | 35.6% | |
| C000226478 |
|
| Shareholder Report [Line Items] |
|
| Fund Name |
Hedged Equity Portfolio
|
| Class Name |
Class P
|
| No Trading Symbol [Flag] |
true
|
| Annual or Semi-Annual Statement [Text Block] |
This semi-annual shareholder report contains important information about the Hedged Equity Portfolio (the "Fund") for the period of January 1, 2026 to June 30, 2026.
|
| Additional Information [Text Block] |
You can find additional information about the Fund at http://www.pacificlife.com/pacificselectfund.html. You can also request this information free of charge by contacting us toll-free at 800-722-4448 or sending an email request to PSFdocumentrequest@pacificlife.com.
|
| Additional Information Phone Number |
800-722-4448
|
| Additional Information Email |
<span style="box-sizing: border-box; color: rgb(0, 0, 0); display: inline; flex-wrap: nowrap; font-size: 12px; font-weight: 400; grid-area: auto; line-height: 14.4px; margin: 0px; overflow: visible; text-align: left; text-align-last: auto; white-space-collapse: preserve-breaks;">PSFdocumentrequest@pacificlife.com</span>
|
| Additional Information Website |
<span style="box-sizing: border-box; color: rgb(0, 0, 0); display: inline; flex-wrap: nowrap; font-size: 12px; font-weight: 400; grid-area: auto; line-height: 14.4px; margin: 0px; overflow: visible; text-align: left; text-align-last: auto; white-space-collapse: preserve-breaks;">http://www.pacificlife.com/pacificselectfund.html</span>
|
| Expenses [Text Block] |
What were the Fund costs for the last six months?(based on a hypothetical $10,000 investment; costs paid as a percentage of a $10,000 investment is annualized) Table SummaryClass Name | Cost of a $10,000 investment | Costs paid as a percentage of a $10,000 investment |
|---|
Class P | $32 | 0.66% |
|---|
|
| Expenses Paid, Amount |
$ 32
|
| Expense Ratio, Percent |
0.66%
|
| AssetsNet |
$ 457,784,181
|
| Holdings Count | Holding |
155
|
| InvestmentCompanyPortfolioTurnover |
14.00%
|
| Additional Fund Statistics [Text Block] |
Key Fund Statistics as of June 30, 2026- Total Net Assets$457,784,181
- # of Portfolio Holdings155
- Year-to-Date Total Return(1.85%)
- Portfolio Turnover Rate14%
Returns provided do not reflect fees and expenses of any variable annuity contract or variable life insurance policy; if these fees and expenses were included, the returns shown would be lower. |
| Holdings [Text Block] |
Fund's Composition (% of Total Net Assets)Table SummaryValue | Value |
|---|
Other Assets & Liabilities, Net | 1.2% | Derivatives | 0.0% | Others (each less than 3.0%) | 6.6% | Consumer, Cyclical | 6.8% | Industrial | 8.8% | Consumer, Non-Cyclical | 12.5% | Financial | 12.6% | Communications | 15.9% | Technology | 35.6% | |
| C000078077 |
|
| Shareholder Report [Line Items] |
|
| Fund Name |
Large-Cap Core Portfolio
|
| Class Name |
Class I
|
| No Trading Symbol [Flag] |
true
|
| Annual or Semi-Annual Statement [Text Block] |
This semi-annual shareholder report contains important information about the Large-Cap Core Portfolio (the "Fund") for the period of January 1, 2026 to June 30, 2026.
|
| Additional Information [Text Block] |
You can find additional information about the Fund at http://www.pacificlife.com/pacificselectfund.html. You can also request this information free of charge by contacting us toll-free at 800-722-4448 or sending an email request to PSFdocumentrequest@pacificlife.com.
|
| Additional Information Phone Number |
800-722-4448
|
| Additional Information Email |
<span style="box-sizing: border-box; color: rgb(0, 0, 0); display: inline; flex-wrap: nowrap; font-size: 12px; font-weight: 400; grid-area: auto; line-height: 14.4px; margin: 0px; overflow: visible; text-align: left; text-align-last: auto; white-space-collapse: preserve-breaks;">PSFdocumentrequest@pacificlife.com</span>
|
| Additional Information Website |
<span style="box-sizing: border-box; color: rgb(0, 0, 0); display: inline; flex-wrap: nowrap; font-size: 12px; font-weight: 400; grid-area: auto; line-height: 14.4px; margin: 0px; overflow: visible; text-align: left; text-align-last: auto; white-space-collapse: preserve-breaks;">http://www.pacificlife.com/pacificselectfund.html</span>
|
| Expenses [Text Block] |
What were the Fund costs for the last six months?(based on a hypothetical $10,000 investment; costs paid as a percentage of a $10,000 investment is annualized) Table SummaryClass Name | Cost of a $10,000 investment | Costs paid as a percentage of a $10,000 investment |
|---|
Class I | $35 | 0.69% |
|---|
|
| Expenses Paid, Amount |
$ 35
|
| Expense Ratio, Percent |
0.69%
|
| AssetsNet |
$ 2,035,142,643
|
| Holdings Count | Holding |
67
|
| InvestmentCompanyPortfolioTurnover |
33.00%
|
| Additional Fund Statistics [Text Block] |
Key Fund Statistics as of June 30, 2026- Total Net Assets$2,035,142,643
- # of Portfolio Holdings67
- Year-to-Date Total Return4.39%
- Portfolio Turnover Rate33%
Returns provided do not reflect fees and expenses of any variable annuity contract or variable life insurance policy; if these fees and expenses were included, the returns shown would be lower. |
| Holdings [Text Block] |
Fund's Composition (% of Total Net Assets)Table SummaryValue | Value |
|---|
Other Assets & Liabilities, Net | (0.6%) | Others (each less than 3.0%) | 1.0% | Energy | 3.0% | Utilities | 4.2% | Industrial | 7.6% | Consumer, Cyclical | 7.8% | Consumer, Non-Cyclical | 10.3% | Financial | 15.2% | Communications | 17.7% | Technology | 33.8% | |
| C000098949 |
|
| Shareholder Report [Line Items] |
|
| Fund Name |
Large-Cap Core Portfolio
|
| Class Name |
Class P
|
| No Trading Symbol [Flag] |
true
|
| Annual or Semi-Annual Statement [Text Block] |
This semi-annual shareholder report contains important information about the Large-Cap Core Portfolio (the "Fund") for the period of January 1, 2026 to June 30, 2026.
|
| Additional Information [Text Block] |
You can find additional information about the Fund at http://www.pacificlife.com/pacificselectfund.html. You can also request this information free of charge by contacting us toll-free at 800-722-4448 or sending an email request to PSFdocumentrequest@pacificlife.com.
|
| Additional Information Phone Number |
800-722-4448
|
| Additional Information Email |
<span style="box-sizing: border-box; color: rgb(0, 0, 0); display: inline; flex-wrap: nowrap; font-size: 12px; font-weight: 400; grid-area: auto; line-height: 14.4px; margin: 0px; overflow: visible; text-align: left; text-align-last: auto; white-space-collapse: preserve-breaks;">PSFdocumentrequest@pacificlife.com</span>
|
| Additional Information Website |
<span style="box-sizing: border-box; color: rgb(0, 0, 0); display: inline; flex-wrap: nowrap; font-size: 12px; font-weight: 400; grid-area: auto; line-height: 14.4px; margin: 0px; overflow: visible; text-align: left; text-align-last: auto; white-space-collapse: preserve-breaks;">http://www.pacificlife.com/pacificselectfund.html</span>
|
| Expenses [Text Block] |
What were the Fund costs for the last six months?(based on a hypothetical $10,000 investment; costs paid as a percentage of a $10,000 investment is annualized) Table SummaryClass Name | Cost of a $10,000 investment | Costs paid as a percentage of a $10,000 investment |
|---|
Class P | $25 | 0.49% |
|---|
|
| Expenses Paid, Amount |
$ 25
|
| Expense Ratio, Percent |
0.49%
|
| AssetsNet |
$ 2,035,142,643
|
| Holdings Count | Holding |
67
|
| InvestmentCompanyPortfolioTurnover |
33.00%
|
| Additional Fund Statistics [Text Block] |
Key Fund Statistics as of June 30, 2026- Total Net Assets$2,035,142,643
- # of Portfolio Holdings67
- Year-to-Date Total Return4.49%
- Portfolio Turnover Rate33%
Returns provided do not reflect fees and expenses of any variable annuity contract or variable life insurance policy; if these fees and expenses were included, the returns shown would be lower. |
| Holdings [Text Block] |
Fund's Composition (% of Total Net Assets)Table SummaryValue | Value |
|---|
Other Assets & Liabilities, Net | (0.6%) | Others (each less than 3.0%) | 1.0% | Energy | 3.0% | Utilities | 4.2% | Industrial | 7.6% | Consumer, Cyclical | 7.8% | Consumer, Non-Cyclical | 10.3% | Financial | 15.2% | Communications | 17.7% | Technology | 33.8% | |
| C000078072 |
|
| Shareholder Report [Line Items] |
|
| Fund Name |
Large-Cap Growth Portfolio
|
| Class Name |
Class I
|
| No Trading Symbol [Flag] |
true
|
| Annual or Semi-Annual Statement [Text Block] |
This semi-annual shareholder report contains important information about the Large-Cap Growth Portfolio (the "Fund") for the period of January 1, 2026 to June 30, 2026.
|
| Additional Information [Text Block] |
You can find additional information about the Fund at http://www.pacificlife.com/pacificselectfund.html. You can also request this information free of charge by contacting us toll-free at 800-722-4448 or sending an email request to PSFdocumentrequest@pacificlife.com.
|
| Additional Information Phone Number |
800-722-4448
|
| Additional Information Email |
<span style="box-sizing: border-box; color: rgb(0, 0, 0); display: inline; flex-wrap: nowrap; font-size: 12px; font-weight: 400; grid-area: auto; line-height: 14.4px; margin: 0px; overflow: visible; text-align: left; text-align-last: auto; white-space-collapse: preserve-breaks;">PSFdocumentrequest@pacificlife.com</span>
|
| Additional Information Website |
<span style="box-sizing: border-box; color: rgb(0, 0, 0); display: inline; flex-wrap: nowrap; font-size: 12px; font-weight: 400; grid-area: auto; line-height: 14.4px; margin: 0px; overflow: visible; text-align: left; text-align-last: auto; white-space-collapse: preserve-breaks;">http://www.pacificlife.com/pacificselectfund.html</span>
|
| Expenses [Text Block] |
What were the Fund costs for the last six months?(based on a hypothetical $10,000 investment; costs paid as a percentage of a $10,000 investment is annualized) Table SummaryClass Name | Cost of a $10,000 investment | Costs paid as a percentage of a $10,000 investment |
|---|
Class I | $45 | 0.87% |
|---|
|
| Expenses Paid, Amount |
$ 45
|
| Expense Ratio, Percent |
0.87%
|
| AssetsNet |
$ 1,449,473,613
|
| Holdings Count | Holding |
123
|
| InvestmentCompanyPortfolioTurnover |
31.00%
|
| Additional Fund Statistics [Text Block] |
Key Fund Statistics as of June 30, 2026- Total Net Assets$1,449,473,613
- # of Portfolio Holdings123
- Year-to-Date Total Return8.62%
- Portfolio Turnover Rate31%
Returns provided do not reflect fees and expenses of any variable annuity contract or variable life insurance policy; if these fees and expenses were included, the returns shown would be lower. |
| Holdings [Text Block] |
Fund's Composition (% of Total Net Assets)Table SummaryValue | Value |
|---|
Other Assets & Liabilities, Net | (3.1%) | Others (each less than 3.0%) | 2.1% | Financial | 3.1% | Securities Lending Collateral | 3.1% | Industrial | 5.9% | Consumer, Cyclical | 6.2% | Consumer, Non-Cyclical | 15.1% | Communications | 31.0% | Technology | 36.6% | |
| C000098945 |
|
| Shareholder Report [Line Items] |
|
| Fund Name |
Large-Cap Growth Portfolio
|
| Class Name |
Class P
|
| No Trading Symbol [Flag] |
true
|
| Annual or Semi-Annual Statement [Text Block] |
This semi-annual shareholder report contains important information about the Large-Cap Growth Portfolio (the "Fund") for the period of January 1, 2026 to June 30, 2026.
|
| Additional Information [Text Block] |
You can find additional information about the Fund at http://www.pacificlife.com/pacificselectfund.html. You can also request this information free of charge by contacting us toll-free at 800-722-4448 or sending an email request to PSFdocumentrequest@pacificlife.com.
|
| Additional Information Phone Number |
800-722-4448
|
| Additional Information Email |
<span style="box-sizing: border-box; color: rgb(0, 0, 0); display: inline; flex-wrap: nowrap; font-size: 12px; font-weight: 400; grid-area: auto; line-height: 14.4px; margin: 0px; overflow: visible; text-align: left; text-align-last: auto; white-space-collapse: preserve-breaks;">PSFdocumentrequest@pacificlife.com</span>
|
| Additional Information Website |
<span style="box-sizing: border-box; color: rgb(0, 0, 0); display: inline; flex-wrap: nowrap; font-size: 12px; font-weight: 400; grid-area: auto; line-height: 14.4px; margin: 0px; overflow: visible; text-align: left; text-align-last: auto; white-space-collapse: preserve-breaks;">http://www.pacificlife.com/pacificselectfund.html</span>
|
| Expenses [Text Block] |
What were the Fund costs for the last six months?(based on a hypothetical $10,000 investment; costs paid as a percentage of a $10,000 investment is annualized) Table SummaryClass Name | Cost of a $10,000 investment | Costs paid as a percentage of a $10,000 investment |
|---|
Class P | $35 | 0.67% |
|---|
|
| Expenses Paid, Amount |
$ 35
|
| Expense Ratio, Percent |
0.67%
|
| AssetsNet |
$ 1,449,473,613
|
| Holdings Count | Holding |
123
|
| InvestmentCompanyPortfolioTurnover |
31.00%
|
| Additional Fund Statistics [Text Block] |
Key Fund Statistics as of June 30, 2026- Total Net Assets$1,449,473,613
- # of Portfolio Holdings123
- Year-to-Date Total Return8.73%
- Portfolio Turnover Rate31%
Returns provided do not reflect fees and expenses of any variable annuity contract or variable life insurance policy; if these fees and expenses were included, the returns shown would be lower. |
| Holdings [Text Block] |
Fund's Composition (% of Total Net Assets)Table SummaryValue | Value |
|---|
Other Assets & Liabilities, Net | (3.1%) | Others (each less than 3.0%) | 2.1% | Financial | 3.1% | Securities Lending Collateral | 3.1% | Industrial | 5.9% | Consumer, Cyclical | 6.2% | Consumer, Non-Cyclical | 15.1% | Communications | 31.0% | Technology | 36.6% | |
| C000253932 |
|
| Shareholder Report [Line Items] |
|
| Fund Name |
Large-Cap Plus Bond Alpha Portfolio
|
| Class Name |
Class I
|
| No Trading Symbol [Flag] |
true
|
| Annual or Semi-Annual Statement [Text Block] |
This semi-annual shareholder report contains important information about the Large-Cap Plus Bond Alpha Portfolio (the "Fund") for the period of January 1, 2026 to June 30, 2026.
|
| Additional Information [Text Block] |
You can find additional information about the Fund at http://www.pacificlife.com/pacificselectfund.html. You can also request this information free of charge by contacting us toll-free at 800-722-4448 or sending an email request to PSFdocumentrequest@pacificlife.com.
|
| Additional Information Phone Number |
800-722-4448
|
| Additional Information Email |
<span style="box-sizing: border-box; color: rgb(0, 0, 0); display: inline; flex-wrap: nowrap; font-size: 12px; font-weight: 400; grid-area: auto; line-height: 14.4px; margin: 0px; overflow: visible; text-align: left; text-align-last: auto; white-space-collapse: preserve-breaks;">PSFdocumentrequest@pacificlife.com</span>
|
| Additional Information Website |
<span style="box-sizing: border-box; color: rgb(0, 0, 0); display: inline; flex-wrap: nowrap; font-size: 12px; font-weight: 400; grid-area: auto; line-height: 14.4px; margin: 0px; overflow: visible; text-align: left; text-align-last: auto; white-space-collapse: preserve-breaks;">http://www.pacificlife.com/pacificselectfund.html</span>
|
| Expenses [Text Block] |
What were the Fund costs for the last six months?(based on a hypothetical $10,000 investment; costs paid as a percentage of a $10,000 investment is annualized) Table SummaryClass Name | Cost of a $10,000 investment | Costs paid as a percentage of a $10,000 investment |
|---|
Class I | $34 | 0.65% |
|---|
|
| Expenses Paid, Amount |
$ 34
|
| Expense Ratio, Percent |
0.65%
|
| AssetsNet |
$ 1,139,702,470
|
| Holdings Count | Holding |
460
|
| InvestmentCompanyPortfolioTurnover |
19.00%
|
| Additional Fund Statistics [Text Block] |
Key Fund Statistics as of June 30, 2026- Total Net Assets$1,139,702,470
- # of Portfolio Holdings460
- Year-to-Date Total Return9.44%
- Portfolio Turnover Rate19%
Returns provided do not reflect fees and expenses of any variable annuity contract or variable life insurance policy; if these fees and expenses were included, the returns shown would be lower. |
| Holdings [Text Block] |
Fund's Composition (% of Total Net Assets)Table SummaryValue | Value |
|---|
Other Assets and Liabilities, Net | (0.3%) | Derivatives | (0.8%) | Mortgage-Backed Securities | 3.4% | Securities Lending Collateral | 4.5% | U.S. Treasury Obligations | 9.9% | Short-Term Investments | 17.1% | Asset-Backed Securities | 18.9% | Corporate Bonds & Notes | 47.3% | |
| C000253931 |
|
| Shareholder Report [Line Items] |
|
| Fund Name |
Large-Cap Plus Bond Alpha Portfolio
|
| Class Name |
Class P
|
| No Trading Symbol [Flag] |
true
|
| Annual or Semi-Annual Statement [Text Block] |
This semi-annual shareholder report contains important information about the Large-Cap Plus Bond Alpha Portfolio (the "Fund") for the period of January 1, 2026 to June 30, 2026.
|
| Additional Information [Text Block] |
You can find additional information about the Fund at http://www.pacificlife.com/pacificselectfund.html. You can also request this information free of charge by contacting us toll-free at 800-722-4448 or sending an email request to PSFdocumentrequest@pacificlife.com.
|
| Additional Information Phone Number |
800-722-4448
|
| Additional Information Email |
<span style="box-sizing: border-box; color: rgb(0, 0, 0); display: inline; flex-wrap: nowrap; font-size: 12px; font-weight: 400; grid-area: auto; line-height: 14.4px; margin: 0px; overflow: visible; text-align: left; text-align-last: auto; white-space-collapse: preserve-breaks;">PSFdocumentrequest@pacificlife.com</span>
|
| Additional Information Website |
<span style="box-sizing: border-box; color: rgb(0, 0, 0); display: inline; flex-wrap: nowrap; font-size: 12px; font-weight: 400; grid-area: auto; line-height: 14.4px; margin: 0px; overflow: visible; text-align: left; text-align-last: auto; white-space-collapse: preserve-breaks;">http://www.pacificlife.com/pacificselectfund.html</span>
|
| Expenses [Text Block] |
What were the Fund costs for the last six months?(based on a hypothetical $10,000 investment; costs paid as a percentage of a $10,000 investment is annualized) Table SummaryClass Name | Cost of a $10,000 investment | Costs paid as a percentage of a $10,000 investment |
|---|
Class P | $23 | 0.45% |
|---|
|
| Expenses Paid, Amount |
$ 23
|
| Expense Ratio, Percent |
0.45%
|
| AssetsNet |
$ 1,139,702,470
|
| Holdings Count | Holding |
460
|
| InvestmentCompanyPortfolioTurnover |
19.00%
|
| Additional Fund Statistics [Text Block] |
Key Fund Statistics as of June 30, 2026- Total Net Assets$1,139,702,470
- # of Portfolio Holdings460
- Year-to-Date Total Return9.55%
- Portfolio Turnover Rate19%
Returns provided do not reflect fees and expenses of any variable annuity contract or variable life insurance policy; if these fees and expenses were included, the returns shown would be lower. |
| Holdings [Text Block] |
Fund's Composition (% of Total Net Assets)Table SummaryValue | Value |
|---|
Other Assets and Liabilities, Net | (0.3%) | Derivatives | (0.8%) | Mortgage-Backed Securities | 3.4% | Securities Lending Collateral | 4.5% | U.S. Treasury Obligations | 9.9% | Short-Term Investments | 17.1% | Asset-Backed Securities | 18.9% | Corporate Bonds & Notes | 47.3% | |
| C000078083 |
|
| Shareholder Report [Line Items] |
|
| Fund Name |
Large-Cap Value Portfolio
|
| Class Name |
Class I
|
| No Trading Symbol [Flag] |
true
|
| Annual or Semi-Annual Statement [Text Block] |
This semi-annual shareholder report contains important information about the Large-Cap Value Portfolio (the "Fund") for the period of January 1, 2026 to June 30, 2026.
|
| Additional Information [Text Block] |
You can find additional information about the Fund at http://www.pacificlife.com/pacificselectfund.html. You can also request this information free of charge by contacting us toll-free at 800-722-4448 or sending an email request to PSFdocumentrequest@pacificlife.com.
|
| Additional Information Phone Number |
800-722-4448
|
| Additional Information Email |
<span style="box-sizing: border-box; color: rgb(0, 0, 0); display: inline; flex-wrap: nowrap; font-size: 12px; font-weight: 400; grid-area: auto; line-height: 14.4px; margin: 0px; overflow: visible; text-align: left; text-align-last: auto; white-space-collapse: preserve-breaks;">PSFdocumentrequest@pacificlife.com</span>
|
| Additional Information Website |
<span style="box-sizing: border-box; color: rgb(0, 0, 0); display: inline; flex-wrap: nowrap; font-size: 12px; font-weight: 400; grid-area: auto; line-height: 14.4px; margin: 0px; overflow: visible; text-align: left; text-align-last: auto; white-space-collapse: preserve-breaks;">http://www.pacificlife.com/pacificselectfund.html</span>
|
| Expenses [Text Block] |
What were the Fund costs for the last six months?(based on a hypothetical $10,000 investment; costs paid as a percentage of a $10,000 investment is annualized) Table SummaryClass Name | Cost of a $10,000 investment | Costs paid as a percentage of a $10,000 investment |
|---|
Class I | $45 | 0.84% |
|---|
|
| Expenses Paid, Amount |
$ 45
|
| Expense Ratio, Percent |
0.84%
|
| AssetsNet |
$ 1,096,602,367
|
| Holdings Count | Holding |
90
|
| InvestmentCompanyPortfolioTurnover |
116.00%
|
| Additional Fund Statistics [Text Block] |
Key Fund Statistics as of June 30, 2026- Total Net Assets$1,096,602,367
- # of Portfolio Holdings90
- Year-to-Date Total Return14.58%
- Portfolio Turnover Rate116%
Returns provided do not reflect fees and expenses of any variable annuity contract or variable life insurance policy; if these fees and expenses were included, the returns shown would be lower. |
| Holdings [Text Block] |
Fund's Composition (% of Total Net Assets)Table SummaryValue | Value |
|---|
Other Assets & Liabilities, Net | (0.7%) | Others (each less than 3.0%) | 2.5% | Basic Materials | 3.0% | Energy | 7.1% | Consumer, Cyclical | 7.7% | Industrial | 10.4% | Technology | 13.0% | Communications | 13.5% | Consumer, Non-Cyclical | 20.7% | Financial | 22.8% | |
| C000098955 |
|
| Shareholder Report [Line Items] |
|
| Fund Name |
Large-Cap Value Portfolio
|
| Class Name |
Class P
|
| No Trading Symbol [Flag] |
true
|
| Annual or Semi-Annual Statement [Text Block] |
This semi-annual shareholder report contains important information about the Large-Cap Value Portfolio (the "Fund") for the period of January 1, 2026 to June 30, 2026.
|
| Additional Information [Text Block] |
You can find additional information about the Fund at http://www.pacificlife.com/pacificselectfund.html. You can also request this information free of charge by contacting us toll-free at 800-722-4448 or sending an email request to PSFdocumentrequest@pacificlife.com.
|
| Additional Information Phone Number |
800-722-4448
|
| Additional Information Email |
<span style="box-sizing: border-box; color: rgb(0, 0, 0); display: inline; flex-wrap: nowrap; font-size: 12px; font-weight: 400; grid-area: auto; line-height: 14.4px; margin: 0px; overflow: visible; text-align: left; text-align-last: auto; white-space-collapse: preserve-breaks;">PSFdocumentrequest@pacificlife.com</span>
|
| Additional Information Website |
<span style="box-sizing: border-box; color: rgb(0, 0, 0); display: inline; flex-wrap: nowrap; font-size: 12px; font-weight: 400; grid-area: auto; line-height: 14.4px; margin: 0px; overflow: visible; text-align: left; text-align-last: auto; white-space-collapse: preserve-breaks;">http://www.pacificlife.com/pacificselectfund.html</span>
|
| Expenses [Text Block] |
What were the Fund costs for the last six months?(based on a hypothetical $10,000 investment; costs paid as a percentage of a $10,000 investment is annualized) Table SummaryClass Name | Cost of a $10,000 investment | Costs paid as a percentage of a $10,000 investment |
|---|
Class P | $34 | 0.64% |
|---|
|
| Expenses Paid, Amount |
$ 34
|
| Expense Ratio, Percent |
0.64%
|
| AssetsNet |
$ 1,096,602,367
|
| Holdings Count | Holding |
90
|
| InvestmentCompanyPortfolioTurnover |
116.00%
|
| Additional Fund Statistics [Text Block] |
Key Fund Statistics as of June 30, 2026- Total Net Assets$1,096,602,367
- # of Portfolio Holdings90
- Year-to-Date Total Return14.69%
- Portfolio Turnover Rate116%
Returns provided do not reflect fees and expenses of any variable annuity contract or variable life insurance policy; if these fees and expenses were included, the returns shown would be lower. |
| Holdings [Text Block] |
Fund's Composition (% of Total Net Assets)Table SummaryValue | Value |
|---|
Other Assets & Liabilities, Net | (0.7%) | Others (each less than 3.0%) | 2.5% | Basic Materials | 3.0% | Energy | 7.1% | Consumer, Cyclical | 7.7% | Industrial | 10.4% | Technology | 13.0% | Communications | 13.5% | Consumer, Non-Cyclical | 20.7% | Financial | 22.8% | |
| C000078086 |
|
| Shareholder Report [Line Items] |
|
| Fund Name |
Mid-Cap Growth Portfolio
|
| Class Name |
Class I
|
| No Trading Symbol [Flag] |
true
|
| Annual or Semi-Annual Statement [Text Block] |
This semi-annual shareholder report contains important information about the Mid-Cap Growth Portfolio (the "Fund") for the period of January 1, 2026 to June 30, 2026.
|
| Additional Information [Text Block] |
You can find additional information about the Fund at http://www.pacificlife.com/pacificselectfund.html. You can also request this information free of charge by contacting us toll-free at 800-722-4448 or sending an email request to PSFdocumentrequest@pacificlife.com.
|
| Additional Information Phone Number |
800-722-4448
|
| Additional Information Email |
<span style="box-sizing: border-box; color: rgb(0, 0, 0); display: inline; flex-wrap: nowrap; font-size: 12px; font-weight: 400; grid-area: auto; line-height: 14.4px; margin: 0px; overflow: visible; text-align: left; text-align-last: auto; white-space-collapse: preserve-breaks;">PSFdocumentrequest@pacificlife.com</span>
|
| Additional Information Website |
<span style="box-sizing: border-box; color: rgb(0, 0, 0); display: inline; flex-wrap: nowrap; font-size: 12px; font-weight: 400; grid-area: auto; line-height: 14.4px; margin: 0px; overflow: visible; text-align: left; text-align-last: auto; white-space-collapse: preserve-breaks;">http://www.pacificlife.com/pacificselectfund.html</span>
|
| Expenses [Text Block] |
What were the Fund costs for the last six months?(based on a hypothetical $10,000 investment; costs paid as a percentage of a $10,000 investment is annualized) Table SummaryClass Name | Cost of a $10,000 investment | Costs paid as a percentage of a $10,000 investment |
|---|
Class I | $46 | 0.90% |
|---|
|
| Expenses Paid, Amount |
$ 46
|
| Expense Ratio, Percent |
0.90%
|
| AssetsNet |
$ 677,839,515
|
| Holdings Count | Holding |
129
|
| InvestmentCompanyPortfolioTurnover |
61.00%
|
| Additional Fund Statistics [Text Block] |
Key Fund Statistics as of June 30, 2026- Total Net Assets$677,839,515
- # of Portfolio Holdings129
- Year-to-Date Total Return5.01%
- Portfolio Turnover Rate61%
Returns provided do not reflect fees and expenses of any variable annuity contract or variable life insurance policy; if these fees and expenses were included, the returns shown would be lower. |
| Holdings [Text Block] |
Fund's Composition (% of Total Net Assets)Table SummaryValue | Value |
|---|
Other Assets & Liabilities, Net | (3.5%) | Others (each less than 3.0%) | 6.1% | Securities Lending Collateral | 4.3% | Communications | 6.9% | Financial | 8.0% | Consumer, Non-Cyclical | 14.7% | Consumer, Cyclical | 16.1% | Industrial | 18.7% | Technology | 28.7% | |
| C000098958 |
|
| Shareholder Report [Line Items] |
|
| Fund Name |
Mid-Cap Growth Portfolio
|
| Class Name |
Class P
|
| No Trading Symbol [Flag] |
true
|
| Annual or Semi-Annual Statement [Text Block] |
This semi-annual shareholder report contains important information about the Mid-Cap Growth Portfolio (the "Fund") for the period of January 1, 2026 to June 30, 2026.
|
| Additional Information [Text Block] |
You can find additional information about the Fund at http://www.pacificlife.com/pacificselectfund.html. You can also request this information free of charge by contacting us toll-free at 800-722-4448 or sending an email request to PSFdocumentrequest@pacificlife.com.
|
| Additional Information Phone Number |
800-722-4448
|
| Additional Information Email |
<span style="box-sizing: border-box; color: rgb(0, 0, 0); display: inline; flex-wrap: nowrap; font-size: 12px; font-weight: 400; grid-area: auto; line-height: 14.4px; margin: 0px; overflow: visible; text-align: left; text-align-last: auto; white-space-collapse: preserve-breaks;">PSFdocumentrequest@pacificlife.com</span>
|
| Additional Information Website |
<span style="box-sizing: border-box; color: rgb(0, 0, 0); display: inline; flex-wrap: nowrap; font-size: 12px; font-weight: 400; grid-area: auto; line-height: 14.4px; margin: 0px; overflow: visible; text-align: left; text-align-last: auto; white-space-collapse: preserve-breaks;">http://www.pacificlife.com/pacificselectfund.html</span>
|
| Expenses [Text Block] |
What were the Fund costs for the last six months?(based on a hypothetical $10,000 investment; costs paid as a percentage of a $10,000 investment is annualized) Table SummaryClass Name | Cost of a $10,000 investment | Costs paid as a percentage of a $10,000 investment |
|---|
Class P | $36 | 0.70% |
|---|
|
| Expenses Paid, Amount |
$ 36
|
| Expense Ratio, Percent |
0.70%
|
| AssetsNet |
$ 677,839,515
|
| Holdings Count | Holding |
129
|
| InvestmentCompanyPortfolioTurnover |
61.00%
|
| Additional Fund Statistics [Text Block] |
Key Fund Statistics as of June 30, 2026- Total Net Assets$677,839,515
- # of Portfolio Holdings129
- Year-to-Date Total Return5.11%
- Portfolio Turnover Rate61%
Returns provided do not reflect fees and expenses of any variable annuity contract or variable life insurance policy; if these fees and expenses were included, the returns shown would be lower. |
| Holdings [Text Block] |
Fund's Composition (% of Total Net Assets)Table SummaryValue | Value |
|---|
Other Assets & Liabilities, Net | (3.5%) | Others (each less than 3.0%) | 6.1% | Securities Lending Collateral | 4.3% | Communications | 6.9% | Financial | 8.0% | Consumer, Non-Cyclical | 14.7% | Consumer, Cyclical | 16.1% | Industrial | 18.7% | Technology | 28.7% | |
| C000078113 |
|
| Shareholder Report [Line Items] |
|
| Fund Name |
Mid-Cap Plus Bond Alpha Portfolio
|
| Class Name |
Class I
|
| No Trading Symbol [Flag] |
true
|
| Annual or Semi-Annual Statement [Text Block] |
This semi-annual shareholder report contains important information about the Mid-Cap Plus Bond Alpha Portfolio (the "Fund") for the period of January 1, 2026 to June 30, 2026.
|
| Additional Information [Text Block] |
You can find additional information about the Fund at http://www.pacificlife.com/pacificselectfund.html. You can also request this information free of charge by contacting us toll-free at 800-722-4448 or sending an email request to PSFdocumentrequest@pacificlife.com.
|
| Additional Information Phone Number |
800-722-4448
|
| Additional Information Email |
<span style="box-sizing: border-box; color: rgb(0, 0, 0); display: inline; flex-wrap: nowrap; font-size: 12px; font-weight: 400; grid-area: auto; line-height: 14.4px; margin: 0px; overflow: visible; text-align: left; text-align-last: auto; white-space-collapse: preserve-breaks;">PSFdocumentrequest@pacificlife.com</span>
|
| Additional Information Website |
<span style="box-sizing: border-box; color: rgb(0, 0, 0); display: inline; flex-wrap: nowrap; font-size: 12px; font-weight: 400; grid-area: auto; line-height: 14.4px; margin: 0px; overflow: visible; text-align: left; text-align-last: auto; white-space-collapse: preserve-breaks;">http://www.pacificlife.com/pacificselectfund.html</span>
|
| Expenses [Text Block] |
What were the Fund costs for the last six months?(based on a hypothetical $10,000 investment; costs paid as a percentage of a $10,000 investment is annualized) Table SummaryClass Name | Cost of a $10,000 investment | Costs paid as a percentage of a $10,000 investment |
|---|
Class I | $35 | 0.65% |
|---|
|
| Expenses Paid, Amount |
$ 35
|
| Expense Ratio, Percent |
0.65%
|
| AssetsNet |
$ 824,206,388
|
| Holdings Count | Holding |
446
|
| InvestmentCompanyPortfolioTurnover |
20.00%
|
| Additional Fund Statistics [Text Block] |
Key Fund Statistics as of June 30, 2026- Total Net Assets$824,206,388
- # of Portfolio Holdings446
- Year-to-Date Total Return14.30%
- Portfolio Turnover Rate20%
Returns provided do not reflect fees and expenses of any variable annuity contract or variable life insurance policy; if these fees and expenses were included, the returns shown would be lower. |
| Holdings [Text Block] |
Fund's Composition (% of Total Net Assets)Table SummaryValue | Value |
|---|
Other Assets and Liabilities, Net | 1.8% | Derivatives | 0.7% | Securities Lending Collateral | 3.8% | Mortgage-Backed Securities | 4.4% | U.S. Treasury Obligations | 9.5% | Short-Term Investments | 16.8% | Asset-Backed Securities | 17.7% | Corporate Bonds & Notes | 45.3% | |
| C000098972 |
|
| Shareholder Report [Line Items] |
|
| Fund Name |
Mid-Cap Plus Bond Alpha Portfolio
|
| Class Name |
Class P
|
| No Trading Symbol [Flag] |
true
|
| Annual or Semi-Annual Statement [Text Block] |
This semi-annual shareholder report contains important information about the Mid-Cap Plus Bond Alpha Portfolio (the "Fund") for the period of January 1, 2026 to June 30, 2026.
|
| Additional Information [Text Block] |
You can find additional information about the Fund at http://www.pacificlife.com/pacificselectfund.html. You can also request this information free of charge by contacting us toll-free at 800-722-4448 or sending an email request to PSFdocumentrequest@pacificlife.com.
|
| Additional Information Phone Number |
800-722-4448
|
| Additional Information Email |
<span style="box-sizing: border-box; color: rgb(0, 0, 0); display: inline; flex-wrap: nowrap; font-size: 12px; font-weight: 400; grid-area: auto; line-height: 14.4px; margin: 0px; overflow: visible; text-align: left; text-align-last: auto; white-space-collapse: preserve-breaks;">PSFdocumentrequest@pacificlife.com</span>
|
| Additional Information Website |
<span style="box-sizing: border-box; color: rgb(0, 0, 0); display: inline; flex-wrap: nowrap; font-size: 12px; font-weight: 400; grid-area: auto; line-height: 14.4px; margin: 0px; overflow: visible; text-align: left; text-align-last: auto; white-space-collapse: preserve-breaks;">http://www.pacificlife.com/pacificselectfund.html</span>
|
| Expenses [Text Block] |
What were the Fund costs for the last six months?(based on a hypothetical $10,000 investment; costs paid as a percentage of a $10,000 investment is annualized) Table SummaryClass Name | Cost of a $10,000 investment | Costs paid as a percentage of a $10,000 investment |
|---|
Class P | $24 | 0.45% |
|---|
|
| Expenses Paid, Amount |
$ 24
|
| Expense Ratio, Percent |
0.45%
|
| AssetsNet |
$ 824,206,388
|
| Holdings Count | Holding |
446
|
| InvestmentCompanyPortfolioTurnover |
20.00%
|
| Additional Fund Statistics [Text Block] |
Key Fund Statistics as of June 30, 2026- Total Net Assets$824,206,388
- # of Portfolio Holdings446
- Year-to-Date Total Return14.41%
- Portfolio Turnover Rate20%
Returns provided do not reflect fees and expenses of any variable annuity contract or variable life insurance policy; if these fees and expenses were included, the returns shown would be lower. |
| Holdings [Text Block] |
Fund's Composition (% of Total Net Assets)Table SummaryValue | Value |
|---|
Other Assets and Liabilities, Net | 1.8% | Derivatives | 0.7% | Securities Lending Collateral | 3.8% | Mortgage-Backed Securities | 4.4% | U.S. Treasury Obligations | 9.5% | Short-Term Investments | 16.8% | Asset-Backed Securities | 17.7% | Corporate Bonds & Notes | 45.3% | |
| C000078098 |
|
| Shareholder Report [Line Items] |
|
| Fund Name |
Mid-Cap Value Portfolio
|
| Class Name |
Class I
|
| No Trading Symbol [Flag] |
true
|
| Annual or Semi-Annual Statement [Text Block] |
This semi-annual shareholder report contains important information about the Mid-Cap Value Portfolio (the "Fund") for the period of January 1, 2026 to June 30, 2026.
|
| Additional Information [Text Block] |
You can find additional information about the Fund at http://www.pacificlife.com/pacificselectfund.html. You can also request this information free of charge by contacting us toll-free at 800-722-4448 or sending an email request to PSFdocumentrequest@pacificlife.com.
|
| Additional Information Phone Number |
800-722-4448
|
| Additional Information Email |
<span style="box-sizing: border-box; color: rgb(0, 0, 0); display: inline; flex-wrap: nowrap; font-size: 12px; font-weight: 400; grid-area: auto; line-height: 14.4px; margin: 0px; overflow: visible; text-align: left; text-align-last: auto; white-space-collapse: preserve-breaks;">PSFdocumentrequest@pacificlife.com</span>
|
| Additional Information Website |
<span style="box-sizing: border-box; color: rgb(0, 0, 0); display: inline; flex-wrap: nowrap; font-size: 12px; font-weight: 400; grid-area: auto; line-height: 14.4px; margin: 0px; overflow: visible; text-align: left; text-align-last: auto; white-space-collapse: preserve-breaks;">http://www.pacificlife.com/pacificselectfund.html</span>
|
| Expenses [Text Block] |
What were the Fund costs for the last six months?(based on a hypothetical $10,000 investment; costs paid as a percentage of a $10,000 investment is annualized) Table SummaryClass Name | Cost of a $10,000 investment | Costs paid as a percentage of a $10,000 investment |
|---|
Class I | $49 | 0.94% |
|---|
|
| Expenses Paid, Amount |
$ 49
|
| Expense Ratio, Percent |
0.94%
|
| AssetsNet |
$ 542,875,760
|
| Holdings Count | Holding |
138
|
| InvestmentCompanyPortfolioTurnover |
28.00%
|
| Additional Fund Statistics [Text Block] |
Key Fund Statistics as of June 30, 2026- Total Net Assets$542,875,760
- # of Portfolio Holdings138
- Year-to-Date Total Return11.08%
- Portfolio Turnover Rate28%
Returns provided do not reflect fees and expenses of any variable annuity contract or variable life insurance policy; if these fees and expenses were included, the returns shown would be lower. |
| Holdings [Text Block] |
Fund's Composition (% of Total Net Assets)Table SummaryValue | Value |
|---|
Other Assets & Liabilities, Net | (0.2%) | Others (each less than 3.0%) | 2.3% | Basic Materials | 3.2% | Technology | 4.6% | Utilities | 4.8% | Communications | 5.6% | Energy | 6.8% | Consumer, Cyclical | 12.6% | Consumer, Non-Cyclical | 16.8% | Industrial | 21.5% | Financial | 22.0% | |
| C000098969 |
|
| Shareholder Report [Line Items] |
|
| Fund Name |
Mid-Cap Value Portfolio
|
| Class Name |
Class P
|
| No Trading Symbol [Flag] |
true
|
| Annual or Semi-Annual Statement [Text Block] |
This semi-annual shareholder report contains important information about the Mid-Cap Value Portfolio (the "Fund") for the period of January 1, 2026 to June 30, 2026.
|
| Additional Information [Text Block] |
You can find additional information about the Fund at http://www.pacificlife.com/pacificselectfund.html. You can also request this information free of charge by contacting us toll-free at 800-722-4448 or sending an email request to PSFdocumentrequest@pacificlife.com.
|
| Additional Information Phone Number |
800-722-4448
|
| Additional Information Email |
<span style="box-sizing: border-box; color: rgb(0, 0, 0); display: inline; flex-wrap: nowrap; font-size: 12px; font-weight: 400; grid-area: auto; line-height: 14.4px; margin: 0px; overflow: visible; text-align: left; text-align-last: auto; white-space-collapse: preserve-breaks;">PSFdocumentrequest@pacificlife.com</span>
|
| Additional Information Website |
<span style="box-sizing: border-box; color: rgb(0, 0, 0); display: inline; flex-wrap: nowrap; font-size: 12px; font-weight: 400; grid-area: auto; line-height: 14.4px; margin: 0px; overflow: visible; text-align: left; text-align-last: auto; white-space-collapse: preserve-breaks;">http://www.pacificlife.com/pacificselectfund.html</span>
|
| Expenses [Text Block] |
What were the Fund costs for the last six months?(based on a hypothetical $10,000 investment; costs paid as a percentage of a $10,000 investment is annualized) Table SummaryClass Name | Cost of a $10,000 investment | Costs paid as a percentage of a $10,000 investment |
|---|
Class P | $39 | 0.74% |
|---|
|
| Expenses Paid, Amount |
$ 39
|
| Expense Ratio, Percent |
0.74%
|
| AssetsNet |
$ 542,875,760
|
| Holdings Count | Holding |
138
|
| InvestmentCompanyPortfolioTurnover |
28.00%
|
| Additional Fund Statistics [Text Block] |
Key Fund Statistics as of June 30, 2026- Total Net Assets$542,875,760
- # of Portfolio Holdings138
- Year-to-Date Total Return11.19%
- Portfolio Turnover Rate28%
Returns provided do not reflect fees and expenses of any variable annuity contract or variable life insurance policy; if these fees and expenses were included, the returns shown would be lower. |
| Holdings [Text Block] |
Fund's Composition (% of Total Net Assets)Table SummaryValue | Value |
|---|
Other Assets & Liabilities, Net | (0.2%) | Others (each less than 3.0%) | 2.3% | Basic Materials | 3.2% | Technology | 4.6% | Utilities | 4.8% | Communications | 5.6% | Energy | 6.8% | Consumer, Cyclical | 12.6% | Consumer, Non-Cyclical | 16.8% | Industrial | 21.5% | Financial | 22.0% | |
| C000253933 |
|
| Shareholder Report [Line Items] |
|
| Fund Name |
QQQ Plus Bond Alpha Portfolio
|
| Class Name |
Class I
|
| No Trading Symbol [Flag] |
true
|
| Annual or Semi-Annual Statement [Text Block] |
This semi-annual shareholder report contains important information about the QQQ Plus Bond Alpha Portfolio (the "Fund") for the period of January 1, 2026 to June 30, 2026.
|
| Additional Information [Text Block] |
You can find additional information about the Fund at http://www.pacificlife.com/pacificselectfund.html. You can also request this information free of charge by contacting us toll-free at 800-722-4448 or sending an email request to PSFdocumentrequest@pacificlife.com.
|
| Additional Information Phone Number |
800-722-4448
|
| Additional Information Email |
<span style="box-sizing: border-box; color: rgb(0, 0, 0); display: inline; flex-wrap: nowrap; font-size: 12px; font-weight: 400; grid-area: auto; line-height: 14.4px; margin: 0px; overflow: visible; text-align: left; text-align-last: auto; white-space-collapse: preserve-breaks;">PSFdocumentrequest@pacificlife.com</span>
|
| Additional Information Website |
<span style="box-sizing: border-box; color: rgb(0, 0, 0); display: inline; flex-wrap: nowrap; font-size: 12px; font-weight: 400; grid-area: auto; line-height: 14.4px; margin: 0px; overflow: visible; text-align: left; text-align-last: auto; white-space-collapse: preserve-breaks;">http://www.pacificlife.com/pacificselectfund.html</span>
|
| Expenses [Text Block] |
What were the Fund costs for the last six months?(based on a hypothetical $10,000 investment; costs paid as a percentage of a $10,000 investment is annualized) Table SummaryClass Name | Cost of a $10,000 investment | Costs paid as a percentage of a $10,000 investment |
|---|
Class I | $35 | 0.64% |
|---|
|
| Expenses Paid, Amount |
$ 35
|
| Expense Ratio, Percent |
0.64%
|
| AssetsNet |
$ 711,739,359
|
| Holdings Count | Holding |
437
|
| InvestmentCompanyPortfolioTurnover |
27.00%
|
| Additional Fund Statistics [Text Block] |
Key Fund Statistics as of June 30, 2026- Total Net Assets$711,739,359
- # of Portfolio Holdings437
- Year-to-Date Total Return19.44%
- Portfolio Turnover Rate27%
Returns provided do not reflect fees and expenses of any variable annuity contract or variable life insurance policy; if these fees and expenses were included, the returns shown would be lower. |
| Holdings [Text Block] |
Fund's Composition (% of Total Net Assets)Table SummaryValue | Value |
|---|
Other Assets and Liabilities, Net | 3.5% | Derivatives | (0.9%) | Others (each less than 3.0%) | 2.2% | Mortgage-Backed Securities | 3.7% | U.S. Treasury Obligations | 9.7% | Asset-Backed Securities | 17.1% | Short-Term Investments | 18.6% | Corporate Bonds & Notes | 46.1% | |
| C000253934 |
|
| Shareholder Report [Line Items] |
|
| Fund Name |
QQQ Plus Bond Alpha Portfolio
|
| Class Name |
Class P
|
| No Trading Symbol [Flag] |
true
|
| Annual or Semi-Annual Statement [Text Block] |
This semi-annual shareholder report contains important information about the QQQ Plus Bond Alpha Portfolio (the "Fund") for the period of January 1, 2026 to June 30, 2026.
|
| Additional Information [Text Block] |
You can find additional information about the Fund at http://www.pacificlife.com/pacificselectfund.html. You can also request this information free of charge by contacting us toll-free at 800-722-4448 or sending an email request to PSFdocumentrequest@pacificlife.com.
|
| Additional Information Phone Number |
800-722-4448
|
| Additional Information Email |
<span style="box-sizing: border-box; color: rgb(0, 0, 0); display: inline; flex-wrap: nowrap; font-size: 12px; font-weight: 400; grid-area: auto; line-height: 14.4px; margin: 0px; overflow: visible; text-align: left; text-align-last: auto; white-space-collapse: preserve-breaks;">PSFdocumentrequest@pacificlife.com</span>
|
| Additional Information Website |
<span style="box-sizing: border-box; color: rgb(0, 0, 0); display: inline; flex-wrap: nowrap; font-size: 12px; font-weight: 400; grid-area: auto; line-height: 14.4px; margin: 0px; overflow: visible; text-align: left; text-align-last: auto; white-space-collapse: preserve-breaks;">http://www.pacificlife.com/pacificselectfund.html</span>
|
| Expenses [Text Block] |
What were the Fund costs for the last six months?(based on a hypothetical $10,000 investment; costs paid as a percentage of a $10,000 investment is annualized) Table SummaryClass Name | Cost of a $10,000 investment | Costs paid as a percentage of a $10,000 investment |
|---|
Class P | $24 | 0.44% |
|---|
|
| Expenses Paid, Amount |
$ 24
|
| Expense Ratio, Percent |
0.44%
|
| AssetsNet |
$ 711,739,359
|
| Holdings Count | Holding |
437
|
| InvestmentCompanyPortfolioTurnover |
27.00%
|
| Additional Fund Statistics [Text Block] |
Key Fund Statistics as of June 30, 2026- Total Net Assets$711,739,359
- # of Portfolio Holdings437
- Year-to-Date Total Return19.56%
- Portfolio Turnover Rate27%
Returns provided do not reflect fees and expenses of any variable annuity contract or variable life insurance policy; if these fees and expenses were included, the returns shown would be lower. |
| Holdings [Text Block] |
Fund's Composition (% of Total Net Assets)Table SummaryValue | Value |
|---|
Other Assets and Liabilities, Net | 3.5% | Derivatives | (0.9%) | Others (each less than 3.0%) | 2.2% | Mortgage-Backed Securities | 3.7% | U.S. Treasury Obligations | 9.7% | Asset-Backed Securities | 17.1% | Short-Term Investments | 18.6% | Corporate Bonds & Notes | 46.1% | |
| C000078087 |
|
| Shareholder Report [Line Items] |
|
| Fund Name |
Small-Cap Equity Portfolio
|
| Class Name |
Class I
|
| No Trading Symbol [Flag] |
true
|
| Annual or Semi-Annual Statement [Text Block] |
This semi-annual shareholder report contains important information about the Small-Cap Equity Portfolio (the "Fund") for the period of January 1, 2026 to June 30, 2026.
|
| Additional Information [Text Block] |
You can find additional information about the Fund at http://www.pacificlife.com/pacificselectfund.html. You can also request this information free of charge by contacting us toll-free at 800-722-4448 or sending an email request to PSFdocumentrequest@pacificlife.com.
|
| Additional Information Phone Number |
800-722-4448
|
| Additional Information Email |
<span style="box-sizing: border-box; color: rgb(0, 0, 0); display: inline; flex-wrap: nowrap; font-size: 12px; font-weight: 400; grid-area: auto; line-height: 14.4px; margin: 0px; overflow: visible; text-align: left; text-align-last: auto; white-space-collapse: preserve-breaks;">PSFdocumentrequest@pacificlife.com</span>
|
| Additional Information Website |
<span style="box-sizing: border-box; color: rgb(0, 0, 0); display: inline; flex-wrap: nowrap; font-size: 12px; font-weight: 400; grid-area: auto; line-height: 14.4px; margin: 0px; overflow: visible; text-align: left; text-align-last: auto; white-space-collapse: preserve-breaks;">http://www.pacificlife.com/pacificselectfund.html</span>
|
| Expenses [Text Block] |
What were the Fund costs for the last six months?(based on a hypothetical $10,000 investment; costs paid as a percentage of a $10,000 investment is annualized) Table SummaryClass Name | Cost of a $10,000 investment | Costs paid as a percentage of a $10,000 investment |
|---|
Class I | $50 | 0.92% |
|---|
|
| Expenses Paid, Amount |
$ 50
|
| Expense Ratio, Percent |
0.92%
|
| AssetsNet |
$ 318,890,337
|
| Holdings Count | Holding |
1,433
|
| InvestmentCompanyPortfolioTurnover |
62.00%
|
| Additional Fund Statistics [Text Block] |
Key Fund Statistics as of June 30, 2026- Total Net Assets$318,890,337
- # of Portfolio Holdings1,433
- Year-to-Date Total Return21.03%
- Portfolio Turnover Rate62%
Returns provided do not reflect fees and expenses of any variable annuity contract or variable life insurance policy; if these fees and expenses were included, the returns shown would be lower. |
| Holdings [Text Block] |
Fund's Composition (% of Total Net Assets)Table SummaryValue | Value |
|---|
Other Assets & Liabilities, Net | (1.2%) | Derivatives | 0.0% | Others (each less than 3.0%) | 7.9% | Technology | 5.3% | Basic Materials | 7.3% | Energy | 8.2% | Consumer, Cyclical | 9.0% | Consumer, Non-Cyclical | 9.8% | Industrial | 20.0% | Financial | 33.7% | |
| C000098959 |
|
| Shareholder Report [Line Items] |
|
| Fund Name |
Small-Cap Equity Portfolio
|
| Class Name |
Class P
|
| No Trading Symbol [Flag] |
true
|
| Annual or Semi-Annual Statement [Text Block] |
This semi-annual shareholder report contains important information about the Small-Cap Equity Portfolio (the "Fund") for the period of January 1, 2026 to June 30, 2026.
|
| Additional Information [Text Block] |
You can find additional information about the Fund at http://www.pacificlife.com/pacificselectfund.html. You can also request this information free of charge by contacting us toll-free at 800-722-4448 or sending an email request to PSFdocumentrequest@pacificlife.com.
|
| Additional Information Phone Number |
800-722-4448
|
| Additional Information Email |
<span style="box-sizing: border-box; color: rgb(0, 0, 0); display: inline; flex-wrap: nowrap; font-size: 12px; font-weight: 400; grid-area: auto; line-height: 14.4px; margin: 0px; overflow: visible; text-align: left; text-align-last: auto; white-space-collapse: preserve-breaks;">PSFdocumentrequest@pacificlife.com</span>
|
| Additional Information Website |
<span style="box-sizing: border-box; color: rgb(0, 0, 0); display: inline; flex-wrap: nowrap; font-size: 12px; font-weight: 400; grid-area: auto; line-height: 14.4px; margin: 0px; overflow: visible; text-align: left; text-align-last: auto; white-space-collapse: preserve-breaks;">http://www.pacificlife.com/pacificselectfund.html</span>
|
| Expenses [Text Block] |
What were the Fund costs for the last six months?(based on a hypothetical $10,000 investment; costs paid as a percentage of a $10,000 investment is annualized) Table SummaryClass Name | Cost of a $10,000 investment | Costs paid as a percentage of a $10,000 investment |
|---|
Class P | $39 | 0.72% |
|---|
|
| Expenses Paid, Amount |
$ 39
|
| Expense Ratio, Percent |
0.72%
|
| AssetsNet |
$ 318,890,337
|
| Holdings Count | Holding |
1,433
|
| InvestmentCompanyPortfolioTurnover |
62.00%
|
| Additional Fund Statistics [Text Block] |
Key Fund Statistics as of June 30, 2026- Total Net Assets$318,890,337
- # of Portfolio Holdings1,433
- Year-to-Date Total Return21.15%
- Portfolio Turnover Rate62%
Returns provided do not reflect fees and expenses of any variable annuity contract or variable life insurance policy; if these fees and expenses were included, the returns shown would be lower. |
| Holdings [Text Block] |
Fund's Composition (% of Total Net Assets)Table SummaryValue | Value |
|---|
Other Assets & Liabilities, Net | (1.2%) | Derivatives | 0.0% | Others (each less than 3.0%) | 7.9% | Technology | 5.3% | Basic Materials | 7.3% | Energy | 8.2% | Consumer, Cyclical | 9.0% | Consumer, Non-Cyclical | 9.8% | Industrial | 20.0% | Financial | 33.7% | |
| C000078074 |
|
| Shareholder Report [Line Items] |
|
| Fund Name |
Small-Cap Growth Portfolio
|
| Class Name |
Class I
|
| No Trading Symbol [Flag] |
true
|
| Annual or Semi-Annual Statement [Text Block] |
This semi-annual shareholder report contains important information about the Small-Cap Growth Portfolio (the "Fund") for the period of January 1, 2026 to June 30, 2026.
|
| Additional Information [Text Block] |
You can find additional information about the Fund at http://www.pacificlife.com/pacificselectfund.html. You can also request this information free of charge by contacting us toll-free at 800-722-4448 or sending an email request to PSFdocumentrequest@pacificlife.com.
|
| Additional Information Phone Number |
800-722-4448
|
| Additional Information Email |
<span style="box-sizing: border-box; color: rgb(0, 0, 0); display: inline; flex-wrap: nowrap; font-size: 12px; font-weight: 400; grid-area: auto; line-height: 14.4px; margin: 0px; overflow: visible; text-align: left; text-align-last: auto; white-space-collapse: preserve-breaks;">PSFdocumentrequest@pacificlife.com</span>
|
| Additional Information Website |
<span style="box-sizing: border-box; color: rgb(0, 0, 0); display: inline; flex-wrap: nowrap; font-size: 12px; font-weight: 400; grid-area: auto; line-height: 14.4px; margin: 0px; overflow: visible; text-align: left; text-align-last: auto; white-space-collapse: preserve-breaks;">http://www.pacificlife.com/pacificselectfund.html</span>
|
| Expenses [Text Block] |
What were the Fund costs for the last six months?(based on a hypothetical $10,000 investment; costs paid as a percentage of a $10,000 investment is annualized) Table SummaryClass Name | Cost of a $10,000 investment | Costs paid as a percentage of a $10,000 investment |
|---|
Class I | $48 | 0.84% |
|---|
|
| Expenses Paid, Amount |
$ 48
|
| Expense Ratio, Percent |
0.84%
|
| AssetsNet |
$ 592,318,557
|
| Holdings Count | Holding |
124
|
| InvestmentCompanyPortfolioTurnover |
87.00%
|
| Additional Fund Statistics [Text Block] |
Key Fund Statistics as of June 30, 2026- Total Net Assets$592,318,557
- # of Portfolio Holdings124
- Year-to-Date Total Return31.17%
- Portfolio Turnover Rate87%
Returns provided do not reflect fees and expenses of any variable annuity contract or variable life insurance policy; if these fees and expenses were included, the returns shown would be lower. |
| Holdings [Text Block] |
Fund's Composition (% of Total Net Assets)Table SummaryValue | Value |
|---|
Other Assets & Liabilities, Net | (8.8%) | Others (each less than 3.0%) | 4.8% | Energy | 3.9% | Financial | 4.7% | Securities Lending Collateral | 9.5% | Consumer, Cyclical | 11.3% | Technology | 17.1% | Industrial | 26.4% | Consumer, Non-Cyclical | 31.1% | |
| C000098947 |
|
| Shareholder Report [Line Items] |
|
| Fund Name |
Small-Cap Growth Portfolio
|
| Class Name |
Class P
|
| No Trading Symbol [Flag] |
true
|
| Annual or Semi-Annual Statement [Text Block] |
This semi-annual shareholder report contains important information about the Small-Cap Growth Portfolio (the "Fund") for the period of January 1, 2026 to June 30, 2026.
|
| Additional Information [Text Block] |
You can find additional information about the Fund at http://www.pacificlife.com/pacificselectfund.html. You can also request this information free of charge by contacting us toll-free at 800-722-4448 or sending an email request to PSFdocumentrequest@pacificlife.com.
|
| Additional Information Phone Number |
800-722-4448
|
| Additional Information Email |
<span style="box-sizing: border-box; color: rgb(0, 0, 0); display: inline; flex-wrap: nowrap; font-size: 12px; font-weight: 400; grid-area: auto; line-height: 14.4px; margin: 0px; overflow: visible; text-align: left; text-align-last: auto; white-space-collapse: preserve-breaks;">PSFdocumentrequest@pacificlife.com</span>
|
| Additional Information Website |
<span style="box-sizing: border-box; color: rgb(0, 0, 0); display: inline; flex-wrap: nowrap; font-size: 12px; font-weight: 400; grid-area: auto; line-height: 14.4px; margin: 0px; overflow: visible; text-align: left; text-align-last: auto; white-space-collapse: preserve-breaks;">http://www.pacificlife.com/pacificselectfund.html</span>
|
| Expenses [Text Block] |
What were the Fund costs for the last six months?(based on a hypothetical $10,000 investment; costs paid as a percentage of a $10,000 investment is annualized) Table SummaryClass Name | Cost of a $10,000 investment | Costs paid as a percentage of a $10,000 investment |
|---|
Class P | $37 | 0.64% |
|---|
|
| Expenses Paid, Amount |
$ 37
|
| Expense Ratio, Percent |
0.64%
|
| AssetsNet |
$ 592,318,557
|
| Holdings Count | Holding |
124
|
| InvestmentCompanyPortfolioTurnover |
87.00%
|
| Additional Fund Statistics [Text Block] |
Key Fund Statistics as of June 30, 2026- Total Net Assets$592,318,557
- # of Portfolio Holdings124
- Year-to-Date Total Return31.30%
- Portfolio Turnover Rate87%
Returns provided do not reflect fees and expenses of any variable annuity contract or variable life insurance policy; if these fees and expenses were included, the returns shown would be lower. |
| Holdings [Text Block] |
Fund's Composition (% of Total Net Assets)Table SummaryValue | Value |
|---|
Other Assets & Liabilities, Net | (8.8%) | Others (each less than 3.0%) | 4.8% | Energy | 3.9% | Financial | 4.7% | Securities Lending Collateral | 9.5% | Consumer, Cyclical | 11.3% | Technology | 17.1% | Industrial | 26.4% | Consumer, Non-Cyclical | 31.1% | |
| C000078116 |
|
| Shareholder Report [Line Items] |
|
| Fund Name |
Small-Cap Index Portfolio
|
| Class Name |
Class I
|
| No Trading Symbol [Flag] |
true
|
| Annual or Semi-Annual Statement [Text Block] |
This semi-annual shareholder report contains important information about the Small-Cap Index Portfolio (the "Fund") for the period of January 1, 2026 to June 30, 2026.
|
| Additional Information [Text Block] |
You can find additional information about the Fund at http://www.pacificlife.com/pacificselectfund.html. You can also request this information free of charge by contacting us toll-free at 800-722-4448 or sending an email request to PSFdocumentrequest@pacificlife.com.
|
| Additional Information Phone Number |
800-722-4448
|
| Additional Information Email |
<span style="box-sizing: border-box; color: rgb(0, 0, 0); display: inline; flex-wrap: nowrap; font-size: 12px; font-weight: 400; grid-area: auto; line-height: 14.4px; margin: 0px; overflow: visible; text-align: left; text-align-last: auto; white-space-collapse: preserve-breaks;">PSFdocumentrequest@pacificlife.com</span>
|
| Additional Information Website |
<span style="box-sizing: border-box; color: rgb(0, 0, 0); display: inline; flex-wrap: nowrap; font-size: 12px; font-weight: 400; grid-area: auto; line-height: 14.4px; margin: 0px; overflow: visible; text-align: left; text-align-last: auto; white-space-collapse: preserve-breaks;">http://www.pacificlife.com/pacificselectfund.html</span>
|
| Expenses [Text Block] |
What were the Fund costs for the last six months?(based on a hypothetical $10,000 investment; costs paid as a percentage of a $10,000 investment is annualized) Table SummaryClass Name | Cost of a $10,000 investment | Costs paid as a percentage of a $10,000 investment |
|---|
Class I | $31 | 0.56% |
|---|
|
| Expenses Paid, Amount |
$ 31
|
| Expense Ratio, Percent |
0.56%
|
| AssetsNet |
$ 916,202,979
|
| Holdings Count | Holding |
1,999
|
| InvestmentCompanyPortfolioTurnover |
23.00%
|
| Additional Fund Statistics [Text Block] |
Key Fund Statistics as of June 30, 2026- Total Net Assets$916,202,979
- # of Portfolio Holdings1,999
- Year-to-Date Total Return22.27%
- Portfolio Turnover Rate23%
Returns provided do not reflect fees and expenses of any variable annuity contract or variable life insurance policy; if these fees and expenses were included, the returns shown would be lower. |
| Holdings [Text Block] |
Fund's Composition (% of Total Net Assets)Table SummaryValue | Value |
|---|
Other Assets & Liabilities, Net | (9.9%) | Derivatives | 0.0% | Others (each less than 3.0%) | 2.7% | Communications | 3.9% | Basic Materials | 3.9% | Energy | 5.5% | Technology | 9.6% | Securities Lending Collateral | 10.4% | Consumer, Cyclical | 10.6% | Industrial | 14.1% | Financial | 24.3% | Consumer, Non-Cyclical | 24.9% | |
| C000098975 |
|
| Shareholder Report [Line Items] |
|
| Fund Name |
Small-Cap Index Portfolio
|
| Class Name |
Class P
|
| No Trading Symbol [Flag] |
true
|
| Annual or Semi-Annual Statement [Text Block] |
This semi-annual shareholder report contains important information about the Small-Cap Index Portfolio (the "Fund") for the period of January 1, 2026 to June 30, 2026.
|
| Additional Information [Text Block] |
You can find additional information about the Fund at http://www.pacificlife.com/pacificselectfund.html. You can also request this information free of charge by contacting us toll-free at 800-722-4448 or sending an email request to PSFdocumentrequest@pacificlife.com.
|
| Additional Information Phone Number |
800-722-4448
|
| Additional Information Email |
<span style="box-sizing: border-box; color: rgb(0, 0, 0); display: inline; flex-wrap: nowrap; font-size: 12px; font-weight: 400; grid-area: auto; line-height: 14.4px; margin: 0px; overflow: visible; text-align: left; text-align-last: auto; white-space-collapse: preserve-breaks;">PSFdocumentrequest@pacificlife.com</span>
|
| Additional Information Website |
<span style="box-sizing: border-box; color: rgb(0, 0, 0); display: inline; flex-wrap: nowrap; font-size: 12px; font-weight: 400; grid-area: auto; line-height: 14.4px; margin: 0px; overflow: visible; text-align: left; text-align-last: auto; white-space-collapse: preserve-breaks;">http://www.pacificlife.com/pacificselectfund.html</span>
|
| Expenses [Text Block] |
What were the Fund costs for the last six months?(based on a hypothetical $10,000 investment; costs paid as a percentage of a $10,000 investment is annualized) Table SummaryClass Name | Cost of a $10,000 investment | Costs paid as a percentage of a $10,000 investment |
|---|
Class P | $20 | 0.36% |
|---|
|
| Expenses Paid, Amount |
$ 20
|
| Expense Ratio, Percent |
0.36%
|
| AssetsNet |
$ 916,202,979
|
| Holdings Count | Holding |
1,999
|
| InvestmentCompanyPortfolioTurnover |
23.00%
|
| Additional Fund Statistics [Text Block] |
Key Fund Statistics as of June 30, 2026- Total Net Assets$916,202,979
- # of Portfolio Holdings1,999
- Year-to-Date Total Return22.39%
- Portfolio Turnover Rate23%
Returns provided do not reflect fees and expenses of any variable annuity contract or variable life insurance policy; if these fees and expenses were included, the returns shown would be lower. |
| Holdings [Text Block] |
Fund's Composition (% of Total Net Assets)Table SummaryValue | Value |
|---|
Other Assets & Liabilities, Net | (9.9%) | Derivatives | 0.0% | Others (each less than 3.0%) | 2.7% | Communications | 3.9% | Basic Materials | 3.9% | Energy | 5.5% | Technology | 9.6% | Securities Lending Collateral | 10.4% | Consumer, Cyclical | 10.6% | Industrial | 14.1% | Financial | 24.3% | Consumer, Non-Cyclical | 24.9% | |
| C000253936 |
|
| Shareholder Report [Line Items] |
|
| Fund Name |
Small-Cap Plus Bond Alpha Portfolio
|
| Class Name |
Class I
|
| No Trading Symbol [Flag] |
true
|
| Annual or Semi-Annual Statement [Text Block] |
This semi-annual shareholder report contains important information about the Small-Cap Plus Bond Alpha Portfolio (the "Fund") for the period of January 1, 2026 to June 30, 2026.
|
| Additional Information [Text Block] |
You can find additional information about the Fund at http://www.pacificlife.com/pacificselectfund.html. You can also request this information free of charge by contacting us toll-free at 800-722-4448 or sending an email request to PSFdocumentrequest@pacificlife.com.
|
| Additional Information Phone Number |
800-722-4448
|
| Additional Information Email |
<span style="box-sizing: border-box; color: rgb(0, 0, 0); display: inline; flex-wrap: nowrap; font-size: 12px; font-weight: 400; grid-area: auto; line-height: 14.4px; margin: 0px; overflow: visible; text-align: left; text-align-last: auto; white-space-collapse: preserve-breaks;">PSFdocumentrequest@pacificlife.com</span>
|
| Additional Information Website |
<span style="box-sizing: border-box; color: rgb(0, 0, 0); display: inline; flex-wrap: nowrap; font-size: 12px; font-weight: 400; grid-area: auto; line-height: 14.4px; margin: 0px; overflow: visible; text-align: left; text-align-last: auto; white-space-collapse: preserve-breaks;">http://www.pacificlife.com/pacificselectfund.html</span>
|
| Expenses [Text Block] |
What were the Fund costs for the last six months?(based on a hypothetical $10,000 investment; costs paid as a percentage of a $10,000 investment is annualized) Table SummaryClass Name | Cost of a $10,000 investment | Costs paid as a percentage of a $10,000 investment |
|---|
Class I | $38 | 0.70% |
|---|
|
| Expenses Paid, Amount |
$ 38
|
| Expense Ratio, Percent |
0.70%
|
| AssetsNet |
$ 241,179,018
|
| Holdings Count | Holding |
448
|
| InvestmentCompanyPortfolioTurnover |
15.00%
|
| Additional Fund Statistics [Text Block] |
Key Fund Statistics as of June 30, 2026- Total Net Assets$241,179,018
- # of Portfolio Holdings448
- Year-to-Date Total Return21.80%
- Portfolio Turnover Rate15%
Returns provided do not reflect fees and expenses of any variable annuity contract or variable life insurance policy; if these fees and expenses were included, the returns shown would be lower. |
| Holdings [Text Block] |
Fund's Composition (% of Total Net Assets)Table SummaryValue | Value |
|---|
Other Assets and Liabilities, Net | 3.8% | Derivatives | 1.9% | Others (each less than 3.0%) | 2.2% | Mortgage-Backed Securities | 3.4% | U.S. Treasury Obligations | 9.3% | Short-Term Investments | 17.1% | Asset-Backed Securities | 17.3% | Corporate Bonds & Notes | 45.0% | |
| C000253935 |
|
| Shareholder Report [Line Items] |
|
| Fund Name |
Small-Cap Plus Bond Alpha Portfolio
|
| Class Name |
Class P
|
| No Trading Symbol [Flag] |
true
|
| Annual or Semi-Annual Statement [Text Block] |
This semi-annual shareholder report contains important information about the Small-Cap Plus Bond Alpha Portfolio (the "Fund") for the period of January 1, 2026 to June 30, 2026.
|
| Additional Information [Text Block] |
You can find additional information about the Fund at http://www.pacificlife.com/pacificselectfund.html. You can also request this information free of charge by contacting us toll-free at 800-722-4448 or sending an email request to PSFdocumentrequest@pacificlife.com.
|
| Additional Information Phone Number |
800-722-4448
|
| Additional Information Email |
<span style="box-sizing: border-box; color: rgb(0, 0, 0); display: inline; flex-wrap: nowrap; font-size: 12px; font-weight: 400; grid-area: auto; line-height: 14.4px; margin: 0px; overflow: visible; text-align: left; text-align-last: auto; white-space-collapse: preserve-breaks;">PSFdocumentrequest@pacificlife.com</span>
|
| Additional Information Website |
<span style="box-sizing: border-box; color: rgb(0, 0, 0); display: inline; flex-wrap: nowrap; font-size: 12px; font-weight: 400; grid-area: auto; line-height: 14.4px; margin: 0px; overflow: visible; text-align: left; text-align-last: auto; white-space-collapse: preserve-breaks;">http://www.pacificlife.com/pacificselectfund.html</span>
|
| Expenses [Text Block] |
What were the Fund costs for the last six months?(based on a hypothetical $10,000 investment; costs paid as a percentage of a $10,000 investment is annualized) Table SummaryClass Name | Cost of a $10,000 investment | Costs paid as a percentage of a $10,000 investment |
|---|
Class P | $28 | 0.50% |
|---|
|
| Expenses Paid, Amount |
$ 28
|
| Expense Ratio, Percent |
0.50%
|
| AssetsNet |
$ 241,179,018
|
| Holdings Count | Holding |
448
|
| InvestmentCompanyPortfolioTurnover |
15.00%
|
| Additional Fund Statistics [Text Block] |
Key Fund Statistics as of June 30, 2026- Total Net Assets$241,179,018
- # of Portfolio Holdings448
- Year-to-Date Total Return21.92%
- Portfolio Turnover Rate15%
Returns provided do not reflect fees and expenses of any variable annuity contract or variable life insurance policy; if these fees and expenses were included, the returns shown would be lower. |
| Holdings [Text Block] |
Fund's Composition (% of Total Net Assets)Table SummaryValue | Value |
|---|
Other Assets and Liabilities, Net | 3.8% | Derivatives | 1.9% | Others (each less than 3.0%) | 2.2% | Mortgage-Backed Securities | 3.4% | U.S. Treasury Obligations | 9.3% | Short-Term Investments | 17.1% | Asset-Backed Securities | 17.3% | Corporate Bonds & Notes | 45.0% | |
| C000078075 |
|
| Shareholder Report [Line Items] |
|
| Fund Name |
Small-Cap Value Portfolio
|
| Class Name |
Class I
|
| No Trading Symbol [Flag] |
true
|
| Annual or Semi-Annual Statement [Text Block] |
This semi-annual shareholder report contains important information about the Small-Cap Value Portfolio (the "Fund") for the period of January 1, 2026 to June 30, 2026.
|
| Additional Information [Text Block] |
You can find additional information about the Fund at http://www.pacificlife.com/pacificselectfund.html. You can also request this information free of charge by contacting us toll-free at 800-722-4448 or sending an email request to PSFdocumentrequest@pacificlife.com.
|
| Additional Information Phone Number |
800-722-4448
|
| Additional Information Email |
<span style="box-sizing: border-box; color: rgb(0, 0, 0); display: inline; flex-wrap: nowrap; font-size: 12px; font-weight: 400; grid-area: auto; line-height: 14.4px; margin: 0px; overflow: visible; text-align: left; text-align-last: auto; white-space-collapse: preserve-breaks;">PSFdocumentrequest@pacificlife.com</span>
|
| Additional Information Website |
<span style="box-sizing: border-box; color: rgb(0, 0, 0); display: inline; flex-wrap: nowrap; font-size: 12px; font-weight: 400; grid-area: auto; line-height: 14.4px; margin: 0px; overflow: visible; text-align: left; text-align-last: auto; white-space-collapse: preserve-breaks;">http://www.pacificlife.com/pacificselectfund.html</span>
|
| Expenses [Text Block] |
What were the Fund costs for the last six months?(based on a hypothetical $10,000 investment; costs paid as a percentage of a $10,000 investment is annualized) Table SummaryClass Name | Cost of a $10,000 investment | Costs paid as a percentage of a $10,000 investment |
|---|
Class I | $46 | 0.83% |
|---|
|
| Expenses Paid, Amount |
$ 46
|
| Expense Ratio, Percent |
0.83%
|
| AssetsNet |
$ 437,752,998
|
| Holdings Count | Holding |
607
|
| InvestmentCompanyPortfolioTurnover |
19.00%
|
| Additional Fund Statistics [Text Block] |
Key Fund Statistics as of June 30, 2026- Total Net Assets$437,752,998
- # of Portfolio Holdings607
- Year-to-Date Total Return22.48%
- Portfolio Turnover Rate19%
Returns provided do not reflect fees and expenses of any variable annuity contract or variable life insurance policy; if these fees and expenses were included, the returns shown would be lower. |
| Holdings [Text Block] |
Fund's Composition (% of Total Net Assets)Table SummaryValue | Value |
|---|
Other Assets & Liabilities, Net | (2.3%) | Others (each less than 3.0%) | 4.5% | Basic Materials | 3.8% | Communications | 5.5% | Consumer, Non-Cyclical | 11.3% | Energy | 12.5% | Industrial | 15.4% | Consumer, Cyclical | 20.9% | Financial | 28.4% | |
| C000098948 |
|
| Shareholder Report [Line Items] |
|
| Fund Name |
Small-Cap Value Portfolio
|
| Class Name |
Class P
|
| No Trading Symbol [Flag] |
true
|
| Annual or Semi-Annual Statement [Text Block] |
This semi-annual shareholder report contains important information about the Small-Cap Value Portfolio (the "Fund") for the period of January 1, 2026 to June 30, 2026.
|
| Additional Information [Text Block] |
You can find additional information about the Fund at http://www.pacificlife.com/pacificselectfund.html. You can also request this information free of charge by contacting us toll-free at 800-722-4448 or sending an email request to PSFdocumentrequest@pacificlife.com.
|
| Additional Information Phone Number |
800-722-4448
|
| Additional Information Email |
<span style="box-sizing: border-box; color: rgb(0, 0, 0); display: inline; flex-wrap: nowrap; font-size: 12px; font-weight: 400; grid-area: auto; line-height: 14.4px; margin: 0px; overflow: visible; text-align: left; text-align-last: auto; white-space-collapse: preserve-breaks;">PSFdocumentrequest@pacificlife.com</span>
|
| Additional Information Website |
<span style="box-sizing: border-box; color: rgb(0, 0, 0); display: inline; flex-wrap: nowrap; font-size: 12px; font-weight: 400; grid-area: auto; line-height: 14.4px; margin: 0px; overflow: visible; text-align: left; text-align-last: auto; white-space-collapse: preserve-breaks;">http://www.pacificlife.com/pacificselectfund.html</span>
|
| Expenses [Text Block] |
What were the Fund costs for the last six months?(based on a hypothetical $10,000 investment; costs paid as a percentage of a $10,000 investment is annualized) Table SummaryClass Name | Cost of a $10,000 investment | Costs paid as a percentage of a $10,000 investment |
|---|
Class P | $35 | 0.63% |
|---|
|
| Expenses Paid, Amount |
$ 35
|
| Expense Ratio, Percent |
0.63%
|
| AssetsNet |
$ 437,752,998
|
| Holdings Count | Holding |
607
|
| InvestmentCompanyPortfolioTurnover |
19.00%
|
| Additional Fund Statistics [Text Block] |
Key Fund Statistics as of June 30, 2026- Total Net Assets$437,752,998
- # of Portfolio Holdings607
- Year-to-Date Total Return22.61%
- Portfolio Turnover Rate19%
Returns provided do not reflect fees and expenses of any variable annuity contract or variable life insurance policy; if these fees and expenses were included, the returns shown would be lower. |
| Holdings [Text Block] |
Fund's Composition (% of Total Net Assets)Table SummaryValue | Value |
|---|
Other Assets & Liabilities, Net | (2.3%) | Others (each less than 3.0%) | 4.5% | Basic Materials | 3.8% | Communications | 5.5% | Consumer, Non-Cyclical | 11.3% | Energy | 12.5% | Industrial | 15.4% | Consumer, Cyclical | 20.9% | Financial | 28.4% | |
| C000078084 |
|
| Shareholder Report [Line Items] |
|
| Fund Name |
Value Portfolio
|
| Class Name |
Class I
|
| No Trading Symbol [Flag] |
true
|
| Annual or Semi-Annual Statement [Text Block] |
This semi-annual shareholder report contains important information about the Value Portfolio (the "Fund") for the period of January 1, 2026 to June 30, 2026.
|
| Additional Information [Text Block] |
You can find additional information about the Fund at http://www.pacificlife.com/pacificselectfund.html. You can also request this information free of charge by contacting us toll-free at 800-722-4448 or sending an email request to PSFdocumentrequest@pacificlife.com.
|
| Additional Information Phone Number |
800-722-4448
|
| Additional Information Email |
<span style="box-sizing: border-box; color: rgb(0, 0, 0); display: inline; flex-wrap: nowrap; font-size: 12px; font-weight: 400; grid-area: auto; line-height: 14.4px; margin: 0px; overflow: visible; text-align: left; text-align-last: auto; white-space-collapse: preserve-breaks;">PSFdocumentrequest@pacificlife.com</span>
|
| Additional Information Website |
<span style="box-sizing: border-box; color: rgb(0, 0, 0); display: inline; flex-wrap: nowrap; font-size: 12px; font-weight: 400; grid-area: auto; line-height: 14.4px; margin: 0px; overflow: visible; text-align: left; text-align-last: auto; white-space-collapse: preserve-breaks;">http://www.pacificlife.com/pacificselectfund.html</span>
|
| Expenses [Text Block] |
What were the Fund costs for the last six months?(based on a hypothetical $10,000 investment; costs paid as a percentage of a $10,000 investment is annualized) Table SummaryClass Name | Cost of a $10,000 investment | Costs paid as a percentage of a $10,000 investment |
|---|
Class I | $45 | 0.86% |
|---|
|
| Expenses Paid, Amount |
$ 45
|
| Expense Ratio, Percent |
0.86%
|
| AssetsNet |
$ 1,278,887,553
|
| Holdings Count | Holding |
91
|
| InvestmentCompanyPortfolioTurnover |
26.00%
|
| Additional Fund Statistics [Text Block] |
Key Fund Statistics as of June 30, 2026- Total Net Assets$1,278,887,553
- # of Portfolio Holdings91
- Year-to-Date Total Return10.51%
- Portfolio Turnover Rate26%
Returns provided do not reflect fees and expenses of any variable annuity contract or variable life insurance policy; if these fees and expenses were included, the returns shown would be lower. |
| Holdings [Text Block] |
Fund's Composition (% of Total Net Assets)Table SummaryValue | Value |
|---|
Other Assets & Liabilities, Net | 2.0% | Derivatives | 0.1% | Others (each less than 3.0%) | 2.4% | Utilities | 3.8% | Energy | 5.7% | Communications | 7.6% | Consumer, Cyclical | 8.1% | Industrial | 9.6% | Technology | 17.2% | Financial | 19.8% | Consumer, Non-Cyclical | 23.7% | |
| C000098956 |
|
| Shareholder Report [Line Items] |
|
| Fund Name |
Value Portfolio
|
| Class Name |
Class P
|
| No Trading Symbol [Flag] |
true
|
| Annual or Semi-Annual Statement [Text Block] |
This semi-annual shareholder report contains important information about the Value Portfolio (the "Fund") for the period of January 1, 2026 to June 30, 2026.
|
| Additional Information [Text Block] |
You can find additional information about the Fund at http://www.pacificlife.com/pacificselectfund.html. You can also request this information free of charge by contacting us toll-free at 800-722-4448 or sending an email request to PSFdocumentrequest@pacificlife.com.
|
| Additional Information Phone Number |
800-722-4448
|
| Additional Information Email |
<span style="box-sizing: border-box; color: rgb(0, 0, 0); display: inline; flex-wrap: nowrap; font-size: 12px; font-weight: 400; grid-area: auto; line-height: 14.4px; margin: 0px; overflow: visible; text-align: left; text-align-last: auto; white-space-collapse: preserve-breaks;">PSFdocumentrequest@pacificlife.com</span>
|
| Additional Information Website |
<span style="box-sizing: border-box; color: rgb(0, 0, 0); display: inline; flex-wrap: nowrap; font-size: 12px; font-weight: 400; grid-area: auto; line-height: 14.4px; margin: 0px; overflow: visible; text-align: left; text-align-last: auto; white-space-collapse: preserve-breaks;">http://www.pacificlife.com/pacificselectfund.html</span>
|
| Expenses [Text Block] |
What were the Fund costs for the last six months?(based on a hypothetical $10,000 investment; costs paid as a percentage of a $10,000 investment is annualized) Table SummaryClass Name | Cost of a $10,000 investment | Costs paid as a percentage of a $10,000 investment |
|---|
Class P | $34 | 0.66% |
|---|
|
| Expenses Paid, Amount |
$ 34
|
| Expense Ratio, Percent |
0.66%
|
| AssetsNet |
$ 1,278,887,553
|
| Holdings Count | Holding |
91
|
| InvestmentCompanyPortfolioTurnover |
26.00%
|
| Additional Fund Statistics [Text Block] |
Key Fund Statistics as of June 30, 2026- Total Net Assets$1,278,887,553
- # of Portfolio Holdings91
- Year-to-Date Total Return10.62%
- Portfolio Turnover Rate26%
Returns provided do not reflect fees and expenses of any variable annuity contract or variable life insurance policy; if these fees and expenses were included, the returns shown would be lower. |
| Holdings [Text Block] |
Fund's Composition (% of Total Net Assets)Table SummaryValue | Value |
|---|
Other Assets & Liabilities, Net | 2.0% | Derivatives | 0.1% | Others (each less than 3.0%) | 2.4% | Utilities | 3.8% | Energy | 5.7% | Communications | 7.6% | Consumer, Cyclical | 8.1% | Industrial | 9.6% | Technology | 17.2% | Financial | 19.8% | Consumer, Non-Cyclical | 23.7% | |
| C000125302 |
|
| Shareholder Report [Line Items] |
|
| Fund Name |
Value Advantage Portfolio
|
| Class Name |
Class I
|
| No Trading Symbol [Flag] |
true
|
| Annual or Semi-Annual Statement [Text Block] |
This semi-annual shareholder report contains important information about the Value Advantage Portfolio (the "Fund") for the period of January 1, 2026 to June 30, 2026.
|
| Additional Information [Text Block] |
You can find additional information about the Fund at http://www.pacificlife.com/pacificselectfund.html. You can also request this information free of charge by contacting us toll-free at 800-722-4448 or sending an email request to PSFdocumentrequest@pacificlife.com.
|
| Additional Information Phone Number |
800-722-4448
|
| Additional Information Email |
<span style="box-sizing: border-box; color: rgb(0, 0, 0); display: inline; flex-wrap: nowrap; font-size: 12px; font-weight: 400; grid-area: auto; line-height: 14.4px; margin: 0px; overflow: visible; text-align: left; text-align-last: auto; white-space-collapse: preserve-breaks;">PSFdocumentrequest@pacificlife.com</span>
|
| Additional Information Website |
<span style="box-sizing: border-box; color: rgb(0, 0, 0); display: inline; flex-wrap: nowrap; font-size: 12px; font-weight: 400; grid-area: auto; line-height: 14.4px; margin: 0px; overflow: visible; text-align: left; text-align-last: auto; white-space-collapse: preserve-breaks;">http://www.pacificlife.com/pacificselectfund.html</span>
|
| Expenses [Text Block] |
What were the Fund costs for the last six months?(based on a hypothetical $10,000 investment; costs paid as a percentage of a $10,000 investment is annualized) Table SummaryClass Name | Cost of a $10,000 investment | Costs paid as a percentage of a $10,000 investment |
|---|
Class I | $46 | 0.89% |
|---|
|
| Expenses Paid, Amount |
$ 46
|
| Expense Ratio, Percent |
0.89%
|
| AssetsNet |
$ 408,564,036
|
| Holdings Count | Holding |
121
|
| InvestmentCompanyPortfolioTurnover |
27.00%
|
| Additional Fund Statistics [Text Block] |
Key Fund Statistics as of June 30, 2026- Total Net Assets$408,564,036
- # of Portfolio Holdings121
- Year-to-Date Total Return10.24%
- Portfolio Turnover Rate27%
Returns provided do not reflect fees and expenses of any variable annuity contract or variable life insurance policy; if these fees and expenses were included, the returns shown would be lower. |
| Holdings [Text Block] |
Fund's Composition (% of Total Net Assets)Table SummaryValue | Value |
|---|
Other Assets & Liabilities, Net | (0.3%) | Others (each less than 3.0%) | 2.3% | Utilities | 3.1% | Energy | 3.8% | Consumer, Cyclical | 6.9% | Technology | 10.3% | Communications | 11.4% | Industrial | 14.7% | Consumer, Non-Cyclical | 21.5% | Financial | 26.3% | |
| C000125303 |
|
| Shareholder Report [Line Items] |
|
| Fund Name |
Value Advantage Portfolio
|
| Class Name |
Class P
|
| No Trading Symbol [Flag] |
true
|
| Annual or Semi-Annual Statement [Text Block] |
This semi-annual shareholder report contains important information about the Value Advantage Portfolio (the "Fund") for the period of January 1, 2026 to June 30, 2026.
|
| Additional Information [Text Block] |
You can find additional information about the Fund at http://www.pacificlife.com/pacificselectfund.html. You can also request this information free of charge by contacting us toll-free at 800-722-4448 or sending an email request to PSFdocumentrequest@pacificlife.com.
|
| Additional Information Phone Number |
800-722-4448
|
| Additional Information Email |
<span style="box-sizing: border-box; color: rgb(0, 0, 0); display: inline; flex-wrap: nowrap; font-size: 12px; font-weight: 400; grid-area: auto; line-height: 14.4px; margin: 0px; overflow: visible; text-align: left; text-align-last: auto; white-space-collapse: preserve-breaks;">PSFdocumentrequest@pacificlife.com</span>
|
| Additional Information Website |
<span style="box-sizing: border-box; color: rgb(0, 0, 0); display: inline; flex-wrap: nowrap; font-size: 12px; font-weight: 400; grid-area: auto; line-height: 14.4px; margin: 0px; overflow: visible; text-align: left; text-align-last: auto; white-space-collapse: preserve-breaks;">http://www.pacificlife.com/pacificselectfund.html</span>
|
| Expenses [Text Block] |
What were the Fund costs for the last six months?(based on a hypothetical $10,000 investment; costs paid as a percentage of a $10,000 investment is annualized) Table SummaryClass Name | Cost of a $10,000 investment | Costs paid as a percentage of a $10,000 investment |
|---|
Class P | $36 | 0.69% |
|---|
|
| Expenses Paid, Amount |
$ 36
|
| Expense Ratio, Percent |
0.69%
|
| AssetsNet |
$ 408,564,036
|
| Holdings Count | Holding |
121
|
| InvestmentCompanyPortfolioTurnover |
27.00%
|
| Additional Fund Statistics [Text Block] |
Key Fund Statistics as of June 30, 2026- Total Net Assets$408,564,036
- # of Portfolio Holdings121
- Year-to-Date Total Return10.35%
- Portfolio Turnover Rate27%
Returns provided do not reflect fees and expenses of any variable annuity contract or variable life insurance policy; if these fees and expenses were included, the returns shown would be lower. |
| Holdings [Text Block] |
Fund's Composition (% of Total Net Assets)Table SummaryValue | Value |
|---|
Other Assets & Liabilities, Net | (0.3%) | Others (each less than 3.0%) | 2.3% | Utilities | 3.1% | Energy | 3.8% | Consumer, Cyclical | 6.9% | Technology | 10.3% | Communications | 11.4% | Industrial | 14.7% | Consumer, Non-Cyclical | 21.5% | Financial | 26.3% | |
| C000078078 |
|
| Shareholder Report [Line Items] |
|
| Fund Name |
Emerging Markets Portfolio
|
| Class Name |
Class I
|
| No Trading Symbol [Flag] |
true
|
| Annual or Semi-Annual Statement [Text Block] |
This semi-annual shareholder report contains important information about the Emerging Markets Portfolio (the "Fund") for the period of January 1, 2026 to June 30, 2026.
|
| Additional Information [Text Block] |
You can find additional information about the Fund at http://www.pacificlife.com/pacificselectfund.html. You can also request this information free of charge by contacting us toll-free at 800-722-4448 or sending an email request to PSFdocumentrequest@pacificlife.com.
|
| Additional Information Phone Number |
800-722-4448
|
| Additional Information Email |
<span style="box-sizing: border-box; color: rgb(0, 0, 0); display: inline; flex-wrap: nowrap; font-size: 12px; font-weight: 400; grid-area: auto; line-height: 18px; margin: 0px; overflow: visible; text-align: left; text-align-last: auto; white-space-collapse: preserve-breaks;">PSFdocumentrequest@pacificlife.com</span>
|
| Additional Information Website |
<span style="box-sizing: border-box; color: rgb(0, 0, 0); display: inline; flex-wrap: nowrap; font-size: 12px; font-weight: 400; grid-area: auto; line-height: 18px; margin: 0px; overflow: visible; text-align: left; text-align-last: auto; white-space-collapse: preserve-breaks;">http://www.pacificlife.com/pacificselectfund.html</span>
|
| Expenses [Text Block] |
What were the Fund costs for the last six months?(based on a hypothetical $10,000 investment; costs paid as a percentage of a $10,000 investment is annualized) Table SummaryClass Name | Cost of a $10,000 investment | Costs paid as a percentage of a $10,000 investment |
|---|
Class I | $59 | 1.05% |
|---|
|
| Expenses Paid, Amount |
$ 59
|
| Expense Ratio, Percent |
1.05%
|
| AssetsNet |
$ 1,010,492,034
|
| Holdings Count | Holding |
255
|
| InvestmentCompanyPortfolioTurnover |
76.00%
|
| Additional Fund Statistics [Text Block] |
Key Fund Statistics as of June 30, 2026- Total Net Assets$1,010,492,034
- # of Portfolio Holdings255
- Year-to-Date Total Return28.02%
- Portfolio Turnover Rate76%
Returns provided do not reflect fees and expenses of any variable annuity contract or variable life insurance policy; if these fees and expenses were included, the returns shown would be lower. |
| Holdings [Text Block] |
Fund's Composition (% of Total Net Assets)Table SummaryValue | Value |
|---|
Other Assets and Liabilities, Net | 1.7% | Derivatives | (0.0%) | Others (each less than 3.0%) | 5.8% | Consumer, Cyclical | 5.2% | Basic Materials | 5.3% | Energy | 6.4% | Communications | 7.9% | Industrial | 12.7% | Financial | 18.2% | Technology | 36.8% | Top 5 Countries of Risk (% of Total Net Assets)Table SummaryValue | Value |
|---|
Brazil | 3.9% | India | 9.4% | China | 17.9% | South Korea | 23.7% | Taiwan | 28.8% | |
| C000098950 |
|
| Shareholder Report [Line Items] |
|
| Fund Name |
Emerging Markets Portfolio
|
| Class Name |
Class P
|
| No Trading Symbol [Flag] |
true
|
| Annual or Semi-Annual Statement [Text Block] |
This semi-annual shareholder report contains important information about the Emerging Markets Portfolio (the "Fund") for the period of January 1, 2026 to June 30, 2026.
|
| Additional Information [Text Block] |
You can find additional information about the Fund at http://www.pacificlife.com/pacificselectfund.html. You can also request this information free of charge by contacting us toll-free at 800-722-4448 or sending an email request to PSFdocumentrequest@pacificlife.com.
|
| Additional Information Phone Number |
800-722-4448
|
| Additional Information Email |
<span style="box-sizing: border-box; color: rgb(0, 0, 0); display: inline; flex-wrap: nowrap; font-size: 12px; font-weight: 400; grid-area: auto; line-height: 18px; margin: 0px; overflow: visible; text-align: left; text-align-last: auto; white-space-collapse: preserve-breaks;">PSFdocumentrequest@pacificlife.com</span>
|
| Additional Information Website |
<span style="box-sizing: border-box; color: rgb(0, 0, 0); display: inline; flex-wrap: nowrap; font-size: 12px; font-weight: 400; grid-area: auto; line-height: 18px; margin: 0px; overflow: visible; text-align: left; text-align-last: auto; white-space-collapse: preserve-breaks;">http://www.pacificlife.com/pacificselectfund.html</span>
|
| Expenses [Text Block] |
What were the Fund costs for the last six months?(based on a hypothetical $10,000 investment; costs paid as a percentage of a $10,000 investment is annualized) Table SummaryClass Name | Cost of a $10,000 investment | Costs paid as a percentage of a $10,000 investment |
|---|
Class P | $48 | 0.85% |
|---|
|
| Expenses Paid, Amount |
$ 48
|
| Expense Ratio, Percent |
0.85%
|
| AssetsNet |
$ 1,010,492,034
|
| Holdings Count | Holding |
255
|
| InvestmentCompanyPortfolioTurnover |
76.00%
|
| Additional Fund Statistics [Text Block] |
Key Fund Statistics as of June 30, 2026- Total Net Assets$1,010,492,034
- # of Portfolio Holdings255
- Year-to-Date Total Return28.15%
- Portfolio Turnover Rate76%
Returns provided do not reflect fees and expenses of any variable annuity contract or variable life insurance policy; if these fees and expenses were included, the returns shown would be lower. |
| Holdings [Text Block] |
Fund's Composition (% of Total Net Assets)Table SummaryValue | Value |
|---|
Other Assets and Liabilities, Net | 1.7% | Derivatives | (0.0%) | Others (each less than 3.0%) | 5.8% | Consumer, Cyclical | 5.2% | Basic Materials | 5.3% | Energy | 6.4% | Communications | 7.9% | Industrial | 12.7% | Financial | 18.2% | Technology | 36.8% | Top 5 Countries of Risk (% of Total Net Assets)Table SummaryValue | Value |
|---|
Brazil | 3.9% | India | 9.4% | China | 17.9% | South Korea | 23.7% | Taiwan | 28.8% | |
| C000253929 |
|
| Shareholder Report [Line Items] |
|
| Fund Name |
International Equity Plus Bond Alpha Portfolio
|
| Class Name |
Class I
|
| No Trading Symbol [Flag] |
true
|
| Annual or Semi-Annual Statement [Text Block] |
This semi-annual shareholder report contains important information about the International Equity Plus Bond Alpha Portfolio (the "Fund") for the period of January 1, 2026 to June 30, 2026.
|
| Additional Information [Text Block] |
You can find additional information about the Fund at http://www.pacificlife.com/pacificselectfund.html. You can also request this information free of charge by contacting us toll-free at 800-722-4448 or sending an email request to PSFdocumentrequest@pacificlife.com.
|
| Additional Information Phone Number |
800-722-4448
|
| Additional Information Email |
<span style="box-sizing: border-box; color: rgb(0, 0, 0); display: inline; flex-wrap: nowrap; font-size: 12px; font-weight: 400; grid-area: auto; line-height: 14.4px; margin: 0px; overflow: visible; text-align: left; text-align-last: auto; white-space-collapse: preserve-breaks;">PSFdocumentrequest@pacificlife.com</span>
|
| Additional Information Website |
<span style="box-sizing: border-box; color: rgb(0, 0, 0); display: inline; flex-wrap: nowrap; font-size: 12px; font-weight: 400; grid-area: auto; line-height: 14.4px; margin: 0px; overflow: visible; text-align: left; text-align-last: auto; white-space-collapse: preserve-breaks;">http://www.pacificlife.com/pacificselectfund.html</span>
|
| Expenses [Text Block] |
What were the Fund costs for the last six months?(based on a hypothetical $10,000 investment; costs paid as a percentage of a $10,000 investment is annualized) Table SummaryClass Name | Cost of a $10,000 investment | Costs paid as a percentage of a $10,000 investment |
|---|
Class I | $34 | 0.65% |
|---|
|
| Expenses Paid, Amount |
$ 34
|
| Expense Ratio, Percent |
0.65%
|
| AssetsNet |
$ 547,958,453
|
| Holdings Count | Holding |
460
|
| InvestmentCompanyPortfolioTurnover |
17.00%
|
| Additional Fund Statistics [Text Block] |
Key Fund Statistics as of June 30, 2026- Total Net Assets$547,958,453
- # of Portfolio Holdings460
- Year-to-Date Total Return8.88%
- Portfolio Turnover Rate17%
Returns provided do not reflect fees and expenses of any variable annuity contract or variable life insurance policy; if these fees and expenses were included, the returns shown would be lower. |
| Holdings [Text Block] |
Fund's Composition (% of Total Net Assets)Table SummaryValue | Value |
|---|
Other Assets and Liabilities, Net | 1.7% | Derivatives | (0.9%) | Others (each less than 3.0%) | 2.0% | Mortgage-Backed Securities | 3.4% | U.S. Treasury Obligations | 9.8% | Short-Term Investments | 18.2% | Asset-Backed Securities | 19.3% | Corporate Bonds & Notes | 46.5% | |
| C000253930 |
|
| Shareholder Report [Line Items] |
|
| Fund Name |
International Equity Plus Bond Alpha Portfolio
|
| Class Name |
Class P
|
| No Trading Symbol [Flag] |
true
|
| Annual or Semi-Annual Statement [Text Block] |
This semi-annual shareholder report contains important information about the International Equity Plus Bond Alpha Portfolio (the "Fund") for the period of January 1, 2026 to June 30, 2026.
|
| Additional Information [Text Block] |
You can find additional information about the Fund at http://www.pacificlife.com/pacificselectfund.html. You can also request this information free of charge by contacting us toll-free at 800-722-4448 or sending an email request to PSFdocumentrequest@pacificlife.com.
|
| Additional Information Phone Number |
800-722-4448
|
| Additional Information Email |
<span style="box-sizing: border-box; color: rgb(0, 0, 0); display: inline; flex-wrap: nowrap; font-size: 12px; font-weight: 400; grid-area: auto; line-height: 14.4px; margin: 0px; overflow: visible; text-align: left; text-align-last: auto; white-space-collapse: preserve-breaks;">PSFdocumentrequest@pacificlife.com</span>
|
| Additional Information Website |
<span style="box-sizing: border-box; color: rgb(0, 0, 0); display: inline; flex-wrap: nowrap; font-size: 12px; font-weight: 400; grid-area: auto; line-height: 14.4px; margin: 0px; overflow: visible; text-align: left; text-align-last: auto; white-space-collapse: preserve-breaks;">http://www.pacificlife.com/pacificselectfund.html</span>
|
| Expenses [Text Block] |
What were the Fund costs for the last six months?(based on a hypothetical $10,000 investment; costs paid as a percentage of a $10,000 investment is annualized) Table SummaryClass Name | Cost of a $10,000 investment | Costs paid as a percentage of a $10,000 investment |
|---|
Class P | $23 | 0.45% |
|---|
|
| Expenses Paid, Amount |
$ 23
|
| Expense Ratio, Percent |
0.45%
|
| AssetsNet |
$ 547,958,453
|
| Holdings Count | Holding |
460
|
| InvestmentCompanyPortfolioTurnover |
17.00%
|
| Additional Fund Statistics [Text Block] |
Key Fund Statistics as of June 30, 2026- Total Net Assets$547,958,453
- # of Portfolio Holdings460
- Year-to-Date Total Return8.99%
- Portfolio Turnover Rate17%
Returns provided do not reflect fees and expenses of any variable annuity contract or variable life insurance policy; if these fees and expenses were included, the returns shown would be lower. |
| Holdings [Text Block] |
Fund's Composition (% of Total Net Assets)Table SummaryValue | Value |
|---|
Other Assets and Liabilities, Net | 1.7% | Derivatives | (0.9%) | Others (each less than 3.0%) | 2.0% | Mortgage-Backed Securities | 3.4% | U.S. Treasury Obligations | 9.8% | Short-Term Investments | 18.2% | Asset-Backed Securities | 19.3% | Corporate Bonds & Notes | 46.5% | |
| C000230801 |
|
| Shareholder Report [Line Items] |
|
| Fund Name |
International Growth Portfolio
|
| Class Name |
Class I
|
| No Trading Symbol [Flag] |
true
|
| Annual or Semi-Annual Statement [Text Block] |
This semi-annual shareholder report contains important information about the International Growth Portfolio (the "Fund") for the period of January 1, 2026 to June 30, 2026.
|
| Additional Information [Text Block] |
You can find additional information about the Fund at http://www.pacificlife.com/pacificselectfund.html. You can also request this information free of charge by contacting us toll-free at 800-722-4448 or sending an email request to PSFdocumentrequest@pacificlife.com.
|
| Additional Information Phone Number |
800-722-4448
|
| Additional Information Email |
<span style="box-sizing: border-box; color: rgb(0, 0, 0); display: inline; flex-wrap: nowrap; font-size: 12px; font-weight: 400; grid-area: auto; line-height: 18px; margin: 0px; overflow: visible; text-align: left; text-align-last: auto; white-space-collapse: preserve-breaks;">PSFdocumentrequest@pacificlife.com</span>
|
| Additional Information Website |
<span style="box-sizing: border-box; color: rgb(0, 0, 0); display: inline; flex-wrap: nowrap; font-size: 12px; font-weight: 400; grid-area: auto; line-height: 18px; margin: 0px; overflow: visible; text-align: left; text-align-last: auto; white-space-collapse: preserve-breaks;">http://www.pacificlife.com/pacificselectfund.html</span>
|
| Expenses [Text Block] |
What were the Fund costs for the last six months?(based on a hypothetical $10,000 investment; costs paid as a percentage of a $10,000 investment is annualized) Table SummaryClass Name | Cost of a $10,000 investment | Costs paid as a percentage of a $10,000 investment |
|---|
Class I | $50 | 0.98% |
|---|
|
| Expenses Paid, Amount |
$ 50
|
| Expense Ratio, Percent |
0.98%
|
| AssetsNet |
$ 725,873,137
|
| Holdings Count | Holding |
64
|
| InvestmentCompanyPortfolioTurnover |
50.00%
|
| Additional Fund Statistics [Text Block] |
Key Fund Statistics as of June 30, 2026- Total Net Assets$725,873,137
- # of Portfolio Holdings64
- Year-to-Date Total Return6.53%
- Portfolio Turnover Rate50%
Returns provided do not reflect fees and expenses of any variable annuity contract or variable life insurance policy; if these fees and expenses were included, the returns shown would be lower. |
| Holdings [Text Block] |
Fund's Composition (% of Total Net Assets)Table SummaryValue | Value |
|---|
Other Assets and Liabilities, Net | 0.9% | Others (each less than 3.0%) | 3.1% | Basic Materials | 3.4% | Communications | 4.4% | Consumer, Cyclical | 11.6% | Financial | 11.7% | Consumer, Non-Cyclical | 18.9% | Technology | 21.2% | Industrial | 24.8% | Top 5 Countries of Risk (% of Total Net Assets)Table SummaryValue | Value |
|---|
France | 6.7% | United States | 6.8% | Netherlands | 8.8% | United Kingdom | 9.8% | Japan | 25.3% | |
| C000230800 |
|
| Shareholder Report [Line Items] |
|
| Fund Name |
International Growth Portfolio
|
| Class Name |
Class P
|
| No Trading Symbol [Flag] |
true
|
| Annual or Semi-Annual Statement [Text Block] |
This semi-annual shareholder report contains important information about the International Growth Portfolio (the "Fund") for the period of January 1, 2026 to June 30, 2026.
|
| Additional Information [Text Block] |
You can find additional information about the Fund at http://www.pacificlife.com/pacificselectfund.html. You can also request this information free of charge by contacting us toll-free at 800-722-4448 or sending an email request to PSFdocumentrequest@pacificlife.com.
|
| Additional Information Phone Number |
800-722-4448
|
| Additional Information Email |
<span style="box-sizing: border-box; color: rgb(0, 0, 0); display: inline; flex-wrap: nowrap; font-size: 12px; font-weight: 400; grid-area: auto; line-height: 18px; margin: 0px; overflow: visible; text-align: left; text-align-last: auto; white-space-collapse: preserve-breaks;">PSFdocumentrequest@pacificlife.com</span>
|
| Additional Information Website |
<span style="box-sizing: border-box; color: rgb(0, 0, 0); display: inline; flex-wrap: nowrap; font-size: 12px; font-weight: 400; grid-area: auto; line-height: 18px; margin: 0px; overflow: visible; text-align: left; text-align-last: auto; white-space-collapse: preserve-breaks;">http://www.pacificlife.com/pacificselectfund.html</span>
|
| Expenses [Text Block] |
What were the Fund costs for the last six months?(based on a hypothetical $10,000 investment; costs paid as a percentage of a $10,000 investment is annualized) Table SummaryClass Name | Cost of a $10,000 investment | Costs paid as a percentage of a $10,000 investment |
|---|
Class P | $39 | 0.77% |
|---|
|
| Expenses Paid, Amount |
$ 39
|
| Expense Ratio, Percent |
0.77%
|
| AssetsNet |
$ 725,873,137
|
| Holdings Count | Holding |
64
|
| InvestmentCompanyPortfolioTurnover |
50.00%
|
| Additional Fund Statistics [Text Block] |
Key Fund Statistics as of June 30, 2026- Total Net Assets$725,873,137
- # of Portfolio Holdings64
- Year-to-Date Total Return6.64%
- Portfolio Turnover Rate50%
Returns provided do not reflect fees and expenses of any variable annuity contract or variable life insurance policy; if these fees and expenses were included, the returns shown would be lower. |
| Holdings [Text Block] |
Fund's Composition (% of Total Net Assets)Table SummaryValue | Value |
|---|
Other Assets and Liabilities, Net | 0.9% | Others (each less than 3.0%) | 3.1% | Basic Materials | 3.4% | Communications | 4.4% | Consumer, Cyclical | 11.6% | Financial | 11.7% | Consumer, Non-Cyclical | 18.9% | Technology | 21.2% | Industrial | 24.8% | Top 5 Countries of Risk (% of Total Net Assets)Table SummaryValue | Value |
|---|
France | 6.7% | United States | 6.8% | Netherlands | 8.8% | United Kingdom | 9.8% | Japan | 25.3% | |
| C000078073 |
|
| Shareholder Report [Line Items] |
|
| Fund Name |
International Large-Cap Portfolio
|
| Class Name |
Class I
|
| No Trading Symbol [Flag] |
true
|
| Annual or Semi-Annual Statement [Text Block] |
This semi-annual shareholder report contains important information about the International Large-Cap Portfolio (the "Fund") for the period of January 1, 2026 to June 30, 2026.
|
| Additional Information [Text Block] |
You can find additional information about the Fund at http://www.pacificlife.com/pacificselectfund.html. You can also request this information free of charge by contacting us toll-free at 800-722-4448 or sending an email request to PSFdocumentrequest@pacificlife.com.
|
| Additional Information Phone Number |
800-722-4448
|
| Additional Information Email |
<span style="box-sizing: border-box; color: rgb(0, 0, 0); display: inline; flex-wrap: nowrap; font-size: 12px; font-weight: 400; grid-area: auto; line-height: 18px; margin: 0px; overflow: visible; text-align: left; text-align-last: auto; white-space-collapse: preserve-breaks;">PSFdocumentrequest@pacificlife.com</span>
|
| Additional Information Website |
<span style="box-sizing: border-box; color: rgb(0, 0, 0); display: inline; flex-wrap: nowrap; font-size: 12px; font-weight: 400; grid-area: auto; line-height: 18px; margin: 0px; overflow: visible; text-align: left; text-align-last: auto; white-space-collapse: preserve-breaks;">http://www.pacificlife.com/pacificselectfund.html</span>
|
| Expenses [Text Block] |
What were the Fund costs for the last six months?(based on a hypothetical $10,000 investment; costs paid as a percentage of a $10,000 investment is annualized) Table SummaryClass Name | Cost of a $10,000 investment | Costs paid as a percentage of a $10,000 investment |
|---|
Class I | $50 | 1.00% |
|---|
|
| Expenses Paid, Amount |
$ 50
|
| Expense Ratio, Percent |
1.00%
|
| AssetsNet |
$ 943,254,645
|
| Holdings Count | Holding |
76
|
| InvestmentCompanyPortfolioTurnover |
13.00%
|
| Additional Fund Statistics [Text Block] |
Key Fund Statistics as of June 30, 2026- Total Net Assets$943,254,645
- # of Portfolio Holdings76
- Year-to-Date Total Return2.56%
- Portfolio Turnover Rate13%
Returns provided do not reflect fees and expenses of any variable annuity contract or variable life insurance policy; if these fees and expenses were included, the returns shown would be lower. |
| Holdings [Text Block] |
Fund's Composition (% of Total Net Assets)Table SummaryValue | Value |
|---|
Other Assets and Liabilities, Net | 1.5% | Others (each less than 3.0%) | 4.6% | Energy | 3.4% | Basic Materials | 4.9% | Technology | 9.0% | Consumer, Cyclical | 12.0% | Industrial | 15.5% | Consumer, Non-Cyclical | 23.1% | Financial | 26.0% | Top 5 Countries of Risk (% of Total Net Assets)Table SummaryValue | Value |
|---|
Switzerland | 6.9% | United States (Includes Short-Term Investments) | 10.2% | United Kingdom | 12.7% | France | 15.0% | Japan | 19.5% | |
| C000098946 |
|
| Shareholder Report [Line Items] |
|
| Fund Name |
International Large-Cap Portfolio
|
| Class Name |
Class P
|
| No Trading Symbol [Flag] |
true
|
| Annual or Semi-Annual Statement [Text Block] |
This semi-annual shareholder report contains important information about the International Large-Cap Portfolio (the "Fund") for the period of January 1, 2026 to June 30, 2026.
|
| Additional Information [Text Block] |
You can find additional information about the Fund at http://www.pacificlife.com/pacificselectfund.html. You can also request this information free of charge by contacting us toll-free at 800-722-4448 or sending an email request to PSFdocumentrequest@pacificlife.com.
|
| Additional Information Phone Number |
800-722-4448
|
| Additional Information Email |
<span style="box-sizing: border-box; color: rgb(0, 0, 0); display: inline; flex-wrap: nowrap; font-size: 12px; font-weight: 400; grid-area: auto; line-height: 18px; margin: 0px; overflow: visible; text-align: left; text-align-last: auto; white-space-collapse: preserve-breaks;">PSFdocumentrequest@pacificlife.com</span>
|
| Additional Information Website |
<span style="box-sizing: border-box; color: rgb(0, 0, 0); display: inline; flex-wrap: nowrap; font-size: 12px; font-weight: 400; grid-area: auto; line-height: 18px; margin: 0px; overflow: visible; text-align: left; text-align-last: auto; white-space-collapse: preserve-breaks;">http://www.pacificlife.com/pacificselectfund.html</span>
|
| Expenses [Text Block] |
What were the Fund costs for the last six months?(based on a hypothetical $10,000 investment; costs paid as a percentage of a $10,000 investment is annualized) Table SummaryClass Name | Cost of a $10,000 investment | Costs paid as a percentage of a $10,000 investment |
|---|
Class P | $40 | 0.80% |
|---|
|
| Expenses Paid, Amount |
$ 40
|
| Expense Ratio, Percent |
0.80%
|
| AssetsNet |
$ 943,254,645
|
| Holdings Count | Holding |
76
|
| InvestmentCompanyPortfolioTurnover |
13.00%
|
| Additional Fund Statistics [Text Block] |
Key Fund Statistics as of June 30, 2026- Total Net Assets$943,254,645
- # of Portfolio Holdings76
- Year-to-Date Total Return2.66%
- Portfolio Turnover Rate13%
Returns provided do not reflect fees and expenses of any variable annuity contract or variable life insurance policy; if these fees and expenses were included, the returns shown would be lower. |
| Holdings [Text Block] |
Fund's Composition (% of Total Net Assets)Table SummaryValue | Value |
|---|
Other Assets and Liabilities, Net | 1.5% | Others (each less than 3.0%) | 4.6% | Energy | 3.4% | Basic Materials | 4.9% | Technology | 9.0% | Consumer, Cyclical | 12.0% | Industrial | 15.5% | Consumer, Non-Cyclical | 23.1% | Financial | 26.0% | Top 5 Countries of Risk (% of Total Net Assets)Table SummaryValue | Value |
|---|
Switzerland | 6.9% | United States (Includes Short-Term Investments) | 10.2% | United Kingdom | 12.7% | France | 15.0% | Japan | 19.5% | |
| C000078094 |
|
| Shareholder Report [Line Items] |
|
| Fund Name |
International Small-Cap Portfolio
|
| Class Name |
Class I
|
| No Trading Symbol [Flag] |
true
|
| Annual or Semi-Annual Statement [Text Block] |
This semi-annual shareholder report contains important information about the International Small-Cap Portfolio (the "Fund") for the period of January 1, 2026 to June 30, 2026.
|
| Additional Information [Text Block] |
You can find additional information about the Fund at http://www.pacificlife.com/pacificselectfund.html. You can also request this information free of charge by contacting us toll-free at 800-722-4448 or sending an email request to PSFdocumentrequest@pacificlife.com.
|
| Additional Information Phone Number |
800-722-4448
|
| Additional Information Email |
<span style="box-sizing: border-box; color: rgb(0, 0, 0); display: inline; flex-wrap: nowrap; font-size: 12px; font-weight: 400; grid-area: auto; line-height: 18px; margin: 0px; overflow: visible; text-align: left; text-align-last: auto; white-space-collapse: preserve-breaks;">PSFdocumentrequest@pacificlife.com</span>
|
| Additional Information Website |
<span style="box-sizing: border-box; color: rgb(0, 0, 0); display: inline; flex-wrap: nowrap; font-size: 12px; font-weight: 400; grid-area: auto; line-height: 18px; margin: 0px; overflow: visible; text-align: left; text-align-last: auto; white-space-collapse: preserve-breaks;">http://www.pacificlife.com/pacificselectfund.html</span>
|
| Expenses [Text Block] |
What were the Fund costs for the last six months?(based on a hypothetical $10,000 investment; costs paid as a percentage of a $10,000 investment is annualized) Table SummaryClass Name | Cost of a $10,000 investment | Costs paid as a percentage of a $10,000 investment |
|---|
Class I | $59 | 1.13% |
|---|
|
| Expenses Paid, Amount |
$ 59
|
| Expense Ratio, Percent |
1.13%
|
| AssetsNet |
$ 267,331,237
|
| Holdings Count | Holding |
152
|
| InvestmentCompanyPortfolioTurnover |
24.00%
|
| Additional Fund Statistics [Text Block] |
Key Fund Statistics as of June 30, 2026- Total Net Assets$267,331,237
- # of Portfolio Holdings152
- Year-to-Date Total Return9.09%
- Portfolio Turnover Rate24%
Returns provided do not reflect fees and expenses of any variable annuity contract or variable life insurance policy; if these fees and expenses were included, the returns shown would be lower. |
| Holdings [Text Block] |
Fund's Composition (% of Total Net Assets)Table SummaryValue | Value |
|---|
Other Assets and Liabilities, Net | 2.7% | Others (each less than 3.0%) | 2.6% | Exchange-Traded Funds | 3.6% | Energy | 4.2% | Technology | 5.6% | Basic Materials | 5.7% | Consumer, Cyclical | 10.9% | Consumer, Non-Cyclical | 11.2% | Financial | 19.3% | Industrial | 34.2% | Top 5 Countries of Risk (% of Total Net Assets)Table SummaryValue | Value |
|---|
United States (Includes Securities Lending Collateral) | 4.6% | China | 5.5% | Taiwan | 7.3% | United Kingdom | 10.5% | Japan | 24.5% | |
| C000098965 |
|
| Shareholder Report [Line Items] |
|
| Fund Name |
International Small-Cap Portfolio
|
| Class Name |
Class P
|
| No Trading Symbol [Flag] |
true
|
| Annual or Semi-Annual Statement [Text Block] |
This semi-annual shareholder report contains important information about the International Small-Cap Portfolio (the "Fund") for the period of January 1, 2026 to June 30, 2026.
|
| Additional Information [Text Block] |
You can find additional information about the Fund at http://www.pacificlife.com/pacificselectfund.html. You can also request this information free of charge by contacting us toll-free at 800-722-4448 or sending an email request to PSFdocumentrequest@pacificlife.com.
|
| Additional Information Phone Number |
800-722-4448
|
| Additional Information Email |
<span style="box-sizing: border-box; color: rgb(0, 0, 0); display: inline; flex-wrap: nowrap; font-size: 12px; font-weight: 400; grid-area: auto; line-height: 18px; margin: 0px; overflow: visible; text-align: left; text-align-last: auto; white-space-collapse: preserve-breaks;">PSFdocumentrequest@pacificlife.com</span>
|
| Additional Information Website |
<span style="box-sizing: border-box; color: rgb(0, 0, 0); display: inline; flex-wrap: nowrap; font-size: 12px; font-weight: 400; grid-area: auto; line-height: 18px; margin: 0px; overflow: visible; text-align: left; text-align-last: auto; white-space-collapse: preserve-breaks;">http://www.pacificlife.com/pacificselectfund.html</span>
|
| Expenses [Text Block] |
What were the Fund costs for the last six months?(based on a hypothetical $10,000 investment; costs paid as a percentage of a $10,000 investment is annualized) Table SummaryClass Name | Cost of a $10,000 investment | Costs paid as a percentage of a $10,000 investment |
|---|
Class P | $48 | 0.93% |
|---|
|
| Expenses Paid, Amount |
$ 48
|
| Expense Ratio, Percent |
0.93%
|
| AssetsNet |
$ 267,331,237
|
| Holdings Count | Holding |
152
|
| InvestmentCompanyPortfolioTurnover |
24.00%
|
| Additional Fund Statistics [Text Block] |
Key Fund Statistics as of June 30, 2026- Total Net Assets$267,331,237
- # of Portfolio Holdings152
- Year-to-Date Total Return9.20%
- Portfolio Turnover Rate24%
Returns provided do not reflect fees and expenses of any variable annuity contract or variable life insurance policy; if these fees and expenses were included, the returns shown would be lower. |
| Holdings [Text Block] |
Fund's Composition (% of Total Net Assets)Table SummaryValue | Value |
|---|
Other Assets and Liabilities, Net | 2.7% | Others (each less than 3.0%) | 2.6% | Exchange-Traded Funds | 3.6% | Energy | 4.2% | Technology | 5.6% | Basic Materials | 5.7% | Consumer, Cyclical | 10.9% | Consumer, Non-Cyclical | 11.2% | Financial | 19.3% | Industrial | 34.2% | Top 5 Countries of Risk (% of Total Net Assets)Table SummaryValue | Value |
|---|
United States (Includes Securities Lending Collateral) | 4.6% | China | 5.5% | Taiwan | 7.3% | United Kingdom | 10.5% | Japan | 24.5% | |
| C000078114 |
|
| Shareholder Report [Line Items] |
|
| Fund Name |
International Value Portfolio
|
| Class Name |
Class I
|
| No Trading Symbol [Flag] |
true
|
| Annual or Semi-Annual Statement [Text Block] |
This semi-annual shareholder report contains important information about the International Value Portfolio (the "Fund") for the period of January 1, 2026 to June 30, 2026.
|
| Additional Information [Text Block] |
You can find additional information about the Fund at http://www.pacificlife.com/pacificselectfund.html. You can also request this information free of charge by contacting us toll-free at 800-722-4448 or sending an email request to PSFdocumentrequest@pacificlife.com.
|
| Additional Information Phone Number |
800-722-4448
|
| Additional Information Email |
<span style="box-sizing: border-box; color: rgb(0, 0, 0); display: inline; flex-wrap: nowrap; font-size: 12px; font-weight: 400; grid-area: auto; line-height: 18px; margin: 0px; overflow: visible; text-align: left; text-align-last: auto; white-space-collapse: preserve-breaks;">PSFdocumentrequest@pacificlife.com</span>
|
| Additional Information Website |
<span style="box-sizing: border-box; color: rgb(0, 0, 0); display: inline; flex-wrap: nowrap; font-size: 12px; font-weight: 400; grid-area: auto; line-height: 18px; margin: 0px; overflow: visible; text-align: left; text-align-last: auto; white-space-collapse: preserve-breaks;">http://www.pacificlife.com/pacificselectfund.html</span>
|
| Expenses [Text Block] |
What were the Fund costs for the last six months?(based on a hypothetical $10,000 investment; costs paid as a percentage of a $10,000 investment is annualized) Table SummaryClass Name | Cost of a $10,000 investment | Costs paid as a percentage of a $10,000 investment |
|---|
Class I | $48 | 0.91% |
|---|
|
| Expenses Paid, Amount |
$ 48
|
| Expense Ratio, Percent |
0.91%
|
| AssetsNet |
$ 1,168,804,339
|
| Holdings Count | Holding |
154
|
| InvestmentCompanyPortfolioTurnover |
26.00%
|
| Additional Fund Statistics [Text Block] |
Key Fund Statistics as of June 30, 2026- Total Net Assets$1,168,804,339
- # of Portfolio Holdings154
- Year-to-Date Total Return10.97%
- Portfolio Turnover Rate26%
Returns provided do not reflect fees and expenses of any variable annuity contract or variable life insurance policy; if these fees and expenses were included, the returns shown would be lower. |
| Holdings [Text Block] |
Fund's Composition (% of Total Net Assets)Table SummaryValue | Value |
|---|
Other Assets and Liabilities, Net | 0.7% | Others (each less than 3.0%) | 4.7% | Industrial | 5.2% | Basic Materials | 5.6% | Energy | 7.4% | Communications | 10.4% | Consumer, Cyclical | 12.8% | Consumer, Non-Cyclical | 18.9% | Financial | 34.3% | Top 5 Countries of Risk (% of Total Net Assets)Table SummaryValue | Value |
|---|
Netherlands | 6.5% | Germany | 7.3% | France | 12.4% | United Kingdom | 15.8% | Japan | 18.9% | |
| C000098973 |
|
| Shareholder Report [Line Items] |
|
| Fund Name |
International Value Portfolio
|
| Class Name |
Class P
|
| No Trading Symbol [Flag] |
true
|
| Annual or Semi-Annual Statement [Text Block] |
This semi-annual shareholder report contains important information about the International Value Portfolio (the "Fund") for the period of January 1, 2026 to June 30, 2026.
|
| Additional Information [Text Block] |
You can find additional information about the Fund at http://www.pacificlife.com/pacificselectfund.html. You can also request this information free of charge by contacting us toll-free at 800-722-4448 or sending an email request to PSFdocumentrequest@pacificlife.com.
|
| Additional Information Phone Number |
800-722-4448
|
| Additional Information Email |
<span style="box-sizing: border-box; color: rgb(0, 0, 0); display: inline; flex-wrap: nowrap; font-size: 12px; font-weight: 400; grid-area: auto; line-height: 18px; margin: 0px; overflow: visible; text-align: left; text-align-last: auto; white-space-collapse: preserve-breaks;">PSFdocumentrequest@pacificlife.com</span>
|
| Additional Information Website |
<span style="box-sizing: border-box; color: rgb(0, 0, 0); display: inline; flex-wrap: nowrap; font-size: 12px; font-weight: 400; grid-area: auto; line-height: 18px; margin: 0px; overflow: visible; text-align: left; text-align-last: auto; white-space-collapse: preserve-breaks;">http://www.pacificlife.com/pacificselectfund.html</span>
|
| Expenses [Text Block] |
What were the Fund costs for the last six months?(based on a hypothetical $10,000 investment; costs paid as a percentage of a $10,000 investment is annualized) Table SummaryClass Name | Cost of a $10,000 investment | Costs paid as a percentage of a $10,000 investment |
|---|
Class P | $37 | 0.71% |
|---|
|
| Expenses Paid, Amount |
$ 37
|
| Expense Ratio, Percent |
0.71%
|
| AssetsNet |
$ 1,168,804,339
|
| Holdings Count | Holding |
154
|
| InvestmentCompanyPortfolioTurnover |
26.00%
|
| Additional Fund Statistics [Text Block] |
Key Fund Statistics as of June 30, 2026- Total Net Assets$1,168,804,339
- # of Portfolio Holdings154
- Year-to-Date Total Return11.08%
- Portfolio Turnover Rate26%
Returns provided do not reflect fees and expenses of any variable annuity contract or variable life insurance policy; if these fees and expenses were included, the returns shown would be lower. |
| Holdings [Text Block] |
Fund's Composition (% of Total Net Assets)Table SummaryValue | Value |
|---|
Other Assets and Liabilities, Net | 0.7% | Others (each less than 3.0%) | 4.7% | Industrial | 5.2% | Basic Materials | 5.6% | Energy | 7.4% | Communications | 10.4% | Consumer, Cyclical | 12.8% | Consumer, Non-Cyclical | 18.9% | Financial | 34.3% | Top 5 Countries of Risk (% of Total Net Assets)Table SummaryValue | Value |
|---|
Netherlands | 6.5% | Germany | 7.3% | France | 12.4% | United Kingdom | 15.8% | Japan | 18.9% | |
| C000078112 |
|
| Shareholder Report [Line Items] |
|
| Fund Name |
Health Sciences Portfolio
|
| Class Name |
Class I
|
| No Trading Symbol [Flag] |
true
|
| Annual or Semi-Annual Statement [Text Block] |
This semi-annual shareholder report contains important information about the Health Sciences Portfolio (the "Fund") for the period of January 1, 2026 to June 30, 2026.
|
| Additional Information [Text Block] |
You can find additional information about the Fund at http://www.pacificlife.com/pacificselectfund.html. You can also request this information free of charge by contacting us toll-free at 800-722-4448 or sending an email request to PSFdocumentrequest@pacificlife.com.
|
| Additional Information Phone Number |
800-722-4448
|
| Additional Information Email |
<span style="box-sizing: border-box; color: rgb(0, 0, 0); display: inline; flex-wrap: nowrap; font-size: 12px; font-weight: 400; grid-area: auto; line-height: 14.4px; margin: 0px; overflow: visible; text-align: left; text-align-last: auto; white-space-collapse: preserve-breaks;">PSFdocumentrequest@pacificlife.com</span>
|
| Additional Information Website |
<span style="box-sizing: border-box; color: rgb(0, 0, 0); display: inline; flex-wrap: nowrap; font-size: 12px; font-weight: 400; grid-area: auto; line-height: 14.4px; margin: 0px; overflow: visible; text-align: left; text-align-last: auto; white-space-collapse: preserve-breaks;">http://www.pacificlife.com/pacificselectfund.html</span>
|
| Expenses [Text Block] |
What were the Fund costs for the last six months?(based on a hypothetical $10,000 investment; costs paid as a percentage of a $10,000 investment is annualized) Table SummaryClass Name | Cost of a $10,000 investment | Costs paid as a percentage of a $10,000 investment |
|---|
Class I | $58 | 1.15% |
|---|
|
| Expenses Paid, Amount |
$ 58
|
| Expense Ratio, Percent |
1.15%
|
| AssetsNet |
$ 381,258,077
|
| Holdings Count | Holding |
136
|
| InvestmentCompanyPortfolioTurnover |
22.00%
|
| Additional Fund Statistics [Text Block] |
Key Fund Statistics as of June 30, 2026- Total Net Assets$381,258,077
- # of Portfolio Holdings136
- Year-to-Date Total Return4.33%
- Portfolio Turnover Rate22%
Returns provided do not reflect fees and expenses of any variable annuity contract or variable life insurance policy; if these fees and expenses were included, the returns shown would be lower. |
| Holdings [Text Block] |
Fund's Composition (% of Total Net Assets)Table SummaryValue | Value |
|---|
Other Assets and Liabilities, Net | (2.5%) | Others (each less than 3.0%) | 6.5% | Medical Products | 4.5% | Medical Instruments | 5.2% | Securities Lending Collateral | 6.1% | Diagnostic Equipment | 6.7% | Medical-HMO | 8.7% | Medical-Biomedical/Gene | 27.7% | Medical-Drugs | 37.1% | |
| C000098971 |
|
| Shareholder Report [Line Items] |
|
| Fund Name |
Health Sciences Portfolio
|
| Class Name |
Class P
|
| No Trading Symbol [Flag] |
true
|
| Annual or Semi-Annual Statement [Text Block] |
This semi-annual shareholder report contains important information about the Health Sciences Portfolio (the "Fund") for the period of January 1, 2026 to June 30, 2026.
|
| Additional Information [Text Block] |
You can find additional information about the Fund at http://www.pacificlife.com/pacificselectfund.html. You can also request this information free of charge by contacting us toll-free at 800-722-4448 or sending an email request to PSFdocumentrequest@pacificlife.com.
|
| Additional Information Phone Number |
800-722-4448
|
| Additional Information Email |
<span style="box-sizing: border-box; color: rgb(0, 0, 0); display: inline; flex-wrap: nowrap; font-size: 12px; font-weight: 400; grid-area: auto; line-height: 14.4px; margin: 0px; overflow: visible; text-align: left; text-align-last: auto; white-space-collapse: preserve-breaks;">PSFdocumentrequest@pacificlife.com</span>
|
| Additional Information Website |
<span style="box-sizing: border-box; color: rgb(0, 0, 0); display: inline; flex-wrap: nowrap; font-size: 12px; font-weight: 400; grid-area: auto; line-height: 14.4px; margin: 0px; overflow: visible; text-align: left; text-align-last: auto; white-space-collapse: preserve-breaks;">http://www.pacificlife.com/pacificselectfund.html</span>
|
| Expenses [Text Block] |
What were the Fund costs for the last six months?(based on a hypothetical $10,000 investment; costs paid as a percentage of a $10,000 investment is annualized) Table SummaryClass Name | Cost of a $10,000 investment | Costs paid as a percentage of a $10,000 investment |
|---|
Class P | $48 | 0.95% |
|---|
|
| Expenses Paid, Amount |
$ 48
|
| Expense Ratio, Percent |
0.95%
|
| AssetsNet |
$ 381,258,077
|
| Holdings Count | Holding |
136
|
| InvestmentCompanyPortfolioTurnover |
22.00%
|
| Additional Fund Statistics [Text Block] |
Key Fund Statistics as of June 30, 2026- Total Net Assets$381,258,077
- # of Portfolio Holdings136
- Year-to-Date Total Return4.43%
- Portfolio Turnover Rate22%
Returns provided do not reflect fees and expenses of any variable annuity contract or variable life insurance policy; if these fees and expenses were included, the returns shown would be lower. |
| Holdings [Text Block] |
Fund's Composition (% of Total Net Assets)Table SummaryValue | Value |
|---|
Other Assets and Liabilities, Net | (2.5%) | Others (each less than 3.0%) | 6.5% | Medical Products | 4.5% | Medical Instruments | 5.2% | Securities Lending Collateral | 6.1% | Diagnostic Equipment | 6.7% | Medical-HMO | 8.7% | Medical-Biomedical/Gene | 27.7% | Medical-Drugs | 37.1% | |
| C000078085 |
|
| Shareholder Report [Line Items] |
|
| Fund Name |
Real Estate Portfolio
|
| Class Name |
Class I
|
| No Trading Symbol [Flag] |
true
|
| Annual or Semi-Annual Statement [Text Block] |
This semi-annual shareholder report contains important information about the Real Estate Portfolio (the "Fund") for the period of January 1, 2026 to June 30, 2026.
|
| Additional Information [Text Block] |
You can find additional information about the Fund at http://www.pacificlife.com/pacificselectfund.html. You can also request this information free of charge by contacting us toll-free at 800-722-4448 or sending an email request to PSFdocumentrequest@pacificlife.com.
|
| Additional Information Phone Number |
800-722-4448
|
| Additional Information Email |
<span style="box-sizing: border-box; color: rgb(0, 0, 0); display: inline; flex-wrap: nowrap; font-size: 12px; font-weight: 400; grid-area: auto; line-height: 14.4px; margin: 0px; overflow: visible; text-align: left; text-align-last: auto; white-space-collapse: preserve-breaks;">PSFdocumentrequest@pacificlife.com</span>
|
| Additional Information Website |
<span style="box-sizing: border-box; color: rgb(0, 0, 0); display: inline; flex-wrap: nowrap; font-size: 12px; font-weight: 400; grid-area: auto; line-height: 14.4px; margin: 0px; overflow: visible; text-align: left; text-align-last: auto; white-space-collapse: preserve-breaks;">http://www.pacificlife.com/pacificselectfund.html</span>
|
| Expenses [Text Block] |
What were the Fund costs for the last six months?(based on a hypothetical $10,000 investment; costs paid as a percentage of a $10,000 investment is annualized) Table SummaryClass Name | Cost of a $10,000 investment | Costs paid as a percentage of a $10,000 investment |
|---|
Class I | $54 | 1.00% |
|---|
|
| Expenses Paid, Amount |
$ 54
|
| Expense Ratio, Percent |
1.00%
|
| AssetsNet |
$ 345,322,794
|
| Holdings Count | Holding |
44
|
| InvestmentCompanyPortfolioTurnover |
13.00%
|
| Additional Fund Statistics [Text Block] |
Key Fund Statistics as of June 30, 2026- Total Net Assets$345,322,794
- # of Portfolio Holdings44
- Year-to-Date Total Return16.68%
- Portfolio Turnover Rate13%
Returns provided do not reflect fees and expenses of any variable annuity contract or variable life insurance policy; if these fees and expenses were included, the returns shown would be lower. |
| Holdings [Text Block] |
Fund's Composition (% of Total Net Assets)Table SummaryValue | Value |
|---|
Other Assets and Liabilities, Net | (4.0%) | Others (each less than 3.0%) | 5.9% | REITS-Regional Malls | 3.5% | REITS-Office Property | 4.1% | Securities Lending Collateral | 4.4% | REITS-Shopping Centers | 6.8% | REITS-Storage | 9.1% | REITS-Apartments | 11.0% | REITS-Warehouse/Industrial | 11.7% | REITS-Diversified | 20.8% | REITS-Health Care | 26.7% | |
| C000098957 |
|
| Shareholder Report [Line Items] |
|
| Fund Name |
Real Estate Portfolio
|
| Class Name |
Class P
|
| No Trading Symbol [Flag] |
true
|
| Annual or Semi-Annual Statement [Text Block] |
This semi-annual shareholder report contains important information about the Real Estate Portfolio (the "Fund") for the period of January 1, 2026 to June 30, 2026.
|
| Additional Information [Text Block] |
You can find additional information about the Fund at http://www.pacificlife.com/pacificselectfund.html. You can also request this information free of charge by contacting us toll-free at 800-722-4448 or sending an email request to PSFdocumentrequest@pacificlife.com.
|
| Additional Information Phone Number |
800-722-4448
|
| Additional Information Email |
<span style="box-sizing: border-box; color: rgb(0, 0, 0); display: inline; flex-wrap: nowrap; font-size: 12px; font-weight: 400; grid-area: auto; line-height: 14.4px; margin: 0px; overflow: visible; text-align: left; text-align-last: auto; white-space-collapse: preserve-breaks;">PSFdocumentrequest@pacificlife.com</span>
|
| Additional Information Website |
<span style="box-sizing: border-box; color: rgb(0, 0, 0); display: inline; flex-wrap: nowrap; font-size: 12px; font-weight: 400; grid-area: auto; line-height: 14.4px; margin: 0px; overflow: visible; text-align: left; text-align-last: auto; white-space-collapse: preserve-breaks;">http://www.pacificlife.com/pacificselectfund.html</span>
|
| Expenses [Text Block] |
What were the Fund costs for the last six months?(based on a hypothetical $10,000 investment; costs paid as a percentage of a $10,000 investment is annualized) Table SummaryClass Name | Cost of a $10,000 investment | Costs paid as a percentage of a $10,000 investment |
|---|
Class P | $43 | 0.80% |
|---|
|
| Expenses Paid, Amount |
$ 43
|
| Expense Ratio, Percent |
0.80%
|
| AssetsNet |
$ 345,322,794
|
| Holdings Count | Holding |
44
|
| InvestmentCompanyPortfolioTurnover |
13.00%
|
| Additional Fund Statistics [Text Block] |
Key Fund Statistics as of June 30, 2026- Total Net Assets$345,322,794
- # of Portfolio Holdings44
- Year-to-Date Total Return16.79%
- Portfolio Turnover Rate13%
Returns provided do not reflect fees and expenses of any variable annuity contract or variable life insurance policy; if these fees and expenses were included, the returns shown would be lower. |
| Holdings [Text Block] |
Fund's Composition (% of Total Net Assets)Table SummaryValue | Value |
|---|
Other Assets and Liabilities, Net | (4.0%) | Others (each less than 3.0%) | 5.9% | REITS-Regional Malls | 3.5% | REITS-Office Property | 4.1% | Securities Lending Collateral | 4.4% | REITS-Shopping Centers | 6.8% | REITS-Storage | 9.1% | REITS-Apartments | 11.0% | REITS-Warehouse/Industrial | 11.7% | REITS-Diversified | 20.8% | REITS-Health Care | 26.7% | |
| C000078092 |
|
| Shareholder Report [Line Items] |
|
| Fund Name |
Technology Portfolio
|
| Class Name |
Class I
|
| No Trading Symbol [Flag] |
true
|
| Annual or Semi-Annual Statement [Text Block] |
This semi-annual shareholder report contains important information about the Technology Portfolio (the "Fund") for the period of January 1, 2026 to June 30, 2026.
|
| Additional Information [Text Block] |
You can find additional information about the Fund at http://www.pacificlife.com/pacificselectfund.html. You can also request this information free of charge by contacting us toll-free at 800-722-4448 or sending an email request to PSFdocumentrequest@pacificlife.com.
|
| Additional Information Phone Number |
800-722-4448
|
| Additional Information Email |
<span style="box-sizing: border-box; color: rgb(0, 0, 0); display: inline; flex-wrap: nowrap; font-size: 12px; font-weight: 400; grid-area: auto; line-height: 14.4px; margin: 0px; overflow: visible; text-align: left; text-align-last: auto; white-space-collapse: preserve-breaks;">PSFdocumentrequest@pacificlife.com</span>
|
| Additional Information Website |
<span style="box-sizing: border-box; color: rgb(0, 0, 0); display: inline; flex-wrap: nowrap; font-size: 12px; font-weight: 400; grid-area: auto; line-height: 14.4px; margin: 0px; overflow: visible; text-align: left; text-align-last: auto; white-space-collapse: preserve-breaks;">http://www.pacificlife.com/pacificselectfund.html</span>
|
| Expenses [Text Block] |
What were the Fund costs for the last six months?(based on a hypothetical $10,000 investment; costs paid as a percentage of a $10,000 investment is annualized) Table SummaryClass Name | Cost of a $10,000 investment | Costs paid as a percentage of a $10,000 investment |
|---|
Class I | $60 | 1.03% |
|---|
|
| Expenses Paid, Amount |
$ 60
|
| Expense Ratio, Percent |
1.03%
|
| AssetsNet |
$ 652,221,275
|
| Holdings Count | Holding |
42
|
| InvestmentCompanyPortfolioTurnover |
31.00%
|
| Additional Fund Statistics [Text Block] |
Key Fund Statistics as of June 30, 2026- Total Net Assets$652,221,275
- # of Portfolio Holdings42
- Year-to-Date Total Return35.58%
- Portfolio Turnover Rate31%
Returns provided do not reflect fees and expenses of any variable annuity contract or variable life insurance policy; if these fees and expenses were included, the returns shown would be lower. |
| Holdings [Text Block] |
Fund's Composition (% of Total Net Assets)Table SummaryValue | Value |
|---|
Other Assets and Liabilities, Net | 1.5% | Others (each less than 3.0%) | 8.2% | Applications Software | 3.9% | Semiconductor Materials & Equipment | 4.0% | Computers-Memory Devices | 4.5% | Computer Data Security | 4.7% | Semiconductor Component - Integrated Circuit | 4.8% | Networking Products | 4.8% | Computer Software | 5.4% | Computers | 10.0% | Electronic Components-Semiconductor | 48.2% | |
| C000098963 |
|
| Shareholder Report [Line Items] |
|
| Fund Name |
Technology Portfolio
|
| Class Name |
Class P
|
| No Trading Symbol [Flag] |
true
|
| Annual or Semi-Annual Statement [Text Block] |
This semi-annual shareholder report contains important information about the Technology Portfolio (the "Fund") for the period of January 1, 2026 to June 30, 2026.
|
| Additional Information [Text Block] |
You can find additional information about the Fund at http://www.pacificlife.com/pacificselectfund.html. You can also request this information free of charge by contacting us toll-free at 800-722-4448 or sending an email request to PSFdocumentrequest@pacificlife.com.
|
| Additional Information Phone Number |
800-722-4448
|
| Additional Information Email |
<span style="box-sizing: border-box; color: rgb(0, 0, 0); display: inline; flex-wrap: nowrap; font-size: 12px; font-weight: 400; grid-area: auto; line-height: 14.4px; margin: 0px; overflow: visible; text-align: left; text-align-last: auto; white-space-collapse: preserve-breaks;">PSFdocumentrequest@pacificlife.com</span>
|
| Additional Information Website |
<span style="box-sizing: border-box; color: rgb(0, 0, 0); display: inline; flex-wrap: nowrap; font-size: 12px; font-weight: 400; grid-area: auto; line-height: 14.4px; margin: 0px; overflow: visible; text-align: left; text-align-last: auto; white-space-collapse: preserve-breaks;">http://www.pacificlife.com/pacificselectfund.html</span>
|
| Expenses [Text Block] |
What were the Fund costs for the last six months?(based on a hypothetical $10,000 investment; costs paid as a percentage of a $10,000 investment is annualized) Table SummaryClass Name | Cost of a $10,000 investment | Costs paid as a percentage of a $10,000 investment |
|---|
Class P | $49 | 0.83% |
|---|
|
| Expenses Paid, Amount |
$ 49
|
| Expense Ratio, Percent |
0.83%
|
| AssetsNet |
$ 652,221,275
|
| Holdings Count | Holding |
42
|
| InvestmentCompanyPortfolioTurnover |
31.00%
|
| Additional Fund Statistics [Text Block] |
Key Fund Statistics as of June 30, 2026- Total Net Assets$652,221,275
- # of Portfolio Holdings42
- Year-to-Date Total Return35.72%
- Portfolio Turnover Rate31%
Returns provided do not reflect fees and expenses of any variable annuity contract or variable life insurance policy; if these fees and expenses were included, the returns shown would be lower. |
| Holdings [Text Block] |
Fund's Composition (% of Total Net Assets)Table SummaryValue | Value |
|---|
Other Assets and Liabilities, Net | 1.5% | Others (each less than 3.0%) | 8.2% | Applications Software | 3.9% | Semiconductor Materials & Equipment | 4.0% | Computers-Memory Devices | 4.5% | Computer Data Security | 4.7% | Semiconductor Component - Integrated Circuit | 4.8% | Networking Products | 4.8% | Computer Software | 5.4% | Computers | 10.0% | Electronic Components-Semiconductor | 48.2% | |
| C000264374 |
|
| Shareholder Report [Line Items] |
|
| Fund Name |
Capital Appreciation Portfolio
|
| Class Name |
Class I
|
| No Trading Symbol [Flag] |
true
|
| Annual or Semi-Annual Statement [Text Block] |
This semi-annual shareholder report contains important information about the Capital Appreciation Portfolio (the "Fund") for the period of January 1, 2026 (Fund Inception) to June 30, 2026.
|
| Additional Information [Text Block] |
You can find additional information about the Fund at http://www.pacificlife.com/pacificselectfund.html. You can also request this information free of charge by contacting us toll-free at 800-722-4448 or sending an email request to PSFdocumentrequest@pacificlife.com.
|
| Additional Information Phone Number |
800-722-4448
|
| Additional Information Email |
<span style="box-sizing: border-box; color: rgb(0, 0, 0); display: inline; flex-wrap: nowrap; font-size: 12px; font-weight: 400; grid-area: auto; line-height: 14.4px; margin: 0px; overflow: visible; text-align: left; text-align-last: auto; white-space-collapse: preserve-breaks;">PSFdocumentrequest@pacificlife.com</span>
|
| Additional Information Website |
<span style="box-sizing: border-box; color: rgb(0, 0, 0); display: inline; flex-wrap: nowrap; font-size: 12px; font-weight: 400; grid-area: auto; line-height: 14.4px; margin: 0px; overflow: visible; text-align: left; text-align-last: auto; white-space-collapse: preserve-breaks;">http://www.pacificlife.com/pacificselectfund.html</span>
|
| Expenses [Text Block] |
What were the Fund costs for the last six months?(based on a hypothetical $10,000 investment; costs paid as a percentage of a $10,000 investment is annualized) Table SummaryClass Name | Cost of a $10,000 investment | Costs paid as a percentage of a $10,000 investment |
|---|
Class I | $50 | 0.99% |
|---|
|
| Expenses Paid, Amount |
$ 50
|
| Expense Ratio, Percent |
0.99%
|
| AssetsNet |
$ 151,595,959
|
| Holdings Count | Holding |
281
|
| InvestmentCompanyPortfolioTurnover |
77.00%
|
| Additional Fund Statistics [Text Block] |
Key Fund Statistics as of June 30, 2026- Total Net Assets$151,595,959
- # of Portfolio Holdings281
- Year-to-Date Total Return4.91%
- Portfolio Turnover Rate77%
Returns provided do not reflect fees and expenses of any variable annuity contract or variable life insurance policy; if these fees and expenses were included, the returns shown would be lower. |
| Holdings [Text Block] |
Fund's Composition (% of Total Net Assets)Table SummaryValue | Value |
|---|
Other Assets and Liabilities, Net | 5.6% | Derivatives | (0.5%) | Others (each less than 3.0%) | 0.6% | Senior Loan Notes | 8.5% | Corporate Bonds & Notes | 8.6% | U.S. Treasury Obligations | 15.1% | Common Stocks | 62.1% | |
| C000264375 |
|
| Shareholder Report [Line Items] |
|
| Fund Name |
Capital Appreciation Portfolio
|
| Class Name |
Class P
|
| No Trading Symbol [Flag] |
true
|
| Annual or Semi-Annual Statement [Text Block] |
This semi-annual shareholder report contains important information about the Capital Appreciation Portfolio (the "Fund") for the period of January 1, 2026 (Fund Inception) to June 30, 2026.
|
| Additional Information [Text Block] |
You can find additional information about the Fund at http://www.pacificlife.com/pacificselectfund.html. You can also request this information free of charge by contacting us toll-free at 800-722-4448 or sending an email request to PSFdocumentrequest@pacificlife.com.
|
| Additional Information Phone Number |
800-722-4448
|
| Additional Information Email |
<span style="box-sizing: border-box; color: rgb(0, 0, 0); display: inline; flex-wrap: nowrap; font-size: 12px; font-weight: 400; grid-area: auto; line-height: 14.4px; margin: 0px; overflow: visible; text-align: left; text-align-last: auto; white-space-collapse: preserve-breaks;">PSFdocumentrequest@pacificlife.com</span>
|
| Additional Information Website |
<span style="box-sizing: border-box; color: rgb(0, 0, 0); display: inline; flex-wrap: nowrap; font-size: 12px; font-weight: 400; grid-area: auto; line-height: 14.4px; margin: 0px; overflow: visible; text-align: left; text-align-last: auto; white-space-collapse: preserve-breaks;">http://www.pacificlife.com/pacificselectfund.html</span>
|
| Expenses [Text Block] |
What were the Fund costs for the last six months?(based on a hypothetical $10,000 investment; costs paid as a percentage of a $10,000 investment is annualized) Table SummaryClass Name | Cost of a $10,000 investment | Costs paid as a percentage of a $10,000 investment |
|---|
Class P | $40 | 0.79% |
|---|
|
| Expenses Paid, Amount |
$ 40
|
| Expense Ratio, Percent |
0.79%
|
| AssetsNet |
$ 151,595,959
|
| Holdings Count | Holding |
281
|
| InvestmentCompanyPortfolioTurnover |
77.00%
|
| Additional Fund Statistics [Text Block] |
Key Fund Statistics as of June 30, 2026- Total Net Assets$151,595,959
- # of Portfolio Holdings281
- Year-to-Date Total Return5.01%
- Portfolio Turnover Rate77%
Returns provided do not reflect fees and expenses of any variable annuity contract or variable life insurance policy; if these fees and expenses were included, the returns shown would be lower. |
| Holdings [Text Block] |
Fund's Composition (% of Total Net Assets)Table SummaryValue | Value |
|---|
Other Assets and Liabilities, Net | 5.6% | Derivatives | (0.5%) | Others (each less than 3.0%) | 0.6% | Senior Loan Notes | 8.5% | Corporate Bonds & Notes | 8.6% | U.S. Treasury Obligations | 15.1% | Common Stocks | 62.1% | |
| C000167976 |
|
| Shareholder Report [Line Items] |
|
| Fund Name |
PSF Avantis Balanced Allocation Portfolio
|
| Class Name |
Class I
|
| No Trading Symbol [Flag] |
true
|
| Annual or Semi-Annual Statement [Text Block] |
This semi-annual shareholder report contains important information about the PSF Avantis Balanced Allocation Portfolio (the "Fund") for the period of January 1, 2026 to June 30, 2026.
|
| Additional Information [Text Block] |
You can find additional information about the Fund at http://www.pacificlife.com/pacificselectfund.html. You can also request this information free of charge by contacting us toll-free at 800-722-4448 or sending an email request to PSFdocumentrequest@pacificlife.com.
|
| Additional Information Phone Number |
800-722-4448
|
| Additional Information Email |
<span style="box-sizing: border-box; color: rgb(0, 0, 0); display: inline; flex-wrap: nowrap; font-size: 12px; font-weight: 400; grid-area: auto; line-height: 14.4px; margin: 0px; overflow: visible; text-align: left; text-align-last: auto; white-space-collapse: preserve-breaks;">PSFdocumentrequest@pacificlife.com</span>
|
| Additional Information Website |
<span style="box-sizing: border-box; color: rgb(0, 0, 0); display: inline; flex-wrap: nowrap; font-size: 12px; font-weight: 400; grid-area: auto; line-height: 14.4px; margin: 0px; overflow: visible; text-align: left; text-align-last: auto; white-space-collapse: preserve-breaks;">http://www.pacificlife.com/pacificselectfund.html</span>
|
| Expenses [Text Block] |
What were the Fund costs for the last six months?(based on a hypothetical $10,000 investment; costs paid as a percentage of a $10,000 investment is annualized) Table SummaryClass Name | Cost of a $10,000 investment | Costs paid as a percentage of a $10,000 investment |
|---|
Class I | $23 | 0.44% |
|---|
|
| Expenses Paid, Amount |
$ 23
|
| Expense Ratio, Percent |
0.44%
|
| AssetsNet |
$ 313,346,780
|
| Holdings Count | Holding |
15
|
| InvestmentCompanyPortfolioTurnover |
25.00%
|
| Additional Fund Statistics [Text Block] |
Key Fund Statistics as of June 30, 2026- Total Net Assets$313,346,780
- # of Portfolio Holdings15
- Year-to-Date Total Return9.23%
- Portfolio Turnover Rate25%
Returns provided do not reflect fees and expenses of any variable annuity contract or variable life insurance policy; if these fees and expenses were included, the returns shown would be lower. |
| Holdings [Text Block] |
Fund's Composition (% of Total Net Assets)Table SummaryValue | Value |
|---|
Other Assets & Liabilities, Net | (0.1%) | Securities Lending Collateral | 0.1% | Equity Mutual Funds | 4.9% | Fixed Income Exchange-Traded Funds | 14.9% | Fixed Income Mutual Funds | 20.2% | Equity Exchange-Traded Funds | 60.0% | |
| C000211249 |
|
| Shareholder Report [Line Items] |
|
| Fund Name |
PSF Avantis Balanced Allocation Portfolio
|
| Class Name |
Class P
|
| No Trading Symbol [Flag] |
true
|
| Annual or Semi-Annual Statement [Text Block] |
This semi-annual shareholder report contains important information about the PSF Avantis Balanced Allocation Portfolio (the "Fund") for the period of January 1, 2026 to June 30, 2026.
|
| Additional Information [Text Block] |
You can find additional information about the Fund at http://www.pacificlife.com/pacificselectfund.html. You can also request this information free of charge by contacting us toll-free at 800-722-4448 or sending an email request to PSFdocumentrequest@pacificlife.com.
|
| Additional Information Phone Number |
800-722-4448
|
| Additional Information Email |
<span style="box-sizing: border-box; color: rgb(0, 0, 0); display: inline; flex-wrap: nowrap; font-size: 12px; font-weight: 400; grid-area: auto; line-height: 14.4px; margin: 0px; overflow: visible; text-align: left; text-align-last: auto; white-space-collapse: preserve-breaks;">PSFdocumentrequest@pacificlife.com</span>
|
| Additional Information Website |
<span style="box-sizing: border-box; color: rgb(0, 0, 0); display: inline; flex-wrap: nowrap; font-size: 12px; font-weight: 400; grid-area: auto; line-height: 14.4px; margin: 0px; overflow: visible; text-align: left; text-align-last: auto; white-space-collapse: preserve-breaks;">http://www.pacificlife.com/pacificselectfund.html</span>
|
| Expenses [Text Block] |
What were the Fund costs for the last six months?(based on a hypothetical $10,000 investment; costs paid as a percentage of a $10,000 investment is annualized) Table SummaryClass Name | Cost of a $10,000 investment | Costs paid as a percentage of a $10,000 investment |
|---|
Class P | $12 | 0.24% |
|---|
|
| Expenses Paid, Amount |
$ 12
|
| Expense Ratio, Percent |
0.24%
|
| AssetsNet |
$ 313,346,780
|
| Holdings Count | Holding |
15
|
| InvestmentCompanyPortfolioTurnover |
25.00%
|
| Additional Fund Statistics [Text Block] |
Key Fund Statistics as of June 30, 2026- Total Net Assets$313,346,780
- # of Portfolio Holdings15
- Year-to-Date Total Return9.33%
- Portfolio Turnover Rate25%
Returns provided do not reflect fees and expenses of any variable annuity contract or variable life insurance policy; if these fees and expenses were included, the returns shown would be lower. |
| Holdings [Text Block] |
Fund's Composition (% of Total Net Assets)Table SummaryValue | Value |
|---|
Other Assets & Liabilities, Net | (0.1%) | Securities Lending Collateral | 0.1% | Equity Mutual Funds | 4.9% | Fixed Income Exchange-Traded Funds | 14.9% | Fixed Income Mutual Funds | 20.2% | Equity Exchange-Traded Funds | 60.0% | |
| C000078100 |
|
| Shareholder Report [Line Items] |
|
| Fund Name |
Pacific Dynamix - Conservative Growth Portfolio
|
| Class Name |
Class I
|
| No Trading Symbol [Flag] |
true
|
| Annual or Semi-Annual Statement [Text Block] |
This semi-annual shareholder report contains important information about the Pacific Dynamix - Conservative Growth Portfolio (the "Fund") for the period of January 1, 2026 to June 30, 2026.
|
| Additional Information [Text Block] |
You can find additional information about the Fund at http://www.pacificlife.com/pacificselectfund.html. You can also request this information free of charge by contacting us toll-free at 800-722-4448 or sending an email request to PSFdocumentrequest@pacificlife.com.
|
| Additional Information Phone Number |
800-722-4448
|
| Additional Information Email |
<span style="box-sizing: border-box; color: rgb(0, 0, 0); display: inline; flex-wrap: nowrap; font-size: 12px; font-weight: 400; grid-area: auto; line-height: 14.4px; margin: 0px; overflow: visible; text-align: left; text-align-last: auto; white-space-collapse: preserve-breaks;">PSFdocumentrequest@pacificlife.com</span>
|
| Additional Information Website |
<span style="box-sizing: border-box; color: rgb(0, 0, 0); display: inline; flex-wrap: nowrap; font-size: 12px; font-weight: 400; grid-area: auto; line-height: 14.4px; margin: 0px; overflow: visible; text-align: left; text-align-last: auto; white-space-collapse: preserve-breaks;">http://www.pacificlife.com/pacificselectfund.html</span>
|
| Expenses [Text Block] |
What were the Fund costs for the last six months?(based on a hypothetical $10,000 investment; costs paid as a percentage of a $10,000 investment is annualized) Table SummaryClass Name | Cost of a $10,000 investment | Costs paid as a percentage of a $10,000 investment |
|---|
Class I | $19 | 0.38% |
|---|
|
| Expenses Paid, Amount |
$ 19
|
| Expense Ratio, Percent |
0.38%
|
| AssetsNet |
$ 467,877,677
|
| Holdings Count | Holding |
10
|
| InvestmentCompanyPortfolioTurnover |
9.00%
|
| Additional Fund Statistics [Text Block] |
Key Fund Statistics as of June 30, 2026- Total Net Assets$467,877,677
- # of Portfolio Holdings10
- Year-to-Date Total Return5.77%
- Portfolio Turnover Rate9%
Returns provided do not reflect fees and expenses of any variable annuity contract or variable life insurance policy; if these fees and expenses were included, the returns shown would be lower. |
| Holdings [Text Block] |
Fund's Composition (% of Total Net Assets)Table SummaryValue | Value |
|---|
Other Assets & Liabilities, Net | (0.0%) | Affiliated Equity Funds | 45.6% | Affiliated Fixed Income Funds | 54.4% | |
| C000211240 |
|
| Shareholder Report [Line Items] |
|
| Fund Name |
Pacific Dynamix - Conservative Growth Portfolio
|
| Class Name |
Class P
|
| No Trading Symbol [Flag] |
true
|
| Annual or Semi-Annual Statement [Text Block] |
This semi-annual shareholder report contains important information about the Pacific Dynamix - Conservative Growth Portfolio (the "Fund") for the period of January 1, 2026 to June 30, 2026.
|
| Additional Information [Text Block] |
You can find additional information about the Fund at http://www.pacificlife.com/pacificselectfund.html. You can also request this information free of charge by contacting us toll-free at 800-722-4448 or sending an email request to PSFdocumentrequest@pacificlife.com.
|
| Additional Information Phone Number |
800-722-4448
|
| Additional Information Email |
<span style="box-sizing: border-box; color: rgb(0, 0, 0); display: inline; flex-wrap: nowrap; font-size: 12px; font-weight: 400; grid-area: auto; line-height: 14.4px; margin: 0px; overflow: visible; text-align: left; text-align-last: auto; white-space-collapse: preserve-breaks;">PSFdocumentrequest@pacificlife.com</span>
|
| Additional Information Website |
<span style="box-sizing: border-box; color: rgb(0, 0, 0); display: inline; flex-wrap: nowrap; font-size: 12px; font-weight: 400; grid-area: auto; line-height: 14.4px; margin: 0px; overflow: visible; text-align: left; text-align-last: auto; white-space-collapse: preserve-breaks;">http://www.pacificlife.com/pacificselectfund.html</span>
|
| Expenses [Text Block] |
What were the Fund costs for the last six months?(based on a hypothetical $10,000 investment; costs paid as a percentage of a $10,000 investment is annualized) Table SummaryClass Name | Cost of a $10,000 investment | Costs paid as a percentage of a $10,000 investment |
|---|
Class P | $9 | 0.18% |
|---|
|
| Expenses Paid, Amount |
$ 9
|
| Expense Ratio, Percent |
0.18%
|
| AssetsNet |
$ 467,877,677
|
| Holdings Count | Holding |
10
|
| InvestmentCompanyPortfolioTurnover |
9.00%
|
| Additional Fund Statistics [Text Block] |
Key Fund Statistics as of June 30, 2026- Total Net Assets$467,877,677
- # of Portfolio Holdings10
- Year-to-Date Total Return5.87%
- Portfolio Turnover Rate9%
Returns provided do not reflect fees and expenses of any variable annuity contract or variable life insurance policy; if these fees and expenses were included, the returns shown would be lower. |
| Holdings [Text Block] |
Fund's Composition (% of Total Net Assets)Table SummaryValue | Value |
|---|
Other Assets & Liabilities, Net | (0.0%) | Affiliated Equity Funds | 45.6% | Affiliated Fixed Income Funds | 54.4% | |
| C000078101 |
|
| Shareholder Report [Line Items] |
|
| Fund Name |
Pacific Dynamix - Moderate Growth Portfolio
|
| Class Name |
Class I
|
| No Trading Symbol [Flag] |
true
|
| Annual or Semi-Annual Statement [Text Block] |
This semi-annual shareholder report contains important information about the Pacific Dynamix - Moderate Growth Portfolio (the "Fund") for the period of January 1, 2026 to June 30, 2026.
|
| Additional Information [Text Block] |
You can find additional information about the Fund at http://www.pacificlife.com/pacificselectfund.html. You can also request this information free of charge by contacting us toll-free at 800-722-4448 or sending an email request to PSFdocumentrequest@pacificlife.com.
|
| Additional Information Phone Number |
800-722-4448
|
| Additional Information Email |
<span style="box-sizing: border-box; color: rgb(0, 0, 0); display: inline; flex-wrap: nowrap; font-size: 12px; font-weight: 400; grid-area: auto; line-height: 14.4px; margin: 0px; overflow: visible; text-align: left; text-align-last: auto; white-space-collapse: preserve-breaks;">PSFdocumentrequest@pacificlife.com</span>
|
| Additional Information Website |
<span style="box-sizing: border-box; color: rgb(0, 0, 0); display: inline; flex-wrap: nowrap; font-size: 12px; font-weight: 400; grid-area: auto; line-height: 14.4px; margin: 0px; overflow: visible; text-align: left; text-align-last: auto; white-space-collapse: preserve-breaks;">http://www.pacificlife.com/pacificselectfund.html</span>
|
| Expenses [Text Block] |
What were the Fund costs for the last six months?(based on a hypothetical $10,000 investment; costs paid as a percentage of a $10,000 investment is annualized) Table SummaryClass Name | Cost of a $10,000 investment | Costs paid as a percentage of a $10,000 investment |
|---|
Class I | $20 | 0.38% |
|---|
|
| Expenses Paid, Amount |
$ 20
|
| Expense Ratio, Percent |
0.38%
|
| AssetsNet |
$ 2,575,242,641
|
| Holdings Count | Holding |
10
|
| InvestmentCompanyPortfolioTurnover |
7.00%
|
| Additional Fund Statistics [Text Block] |
Key Fund Statistics as of June 30, 2026- Total Net Assets$2,575,242,641
- # of Portfolio Holdings10
- Year-to-Date Total Return8.06%
- Portfolio Turnover Rate7%
Returns provided do not reflect fees and expenses of any variable annuity contract or variable life insurance policy; if these fees and expenses were included, the returns shown would be lower. |
| Holdings [Text Block] |
Fund's Composition (% of Total Net Assets)Table SummaryValue | Value |
|---|
Other Assets & Liabilities, Net | (0.0%) | Affiliated Fixed Income Funds | 35.4% | Affiliated Equity Funds | 64.6% | |
| C000211241 |
|
| Shareholder Report [Line Items] |
|
| Fund Name |
Pacific Dynamix - Moderate Growth Portfolio
|
| Class Name |
Class P
|
| No Trading Symbol [Flag] |
true
|
| Annual or Semi-Annual Statement [Text Block] |
This semi-annual shareholder report contains important information about the Pacific Dynamix - Moderate Growth Portfolio (the "Fund") for the period of January 1, 2026 to June 30, 2026.
|
| Additional Information [Text Block] |
You can find additional information about the Fund at http://www.pacificlife.com/pacificselectfund.html. You can also request this information free of charge by contacting us toll-free at 800-722-4448 or sending an email request to PSFdocumentrequest@pacificlife.com.
|
| Additional Information Phone Number |
800-722-4448
|
| Additional Information Email |
<span style="box-sizing: border-box; color: rgb(0, 0, 0); display: inline; flex-wrap: nowrap; font-size: 12px; font-weight: 400; grid-area: auto; line-height: 14.4px; margin: 0px; overflow: visible; text-align: left; text-align-last: auto; white-space-collapse: preserve-breaks;">PSFdocumentrequest@pacificlife.com</span>
|
| Additional Information Website |
<span style="box-sizing: border-box; color: rgb(0, 0, 0); display: inline; flex-wrap: nowrap; font-size: 12px; font-weight: 400; grid-area: auto; line-height: 14.4px; margin: 0px; overflow: visible; text-align: left; text-align-last: auto; white-space-collapse: preserve-breaks;">http://www.pacificlife.com/pacificselectfund.html</span>
|
| Expenses [Text Block] |
What were the Fund costs for the last six months?(based on a hypothetical $10,000 investment; costs paid as a percentage of a $10,000 investment is annualized) Table SummaryClass Name | Cost of a $10,000 investment | Costs paid as a percentage of a $10,000 investment |
|---|
Class P | $9 | 0.18% |
|---|
|
| Expenses Paid, Amount |
$ 9
|
| Expense Ratio, Percent |
0.18%
|
| AssetsNet |
$ 2,575,242,641
|
| Holdings Count | Holding |
10
|
| InvestmentCompanyPortfolioTurnover |
7.00%
|
| Additional Fund Statistics [Text Block] |
Key Fund Statistics as of June 30, 2026- Total Net Assets$2,575,242,641
- # of Portfolio Holdings10
- Year-to-Date Total Return8.17%
- Portfolio Turnover Rate7%
Returns provided do not reflect fees and expenses of any variable annuity contract or variable life insurance policy; if these fees and expenses were included, the returns shown would be lower. |
| Holdings [Text Block] |
Fund's Composition (% of Total Net Assets)Table SummaryValue | Value |
|---|
Other Assets & Liabilities, Net | (0.0%) | Affiliated Fixed Income Funds | 35.4% | Affiliated Equity Funds | 64.6% | |
| C000078102 |
|
| Shareholder Report [Line Items] |
|
| Fund Name |
Pacific Dynamix - Growth Portfolio
|
| Class Name |
Class I
|
| No Trading Symbol [Flag] |
true
|
| Annual or Semi-Annual Statement [Text Block] |
This semi-annual shareholder report contains important information about the Pacific Dynamix - Growth Portfolio (the "Fund") for the period of January 1, 2026 to June 30, 2026.
|
| Additional Information [Text Block] |
You can find additional information about the Fund at http://www.pacificlife.com/pacificselectfund.html. You can also request this information free of charge by contacting us toll-free at 800-722-4448 or sending an email request to PSFdocumentrequest@pacificlife.com.
|
| Additional Information Phone Number |
800-722-4448
|
| Additional Information Email |
<span style="box-sizing: border-box; color: rgb(0, 0, 0); display: inline; flex-wrap: nowrap; font-size: 12px; font-weight: 400; grid-area: auto; line-height: 14.4px; margin: 0px; overflow: visible; text-align: left; text-align-last: auto; white-space-collapse: preserve-breaks;">PSFdocumentrequest@pacificlife.com</span>
|
| Additional Information Website |
<span style="box-sizing: border-box; color: rgb(0, 0, 0); display: inline; flex-wrap: nowrap; font-size: 12px; font-weight: 400; grid-area: auto; line-height: 14.4px; margin: 0px; overflow: visible; text-align: left; text-align-last: auto; white-space-collapse: preserve-breaks;">http://www.pacificlife.com/pacificselectfund.html</span>
|
| Expenses [Text Block] |
What were the Fund costs for the last six months?(based on a hypothetical $10,000 investment; costs paid as a percentage of a $10,000 investment is annualized) Table SummaryClass Name | Cost of a $10,000 investment | Costs paid as a percentage of a $10,000 investment |
|---|
Class I | $20 | 0.38% |
|---|
|
| Expenses Paid, Amount |
$ 20
|
| Expense Ratio, Percent |
0.38%
|
| AssetsNet |
$ 2,035,467,004
|
| Holdings Count | Holding |
10
|
| InvestmentCompanyPortfolioTurnover |
10.00%
|
| Additional Fund Statistics [Text Block] |
Key Fund Statistics as of June 30, 2026- Total Net Assets$2,035,467,004
- # of Portfolio Holdings10
- Year-to-Date Total Return9.94%
- Portfolio Turnover Rate10%
Returns provided do not reflect fees and expenses of any variable annuity contract or variable life insurance policy; if these fees and expenses were included, the returns shown would be lower. |
| Holdings [Text Block] |
Fund's Composition (% of Total Net Assets)Table SummaryValue | Value |
|---|
Other Assets & Liabilities, Net | (0.0%) | Affiliated Fixed Income Funds | 19.4% | Affiliated Equity Funds | 80.6% | |
| C000211242 |
|
| Shareholder Report [Line Items] |
|
| Fund Name |
Pacific Dynamix - Growth Portfolio
|
| Class Name |
Class P
|
| No Trading Symbol [Flag] |
true
|
| Annual or Semi-Annual Statement [Text Block] |
This semi-annual shareholder report contains important information about the Pacific Dynamix - Growth Portfolio (the "Fund") for the period of January 1, 2026 to June 30, 2026.
|
| Additional Information [Text Block] |
You can find additional information about the Fund at http://www.pacificlife.com/pacificselectfund.html. You can also request this information free of charge by contacting us toll-free at 800-722-4448 or sending an email request to PSFdocumentrequest@pacificlife.com.
|
| Additional Information Phone Number |
800-722-4448
|
| Additional Information Email |
<span style="box-sizing: border-box; color: rgb(0, 0, 0); display: inline; flex-wrap: nowrap; font-size: 12px; font-weight: 400; grid-area: auto; line-height: 14.4px; margin: 0px; overflow: visible; text-align: left; text-align-last: auto; white-space-collapse: preserve-breaks;">PSFdocumentrequest@pacificlife.com</span>
|
| Additional Information Website |
<span style="box-sizing: border-box; color: rgb(0, 0, 0); display: inline; flex-wrap: nowrap; font-size: 12px; font-weight: 400; grid-area: auto; line-height: 14.4px; margin: 0px; overflow: visible; text-align: left; text-align-last: auto; white-space-collapse: preserve-breaks;">http://www.pacificlife.com/pacificselectfund.html</span>
|
| Expenses [Text Block] |
What were the Fund costs for the last six months?(based on a hypothetical $10,000 investment; costs paid as a percentage of a $10,000 investment is annualized) Table SummaryClass Name | Cost of a $10,000 investment | Costs paid as a percentage of a $10,000 investment |
|---|
Class P | $9 | 0.18% |
|---|
|
| Expenses Paid, Amount |
$ 9
|
| Expense Ratio, Percent |
0.18%
|
| AssetsNet |
$ 2,035,467,004
|
| Holdings Count | Holding |
10
|
| InvestmentCompanyPortfolioTurnover |
10.00%
|
| Additional Fund Statistics [Text Block] |
Key Fund Statistics as of June 30, 2026- Total Net Assets$2,035,467,004
- # of Portfolio Holdings10
- Year-to-Date Total Return10.05%
- Portfolio Turnover Rate10%
Returns provided do not reflect fees and expenses of any variable annuity contract or variable life insurance policy; if these fees and expenses were included, the returns shown would be lower. |
| Holdings [Text Block] |
Fund's Composition (% of Total Net Assets)Table SummaryValue | Value |
|---|
Other Assets & Liabilities, Net | (0.0%) | Affiliated Fixed Income Funds | 19.4% | Affiliated Equity Funds | 80.6% | |
| C000248882 |
|
| Shareholder Report [Line Items] |
|
| Fund Name |
Pacific Dynamix - Aggressive Growth Portfolio
|
| Class Name |
Class I
|
| No Trading Symbol [Flag] |
true
|
| Annual or Semi-Annual Statement [Text Block] |
This semi-annual shareholder report contains important information about the Pacific Dynamix - Aggressive Growth Portfolio (the "Fund") for the period of January 1, 2026 to June 30, 2026.
|
| Additional Information [Text Block] |
You can find additional information about the Fund at http://www.pacificlife.com/pacificselectfund.html. You can also request this information free of charge by contacting us toll-free at 800-722-4448 or sending an email request to PSFdocumentrequest@pacificlife.com.
|
| Additional Information Phone Number |
800-722-4448
|
| Additional Information Email |
<span style="box-sizing: border-box; color: rgb(0, 0, 0); display: inline; flex-wrap: nowrap; font-size: 12px; font-weight: 400; grid-area: auto; line-height: 14.4px; margin: 0px; overflow: visible; text-align: left; text-align-last: auto; white-space-collapse: preserve-breaks;">PSFdocumentrequest@pacificlife.com</span>
|
| Additional Information Website |
<span style="box-sizing: border-box; color: rgb(0, 0, 0); display: inline; flex-wrap: nowrap; font-size: 12px; font-weight: 400; grid-area: auto; line-height: 14.4px; margin: 0px; overflow: visible; text-align: left; text-align-last: auto; white-space-collapse: preserve-breaks;">http://www.pacificlife.com/pacificselectfund.html</span>
|
| Expenses [Text Block] |
What were the Fund costs for the last six months?(based on a hypothetical $10,000 investment; costs paid as a percentage of a $10,000 investment is annualized) Table SummaryClass Name | Cost of a $10,000 investment | Costs paid as a percentage of a $10,000 investment |
|---|
Class I | $20 | 0.38% |
|---|
|
| Expenses Paid, Amount |
$ 20
|
| Expense Ratio, Percent |
0.38%
|
| AssetsNet |
$ 36,461,744
|
| Holdings Count | Holding |
10
|
| InvestmentCompanyPortfolioTurnover |
18.00%
|
| Additional Fund Statistics [Text Block] |
Key Fund Statistics as of June 30, 2026- Total Net Assets$36,461,744
- # of Portfolio Holdings10
- Year-to-Date Total Return11.58%
- Portfolio Turnover Rate18%
Returns provided do not reflect fees and expenses of any variable annuity contract or variable life insurance policy; if these fees and expenses were included, the returns shown would be lower. |
| Holdings [Text Block] |
Fund's Composition (% of Total Net Assets)Table SummaryValue | Value |
|---|
Other Assets & Liabilities, Net | (0.1%) | Affiliated Fixed Income Funds | 7.0% | Affiliated Equity Funds | 93.1% | |
| C000248883 |
|
| Shareholder Report [Line Items] |
|
| Fund Name |
Pacific Dynamix - Aggressive Growth Portfolio
|
| Class Name |
Class P
|
| No Trading Symbol [Flag] |
true
|
| Annual or Semi-Annual Statement [Text Block] |
This semi-annual shareholder report contains important information about the Pacific Dynamix - Aggressive Growth Portfolio (the "Fund") for the period of January 1, 2026 to June 30, 2026.
|
| Additional Information [Text Block] |
You can find additional information about the Fund at http://www.pacificlife.com/pacificselectfund.html. You can also request this information free of charge by contacting us toll-free at 800-722-4448 or sending an email request to PSFdocumentrequest@pacificlife.com.
|
| Additional Information Phone Number |
800-722-4448
|
| Additional Information Email |
<span style="box-sizing: border-box; color: rgb(0, 0, 0); display: inline; flex-wrap: nowrap; font-size: 12px; font-weight: 400; grid-area: auto; line-height: 14.4px; margin: 0px; overflow: visible; text-align: left; text-align-last: auto; white-space-collapse: preserve-breaks;">PSFdocumentrequest@pacificlife.com</span>
|
| Additional Information Website |
<span style="box-sizing: border-box; color: rgb(0, 0, 0); display: inline; flex-wrap: nowrap; font-size: 12px; font-weight: 400; grid-area: auto; line-height: 14.4px; margin: 0px; overflow: visible; text-align: left; text-align-last: auto; white-space-collapse: preserve-breaks;">http://www.pacificlife.com/pacificselectfund.html</span>
|
| Expenses [Text Block] |
What were the Fund costs for the last six months?(based on a hypothetical $10,000 investment; costs paid as a percentage of a $10,000 investment is annualized) Table SummaryClass Name | Cost of a $10,000 investment | Costs paid as a percentage of a $10,000 investment |
|---|
Class P | $9 | 0.18% |
|---|
|
| Expenses Paid, Amount |
$ 9
|
| Expense Ratio, Percent |
0.18%
|
| AssetsNet |
$ 36,461,744
|
| Holdings Count | Holding |
10
|
| InvestmentCompanyPortfolioTurnover |
18.00%
|
| Additional Fund Statistics [Text Block] |
Key Fund Statistics as of June 30, 2026- Total Net Assets$36,461,744
- # of Portfolio Holdings10
- Year-to-Date Total Return11.69%
- Portfolio Turnover Rate18%
Returns provided do not reflect fees and expenses of any variable annuity contract or variable life insurance policy; if these fees and expenses were included, the returns shown would be lower. |
| Holdings [Text Block] |
Fund's Composition (% of Total Net Assets)Table SummaryValue | Value |
|---|
Other Assets & Liabilities, Net | (0.1%) | Affiliated Fixed Income Funds | 7.0% | Affiliated Equity Funds | 93.1% | |
| C000098939 |
|
| Shareholder Report [Line Items] |
|
| Fund Name |
Portfolio Optimization Conservative Portfolio
|
| Class Name |
Class I
|
| No Trading Symbol [Flag] |
true
|
| Annual or Semi-Annual Statement [Text Block] |
This semi-annual shareholder report contains important information about the Portfolio Optimization Conservative Portfolio (the "Fund") for the period of January 1, 2026 to June 30, 2026.
|
| Additional Information [Text Block] |
You can find additional information about the Fund at http://www.pacificlife.com/pacificselectfund.html. You can also request this information free of charge by contacting us toll-free at 800-722-4448 or sending an email request to PSFdocumentrequest@pacificlife.com.
|
| Additional Information Phone Number |
800-722-4448
|
| Additional Information Email |
<span style="box-sizing: border-box; color: rgb(0, 0, 0); display: inline; flex-wrap: nowrap; font-size: 12px; font-weight: 400; grid-area: auto; line-height: 14.4px; margin: 0px; overflow: visible; text-align: left; text-align-last: auto; white-space-collapse: preserve-breaks;">PSFdocumentrequest@pacificlife.com</span>
|
| Additional Information Website |
<span style="box-sizing: border-box; color: rgb(0, 0, 0); display: inline; flex-wrap: nowrap; font-size: 12px; font-weight: 400; grid-area: auto; line-height: 14.4px; margin: 0px; overflow: visible; text-align: left; text-align-last: auto; white-space-collapse: preserve-breaks;">http://www.pacificlife.com/pacificselectfund.html</span>
|
| Expenses [Text Block] |
What were the Fund costs for the last six months?(based on a hypothetical $10,000 investment; costs paid as a percentage of a $10,000 investment is annualized) Table SummaryClass Name | Cost of a $10,000 investment | Costs paid as a percentage of a $10,000 investment |
|---|
Class I | $17 | 0.33% |
|---|
|
| Expenses Paid, Amount |
$ 17
|
| Expense Ratio, Percent |
0.33%
|
| AssetsNet |
$ 880,460,108
|
| Holdings Count | Holding |
34
|
| InvestmentCompanyPortfolioTurnover |
26.00%
|
| Additional Fund Statistics [Text Block] |
Key Fund Statistics as of June 30, 2026- Total Net Assets$880,460,108
- # of Portfolio Holdings34
- Year-to-Date Total Return3.47%
- Portfolio Turnover Rate26%
Returns provided do not reflect fees and expenses of any variable annuity contract or variable life insurance policy; if these fees and expenses were included, the returns shown would be lower. |
| Holdings [Text Block] |
Fund's Composition (% of Total Net Assets)Table SummaryValue | Value |
|---|
Other Assets & Liabilities, Net | (0.0%) | Affiliated Equity Funds | 24.2% | Affiliated Fixed Income Funds | 75.8% | |
| C000211243 |
|
| Shareholder Report [Line Items] |
|
| Fund Name |
Portfolio Optimization Conservative Portfolio
|
| Class Name |
Class P
|
| No Trading Symbol [Flag] |
true
|
| Annual or Semi-Annual Statement [Text Block] |
This semi-annual shareholder report contains important information about the Portfolio Optimization Conservative Portfolio (the "Fund") for the period of January 1, 2026 to June 30, 2026.
|
| Additional Information [Text Block] |
You can find additional information about the Fund at http://www.pacificlife.com/pacificselectfund.html. You can also request this information free of charge by contacting us toll-free at 800-722-4448 or sending an email request to PSFdocumentrequest@pacificlife.com.
|
| Additional Information Phone Number |
800-722-4448
|
| Additional Information Email |
<span style="box-sizing: border-box; color: rgb(0, 0, 0); display: inline; flex-wrap: nowrap; font-size: 12px; font-weight: 400; grid-area: auto; line-height: 14.4px; margin: 0px; overflow: visible; text-align: left; text-align-last: auto; white-space-collapse: preserve-breaks;">PSFdocumentrequest@pacificlife.com</span>
|
| Additional Information Website |
<span style="box-sizing: border-box; color: rgb(0, 0, 0); display: inline; flex-wrap: nowrap; font-size: 12px; font-weight: 400; grid-area: auto; line-height: 14.4px; margin: 0px; overflow: visible; text-align: left; text-align-last: auto; white-space-collapse: preserve-breaks;">http://www.pacificlife.com/pacificselectfund.html</span>
|
| Expenses [Text Block] |
What were the Fund costs for the last six months?(based on a hypothetical $10,000 investment; costs paid as a percentage of a $10,000 investment is annualized) Table SummaryClass Name | Cost of a $10,000 investment | Costs paid as a percentage of a $10,000 investment |
|---|
Class P | $7 | 0.13% |
|---|
|
| Expenses Paid, Amount |
$ 7
|
| Expense Ratio, Percent |
0.13%
|
| AssetsNet |
$ 880,460,108
|
| Holdings Count | Holding |
34
|
| InvestmentCompanyPortfolioTurnover |
26.00%
|
| Additional Fund Statistics [Text Block] |
Key Fund Statistics as of June 30, 2026- Total Net Assets$880,460,108
- # of Portfolio Holdings34
- Year-to-Date Total Return3.57%
- Portfolio Turnover Rate26%
Returns provided do not reflect fees and expenses of any variable annuity contract or variable life insurance policy; if these fees and expenses were included, the returns shown would be lower. |
| Holdings [Text Block] |
Fund's Composition (% of Total Net Assets)Table SummaryValue | Value |
|---|
Other Assets & Liabilities, Net | (0.0%) | Affiliated Equity Funds | 24.2% | Affiliated Fixed Income Funds | 75.8% | |
| C000098940 |
|
| Shareholder Report [Line Items] |
|
| Fund Name |
Portfolio Optimization Moderate-Conservative Portfolio
|
| Class Name |
Class I
|
| No Trading Symbol [Flag] |
true
|
| Annual or Semi-Annual Statement [Text Block] |
This semi-annual shareholder report contains important information about the Portfolio Optimization Moderate-Conservative Portfolio (the "Fund") for the period of January 1, 2026 to June 30, 2026.
|
| Additional Information [Text Block] |
You can find additional information about the Fund at http://www.pacificlife.com/pacificselectfund.html. You can also request this information free of charge by contacting us toll-free at 800-722-4448 or sending an email request to PSFdocumentrequest@pacificlife.com.
|
| Additional Information Phone Number |
800-722-4448
|
| Additional Information Email |
<span style="box-sizing: border-box; color: rgb(0, 0, 0); display: inline; flex-wrap: nowrap; font-size: 12px; font-weight: 400; grid-area: auto; line-height: 14.4px; margin: 0px; overflow: visible; text-align: left; text-align-last: auto; white-space-collapse: preserve-breaks;">PSFdocumentrequest@pacificlife.com</span>
|
| Additional Information Website |
<span style="box-sizing: border-box; color: rgb(0, 0, 0); display: inline; flex-wrap: nowrap; font-size: 12px; font-weight: 400; grid-area: auto; line-height: 14.4px; margin: 0px; overflow: visible; text-align: left; text-align-last: auto; white-space-collapse: preserve-breaks;">http://www.pacificlife.com/pacificselectfund.html</span>
|
| Expenses [Text Block] |
What were the Fund costs for the last six months?(based on a hypothetical $10,000 investment; costs paid as a percentage of a $10,000 investment is annualized) Table SummaryClass Name | Cost of a $10,000 investment | Costs paid as a percentage of a $10,000 investment |
|---|
Class I | $16 | 0.32% |
|---|
|
| Expenses Paid, Amount |
$ 16
|
| Expense Ratio, Percent |
0.32%
|
| AssetsNet |
$ 1,308,680,328
|
| Holdings Count | Holding |
35
|
| InvestmentCompanyPortfolioTurnover |
23.00%
|
| Additional Fund Statistics [Text Block] |
Key Fund Statistics as of June 30, 2026- Total Net Assets$1,308,680,328
- # of Portfolio Holdings35
- Year-to-Date Total Return5.49%
- Portfolio Turnover Rate23%
Returns provided do not reflect fees and expenses of any variable annuity contract or variable life insurance policy; if these fees and expenses were included, the returns shown would be lower. |
| Holdings [Text Block] |
Fund's Composition (% of Total Net Assets)Table SummaryValue | Value |
|---|
Other Assets & Liabilities, Net | (0.0%) | Affiliated Equity Funds | 45.7% | Affiliated Fixed Income Funds | 54.3% | |
| C000211244 |
|
| Shareholder Report [Line Items] |
|
| Fund Name |
Portfolio Optimization Moderate-Conservative Portfolio
|
| Class Name |
Class P
|
| No Trading Symbol [Flag] |
true
|
| Annual or Semi-Annual Statement [Text Block] |
This semi-annual shareholder report contains important information about the Portfolio Optimization Moderate-Conservative Portfolio (the "Fund") for the period of January 1, 2026 to June 30, 2026.
|
| Additional Information [Text Block] |
You can find additional information about the Fund at http://www.pacificlife.com/pacificselectfund.html. You can also request this information free of charge by contacting us toll-free at 800-722-4448 or sending an email request to PSFdocumentrequest@pacificlife.com.
|
| Additional Information Phone Number |
800-722-4448
|
| Additional Information Email |
<span style="box-sizing: border-box; color: rgb(0, 0, 0); display: inline; flex-wrap: nowrap; font-size: 12px; font-weight: 400; grid-area: auto; line-height: 14.4px; margin: 0px; overflow: visible; text-align: left; text-align-last: auto; white-space-collapse: preserve-breaks;">PSFdocumentrequest@pacificlife.com</span>
|
| Additional Information Website |
<span style="box-sizing: border-box; color: rgb(0, 0, 0); display: inline; flex-wrap: nowrap; font-size: 12px; font-weight: 400; grid-area: auto; line-height: 14.4px; margin: 0px; overflow: visible; text-align: left; text-align-last: auto; white-space-collapse: preserve-breaks;">http://www.pacificlife.com/pacificselectfund.html</span>
|
| Expenses [Text Block] |
What were the Fund costs for the last six months?(based on a hypothetical $10,000 investment; costs paid as a percentage of a $10,000 investment is annualized) Table SummaryClass Name | Cost of a $10,000 investment | Costs paid as a percentage of a $10,000 investment |
|---|
Class P | $6 | 0.12% |
|---|
|
| Expenses Paid, Amount |
$ 6
|
| Expense Ratio, Percent |
0.12%
|
| AssetsNet |
$ 1,308,680,328
|
| Holdings Count | Holding |
35
|
| InvestmentCompanyPortfolioTurnover |
23.00%
|
| Additional Fund Statistics [Text Block] |
Key Fund Statistics as of June 30, 2026- Total Net Assets$1,308,680,328
- # of Portfolio Holdings35
- Year-to-Date Total Return5.60%
- Portfolio Turnover Rate23%
Returns provided do not reflect fees and expenses of any variable annuity contract or variable life insurance policy; if these fees and expenses were included, the returns shown would be lower. |
| Holdings [Text Block] |
Fund's Composition (% of Total Net Assets)Table SummaryValue | Value |
|---|
Other Assets & Liabilities, Net | (0.0%) | Affiliated Equity Funds | 45.7% | Affiliated Fixed Income Funds | 54.3% | |
| C000098941 |
|
| Shareholder Report [Line Items] |
|
| Fund Name |
Portfolio Optimization Moderate Portfolio
|
| Class Name |
Class I
|
| No Trading Symbol [Flag] |
true
|
| Annual or Semi-Annual Statement [Text Block] |
This semi-annual shareholder report contains important information about the Portfolio Optimization Moderate Portfolio (the "Fund") for the period of January 1, 2026 to June 30, 2026.
|
| Additional Information [Text Block] |
You can find additional information about the Fund at http://www.pacificlife.com/pacificselectfund.html. You can also request this information free of charge by contacting us toll-free at 800-722-4448 or sending an email request to PSFdocumentrequest@pacificlife.com.
|
| Additional Information Phone Number |
800-722-4448
|
| Additional Information Email |
<span style="box-sizing: border-box; color: rgb(0, 0, 0); display: inline; flex-wrap: nowrap; font-size: 12px; font-weight: 400; grid-area: auto; line-height: 14.4px; margin: 0px; overflow: visible; text-align: left; text-align-last: auto; white-space-collapse: preserve-breaks;">PSFdocumentrequest@pacificlife.com</span>
|
| Additional Information Website |
<span style="box-sizing: border-box; color: rgb(0, 0, 0); display: inline; flex-wrap: nowrap; font-size: 12px; font-weight: 400; grid-area: auto; line-height: 14.4px; margin: 0px; overflow: visible; text-align: left; text-align-last: auto; white-space-collapse: preserve-breaks;">http://www.pacificlife.com/pacificselectfund.html</span>
|
| Expenses [Text Block] |
What were the Fund costs for the last six months?(based on a hypothetical $10,000 investment; costs paid as a percentage of a $10,000 investment is annualized) Table SummaryClass Name | Cost of a $10,000 investment | Costs paid as a percentage of a $10,000 investment |
|---|
Class I | $16 | 0.32% |
|---|
|
| Expenses Paid, Amount |
$ 16
|
| Expense Ratio, Percent |
0.32%
|
| AssetsNet |
$ 6,387,935,447
|
| Holdings Count | Holding |
35
|
| InvestmentCompanyPortfolioTurnover |
23.00%
|
| Additional Fund Statistics [Text Block] |
Key Fund Statistics as of June 30, 2026- Total Net Assets$6,387,935,447
- # of Portfolio Holdings35
- Year-to-Date Total Return7.29%
- Portfolio Turnover Rate23%
Returns provided do not reflect fees and expenses of any variable annuity contract or variable life insurance policy; if these fees and expenses were included, the returns shown would be lower. |
| Holdings [Text Block] |
Fund's Composition (% of Total Net Assets)Table SummaryValue | Value |
|---|
Other Assets & Liabilities, Net | (0.0%) | Affiliated Fixed Income Funds | 35.3% | Affiliated Equity Funds | 64.7% | |
| C000211245 |
|
| Shareholder Report [Line Items] |
|
| Fund Name |
Portfolio Optimization Moderate Portfolio
|
| Class Name |
Class P
|
| No Trading Symbol [Flag] |
true
|
| Annual or Semi-Annual Statement [Text Block] |
This semi-annual shareholder report contains important information about the Portfolio Optimization Moderate Portfolio (the "Fund") for the period of January 1, 2026 to June 30, 2026.
|
| Additional Information [Text Block] |
You can find additional information about the Fund at http://www.pacificlife.com/pacificselectfund.html. You can also request this information free of charge by contacting us toll-free at 800-722-4448 or sending an email request to PSFdocumentrequest@pacificlife.com.
|
| Additional Information Phone Number |
800-722-4448
|
| Additional Information Email |
<span style="box-sizing: border-box; color: rgb(0, 0, 0); display: inline; flex-wrap: nowrap; font-size: 12px; font-weight: 400; grid-area: auto; line-height: 14.4px; margin: 0px; overflow: visible; text-align: left; text-align-last: auto; white-space-collapse: preserve-breaks;">PSFdocumentrequest@pacificlife.com</span>
|
| Additional Information Website |
<span style="box-sizing: border-box; color: rgb(0, 0, 0); display: inline; flex-wrap: nowrap; font-size: 12px; font-weight: 400; grid-area: auto; line-height: 14.4px; margin: 0px; overflow: visible; text-align: left; text-align-last: auto; white-space-collapse: preserve-breaks;">http://www.pacificlife.com/pacificselectfund.html</span>
|
| Expenses [Text Block] |
What were the Fund costs for the last six months?(based on a hypothetical $10,000 investment; costs paid as a percentage of a $10,000 investment is annualized) Table SummaryClass Name | Cost of a $10,000 investment | Costs paid as a percentage of a $10,000 investment |
|---|
Class P | $6 | 0.12% |
|---|
|
| Expenses Paid, Amount |
$ 6
|
| Expense Ratio, Percent |
0.12%
|
| AssetsNet |
$ 6,387,935,447
|
| Holdings Count | Holding |
35
|
| InvestmentCompanyPortfolioTurnover |
23.00%
|
| Additional Fund Statistics [Text Block] |
Key Fund Statistics as of June 30, 2026- Total Net Assets$6,387,935,447
- # of Portfolio Holdings35
- Year-to-Date Total Return7.40%
- Portfolio Turnover Rate23%
Returns provided do not reflect fees and expenses of any variable annuity contract or variable life insurance policy; if these fees and expenses were included, the returns shown would be lower. |
| Holdings [Text Block] |
Fund's Composition (% of Total Net Assets)Table SummaryValue | Value |
|---|
Other Assets & Liabilities, Net | (0.0%) | Affiliated Fixed Income Funds | 35.3% | Affiliated Equity Funds | 64.7% | |
| C000098942 |
|
| Shareholder Report [Line Items] |
|
| Fund Name |
Portfolio Optimization Growth Portfolio
|
| Class Name |
Class I
|
| No Trading Symbol [Flag] |
true
|
| Annual or Semi-Annual Statement [Text Block] |
This semi-annual shareholder report contains important information about the Portfolio Optimization Growth Portfolio (the "Fund") for the period of January 1, 2026 to June 30, 2026.
|
| Additional Information [Text Block] |
You can find additional information about the Fund at http://www.pacificlife.com/pacificselectfund.html. You can also request this information free of charge by contacting us toll-free at 800-722-4448 or sending an email request to PSFdocumentrequest@pacificlife.com.
|
| Additional Information Phone Number |
800-722-4448
|
| Additional Information Email |
<span style="box-sizing: border-box; color: rgb(0, 0, 0); display: inline; flex-wrap: nowrap; font-size: 12px; font-weight: 400; grid-area: auto; line-height: 14.4px; margin: 0px; overflow: visible; text-align: left; text-align-last: auto; white-space-collapse: preserve-breaks;">PSFdocumentrequest@pacificlife.com</span>
|
| Additional Information Website |
<span style="box-sizing: border-box; color: rgb(0, 0, 0); display: inline; flex-wrap: nowrap; font-size: 12px; font-weight: 400; grid-area: auto; line-height: 14.4px; margin: 0px; overflow: visible; text-align: left; text-align-last: auto; white-space-collapse: preserve-breaks;">http://www.pacificlife.com/pacificselectfund.html</span>
|
| Expenses [Text Block] |
What were the Fund costs for the last six months?(based on a hypothetical $10,000 investment; costs paid as a percentage of a $10,000 investment is annualized) Table SummaryClass Name | Cost of a $10,000 investment | Costs paid as a percentage of a $10,000 investment |
|---|
Class I | $17 | 0.32% |
|---|
|
| Expenses Paid, Amount |
$ 17
|
| Expense Ratio, Percent |
0.32%
|
| AssetsNet |
$ 6,275,159,588
|
| Holdings Count | Holding |
35
|
| InvestmentCompanyPortfolioTurnover |
22.00%
|
| Additional Fund Statistics [Text Block] |
Key Fund Statistics as of June 30, 2026- Total Net Assets$6,275,159,588
- # of Portfolio Holdings35
- Year-to-Date Total Return9.03%
- Portfolio Turnover Rate22%
Returns provided do not reflect fees and expenses of any variable annuity contract or variable life insurance policy; if these fees and expenses were included, the returns shown would be lower. |
| Holdings [Text Block] |
Fund's Composition (% of Total Net Assets)Table SummaryValue | Value |
|---|
Other Assets & Liabilities, Net | (0.0%) | Affiliated Fixed Income Funds | 19.9% | Affiliated Equity Funds | 80.1% | |
| C000211246 |
|
| Shareholder Report [Line Items] |
|
| Fund Name |
Portfolio Optimization Growth Portfolio
|
| Class Name |
Class P
|
| No Trading Symbol [Flag] |
true
|
| Annual or Semi-Annual Statement [Text Block] |
This semi-annual shareholder report contains important information about the Portfolio Optimization Growth Portfolio (the "Fund") for the period of January 1, 2026 to June 30, 2026.
|
| Additional Information [Text Block] |
You can find additional information about the Fund at http://www.pacificlife.com/pacificselectfund.html. You can also request this information free of charge by contacting us toll-free at 800-722-4448 or sending an email request to PSFdocumentrequest@pacificlife.com.
|
| Additional Information Phone Number |
800-722-4448
|
| Additional Information Email |
<span style="box-sizing: border-box; color: rgb(0, 0, 0); display: inline; flex-wrap: nowrap; font-size: 12px; font-weight: 400; grid-area: auto; line-height: 14.4px; margin: 0px; overflow: visible; text-align: left; text-align-last: auto; white-space-collapse: preserve-breaks;">PSFdocumentrequest@pacificlife.com</span>
|
| Additional Information Website |
<span style="box-sizing: border-box; color: rgb(0, 0, 0); display: inline; flex-wrap: nowrap; font-size: 12px; font-weight: 400; grid-area: auto; line-height: 14.4px; margin: 0px; overflow: visible; text-align: left; text-align-last: auto; white-space-collapse: preserve-breaks;">http://www.pacificlife.com/pacificselectfund.html</span>
|
| Expenses [Text Block] |
What were the Fund costs for the last six months?(based on a hypothetical $10,000 investment; costs paid as a percentage of a $10,000 investment is annualized) Table SummaryClass Name | Cost of a $10,000 investment | Costs paid as a percentage of a $10,000 investment |
|---|
Class P | $6 | 0.12% |
|---|
|
| Expenses Paid, Amount |
$ 6
|
| Expense Ratio, Percent |
0.12%
|
| AssetsNet |
$ 6,275,159,588
|
| Holdings Count | Holding |
35
|
| InvestmentCompanyPortfolioTurnover |
22.00%
|
| Additional Fund Statistics [Text Block] |
Key Fund Statistics as of June 30, 2026- Total Net Assets$6,275,159,588
- # of Portfolio Holdings35
- Year-to-Date Total Return9.14%
- Portfolio Turnover Rate22%
Returns provided do not reflect fees and expenses of any variable annuity contract or variable life insurance policy; if these fees and expenses were included, the returns shown would be lower. |
| Holdings [Text Block] |
Fund's Composition (% of Total Net Assets)Table SummaryValue | Value |
|---|
Other Assets & Liabilities, Net | (0.0%) | Affiliated Fixed Income Funds | 19.9% | Affiliated Equity Funds | 80.1% | |
| C000098943 |
|
| Shareholder Report [Line Items] |
|
| Fund Name |
Portfolio Optimization Aggressive-Growth Portfolio
|
| Class Name |
Class I
|
| No Trading Symbol [Flag] |
true
|
| Annual or Semi-Annual Statement [Text Block] |
This semi-annual shareholder report contains important information about the Portfolio Optimization Aggressive-Growth Portfolio (the "Fund") for the period of January 1, 2026 to June 30, 2026.
|
| Additional Information [Text Block] |
You can find additional information about the Fund at http://www.pacificlife.com/pacificselectfund.html. You can also request this information free of charge by contacting us toll-free at 800-722-4448 or sending an email request to PSFdocumentrequest@pacificlife.com.
|
| Additional Information Phone Number |
800-722-4448
|
| Additional Information Email |
<span style="box-sizing: border-box; color: rgb(0, 0, 0); display: inline; flex-wrap: nowrap; font-size: 12px; font-weight: 400; grid-area: auto; line-height: 14.4px; margin: 0px; overflow: visible; text-align: left; text-align-last: auto; white-space-collapse: preserve-breaks;">PSFdocumentrequest@pacificlife.com</span>
|
| Additional Information Website |
<span style="box-sizing: border-box; color: rgb(0, 0, 0); display: inline; flex-wrap: nowrap; font-size: 12px; font-weight: 400; grid-area: auto; line-height: 14.4px; margin: 0px; overflow: visible; text-align: left; text-align-last: auto; white-space-collapse: preserve-breaks;">http://www.pacificlife.com/pacificselectfund.html</span>
|
| Expenses [Text Block] |
What were the Fund costs for the last six months?(based on a hypothetical $10,000 investment; costs paid as a percentage of a $10,000 investment is annualized) Table SummaryClass Name | Cost of a $10,000 investment | Costs paid as a percentage of a $10,000 investment |
|---|
Class I | $17 | 0.32% |
|---|
|
| Expenses Paid, Amount |
$ 17
|
| Expense Ratio, Percent |
0.32%
|
| AssetsNet |
$ 1,669,578,947
|
| Holdings Count | Holding |
35
|
| InvestmentCompanyPortfolioTurnover |
23.00%
|
| Additional Fund Statistics [Text Block] |
Key Fund Statistics as of June 30, 2026- Total Net Assets$1,669,578,947
- # of Portfolio Holdings35
- Year-to-Date Total Return10.54%
- Portfolio Turnover Rate23%
Returns provided do not reflect fees and expenses of any variable annuity contract or variable life insurance policy; if these fees and expenses were included, the returns shown would be lower. |
| Holdings [Text Block] |
Fund's Composition (% of Total Net Assets)Table SummaryValue | Value |
|---|
Other Assets & Liabilities, Net | (0.0%) | Affiliated Fixed Income Funds | 7.4% | Affiliated Equity Funds | 92.6% | |
| C000211247 |
|
| Shareholder Report [Line Items] |
|
| Fund Name |
Portfolio Optimization Aggressive-Growth Portfolio
|
| Class Name |
Class P
|
| No Trading Symbol [Flag] |
true
|
| Annual or Semi-Annual Statement [Text Block] |
This semi-annual shareholder report contains important information about the Portfolio Optimization Aggressive-Growth Portfolio (the "Fund") for the period of January 1, 2026 to June 30, 2026.
|
| Additional Information [Text Block] |
You can find additional information about the Fund at http://www.pacificlife.com/pacificselectfund.html. You can also request this information free of charge by contacting us toll-free at 800-722-4448 or sending an email request to PSFdocumentrequest@pacificlife.com.
|
| Additional Information Phone Number |
800-722-4448
|
| Additional Information Email |
<span style="box-sizing: border-box; color: rgb(0, 0, 0); display: inline; flex-wrap: nowrap; font-size: 12px; font-weight: 400; grid-area: auto; line-height: 14.4px; margin: 0px; overflow: visible; text-align: left; text-align-last: auto; white-space-collapse: preserve-breaks;">PSFdocumentrequest@pacificlife.com</span>
|
| Additional Information Website |
<span style="box-sizing: border-box; color: rgb(0, 0, 0); display: inline; flex-wrap: nowrap; font-size: 12px; font-weight: 400; grid-area: auto; line-height: 14.4px; margin: 0px; overflow: visible; text-align: left; text-align-last: auto; white-space-collapse: preserve-breaks;">http://www.pacificlife.com/pacificselectfund.html</span>
|
| Expenses [Text Block] |
What were the Fund costs for the last six months?(based on a hypothetical $10,000 investment; costs paid as a percentage of a $10,000 investment is annualized) Table SummaryClass Name | Cost of a $10,000 investment | Costs paid as a percentage of a $10,000 investment |
|---|
Class P | $6 | 0.12% |
|---|
|
| Expenses Paid, Amount |
$ 6
|
| Expense Ratio, Percent |
0.12%
|
| AssetsNet |
$ 1,669,578,947
|
| Holdings Count | Holding |
35
|
| InvestmentCompanyPortfolioTurnover |
23.00%
|
| Additional Fund Statistics [Text Block] |
Key Fund Statistics as of June 30, 2026- Total Net Assets$1,669,578,947
- # of Portfolio Holdings35
- Year-to-Date Total Return10.65%
- Portfolio Turnover Rate23%
Returns provided do not reflect fees and expenses of any variable annuity contract or variable life insurance policy; if these fees and expenses were included, the returns shown would be lower. |
| Holdings [Text Block] |
Fund's Composition (% of Total Net Assets)Table SummaryValue | Value |
|---|
Other Assets & Liabilities, Net | (0.0%) | Affiliated Fixed Income Funds | 7.4% | Affiliated Equity Funds | 92.6% | |
| C000139083 |
|
| Shareholder Report [Line Items] |
|
| Fund Name |
PD 1-3 Year Corporate Bond Portfolio
|
| Class Name |
Class P
|
| No Trading Symbol [Flag] |
true
|
| Annual or Semi-Annual Statement [Text Block] |
This semi-annual shareholder report contains important information about the PD 1-3 Year Corporate Bond Portfolio (the "Fund") for the period of January 1, 2026 to June 30, 2026.
|
| Additional Information [Text Block] |
You can find additional information about the Fund at http://www.pacificlife.com/pacificselectfund.html. You can also request this information free of charge by contacting us toll-free at 800-722-4448 or sending an email request to PSFdocumentrequest@pacificlife.com.
|
| Additional Information Phone Number |
800-722-4448
|
| Additional Information Email |
<span style="box-sizing: border-box; color: rgb(0, 0, 0); display: inline; flex-wrap: nowrap; font-size: 12px; font-weight: 400; grid-area: auto; line-height: 14.4px; margin: 0px; overflow: visible; text-align: left; text-align-last: auto; white-space-collapse: preserve-breaks;">PSFdocumentrequest@pacificlife.com</span>
|
| Additional Information Website |
<span style="box-sizing: border-box; color: rgb(0, 0, 0); display: inline; flex-wrap: nowrap; font-size: 12px; font-weight: 400; grid-area: auto; line-height: 14.4px; margin: 0px; overflow: visible; text-align: left; text-align-last: auto; white-space-collapse: preserve-breaks;">http://www.pacificlife.com/pacificselectfund.html</span>
|
| Expenses [Text Block] |
What were the Fund costs for the last six months?(based on a hypothetical $10,000 investment; costs paid as a percentage of a $10,000 investment is annualized) Table SummaryClass Name | Cost of a $10,000 investment | Costs paid as a percentage of a $10,000 investment |
|---|
Class P | $12 | 0.24% |
|---|
|
| Expenses Paid, Amount |
$ 12
|
| Expense Ratio, Percent |
0.24%
|
| AssetsNet |
$ 187,787,982
|
| Holdings Count | Holding |
647
|
| InvestmentCompanyPortfolioTurnover |
28.00%
|
| Additional Fund Statistics [Text Block] |
Key Fund Statistics as of June 30, 2026- Total Net Assets$187,787,982
- # of Portfolio Holdings647
- Year-to-Date Total Return1.07%
- Portfolio Turnover Rate28%
Returns provided do not reflect fees and expenses of any variable annuity contract or variable life insurance policy; if these fees and expenses were included, the returns shown would be lower. |
| Holdings [Text Block] |
Fund's Composition (% of Total Net Assets)Table SummaryValue | Value |
|---|
Other Assets & Liabilities, Net | (5.5%) | Others (each less than 3.0%) | 1.5% | Energy | 3.6% | Communications | 5.3% | Industrial | 6.0% | Securities Lending Collateral | 6.8% | Utilities | 6.9% | Technology | 8.1% | Consumer, Cyclical | 8.2% | Consumer, Non-Cyclical | 12.5% | Financial | 46.6% | |
| C000078108 |
|
| Shareholder Report [Line Items] |
|
| Fund Name |
PD Aggregate Bond Index Portfolio
|
| Class Name |
Class P
|
| No Trading Symbol [Flag] |
true
|
| Annual or Semi-Annual Statement [Text Block] |
This semi-annual shareholder report contains important information about the PD Aggregate Bond Index Portfolio (the "Fund") for the period of January 1, 2026 to June 30, 2026.
|
| Additional Information [Text Block] |
You can find additional information about the Fund at http://www.pacificlife.com/pacificselectfund.html. You can also request this information free of charge by contacting us toll-free at 800-722-4448 or sending an email request to PSFdocumentrequest@pacificlife.com.
|
| Additional Information Phone Number |
800-722-4448
|
| Additional Information Email |
<span style="box-sizing: border-box; color: rgb(0, 0, 0); display: inline; flex-wrap: nowrap; font-size: 12px; font-weight: 400; grid-area: auto; line-height: 14.4px; margin: 0px; overflow: visible; text-align: left; text-align-last: auto; white-space-collapse: preserve-breaks;">PSFdocumentrequest@pacificlife.com</span>
|
| Additional Information Website |
<span style="box-sizing: border-box; color: rgb(0, 0, 0); display: inline; flex-wrap: nowrap; font-size: 12px; font-weight: 400; grid-area: auto; line-height: 14.4px; margin: 0px; overflow: visible; text-align: left; text-align-last: auto; white-space-collapse: preserve-breaks;">http://www.pacificlife.com/pacificselectfund.html</span>
|
| Expenses [Text Block] |
What were the Fund costs for the last six months?(based on a hypothetical $10,000 investment; costs paid as a percentage of a $10,000 investment is annualized) Table SummaryClass Name | Cost of a $10,000 investment | Costs paid as a percentage of a $10,000 investment |
|---|
Class P | $10 | 0.21% |
|---|
|
| Expenses Paid, Amount |
$ 10
|
| Expense Ratio, Percent |
0.21%
|
| AssetsNet |
$ 1,099,076,398
|
| Holdings Count | Holding |
3,812
|
| InvestmentCompanyPortfolioTurnover |
22.00%
|
| Additional Fund Statistics [Text Block] |
Key Fund Statistics as of June 30, 2026- Total Net Assets$1,099,076,398
- # of Portfolio Holdings3,812
- Year-to-Date Total Return0.65%
- Portfolio Turnover Rate22%
Returns provided do not reflect fees and expenses of any variable annuity contract or variable life insurance policy; if these fees and expenses were included, the returns shown would be lower. |
| Holdings [Text Block] |
Fund's Composition (% of Total Net Assets)Table SummaryValue | Value |
|---|
Other Assets and Liabilities, Net | 0.1% | Others (each less than 3.0%) | 3.6% | Mortgage-Backed Securities | 25.0% | Corporate Bonds & Notes | 25.8% | U.S. Treasury Obligations | 45.5% | |
| C000078109 |
|
| Shareholder Report [Line Items] |
|
| Fund Name |
PD High Yield Bond Market Portfolio
|
| Class Name |
Class P
|
| No Trading Symbol [Flag] |
true
|
| Annual or Semi-Annual Statement [Text Block] |
This semi-annual shareholder report contains important information about the PD High Yield Bond Market Portfolio (the "Fund") for the period of January 1, 2026 to June 30, 2026.
|
| Additional Information [Text Block] |
You can find additional information about the Fund at http://www.pacificlife.com/pacificselectfund.html. You can also request this information free of charge by contacting us toll-free at 800-722-4448 or sending an email request to PSFdocumentrequest@pacificlife.com.
|
| Additional Information Phone Number |
800-722-4448
|
| Additional Information Email |
<span style="box-sizing: border-box; color: rgb(0, 0, 0); display: inline; flex-wrap: nowrap; font-size: 12px; font-weight: 400; grid-area: auto; line-height: 14.4px; margin: 0px; overflow: visible; text-align: left; text-align-last: auto; white-space-collapse: preserve-breaks;">PSFdocumentrequest@pacificlife.com</span>
|
| Additional Information Website |
<span style="box-sizing: border-box; color: rgb(0, 0, 0); display: inline; flex-wrap: nowrap; font-size: 12px; font-weight: 400; grid-area: auto; line-height: 14.4px; margin: 0px; overflow: visible; text-align: left; text-align-last: auto; white-space-collapse: preserve-breaks;">http://www.pacificlife.com/pacificselectfund.html</span>
|
| Expenses [Text Block] |
What were the Fund costs for the last six months?(based on a hypothetical $10,000 investment; costs paid as a percentage of a $10,000 investment is annualized) Table SummaryClass Name | Cost of a $10,000 investment | Costs paid as a percentage of a $10,000 investment |
|---|
Class P | $14 | 0.28% |
|---|
|
| Expenses Paid, Amount |
$ 14
|
| Expense Ratio, Percent |
0.28%
|
| AssetsNet |
$ 279,717,145
|
| Holdings Count | Holding |
1,696
|
| InvestmentCompanyPortfolioTurnover |
30.00%
|
| Additional Fund Statistics [Text Block] |
Key Fund Statistics as of June 30, 2026- Total Net Assets$279,717,145
- # of Portfolio Holdings1,696
- Year-to-Date Total Return1.88%
- Portfolio Turnover Rate30%
Returns provided do not reflect fees and expenses of any variable annuity contract or variable life insurance policy; if these fees and expenses were included, the returns shown would be lower. |
| Holdings [Text Block] |
Fund's Composition (% of Total Net Assets)Table SummaryValue | Value |
|---|
Other Assets & Liabilities, Net | (5.3%) | Others (each less than 3.0%) | 3.0% | Technology | 4.5% | Basic Materials | 5.5% | Securities Lending Collateral | 7.3% | Industrial | 9.8% | Energy | 11.0% | Financial | 13.1% | Consumer, Non-Cyclical | 15.2% | Communications | 17.6% | Consumer, Cyclical | 18.3% | |
| C000078103 |
|
| Shareholder Report [Line Items] |
|
| Fund Name |
PD Large-Cap Growth Index Portfolio
|
| Class Name |
Class P
|
| No Trading Symbol [Flag] |
true
|
| Annual or Semi-Annual Statement [Text Block] |
This semi-annual shareholder report contains important information about the PD Large-Cap Growth Index Portfolio (the "Fund") for the period of January 1, 2026 to June 30, 2026.
|
| Additional Information [Text Block] |
You can find additional information about the Fund at http://www.pacificlife.com/pacificselectfund.html. You can also request this information free of charge by contacting us toll-free at 800-722-4448 or sending an email request to PSFdocumentrequest@pacificlife.com.
|
| Additional Information Phone Number |
800-722-4448
|
| Additional Information Email |
<span style="box-sizing: border-box; color: rgb(0, 0, 0); display: inline; flex-wrap: nowrap; font-size: 12px; font-weight: 400; grid-area: auto; line-height: 14.4px; margin: 0px; overflow: visible; text-align: left; text-align-last: auto; white-space-collapse: preserve-breaks;">PSFdocumentrequest@pacificlife.com</span>
|
| Additional Information Website |
<span style="box-sizing: border-box; color: rgb(0, 0, 0); display: inline; flex-wrap: nowrap; font-size: 12px; font-weight: 400; grid-area: auto; line-height: 14.4px; margin: 0px; overflow: visible; text-align: left; text-align-last: auto; white-space-collapse: preserve-breaks;">http://www.pacificlife.com/pacificselectfund.html</span>
|
| Expenses [Text Block] |
What were the Fund costs for the last six months?(based on a hypothetical $10,000 investment; costs paid as a percentage of a $10,000 investment is annualized) Table SummaryClass Name | Cost of a $10,000 investment | Costs paid as a percentage of a $10,000 investment |
|---|
Class P | $9 | 0.17% |
|---|
|
| Expenses Paid, Amount |
$ 9
|
| Expense Ratio, Percent |
0.17%
|
| AssetsNet |
$ 1,087,818,244
|
| Holdings Count | Holding |
360
|
| InvestmentCompanyPortfolioTurnover |
34.00%
|
| Additional Fund Statistics [Text Block] |
Key Fund Statistics as of June 30, 2026- Total Net Assets$1,087,818,244
- # of Portfolio Holdings360
- Year-to-Date Total Return5.25%
- Portfolio Turnover Rate34%
Returns provided do not reflect fees and expenses of any variable annuity contract or variable life insurance policy; if these fees and expenses were included, the returns shown would be lower. |
| Holdings [Text Block] |
Fund's Composition (% of Total Net Assets)Table SummaryValue | Value |
|---|
Other Assets & Liabilities, Net | 0.1% | Derivatives | 0.0% | Others (each less than 3.0%) | 2.6% | Financial | 4.3% | Consumer, Non-Cyclical | 6.7% | Consumer, Cyclical | 7.8% | Industrial | 8.6% | Communications | 19.9% | Technology | 50.0% | |
| C000078105 |
|
| Shareholder Report [Line Items] |
|
| Fund Name |
PD Large-Cap Value Index Portfolio
|
| Class Name |
Class P
|
| No Trading Symbol [Flag] |
true
|
| Annual or Semi-Annual Statement [Text Block] |
This semi-annual shareholder report contains important information about the PD Large-Cap Value Index Portfolio (the "Fund") for the period of January 1, 2026 to June 30, 2026.
|
| Additional Information [Text Block] |
You can find additional information about the Fund at http://www.pacificlife.com/pacificselectfund.html. You can also request this information free of charge by contacting us toll-free at 800-722-4448 or sending an email request to PSFdocumentrequest@pacificlife.com.
|
| Additional Information Phone Number |
800-722-4448
|
| Additional Information Email |
<span style="box-sizing: border-box; color: rgb(0, 0, 0); display: inline; flex-wrap: nowrap; font-size: 12px; font-weight: 400; grid-area: auto; line-height: 14.4px; margin: 0px; overflow: visible; text-align: left; text-align-last: auto; white-space-collapse: preserve-breaks;">PSFdocumentrequest@pacificlife.com</span>
|
| Additional Information Website |
<span style="box-sizing: border-box; color: rgb(0, 0, 0); display: inline; flex-wrap: nowrap; font-size: 12px; font-weight: 400; grid-area: auto; line-height: 14.4px; margin: 0px; overflow: visible; text-align: left; text-align-last: auto; white-space-collapse: preserve-breaks;">http://www.pacificlife.com/pacificselectfund.html</span>
|
| Expenses [Text Block] |
What were the Fund costs for the last six months?(based on a hypothetical $10,000 investment; costs paid as a percentage of a $10,000 investment is annualized) Table SummaryClass Name | Cost of a $10,000 investment | Costs paid as a percentage of a $10,000 investment |
|---|
Class P | $10 | 0.18% |
|---|
|
| Expenses Paid, Amount |
$ 10
|
| Expense Ratio, Percent |
0.18%
|
| AssetsNet |
$ 984,050,875
|
| Holdings Count | Holding |
868
|
| InvestmentCompanyPortfolioTurnover |
23.00%
|
| Additional Fund Statistics [Text Block] |
Key Fund Statistics as of June 30, 2026- Total Net Assets$984,050,875
- # of Portfolio Holdings868
- Year-to-Date Total Return16.14%
- Portfolio Turnover Rate23%
Returns provided do not reflect fees and expenses of any variable annuity contract or variable life insurance policy; if these fees and expenses were included, the returns shown would be lower. |
| Holdings [Text Block] |
Fund's Composition (% of Total Net Assets)Table SummaryValue | Value |
|---|
Other Assets & Liabilities, Net | 0.1% | Derivatives | (0.0%) | Others (each less than 3.0%) | 5.3% | Utilities | 3.8% | Energy | 5.5% | Consumer, Cyclical | 7.7% | Industrial | 10.3% | Communications | 11.0% | Technology | 16.2% | Consumer, Non-Cyclical | 18.9% | Financial | 21.2% | |
| C000221970 |
|
| Shareholder Report [Line Items] |
|
| Fund Name |
PD Mid-Cap Index Portfolio
|
| Class Name |
Class P
|
| No Trading Symbol [Flag] |
true
|
| Annual or Semi-Annual Statement [Text Block] |
This semi-annual shareholder report contains important information about the PD Mid-Cap Index Portfolio (the "Fund") for the period of January 1, 2026 to June 30, 2026.
|
| Additional Information [Text Block] |
You can find additional information about the Fund at http://www.pacificlife.com/pacificselectfund.html. You can also request this information free of charge by contacting us toll-free at 800-722-4448 or sending an email request to PSFdocumentrequest@pacificlife.com.
|
| Additional Information Phone Number |
800-722-4448
|
| Additional Information Email |
<span style="box-sizing: border-box; color: rgb(0, 0, 0); display: inline; flex-wrap: nowrap; font-size: 12px; font-weight: 400; grid-area: auto; line-height: 14.4px; margin: 0px; overflow: visible; text-align: left; text-align-last: auto; white-space-collapse: preserve-breaks;">PSFdocumentrequest@pacificlife.com</span>
|
| Additional Information Website |
<span style="box-sizing: border-box; color: rgb(0, 0, 0); display: inline; flex-wrap: nowrap; font-size: 12px; font-weight: 400; grid-area: auto; line-height: 14.4px; margin: 0px; overflow: visible; text-align: left; text-align-last: auto; white-space-collapse: preserve-breaks;">http://www.pacificlife.com/pacificselectfund.html</span>
|
| Expenses [Text Block] |
What were the Fund costs for the last six months?(based on a hypothetical $10,000 investment; costs paid as a percentage of a $10,000 investment is annualized) Table SummaryClass Name | Cost of a $10,000 investment | Costs paid as a percentage of a $10,000 investment |
|---|
Class P | $11 | 0.20% |
|---|
|
| Expenses Paid, Amount |
$ 11
|
| Expense Ratio, Percent |
0.20%
|
| AssetsNet |
$ 314,483,534
|
| Holdings Count | Holding |
831
|
| InvestmentCompanyPortfolioTurnover |
25.00%
|
| Additional Fund Statistics [Text Block] |
Key Fund Statistics as of June 30, 2026- Total Net Assets$314,483,534
- # of Portfolio Holdings831
- Year-to-Date Total Return15.20%
- Portfolio Turnover Rate25%
Returns provided do not reflect fees and expenses of any variable annuity contract or variable life insurance policy; if these fees and expenses were included, the returns shown would be lower. |
| Holdings [Text Block] |
Fund's Composition (% of Total Net Assets)Table SummaryValue | Value |
|---|
Other Assets & Liabilities, Net | (0.8%) | Derivatives | 0.0% | Others (each less than 3.0%) | 2.3% | Basic Materials | 3.6% | Communications | 4.4% | Utilities | 5.9% | Energy | 6.0% | Consumer, Cyclical | 11.8% | Technology | 13.8% | Industrial | 17.5% | Consumer, Non-Cyclical | 17.7% | Financial | 17.8% | |
| C000078107 |
|
| Shareholder Report [Line Items] |
|
| Fund Name |
PD Small-Cap Growth Index Portfolio
|
| Class Name |
Class P
|
| No Trading Symbol [Flag] |
true
|
| Annual or Semi-Annual Statement [Text Block] |
This semi-annual shareholder report contains important information about the PD Small-Cap Growth Index Portfolio (the "Fund") for the period of January 1, 2026 to June 30, 2026.
|
| Additional Information [Text Block] |
You can find additional information about the Fund at http://www.pacificlife.com/pacificselectfund.html. You can also request this information free of charge by contacting us toll-free at 800-722-4448 or sending an email request to PSFdocumentrequest@pacificlife.com.
|
| Additional Information Phone Number |
800-722-4448
|
| Additional Information Email |
<span style="box-sizing: border-box; color: rgb(0, 0, 0); display: inline; flex-wrap: nowrap; font-size: 12px; font-weight: 400; grid-area: auto; line-height: 14.4px; margin: 0px; overflow: visible; text-align: left; text-align-last: auto; white-space-collapse: preserve-breaks;">PSFdocumentrequest@pacificlife.com</span>
|
| Additional Information Website |
<span style="box-sizing: border-box; color: rgb(0, 0, 0); display: inline; flex-wrap: nowrap; font-size: 12px; font-weight: 400; grid-area: auto; line-height: 14.4px; margin: 0px; overflow: visible; text-align: left; text-align-last: auto; white-space-collapse: preserve-breaks;">http://www.pacificlife.com/pacificselectfund.html</span>
|
| Expenses [Text Block] |
What were the Fund costs for the last six months?(based on a hypothetical $10,000 investment; costs paid as a percentage of a $10,000 investment is annualized) Table SummaryClass Name | Cost of a $10,000 investment | Costs paid as a percentage of a $10,000 investment |
|---|
Class P | $12 | 0.22% |
|---|
|
| Expenses Paid, Amount |
$ 12
|
| Expense Ratio, Percent |
0.22%
|
| AssetsNet |
$ 151,276,749
|
| Holdings Count | Holding |
1,092
|
| InvestmentCompanyPortfolioTurnover |
73.00%
|
| Additional Fund Statistics [Text Block] |
Key Fund Statistics as of June 30, 2026- Total Net Assets$151,276,749
- # of Portfolio Holdings1,092
- Year-to-Date Total Return22.14%
- Portfolio Turnover Rate73%
Returns provided do not reflect fees and expenses of any variable annuity contract or variable life insurance policy; if these fees and expenses were included, the returns shown would be lower. |
| Holdings [Text Block] |
Fund's Composition (% of Total Net Assets)Table SummaryValue | Value |
|---|
Other Assets & Liabilities, Net | (5.3%) | Derivatives | 0.0% | Others (each less than 3.0%) | 1.6% | Communications | 3.8% | Basic Materials | 4.4% | Energy | 4.8% | Securities Lending Collateral | 6.1% | Consumer, Cyclical | 9.3% | Financial | 10.7% | Technology | 14.4% | Industrial | 17.8% | Consumer, Non-Cyclical | 32.4% | |
| C000078106 |
|
| Shareholder Report [Line Items] |
|
| Fund Name |
PD Small-Cap Value Index Portfolio
|
| Class Name |
Class P
|
| No Trading Symbol [Flag] |
true
|
| Annual or Semi-Annual Statement [Text Block] |
This semi-annual shareholder report contains important information about the PD Small-Cap Value Index Portfolio (the "Fund") for the period of January 1, 2026 to June 30, 2026.
|
| Additional Information [Text Block] |
You can find additional information about the Fund at http://www.pacificlife.com/pacificselectfund.html. You can also request this information free of charge by contacting us toll-free at 800-722-4448 or sending an email request to PSFdocumentrequest@pacificlife.com.
|
| Additional Information Phone Number |
800-722-4448
|
| Additional Information Email |
<span style="box-sizing: border-box; color: rgb(0, 0, 0); display: inline; flex-wrap: nowrap; font-size: 12px; font-weight: 400; grid-area: auto; line-height: 14.4px; margin: 0px; overflow: visible; text-align: left; text-align-last: auto; white-space-collapse: preserve-breaks;">PSFdocumentrequest@pacificlife.com</span>
|
| Additional Information Website |
<span style="box-sizing: border-box; color: rgb(0, 0, 0); display: inline; flex-wrap: nowrap; font-size: 12px; font-weight: 400; grid-area: auto; line-height: 14.4px; margin: 0px; overflow: visible; text-align: left; text-align-last: auto; white-space-collapse: preserve-breaks;">http://www.pacificlife.com/pacificselectfund.html</span>
|
| Expenses [Text Block] |
What were the Fund costs for the last six months?(based on a hypothetical $10,000 investment; costs paid as a percentage of a $10,000 investment is annualized) Table SummaryClass Name | Cost of a $10,000 investment | Costs paid as a percentage of a $10,000 investment |
|---|
Class P | $13 | 0.24% |
|---|
|
| Expenses Paid, Amount |
$ 13
|
| Expense Ratio, Percent |
0.24%
|
| AssetsNet |
$ 141,158,495
|
| Holdings Count | Holding |
1,382
|
| InvestmentCompanyPortfolioTurnover |
39.00%
|
| Additional Fund Statistics [Text Block] |
Key Fund Statistics as of June 30, 2026- Total Net Assets$141,158,495
- # of Portfolio Holdings1,382
- Year-to-Date Total Return22.98%
- Portfolio Turnover Rate39%
Returns provided do not reflect fees and expenses of any variable annuity contract or variable life insurance policy; if these fees and expenses were included, the returns shown would be lower. |
| Holdings [Text Block] |
Fund's Composition (% of Total Net Assets)Table SummaryValue | Value |
|---|
Other Assets & Liabilities, Net | (0.8%) | Derivatives | 0.0% | Others (each less than 3.0%) | 2.4% | Basic Materials | 3.3% | Communications | 3.9% | Technology | 4.3% | Utilities | 5.2% | Energy | 6.1% | Industrial | 9.7% | Consumer, Cyclical | 11.6% | Consumer, Non-Cyclical | 15.8% | Financial | 38.5% | |
| C000078111 |
|
| Shareholder Report [Line Items] |
|
| Fund Name |
PD Emerging Markets Index Portfolio
|
| Class Name |
Class P
|
| No Trading Symbol [Flag] |
true
|
| Annual or Semi-Annual Statement [Text Block] |
This semi-annual shareholder report contains important information about the PD Emerging Markets Index Portfolio (the "Fund") for the period of January 1, 2026 to June 30, 2026.
|
| Additional Information [Text Block] |
You can find additional information about the Fund at http://www.pacificlife.com/pacificselectfund.html. You can also request this information free of charge by contacting us toll-free at 800-722-4448 or sending an email request to PSFdocumentrequest@pacificlife.com.
|
| Additional Information Phone Number |
800-722-4448
|
| Additional Information Email |
<span style="box-sizing: border-box; color: rgb(0, 0, 0); display: inline; flex-wrap: nowrap; font-size: 12px; font-weight: 400; grid-area: auto; line-height: 18px; margin: 0px; overflow: visible; text-align: left; text-align-last: auto; white-space-collapse: preserve-breaks;">PSFdocumentrequest@pacificlife.com</span>
|
| Additional Information Website |
<span style="box-sizing: border-box; color: rgb(0, 0, 0); display: inline; flex-wrap: nowrap; font-size: 12px; font-weight: 400; grid-area: auto; line-height: 18px; margin: 0px; overflow: visible; text-align: left; text-align-last: auto; white-space-collapse: preserve-breaks;">http://www.pacificlife.com/pacificselectfund.html</span>
|
| Expenses [Text Block] |
What were the Fund costs for the last six months?(based on a hypothetical $10,000 investment; costs paid as a percentage of a $10,000 investment is annualized) Table SummaryClass Name | Cost of a $10,000 investment | Costs paid as a percentage of a $10,000 investment |
|---|
Class P | $21 | 0.38% |
|---|
|
| Expenses Paid, Amount |
$ 21
|
| Expense Ratio, Percent |
0.38%
|
| AssetsNet |
$ 172,240,302
|
| Holdings Count | Holding |
1,225
|
| InvestmentCompanyPortfolioTurnover |
16.00%
|
| Additional Fund Statistics [Text Block] |
Key Fund Statistics as of June 30, 2026- Total Net Assets$172,240,302
- # of Portfolio Holdings1,225
- Year-to-Date Total Return25.70%
- Portfolio Turnover Rate16%
Returns provided do not reflect fees and expenses of any variable annuity contract or variable life insurance policy; if these fees and expenses were included, the returns shown would be lower. |
| Holdings [Text Block] |
Fund's Composition (% of Total Net Assets)Table SummaryValue | Value |
|---|
Other Assets and Liabilities, Net | 0.6% | Derivatives | (0.0%) | Others (each less than 3.0%) | 2.4% | Energy | 3.4% | Basic Materials | 4.9% | Consumer, Non-Cyclical | 5.1% | Consumer, Cyclical | 5.2% | Communications | 9.8% | Industrial | 9.8% | Financial | 19.7% | Technology | 39.1% | Top 5 Countries of Risk (% of Total Net Assets)Table SummaryValue | Value |
|---|
Brazil | 3.7% | India | 10.8% | China | 18.4% | South Korea | 23.7% | Taiwan | 27.3% | |
| C000078110 |
|
| Shareholder Report [Line Items] |
|
| Fund Name |
PD International Large-Cap Index Portfolio
|
| Class Name |
Class P
|
| No Trading Symbol [Flag] |
true
|
| Annual or Semi-Annual Statement [Text Block] |
This semi-annual shareholder report contains important information about the PD International Large-Cap Index Portfolio (the "Fund") for the period of January 1, 2026 to June 30, 2026.
|
| Additional Information [Text Block] |
You can find additional information about the Fund at http://www.pacificlife.com/pacificselectfund.html. You can also request this information free of charge by contacting us toll-free at 800-722-4448 or sending an email request to PSFdocumentrequest@pacificlife.com.
|
| Additional Information Phone Number |
800-722-4448
|
| Additional Information Email |
<span style="box-sizing: border-box; color: rgb(0, 0, 0); display: inline; flex-wrap: nowrap; font-size: 12px; font-weight: 400; grid-area: auto; line-height: 18px; margin: 0px; overflow: visible; text-align: left; text-align-last: auto; white-space-collapse: preserve-breaks;">PSFdocumentrequest@pacificlife.com</span>
|
| Additional Information Website |
<span style="box-sizing: border-box; color: rgb(0, 0, 0); display: inline; flex-wrap: nowrap; font-size: 12px; font-weight: 400; grid-area: auto; line-height: 18px; margin: 0px; overflow: visible; text-align: left; text-align-last: auto; white-space-collapse: preserve-breaks;">http://www.pacificlife.com/pacificselectfund.html</span>
|
| Expenses [Text Block] |
What were the Fund costs for the last six months?(based on a hypothetical $10,000 investment; costs paid as a percentage of a $10,000 investment is annualized) Table SummaryClass Name | Cost of a $10,000 investment | Costs paid as a percentage of a $10,000 investment |
|---|
Class P | $12 | 0.23% |
|---|
|
| Expenses Paid, Amount |
$ 12
|
| Expense Ratio, Percent |
0.23%
|
| AssetsNet |
$ 699,501,203
|
| Holdings Count | Holding |
318
|
| InvestmentCompanyPortfolioTurnover |
5.00%
|
| Additional Fund Statistics [Text Block] |
Key Fund Statistics as of June 30, 2026- Total Net Assets$699,501,203
- # of Portfolio Holdings318
- Year-to-Date Total Return10.26%
- Portfolio Turnover Rate5%
Returns provided do not reflect fees and expenses of any variable annuity contract or variable life insurance policy; if these fees and expenses were included, the returns shown would be lower. |
| Holdings [Text Block] |
Fund's Composition (% of Total Net Assets)Table SummaryValue | Value |
|---|
Other Assets and Liabilities, Net | 1.2% | Derivatives | (0.0%) | Others (each less than 3.0%) | 0.2% | Utilities | 3.1% | Communications | 4.4% | Energy | 4.8% | Basic Materials | 5.9% | Consumer, Cyclical | 9.7% | Technology | 10.0% | Industrial | 14.7% | Consumer, Non-Cyclical | 16.7% | Financial | 29.3% | Top 5 Countries of Risk (% of Total Net Assets)Table SummaryValue | Value |
|---|
France | 7.9% | Germany | 8.6% | United Kingdom | 10.1% | Canada | 12.0% | Japan | 19.4% | |