v3.26.1
Shareholder Report
6 Months Ended
Jun. 30, 2026
USD ($)
Holdings
Shareholder Report [Line Items]  
Document Type N-CSRS
Amendment Flag false
Registrant Name Manning & Napier Fund, Inc.
Entity Central Index Key 0000751173
Entity Investment Company Type N-1A
Document Period End Date Jun. 30, 2026
Shareholder Report Annual or Semi-Annual Semi-annual shareholder report
Core Bond Series (Class I)  
Shareholder Report [Line Items]  
Fund Name Core Bond Series
Class Name Class I
Trading Symbol EXCIX
Annual or Semi-Annual Statement [Text Block] This semi-annual shareholder report contains important information about Class I of Core Bond Series, a series of Manning & Napier Fund Inc., for the period of January 1, 2026 to June 30, 2026.
Shareholder Report Annual or Semi-Annual semi-annual shareholder report
Additional Information [Text Block] You can find additional information about the Fund at www.manning-napier.com/products/mutual-funds. You can also request this information by contacting us at (800) 466‑3863. Shareholders who own the Fund through a third-party advisor or intermediary platform should contact their financial advisor directly for additional information.
Additional Information Phone Number (800) 466‑3863
Additional Information Website www.manning-napier.com/products/mutual-funds
Expenses [Text Block]

What were the Fund costs for the period?

(based on a hypothetical $10,000 investment)

Class Name
Costs of a $10,000 investment
Costs paid as a percentage of a $10,000 investment
Class I
$22
0.45%

Expenses are equal to Class I shares' annualized expense ratio (for the six-month period) multiplied by the average account value over the period. The Class' expenses would have been higher had certain expenses not been waived or reimbursed during the period.

Expenses Paid, Amount $ 22
Expense Ratio, Percent 0.45%
Net Assets $ 655,158,962
Holdings Count | Holdings 198
Investment Company, Portfolio Turnover 30.00%
Additional Fund Statistics [Text Block]

Key Fund Statistics (as of June 30, 2026)

Net Assets
$655,158,962
Number of Holdings
198
Portfolio Turnover (for the period ended 06/30/26)
30%


Holdings [Text Block]

Sector Allocation (% of net assets)

(as of June 30, 2026)
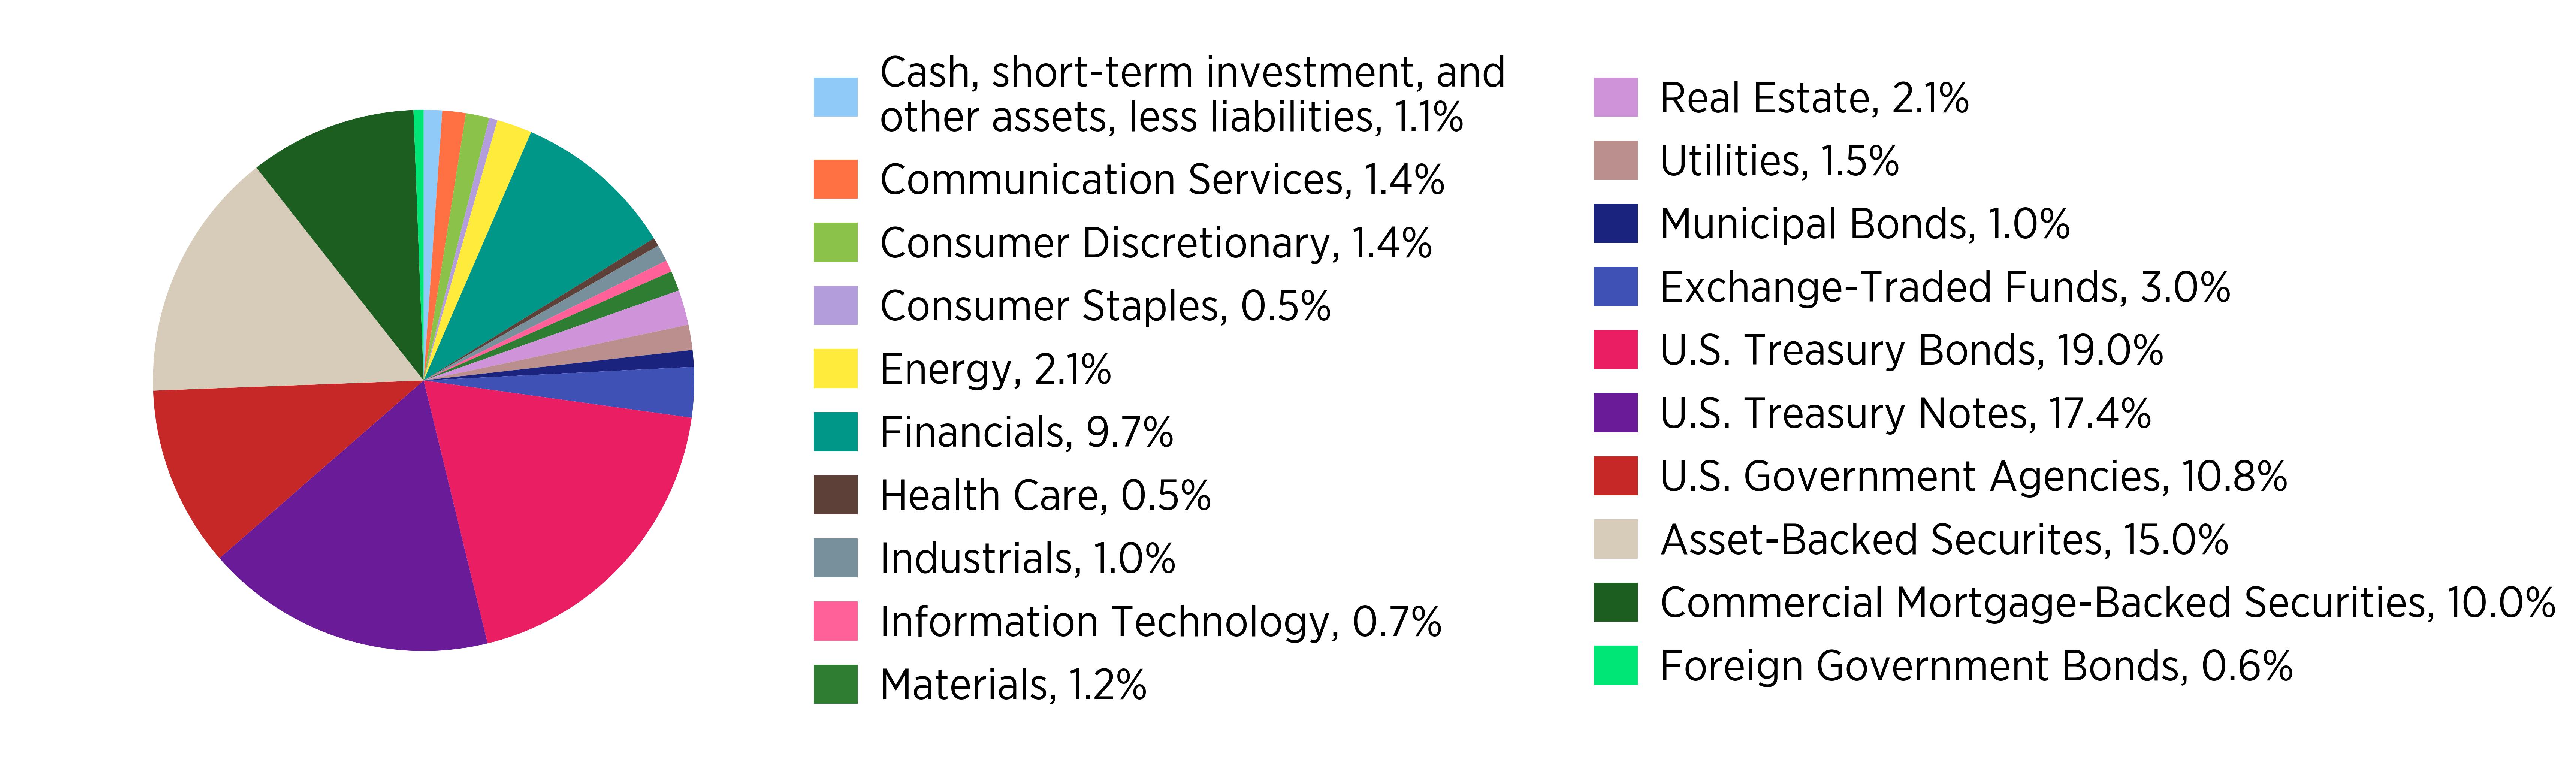
 

Sector
Allocation
Cash, short-term investment, and other assets, less liabilities
0.011
Communication Services
0.014
Consumer Discretionary
0.014
Consumer Staples
0.005
Energy
0.021
Financials
0.097
Health Care
0.005
Industrials
0.01
Information Technology
0.007
Materials
0.012
Real Estate
0.021
Utilities
0.015
Municipal Bonds
0.01
Exchange-Traded Funds
0.03
U.S. Treasury Bonds
0.19
U.S. Treasury Notes
0.174
U.S. Government Agencies
0.108
Asset-Backed Securites
0.15
Commercial Mortgage-Backed Securities
0.10
Foreign Government Bonds
0.006
pie


The Global Industry Classification Standard (GICS) was developed by and is exclusive property and a service mark of MSCI Inc. (MSCI) and Standard & Poor's a division of S&P Global Inc. (S&P), and is licensed for use by Manning & Napier when referencing GICS sectors. Neither MSCI, S&P, nor any third party involved in making or compiling the GICS or any GICS classifications makes any express or implied warranties or representations with respect to such standard or classification, nor shall any such party have any liability therefrom.
Core Bond Series (Class S)  
Shareholder Report [Line Items]  
Fund Name Core Bond Series
Class Name Class S
Trading Symbol EXCRX
Annual or Semi-Annual Statement [Text Block] This semi-annual shareholder report contains important information about Class S of Core Bond Series, a series of Manning & Napier Fund Inc., for the period of January 1, 2026 to June 30, 2026.
Shareholder Report Annual or Semi-Annual semi-annual shareholder report
Additional Information [Text Block] You can find additional information about the Fund at www.manning-napier.com/products/mutual-funds. You can also request this information by contacting us at (800) 466‑3863. Shareholders who own the Fund through a third-party advisor or intermediary platform should contact their financial advisor directly for additional information.
Additional Information Phone Number (800) 466‑3863
Additional Information Website www.manning-napier.com/products/mutual-funds
Expenses [Text Block]

What were the Fund costs for the period?

(based on a hypothetical $10,000 investment)

Class Name
Costs of a $10,000 investment
Costs paid as a percentage of a $10,000 investment
Class S
$33
0.67%

Expenses are equal to Class S shares' annualized expense ratio (for the six-month period) multiplied by the average account value over the period. The Class' expenses would have been higher had certain expenses not been waived or reimbursed during the period.

Expenses Paid, Amount $ 33
Expense Ratio, Percent 0.67%
Net Assets $ 655,158,962
Holdings Count | Holdings 198
Investment Company, Portfolio Turnover 30.00%
Additional Fund Statistics [Text Block]

Key Fund Statistics (as of June 30, 2026)

Net Assets
$655,158,962
Number of Holdings
198
Portfolio Turnover (for the period ended 06/30/26)
30%


Holdings [Text Block]

Sector Allocation (% of net assets)

(as of June 30, 2026)
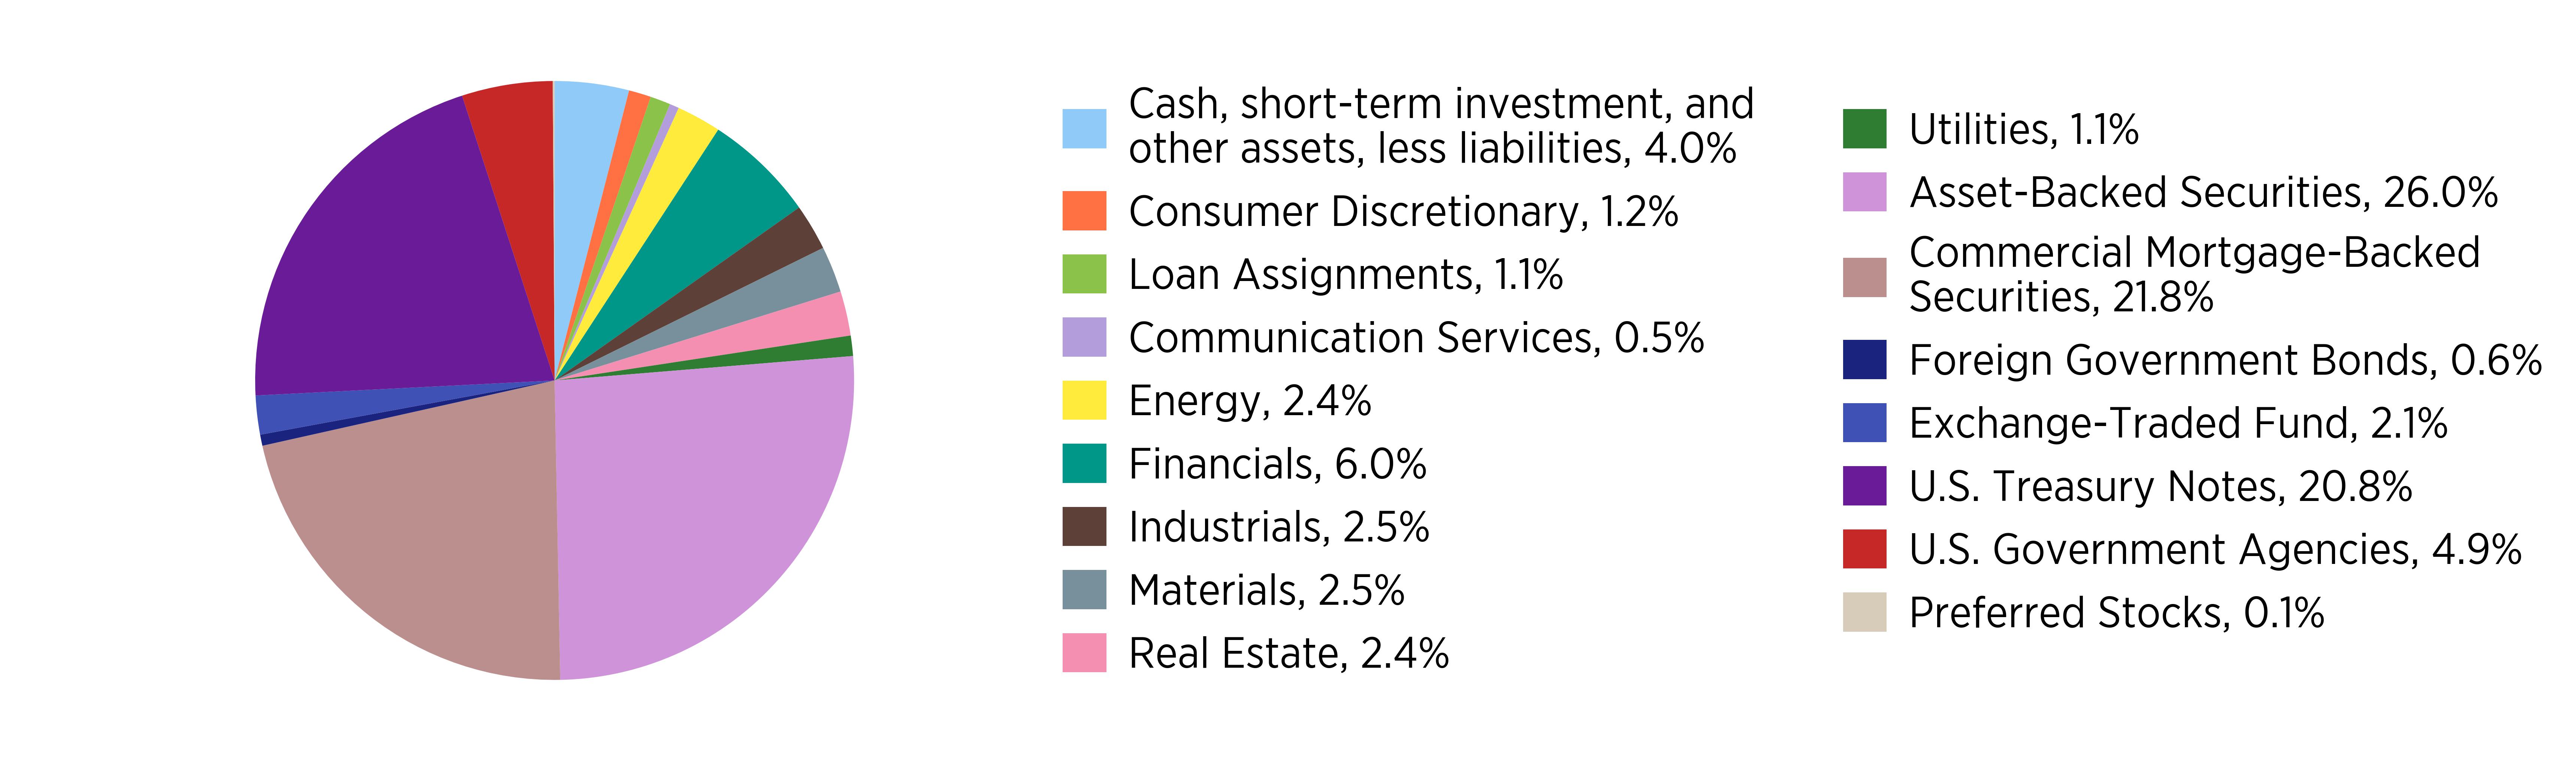
 

Sector
Allocation
Cash, short-term investment, and other assets, less liabilities
0.011
Communication Services
0.014
Consumer Discretionary
0.014
Consumer Staples
0.005
Energy
0.021
Financials
0.097
Health Care
0.005
Industrials
0.01
Information Technology
0.007
Materials
0.012
Real Estate
0.021
Utilities
0.015
Municipal Bonds
0.01
Exchange-Traded Funds
0.03
U.S. Treasury Bonds
0.19
U.S. Treasury Notes
0.174
U.S. Government Agencies
0.108
Asset-Backed Securites
0.15
Commercial Mortgage-Backed Securities
0.10
Foreign Government Bonds
0.006
pie


The Global Industry Classification Standard (GICS) was developed by and is exclusive property and a service mark of MSCI Inc. (MSCI) and Standard & Poor's a division of S&P Global Inc. (S&P), and is licensed for use by Manning & Napier when referencing GICS sectors. Neither MSCI, S&P, nor any third party involved in making or compiling the GICS or any GICS classifications makes any express or implied warranties or representations with respect to such standard or classification, nor shall any such party have any liability therefrom.
Core Bond Series (Class W)  
Shareholder Report [Line Items]  
Fund Name Core Bond Series
Class Name Class W
Trading Symbol MCBWX
Annual or Semi-Annual Statement [Text Block] This semi-annual shareholder report contains important information about Class W of Core Bond Series, a series of Manning & Napier Fund Inc., for the period of January 1, 2026 to June 30, 2026.
Shareholder Report Annual or Semi-Annual semi-annual shareholder report
Additional Information [Text Block] You can find additional information about the Fund at www.manning-napier.com/products/mutual-funds. You can also request this information by contacting us at (800) 466‑3863. Shareholders who own the Fund through a third-party advisor or intermediary platform should contact their financial advisor directly for additional information.
Additional Information Phone Number (800) 466‑3863
Additional Information Website www.manning-napier.com/products/mutual-funds
Expenses [Text Block]

What were the Fund costs for the period?

(based on a hypothetical $10,000 investment)

Class Name
Costs of a $10,000 investment
Costs paid as a percentage of a $10,000 investment
Class W
$2
0.05%

Expenses are equal to Class W shares' annualized expense ratio (for the six-month period) multiplied by the average account value over the period. The Class' expenses would have been higher had certain expenses not been waived or reimbursed during the period.

Expenses Paid, Amount $ 2
Expense Ratio, Percent 0.05%
Net Assets $ 655,158,962
Holdings Count | Holdings 198
Investment Company, Portfolio Turnover 30.00%
Additional Fund Statistics [Text Block]

Key Fund Statistics (as of June 30, 2026)

Net Assets
$655,158,962
Number of Holdings
198
Portfolio Turnover (for the period ended 06/30/26)
30%


Holdings [Text Block]

Sector Allocation (% of net assets)

(as of June 30, 2026)
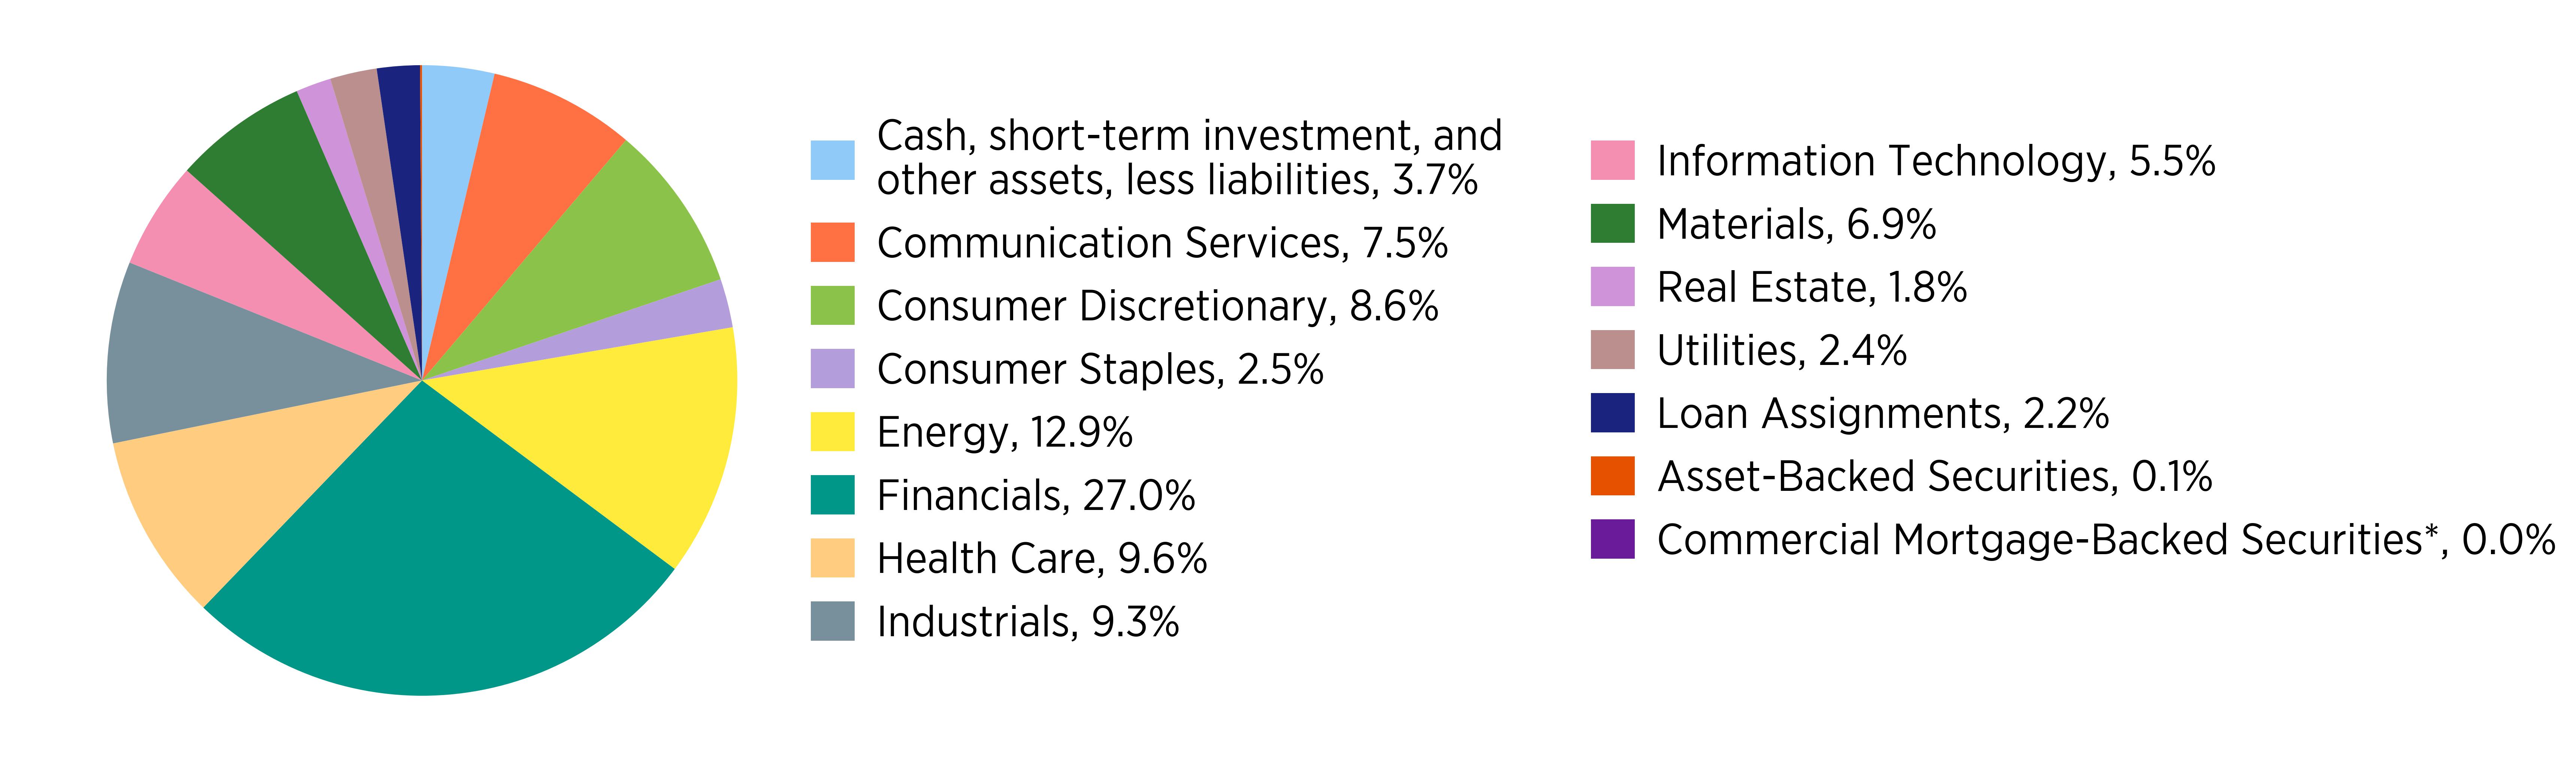
 

Sector
Allocation
Cash, short-term investment, and other assets, less liabilities
0.011
Communication Services
0.014
Consumer Discretionary
0.014
Consumer Staples
0.005
Energy
0.021
Financials
0.097
Health Care
0.005
Industrials
0.01
Information Technology
0.007
Materials
0.012
Real Estate
0.021
Utilities
0.015
Municipal Bonds
0.01
Exchange-Traded Funds
0.03
U.S. Treasury Bonds
0.19
U.S. Treasury Notes
0.174
U.S. Government Agencies
0.108
Asset-Backed Securites
0.15
Commercial Mortgage-Backed Securities
0.10
Foreign Government Bonds
0.006
pie


The Global Industry Classification Standard (GICS) was developed by and is exclusive property and a service mark of MSCI Inc. (MSCI) and Standard & Poor's a division of S&P Global Inc. (S&P), and is licensed for use by Manning & Napier when referencing GICS sectors. Neither MSCI, S&P, nor any third party involved in making or compiling the GICS or any GICS classifications makes any express or implied warranties or representations with respect to such standard or classification, nor shall any such party have any liability therefrom.
Core Bond Series (Class Z)  
Shareholder Report [Line Items]  
Fund Name Core Bond Series
Class Name Class Z
Trading Symbol MCBZX
Annual or Semi-Annual Statement [Text Block] This semi-annual shareholder report contains important information about Class Z of Core Bond Series, a series of Manning & Napier Fund Inc., for the period of January 1, 2026 to June 30, 2026.
Shareholder Report Annual or Semi-Annual semi-annual shareholder report
Additional Information [Text Block] You can find additional information about the Fund at www.manning-napier.com/products/mutual-funds. You can also request this information by contacting us at (800) 466‑3863. Shareholders who own the Fund through a third-party advisor or intermediary platform should contact their financial advisor directly for additional information.
Additional Information Phone Number (800) 466‑3863
Additional Information Website www.manning-napier.com/products/mutual-funds
Expenses [Text Block]

What were the Fund costs for the period?

(based on a hypothetical $10,000 investment)

Class Name
Costs of a $10,000 investment
Costs paid as a percentage of a $10,000 investment
Class Z
$15
0.30%

Expenses are equal to Class Z shares' annualized expense ratio (for the six-month period) multiplied by the average account value over the period. The Class' expenses would have been higher had certain expenses not been waived or reimbursed during the period.

Expenses Paid, Amount $ 15
Expense Ratio, Percent 0.30%
Net Assets $ 655,158,962
Holdings Count | Holdings 198
Investment Company, Portfolio Turnover 30.00%
Additional Fund Statistics [Text Block]

Key Fund Statistics (as of June 30, 2026)

Net Assets
$655,158,962
Number of Holdings
198
Portfolio Turnover (for the period ended 06/30/26)
30%


Holdings [Text Block]

Sector Allocation (% of net assets)

(as of June 30, 2026)


Sector
Allocation
Cash, short-term investment, and other assets, less liabilities
0.011
Communication Services
0.014
Consumer Discretionary
0.014
Consumer Staples
0.005
Energy
0.021
Financials
0.097
Health Care
0.005
Industrials
0.01
Information Technology
0.007
Materials
0.012
Real Estate
0.021
Utilities
0.015
Municipal Bonds
0.01
Exchange-Traded Funds
0.03
U.S. Treasury Bonds
0.19
U.S. Treasury Notes
0.174
U.S. Government Agencies
0.108
Asset-Backed Securites
0.15
Commercial Mortgage-Backed Securities
0.10
Foreign Government Bonds
0.006
pie


The Global Industry Classification Standard (GICS) was developed by and is exclusive property and a service mark of MSCI Inc. (MSCI) and Standard & Poor's a division of S&P Global Inc. (S&P), and is licensed for use by Manning & Napier when referencing GICS sectors. Neither MSCI, S&P, nor any third party involved in making or compiling the GICS or any GICS classifications makes any express or implied warranties or representations with respect to such standard or classification, nor shall any such party have any liability therefrom.
Unconstrained Bond Series (Class I)  
Shareholder Report [Line Items]  
Fund Name Unconstrained Bond Series
Class Name Class I
Trading Symbol MNCPX
Annual or Semi-Annual Statement [Text Block] This semi-annual shareholder report contains important information about Class I of Unconstrained Bond Series, a series of Manning & Napier Fund Inc., for the period of January 1, 2026 to June 30, 2026.
Shareholder Report Annual or Semi-Annual semi-annual shareholder report
Additional Information [Text Block] You can find additional information about the Fund at www.manning-napier.com/products/mutual-funds. You can also request this information by contacting us at (800) 466‑3863. Shareholders who own the Fund through a third-party advisor or intermediary platform should contact their financial advisor directly for additional information.
Additional Information Phone Number (800) 466‑3863
Additional Information Website www.manning-napier.com/products/mutual-funds
Expenses [Text Block]

What were the Fund costs for the period?

(based on a hypothetical $10,000 investment)

Class Name
Costs of a $10,000 investment
Costs paid as a percentage of a $10,000 investment
Class I
$24
0.49%

Expenses are equal to Class I shares' annualized expense ratio (for the six-month period) multiplied by the average account value over the period. The Class' expenses would have been higher had certain expenses not been waived or reimbursed during the period.

Expenses Paid, Amount $ 24
Expense Ratio, Percent 0.49%
Net Assets $ 768,199,733
Holdings Count | Holdings 213
Investment Company, Portfolio Turnover 22.00%
Additional Fund Statistics [Text Block]

Key Fund Statistics (as of June 30, 2026)

Net Assets
$768,199,733
Number of Holdings
213
Portfolio Turnover (for the period ended 06/30/26)
22%


Holdings [Text Block]

Sector Allocation (% of net assets)

(as of June 30, 2026)


Sector
Allocation
Cash, short-term investment, and other assets, less liabilities
0.04
Consumer Discretionary
0.012
Loan Assignments
0.011
Communication Services
0.005
Energy
0.024
Financials
0.060
Industrials
0.025
Materials
0.025
Real Estate
0.024
Utilities
0.011
Asset-Backed Securities
0.260
Commercial Mortgage-Backed Securities
0.218
Foreign Government Bonds
0.006
Exchange-Traded Fund
0.021
U.S. Treasury Notes
0.208
U.S. Government Agencies
0.049
Preferred Stocks
0.001
pie


The Global Industry Classification Standard (GICS) was developed by and is exclusive property and a service mark of MSCI Inc. (MSCI) and Standard & Poor's a division of S&P Global Inc. (S&P), and is licensed for use by Manning & Napier when referencing GICS sectors. Neither MSCI, S&P, nor any third party involved in making or compiling the GICS or any GICS classifications makes any express or implied warranties or representations with respect to such standard or classification, nor shall any such party have any liability therefrom.

Unconstrained Bond Series (Class S)  
Shareholder Report [Line Items]  
Fund Name Unconstrained Bond Series
Class Name Class S
Trading Symbol EXCPX
Annual or Semi-Annual Statement [Text Block] This semi-annual shareholder report contains important information about Class S of Unconstrained Bond Series, a series of Manning & Napier Fund Inc., for the period of January 1, 2026 to June 30, 2026.
Shareholder Report Annual or Semi-Annual semi-annual shareholder report
Additional Information [Text Block] You can find additional information about the Fund at www.manning-napier.com/products/mutual-funds. You can also request this information by contacting us at (800) 466‑3863. Shareholders who own the Fund through a third-party advisor or intermediary platform should contact their financial advisor directly for additional information.
Additional Information Phone Number (800) 466‑3863
Additional Information Website www.manning-napier.com/products/mutual-funds
Expenses [Text Block]

What were the Fund costs for the period?

(based on a hypothetical $10,000 investment)

Class Name
Costs of a $10,000 investment
Costs paid as a percentage of a $10,000 investment
Class S
$37
0.75%

Expenses are equal to Class S shares' annualized expense ratio (for the six-month period) multiplied by the average account value over the period. The Class' expenses would have been higher had certain expenses not been waived or reimbursed during the period.

Expenses Paid, Amount $ 37
Expense Ratio, Percent 0.75%
Net Assets $ 768,199,733
Holdings Count | Holdings 213
Investment Company, Portfolio Turnover 22.00%
Additional Fund Statistics [Text Block]

Key Fund Statistics (as of June 30, 2026)

Net Assets
$768,199,733
Number of Holdings
213
Portfolio Turnover (for the period ended 06/30/26)
22%


Holdings [Text Block]

Sector Allocation (% of net assets)

(as of June 30, 2026)


Sector
Allocation
Cash, short-term investment, and other assets, less liabilities
0.04
Consumer Discretionary
0.012
Loan Assignments
0.011
Communication Services
0.005
Energy
0.024
Financials
0.060
Industrials
0.025
Materials
0.025
Real Estate
0.024
Utilities
0.011
Asset-Backed Securities
0.260
Commercial Mortgage-Backed Securities
0.218
Foreign Government Bonds
0.006
Exchange-Traded Fund
0.021
U.S. Treasury Notes
0.208
U.S. Government Agencies
0.049
Preferred Stocks
0.001
pie


The Global Industry Classification Standard (GICS) was developed by and is exclusive property and a service mark of MSCI Inc. (MSCI) and Standard & Poor's a division of S&P Global Inc. (S&P), and is licensed for use by Manning & Napier when referencing GICS sectors. Neither MSCI, S&P, nor any third party involved in making or compiling the GICS or any GICS classifications makes any express or implied warranties or representations with respect to such standard or classification, nor shall any such party have any liability therefrom.

Unconstrained Bond Series (Class W)  
Shareholder Report [Line Items]  
Fund Name Unconstrained Bond Series
Class Name Class W
Trading Symbol MUBWX
Annual or Semi-Annual Statement [Text Block] This semi-annual shareholder report contains important information about Class W of Unconstrained Bond Series, a series of Manning & Napier Fund Inc., for the period of January 1, 2026 to June 30, 2026.
Shareholder Report Annual or Semi-Annual semi-annual shareholder report
Additional Information [Text Block] You can find additional information about the Fund at www.manning-napier.com/products/mutual-funds. You can also request this information by contacting us at (800) 466‑3863. Shareholders who own the Fund through a third-party advisor or intermediary platform should contact their financial advisor directly for additional information.
Additional Information Phone Number (800) 466‑3863
Additional Information Website www.manning-napier.com/products/mutual-funds
Expenses [Text Block]

What were the Fund costs for the period?

(based on a hypothetical $10,000 investment)

Class Name
Costs of a $10,000 investment
Costs paid as a percentage of a $10,000 investment
Class W
$2
0.05%

Expenses are equal to Class W shares' annualized expense ratio (for the six-month period) multiplied by the average account value over the period. The Class' expenses would have been higher had certain expenses not been waived or reimbursed during the period.

Expenses Paid, Amount $ 2
Expense Ratio, Percent 0.05%
Net Assets $ 768,199,733
Holdings Count | Holdings 213
Investment Company, Portfolio Turnover 22.00%
Additional Fund Statistics [Text Block]

Key Fund Statistics (as of June 30, 2026)

Net Assets
$768,199,733
Number of Holdings
213
Portfolio Turnover (for the period ended 06/30/26)
22%


Holdings [Text Block]

Sector Allocation (% of net assets)

(as of June 30, 2026)


Sector
Allocation
Cash, short-term investment, and other assets, less liabilities
0.04
Consumer Discretionary
0.012
Loan Assignments
0.011
Communication Services
0.005
Energy
0.024
Financials
0.060
Industrials
0.025
Materials
0.025
Real Estate
0.024
Utilities
0.011
Asset-Backed Securities
0.260
Commercial Mortgage-Backed Securities
0.218
Foreign Government Bonds
0.006
Exchange-Traded Fund
0.021
U.S. Treasury Notes
0.208
U.S. Government Agencies
0.049
Preferred Stocks
0.001
pie


The Global Industry Classification Standard (GICS) was developed by and is exclusive property and a service mark of MSCI Inc. (MSCI) and Standard & Poor's a division of S&P Global Inc. (S&P), and is licensed for use by Manning & Napier when referencing GICS sectors. Neither MSCI, S&P, nor any third party involved in making or compiling the GICS or any GICS classifications makes any express or implied warranties or representations with respect to such standard or classification, nor shall any such party have any liability therefrom.

High Yield Bond Series (Class I)  
Shareholder Report [Line Items]  
Fund Name High Yield Bond Series
Class Name Class I
Trading Symbol MNHAX
Annual or Semi-Annual Statement [Text Block] This semi-annual shareholder report contains important information about Class I of High Yield Bond Series, a series of Manning & Napier Fund Inc., for the period of January 1, 2026 to June 30, 2026.
Shareholder Report Annual or Semi-Annual semi-annual shareholder report
Additional Information [Text Block] You can find additional information about the Fund at www.manning-napier.com/products/mutual-funds. You can also request this information by contacting us at (800) 466‑3863. Shareholders who own the Fund through a third-party advisor or intermediary platform should contact their financial advisor directly for additional information.
Additional Information Phone Number (800) 466‑3863
Additional Information Website www.manning-napier.com/products/mutual-funds
Expenses [Text Block]

What were the Fund costs for the period?

(based on a hypothetical $10,000 investment)

Class Name
Costs of a $10,000 investment
Costs paid as a percentage of a $10,000 investment
Class I
$29
0.57%

Expenses are equal to Class I shares' annualized expense ratio (for the six-month period) multiplied by the average account value over the period. The Class' expenses would have been higher had certain expenses not been waived or reimbursed during the period.

Expenses Paid, Amount $ 29
Expense Ratio, Percent 0.57%
Net Assets $ 1,475,021,070
Holdings Count | Holdings 102
Investment Company, Portfolio Turnover 45.00%
Additional Fund Statistics [Text Block]

Key Fund Statistics (as of June 30, 2026)

Net Assets
$1,475,021,070
Number of Holdings
102
Portfolio Turnover (for the period ended 06/30/26)
45%


Holdings [Text Block]

Sector Allocation (% of net assets)

(as of June 30, 2026)


Sector
Allocation
Cash, short-term investment, and other assets, less liabilities
0.037
Communication Services
0.075
Consumer Discretionary
0.086
Consumer Staples
0.025
Energy
0.129
Financials
0.27
Health Care
0.096
Industrials
0.093
Information Technology
0.055
Materials
0.069
Real Estate
0.018
Utilities
0.024
Loan Assignments
0.022
Asset-Backed Securities
0.001
Commercial Mortgage-Backed Securities*
0.000
pie


* Less than 0.1%

The Global Industry Classification Standard (GICS) was developed by and is exclusive property and a service mark of MSCI Inc. (MSCI) and Standard & Poor's a division of S&P Global Inc. (S&P), and is licensed for use by Manning & Napier when referencing GICS sectors. Neither MSCI, S&P, nor any third party involved in making or compiling the GICS or any GICS classifications makes any express or implied warranties or representations with respect to such standard or classification, nor shall any such party have any liability therefrom.

High Yield Bond Series (Class S)  
Shareholder Report [Line Items]  
Fund Name High Yield Bond Series
Class Name Class S
Trading Symbol MNHYX
Annual or Semi-Annual Statement [Text Block] This semi-annual shareholder report contains important information about Class S of High Yield Bond Series, a series of Manning & Napier Fund Inc., for the period of January 1, 2026 to June 30, 2026.
Shareholder Report Annual or Semi-Annual semi-annual shareholder report
Additional Information [Text Block] You can find additional information about the Fund at www.manning-napier.com/products/mutual-funds. You can also request this information by contacting us at (800) 466‑3863. Shareholders who own the Fund through a third-party advisor or intermediary platform should contact their financial advisor directly for additional information.
Additional Information Phone Number (800) 466‑3863
Additional Information Website www.manning-napier.com/products/mutual-funds
Expenses [Text Block]

What were the Fund costs for the period?

(based on a hypothetical $10,000 investment)

Class Name
Costs of a $10,000 investment
Costs paid as a percentage of a $10,000 investment
Class S
$43
0.86%

Expenses are equal to Class S shares' annualized expense ratio (for the six-month period) multiplied by the average account value over the period. The Class' expenses would have been higher had certain expenses not been waived or reimbursed during the period.

Expenses Paid, Amount $ 43
Expense Ratio, Percent 0.86%
Net Assets $ 1,475,021,070
Holdings Count | Holdings 102
Investment Company, Portfolio Turnover 45.00%
Additional Fund Statistics [Text Block]

Key Fund Statistics (as of June 30, 2026)

Net Assets
$1,475,021,070
Number of Holdings
102
Portfolio Turnover (for the period ended 06/30/26)
45%


Holdings [Text Block]

Sector Allocation (% of net assets)

(as of June 30, 2026)


Sector
Allocation
Cash, short-term investment, and other assets, less liabilities
0.037
Communication Services
0.075
Consumer Discretionary
0.086
Consumer Staples
0.025
Energy
0.129
Financials
0.27
Health Care
0.096
Industrials
0.093
Information Technology
0.055
Materials
0.069
Real Estate
0.018
Utilities
0.024
Loan Assignments
0.022
Asset-Backed Securities
0.001
Commercial Mortgage-Backed Securities*
0.000
pie


* Less than 0.1%

The Global Industry Classification Standard (GICS) was developed by and is exclusive property and a service mark of MSCI Inc. (MSCI) and Standard & Poor's a division of S&P Global Inc. (S&P), and is licensed for use by Manning & Napier when referencing GICS sectors. Neither MSCI, S&P, nor any third party involved in making or compiling the GICS or any GICS classifications makes any express or implied warranties or representations with respect to such standard or classification, nor shall any such party have any liability therefrom.

High Yield Bond Series (Class W)  
Shareholder Report [Line Items]  
Fund Name High Yield Bond Series
Class Name Class W
Trading Symbol MHYWX
Annual or Semi-Annual Statement [Text Block] This semi-annual shareholder report contains important information about Class W of High Yield Bond Series, a series of Manning & Napier Fund Inc., for the period of January 1, 2026 to June 30, 2026.
Shareholder Report Annual or Semi-Annual semi-annual shareholder report
Additional Information [Text Block] You can find additional information about the Fund at www.manning-napier.com/products/mutual-funds. You can also request this information by contacting us at (800) 466‑3863. Shareholders who own the Fund through a third-party advisor or intermediary platform should contact their financial advisor directly for additional information.
Additional Information Phone Number (800) 466‑3863
Additional Information Website www.manning-napier.com/products/mutual-funds
Expenses [Text Block]

What were the Fund costs for the period?

(based on a hypothetical $10,000 investment)

Class Name
Costs of a $10,000 investment
Costs paid as a percentage of a $10,000 investment
Class W
$5
0.10%

Expenses are equal to Class W shares' annualized expense ratio (for the six-month period) multiplied by the average account value over the period. The Class' expenses would have been higher had certain expenses not been waived or reimbursed during the period.

Expenses Paid, Amount $ 5
Expense Ratio, Percent 0.10%
Net Assets $ 1,475,021,070
Holdings Count | Holdings 102
Investment Company, Portfolio Turnover 45.00%
Additional Fund Statistics [Text Block]

Key Fund Statistics (as of June 30, 2026)

Net Assets
$1,475,021,070
Number of Holdings
102
Portfolio Turnover (for the period ended 06/30/26)
45%


Holdings [Text Block]

Sector Allocation (% of net assets)

(as of June 30, 2026)


Sector
Allocation
Cash, short-term investment, and other assets, less liabilities
0.037
Communication Services
0.075
Consumer Discretionary
0.086
Consumer Staples
0.025
Energy
0.129
Financials
0.27
Health Care
0.096
Industrials
0.093
Information Technology
0.055
Materials
0.069
Real Estate
0.018
Utilities
0.024
Loan Assignments
0.022
Asset-Backed Securities
0.001
Commercial Mortgage-Backed Securities*
0.000
pie


* Less than 0.1%

The Global Industry Classification Standard (GICS) was developed by and is exclusive property and a service mark of MSCI Inc. (MSCI) and Standard & Poor's a division of S&P Global Inc. (S&P), and is licensed for use by Manning & Napier when referencing GICS sectors. Neither MSCI, S&P, nor any third party involved in making or compiling the GICS or any GICS classifications makes any express or implied warranties or representations with respect to such standard or classification, nor shall any such party have any liability therefrom.

High Yield Bond Series (Class Z)  
Shareholder Report [Line Items]  
Fund Name High Yield Bond Series
Class Name Class Z
Trading Symbol MHYZX
Annual or Semi-Annual Statement [Text Block] This semi-annual shareholder report contains important information about Class Z of High Yield Bond Series, a series of Manning & Napier Fund Inc., for the period of January 1, 2026 to June 30, 2026.
Shareholder Report Annual or Semi-Annual semi-annual shareholder report
Additional Information [Text Block] You can find additional information about the Fund at www.manning-napier.com/products/mutual-funds. You can also request this information by contacting us at (800) 466‑3863. Shareholders who own the Fund through a third-party advisor or intermediary platform should contact their financial advisor directly for additional information.
Additional Information Phone Number (800) 466‑3863
Additional Information Website www.manning-napier.com/products/mutual-funds
Expenses [Text Block]

What were the Fund costs for the period?

(based on a hypothetical $10,000 investment)

Class Name
Costs of a $10,000 investment
Costs paid as a percentage of a $10,000 investment
Class Z
$23
0.46%

Expenses are equal to Class Z shares' annualized expense ratio (for the six-month period) multiplied by the average account value over the period. The Class' expenses would have been higher had certain expenses not been waived or reimbursed during the period.

Expenses Paid, Amount $ 23
Expense Ratio, Percent 0.46%
Net Assets $ 1,475,021,070
Holdings Count | Holdings 102
Investment Company, Portfolio Turnover 45.00%
Additional Fund Statistics [Text Block]

Key Fund Statistics (as of June 30, 2026)

Net Assets
$1,475,021,070
Number of Holdings
102
Portfolio Turnover (for the period ended 06/30/26)
45%


Holdings [Text Block]

Sector Allocation (% of net assets)

(as of June 30, 2026)


Sector
Allocation
Cash, short-term investment, and other assets, less liabilities
0.037
Communication Services
0.075
Consumer Discretionary
0.086
Consumer Staples
0.025
Energy
0.129
Financials
0.27
Health Care
0.096
Industrials
0.093
Information Technology
0.055
Materials
0.069
Real Estate
0.018
Utilities
0.024
Loan Assignments
0.022
Asset-Backed Securities
0.001
Commercial Mortgage-Backed Securities*
0.000
pie


* Less than 0.1%

The Global Industry Classification Standard (GICS) was developed by and is exclusive property and a service mark of MSCI Inc. (MSCI) and Standard & Poor's a division of S&P Global Inc. (S&P), and is licensed for use by Manning & Napier when referencing GICS sectors. Neither MSCI, S&P, nor any third party involved in making or compiling the GICS or any GICS classifications makes any express or implied warranties or representations with respect to such standard or classification, nor shall any such party have any liability therefrom.

Diversified Tax Exempt Series (Class A)  
Shareholder Report [Line Items]  
Fund Name Diversified Tax Exempt Series
Class Name Class A
Trading Symbol EXDVX
Annual or Semi-Annual Statement [Text Block] This semi-annual shareholder report contains important information about Class A of Diversified Tax Exempt Series, a series of Manning & Napier Fund Inc., for the period of January 1, 2026 to June 30, 2026.
Shareholder Report Annual or Semi-Annual semi-annual shareholder report
Additional Information [Text Block] You can find additional information about the Fund at www.manning-napier.com/products/mutual-funds. You can also request this information by contacting us at (800) 466‑3863. Shareholders who own the Fund through a third-party advisor or intermediary platform should contact their financial advisor directly for additional information.
Additional Information Phone Number (800) 466‑3863
Additional Information Website www.manning-napier.com/products/mutual-funds
Expenses [Text Block]

What were the Fund costs for the period?

(based on a hypothetical $10,000 investment)

Class Name
Costs of a $10,000 investment
Costs paid as a percentage of a $10,000 investment
Class A
$22
0.45%

Expenses are equal to Class A shares' annualized expense ratio (for the six-month period) multiplied by the average account value over the period. The Class' expenses would have been higher had certain expenses not been waived or reimbursed during the period.

Expenses Paid, Amount $ 22
Expense Ratio, Percent 0.45%
Net Assets $ 173,424,859
Holdings Count | Holdings 119
Investment Company, Portfolio Turnover 16.00%
Additional Fund Statistics [Text Block]

Key Fund Statistics (as of June 30, 2026)

Net Assets
$173,424,859
Number of Holdings
119
Portfolio Turnover
(for the period ended 06/30/26)
16%


Holdings [Text Block]

Top Ten States (% of total investments)

(as of June 30, 2026)
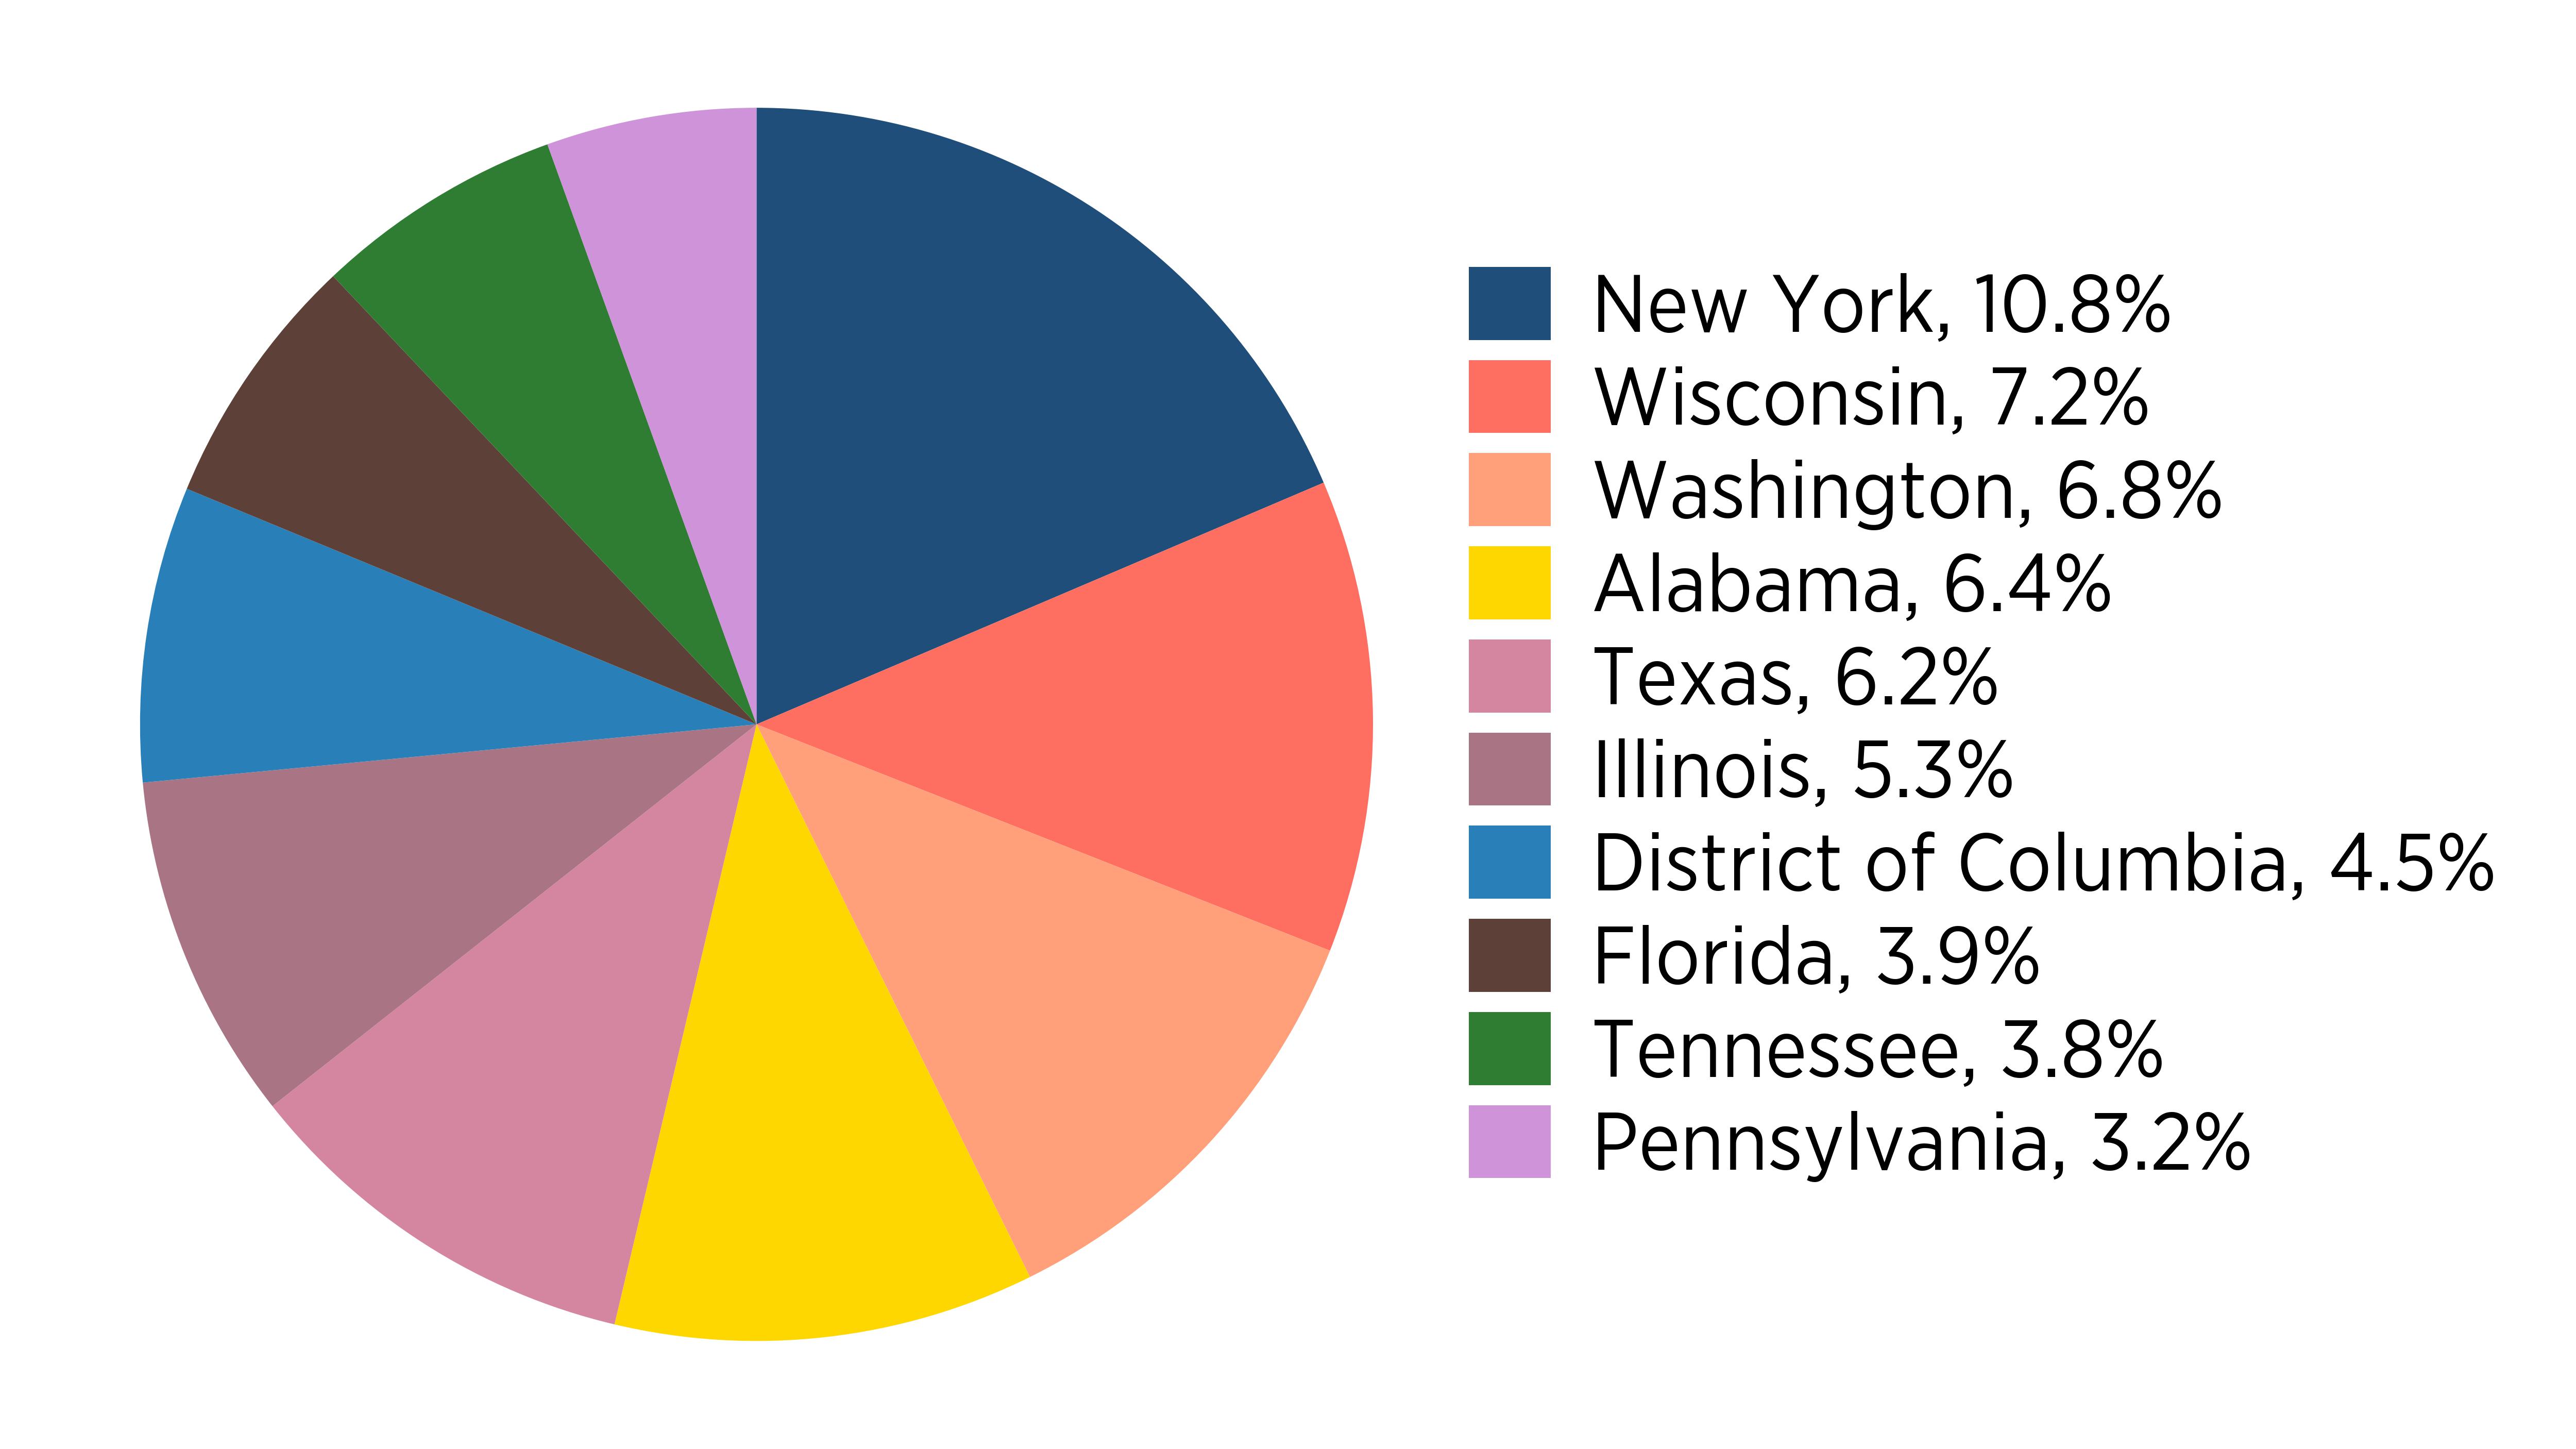
Geographical
Allocation
New York
0.108
Wisconsin
0.072
Washington
0.068
Alabama
0.064
Texas
0.062
Illinois
0.053
District of Columbia
0.045
Florida
0.039
Tennessee
0.038
Pennsylvania
0.032
pie

Largest Holdings [Text Block]

What did the Fund invest in?

(as of June 30, 2026)

Top Investment Types
%
Cash, short-term investment, and other assets, less liabilities
1.5
Revenue Bonds
41.2
Municipal Bonds
1.2
General Obligation Bonds
48.8
Exchange-Traded Funds
2.7
U.S. Treasury Notes
4.6

Expressed as a percentage of net assets.

Diversified Tax Exempt Series (Class W)  
Shareholder Report [Line Items]  
Fund Name Diversified Tax Exempt Series
Class Name Class W
Trading Symbol MNDWX
Annual or Semi-Annual Statement [Text Block] This semi-annual shareholder report contains important information about Class W of Diversified Tax Exempt Series, a series of Manning & Napier Fund Inc., for the period of January 1, 2026 to June 30, 2026.
Shareholder Report Annual or Semi-Annual semi-annual shareholder report
Additional Information [Text Block] You can find additional information about the Fund at www.manning-napier.com/products/mutual-funds. You can also request this information by contacting us at (800) 466‑3863. Shareholders who own the Fund through a third-party advisor or intermediary platform should contact their financial advisor directly for additional information.
Additional Information Phone Number (800) 466‑3863
Additional Information Website www.manning-napier.com/products/mutual-funds
Expenses [Text Block]

What were the Fund costs for the period?

(based on a hypothetical $10,000 investment)

Class Name
Costs of a $10,000 investment
Costs paid as a percentage of a $10,000 investment
Class W
$7
0.15%

Expenses are equal to Class W shares' annualized expense ratio (for the six-month period) multiplied by the average account value over the period. The Class' expenses would have been higher had certain expenses not been waived or reimbursed during the period.

Expenses Paid, Amount $ 7
Expense Ratio, Percent 0.15%
Net Assets $ 173,424,859
Holdings Count | Holdings 119
Investment Company, Portfolio Turnover 16.00%
Additional Fund Statistics [Text Block]

Key Fund Statistics (as of June 30, 2026)

Net Assets
$173,424,859
Number of Holdings
119
Portfolio Turnover
(for the period ended 06/30/26)
16%


Holdings [Text Block]

Top Ten States (% of total investments)

(as of June 30, 2026)

Geographical
Allocation
New York
0.108
Wisconsin
0.072
Washington
0.068
Alabama
0.064
Texas
0.062
Illinois
0.053
District of Columbia
0.045
Florida
0.039
Tennessee
0.038
Pennsylvania
0.032
pie

Largest Holdings [Text Block]

What did the Fund invest in?

(as of June 30, 2026)

Top Investment Types
%
Cash, short-term investment, and other assets, less liabilities
1.5
Revenue Bonds
41.2
Municipal Bonds
1.2
General Obligation Bonds
48.8
Exchange-Traded Funds
2.7
U.S. Treasury Notes
4.6

Expressed as a percentage of net assets.

Callodine Equity Income Series (Class I)  
Shareholder Report [Line Items]  
Fund Name Callodine Equity Income Series
Class Name Class I
Trading Symbol CEIIX
Annual or Semi-Annual Statement [Text Block] This semi-annual shareholder report contains important information about Class I of Callodine Equity Income Series, a series of Manning & Napier Fund Inc., for the period of January 1, 2026 to June 30, 2026.
Shareholder Report Annual or Semi-Annual semi-annual shareholder report
Additional Information [Text Block] You can find additional information about the Fund at www.manning-napier.com/products/mutual-funds. You can also request this information by contacting us at (800) 466‑3863. Shareholders who own the Fund through a third-party advisor or intermediary platform should contact their financial advisor directly for additional information.
Additional Information Phone Number (800) 466‑3863
Additional Information Website www.manning-napier.com/products/mutual-funds
Expenses [Text Block]

What were the Fund costs for the period?

(based on a hypothetical $10,000 investment)

Class Name
Costs of a $10,000 investment
Costs paid as a percentage of a $10,000 investment
Class I
$50
0.95%

Expenses are equal to Class I shares' annualized expense ratio (for the six-month period) multiplied by the average account value over the period. The Class' expenses would have been higher had certain expenses not been waived or reimbursed during the period.

Expenses Paid, Amount $ 50
Expense Ratio, Percent 0.95%
Net Assets $ 233,194,571
Holdings Count | Holdings 34
Investment Company, Portfolio Turnover 27.00%
Additional Fund Statistics [Text Block]

Key Fund Statistics (as of June 30, 2026)

Net Assets
$233,194,571
Number of Holdings
34
Portfolio Turnover
(for the period ended 06/30/26)
27%


Holdings [Text Block]

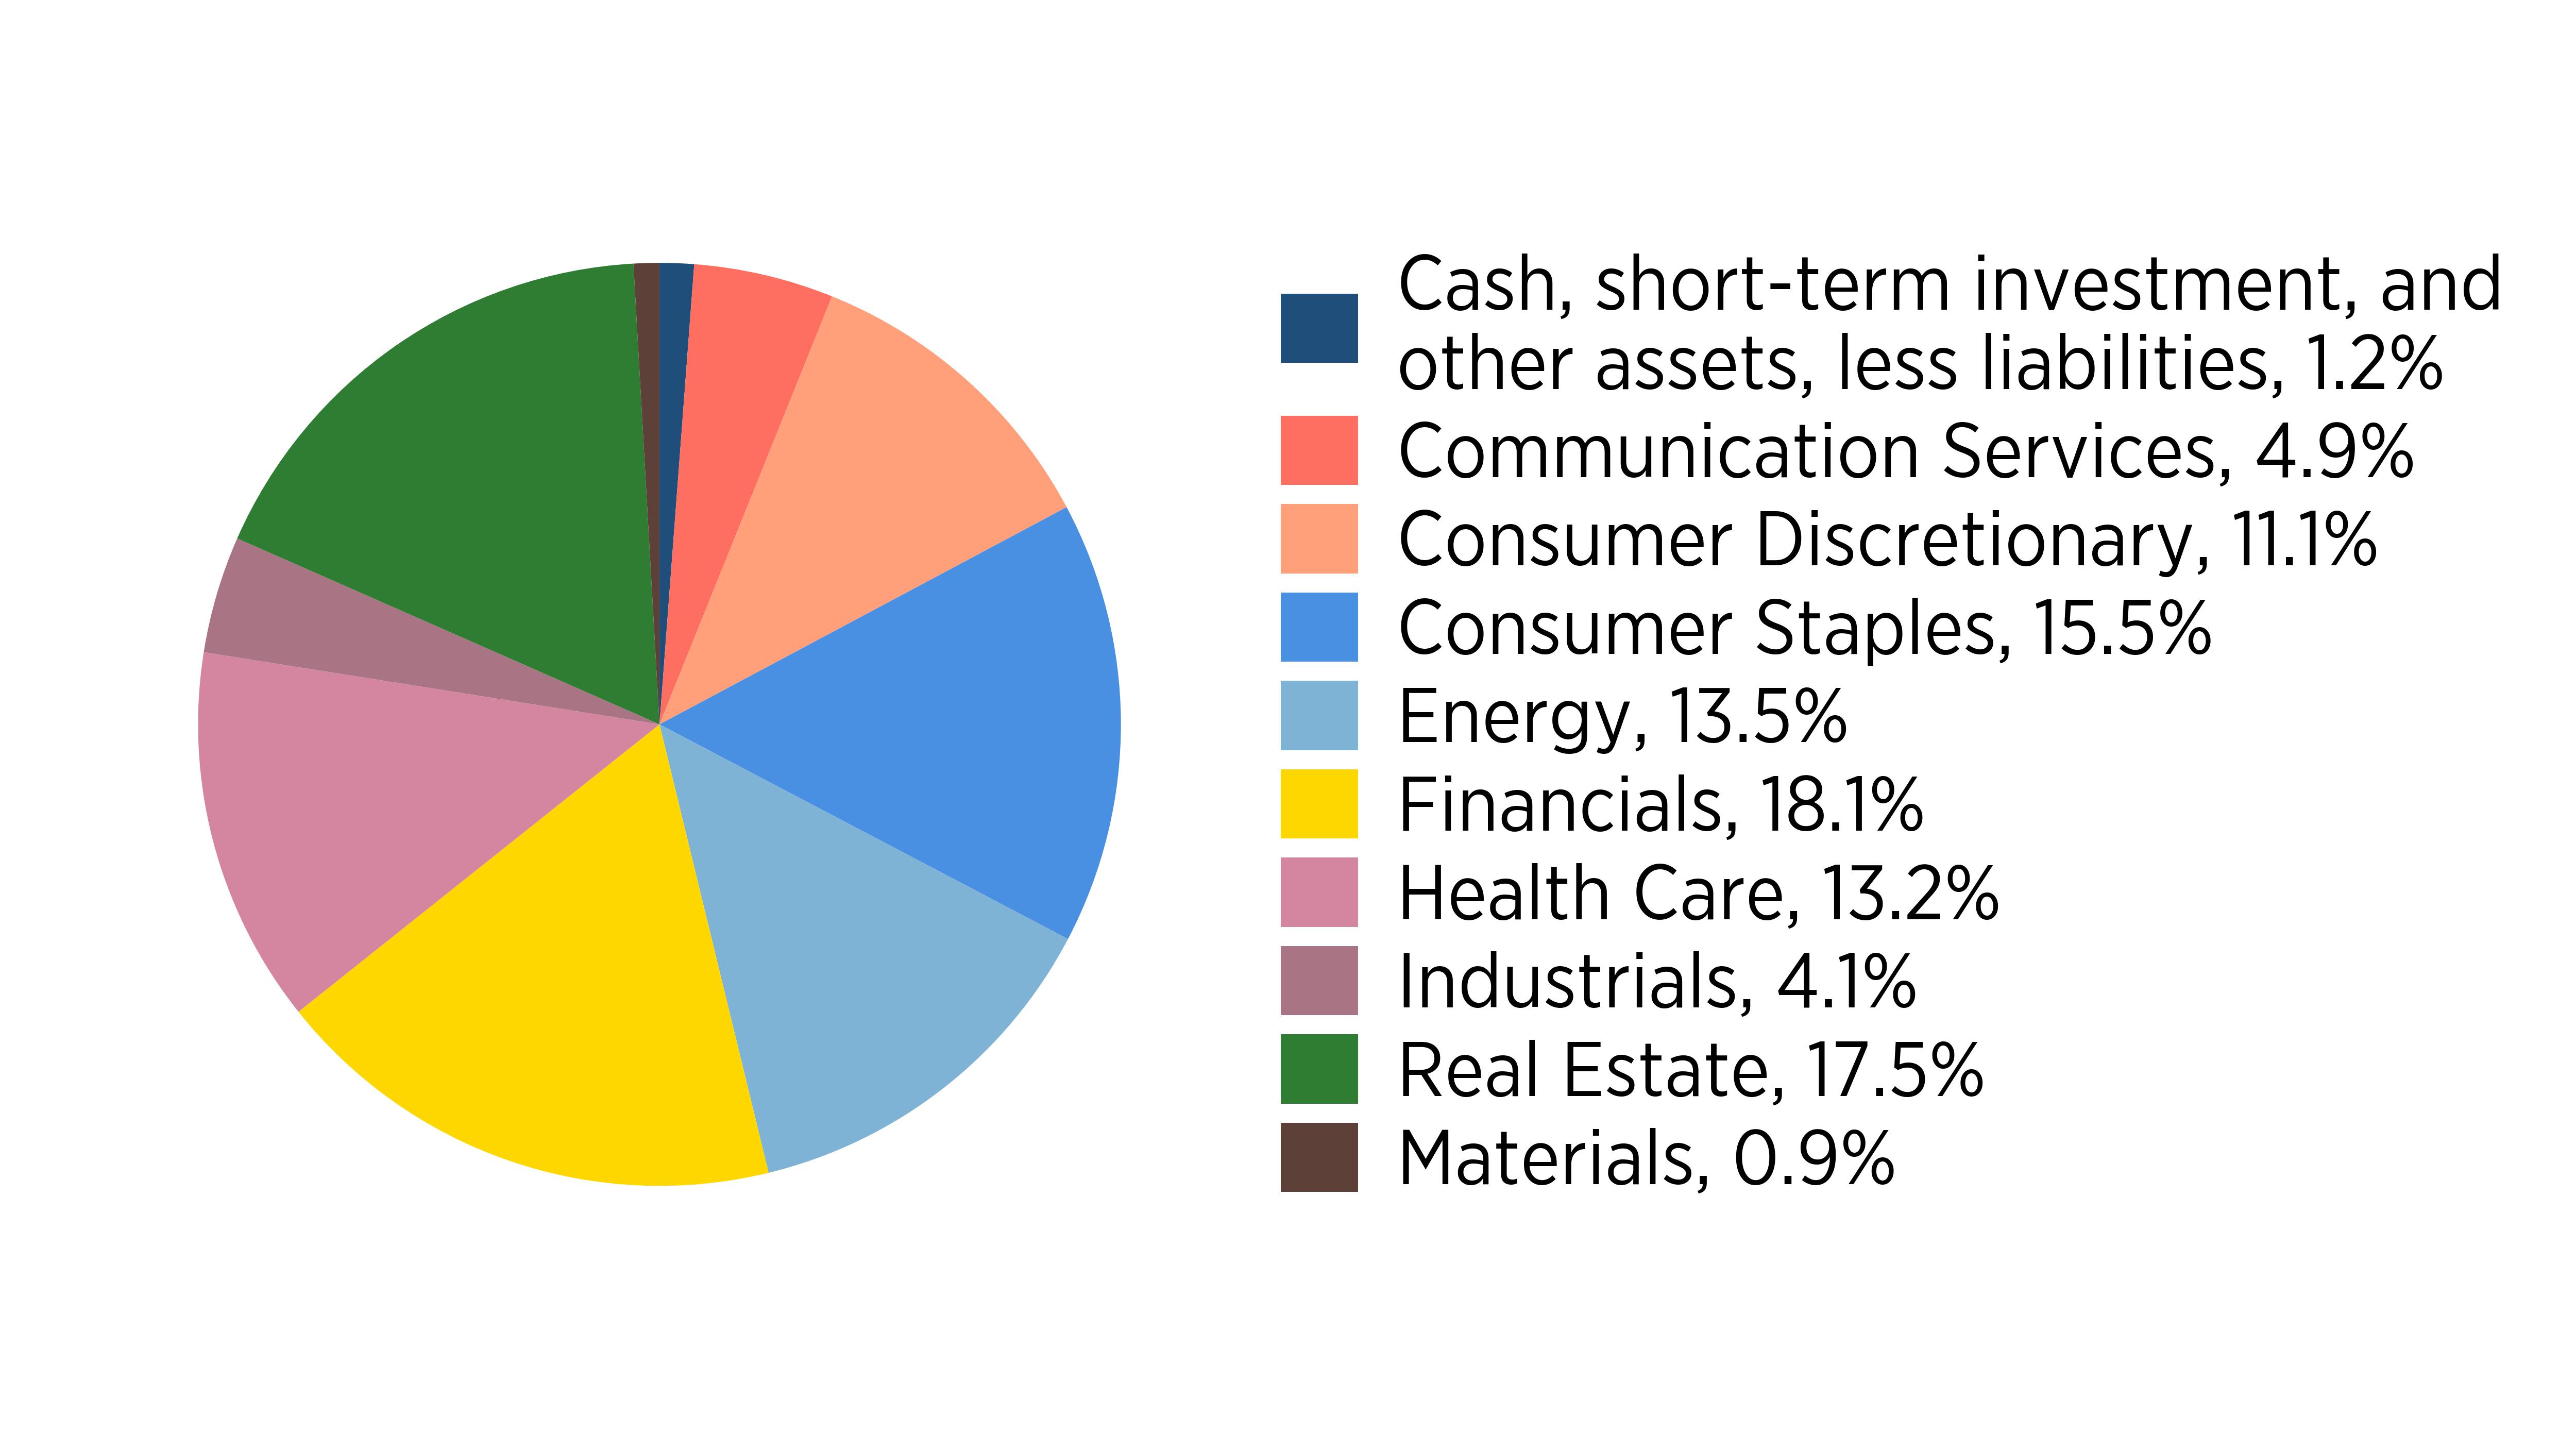
Sector Allocation (% of net assets)

(as of June 30, 2026)
Sector
Allocation
Cash, short-term investment, and other assets, less liabilities
0.012
Communication Services
0.049
Consumer Discretionary
0.111
Consumer Staples
0.155
Energy
0.135
Financials
0.181
Health Care
0.132
Industrials
0.041
Real Estate
0.175
Materials
0.009
pie

The Global Industry Classification Standard (GICS) was developed by and is exclusive property and a service mark of MSCI Inc. (MSCI) and Standard & Poor's a division of S&P Global Inc. (S&P), and is licensed for use by Manning & Napier when referencing GICS sectors. Neither MSCI, S&P, nor any third party involved in making or compiling the GICS or any GICS classifications makes any express or implied warranties or representations with respect to such standard or classification, nor shall any such party have any liability therefrom.
Largest Holdings [Text Block]

What did the Fund invest in?

(as of June 30, 2026)

Top Investment Types
%
Cash, short-term investment, and other assets, less liabilities
1.2
Common Stocks
98.8

Expressed as a percentage of net assets.

Callodine Equity Income Series (Class S)  
Shareholder Report [Line Items]  
Fund Name Callodine Equity Income Series
Class Name Class S
Trading Symbol CEISX
Annual or Semi-Annual Statement [Text Block] This semi-annual shareholder report contains important information about Class S of Callodine Equity Income Series, a series of Manning & Napier Fund Inc., for the period of January 1, 2026 to June 30, 2026.
Shareholder Report Annual or Semi-Annual semi-annual shareholder report
Additional Information [Text Block] You can find additional information about the Fund at www.manning-napier.com/products/mutual-funds. You can also request this information by contacting us at (800) 466‑3863. Shareholders who own the Fund through a third-party advisor or intermediary platform should contact their financial advisor directly for additional information.
Additional Information Phone Number (800) 466‑3863
Additional Information Website www.manning-napier.com/products/mutual-funds
Expenses [Text Block]

What were the Fund costs for the period?

(based on a hypothetical $10,000 investment)

Class Name
Costs of a $10,000 investment
Costs paid as a percentage of a $10,000 investment
Class S
$63
1.20%

Expenses are equal to Class S shares' annualized expense ratio (for the six-month period) multiplied by the average account value over the period. The Class' expenses would have been higher had certain expenses not been waived or reimbursed during the period.

Expenses Paid, Amount $ 63
Expense Ratio, Percent 1.20%
Net Assets $ 233,194,571
Holdings Count | Holdings 34
Investment Company, Portfolio Turnover 27.00%
Additional Fund Statistics [Text Block]

Key Fund Statistics (as of June 30, 2026)

Net Assets
$233,194,571
Number of Holdings
34
Portfolio Turnover
(for the period ended 06/30/26)
27%


Holdings [Text Block]

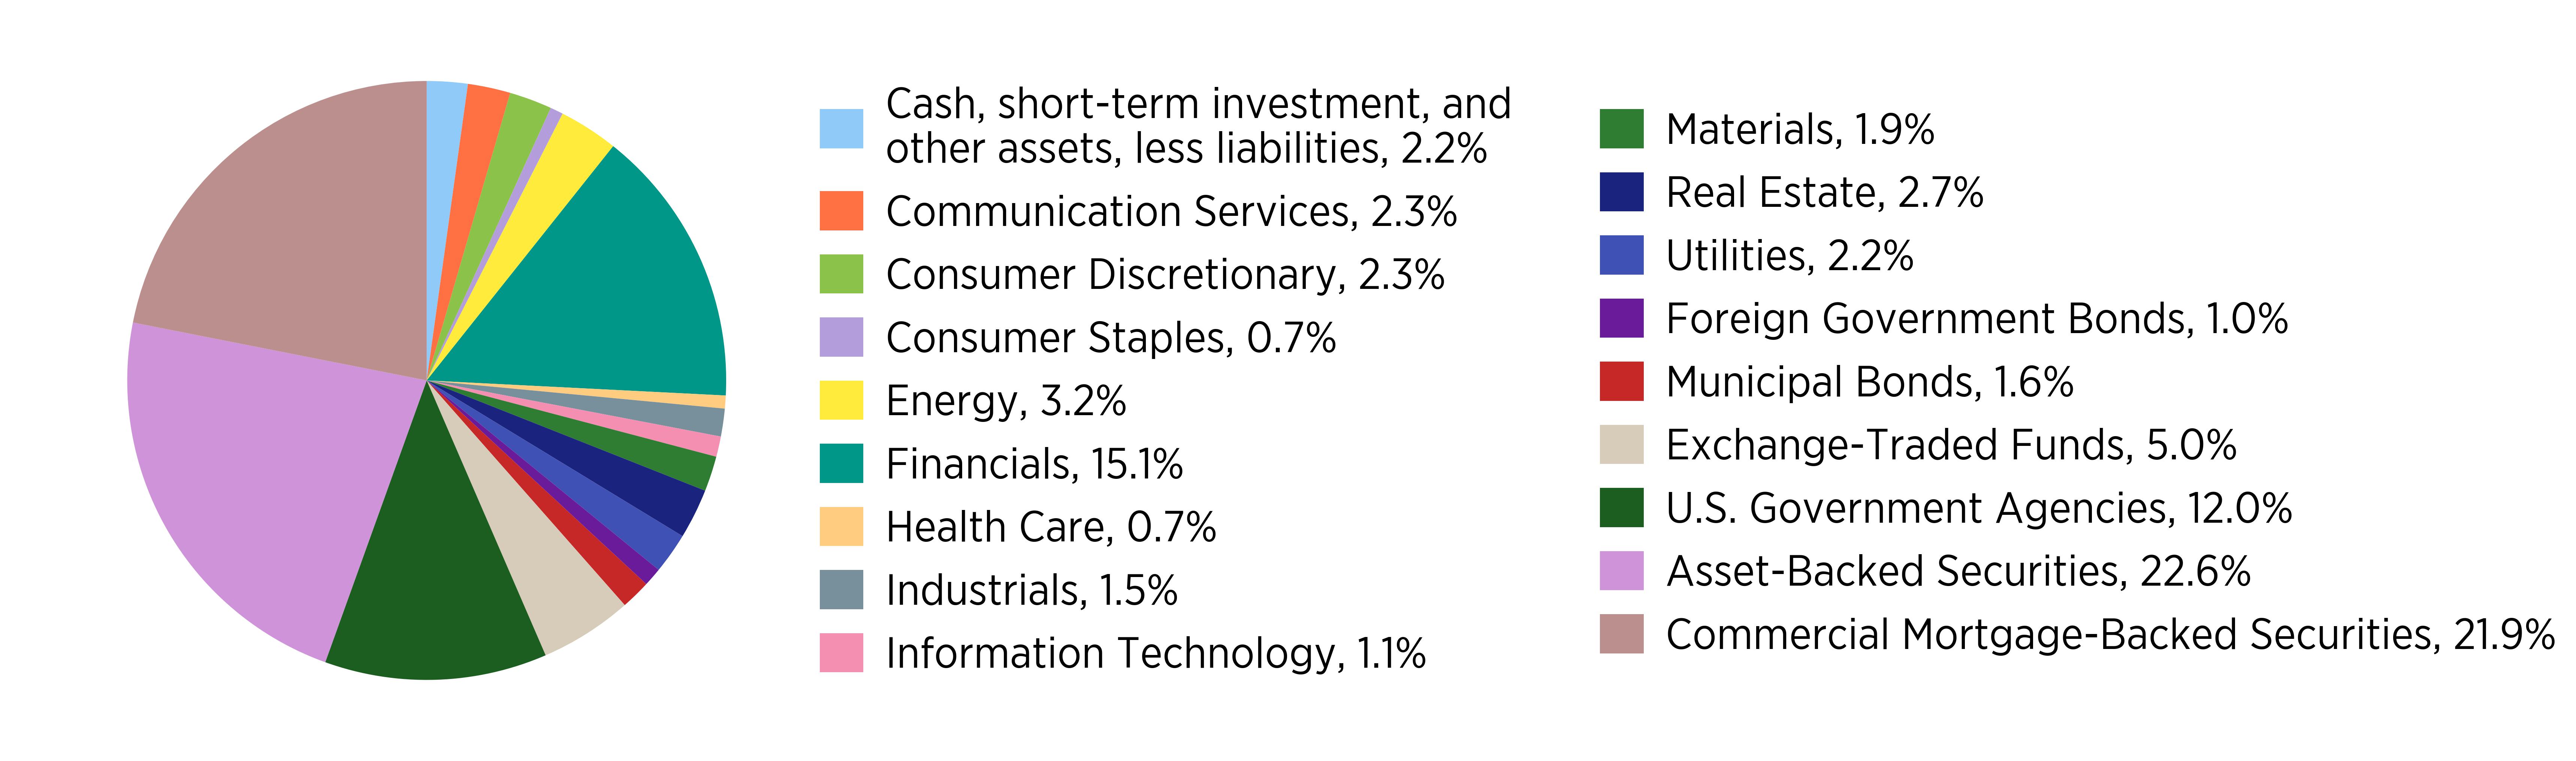
Sector Allocation (% of net assets)

(as of June 30, 2026)
 

Sector
Allocation
Cash, short-term investment, and other assets, less liabilities
0.012
Communication Services
0.049
Consumer Discretionary
0.111
Consumer Staples
0.155
Energy
0.135
Financials
0.181
Health Care
0.132
Industrials
0.041
Real Estate
0.175
Materials
0.009
pie

The Global Industry Classification Standard (GICS) was developed by and is exclusive property and a service mark of MSCI Inc. (MSCI) and Standard & Poor's a division of S&P Global Inc. (S&P), and is licensed for use by Manning & Napier when referencing GICS sectors. Neither MSCI, S&P, nor any third party involved in making or compiling the GICS or any GICS classifications makes any express or implied warranties or representations with respect to such standard or classification, nor shall any such party have any liability therefrom.
Largest Holdings [Text Block]

What did the Fund invest in?

(as of June 30, 2026)

Top Investment Types
%
Cash, short-term investment, and other assets, less liabilities
1.2
Common Stocks
98.8

Expressed as a percentage of net assets.

Callodine Equity Income Series (Class Z)  
Shareholder Report [Line Items]  
Fund Name Callodine Equity Income Series
Class Name Class Z
Trading Symbol CEIZX
Annual or Semi-Annual Statement [Text Block] This semi-annual shareholder report contains important information about Class Z of Callodine Equity Income Series, a series of Manning & Napier Fund Inc., for the period of January 1, 2026 to June 30, 2026.
Shareholder Report Annual or Semi-Annual semi-annual shareholder report
Additional Information [Text Block] You can find additional information about the Fund at www.manning-napier.com/products/mutual-funds. You can also request this information by contacting us at (800) 466‑3863. Shareholders who own the Fund through a third-party advisor or intermediary platform should contact their financial advisor directly for additional information.
Additional Information Phone Number (800) 466‑3863
Additional Information Website www.manning-napier.com/products/mutual-funds
Expenses [Text Block]

What were the Fund costs for the period?

(based on a hypothetical $10,000 investment)

Class Name
Costs of a $10,000 investment
Costs paid as a percentage of a $10,000 investment
Class Z
$42
0.80%

Expenses are equal to Class Z shares' annualized expense ratio (for the six-month period) multiplied by the average account value over the period. The Class' expenses would have been higher had certain expenses not been waived or reimbursed during the period.

Expenses Paid, Amount $ 42
Expense Ratio, Percent 0.80%
Net Assets $ 233,194,571
Holdings Count | Holdings 34
Investment Company, Portfolio Turnover 27.00%
Additional Fund Statistics [Text Block]

Key Fund Statistics (as of June 30, 2026)

Net Assets
$233,194,571
Number of Holdings
34
Portfolio Turnover
(for the period ended 06/30/26)
27%


Holdings [Text Block]

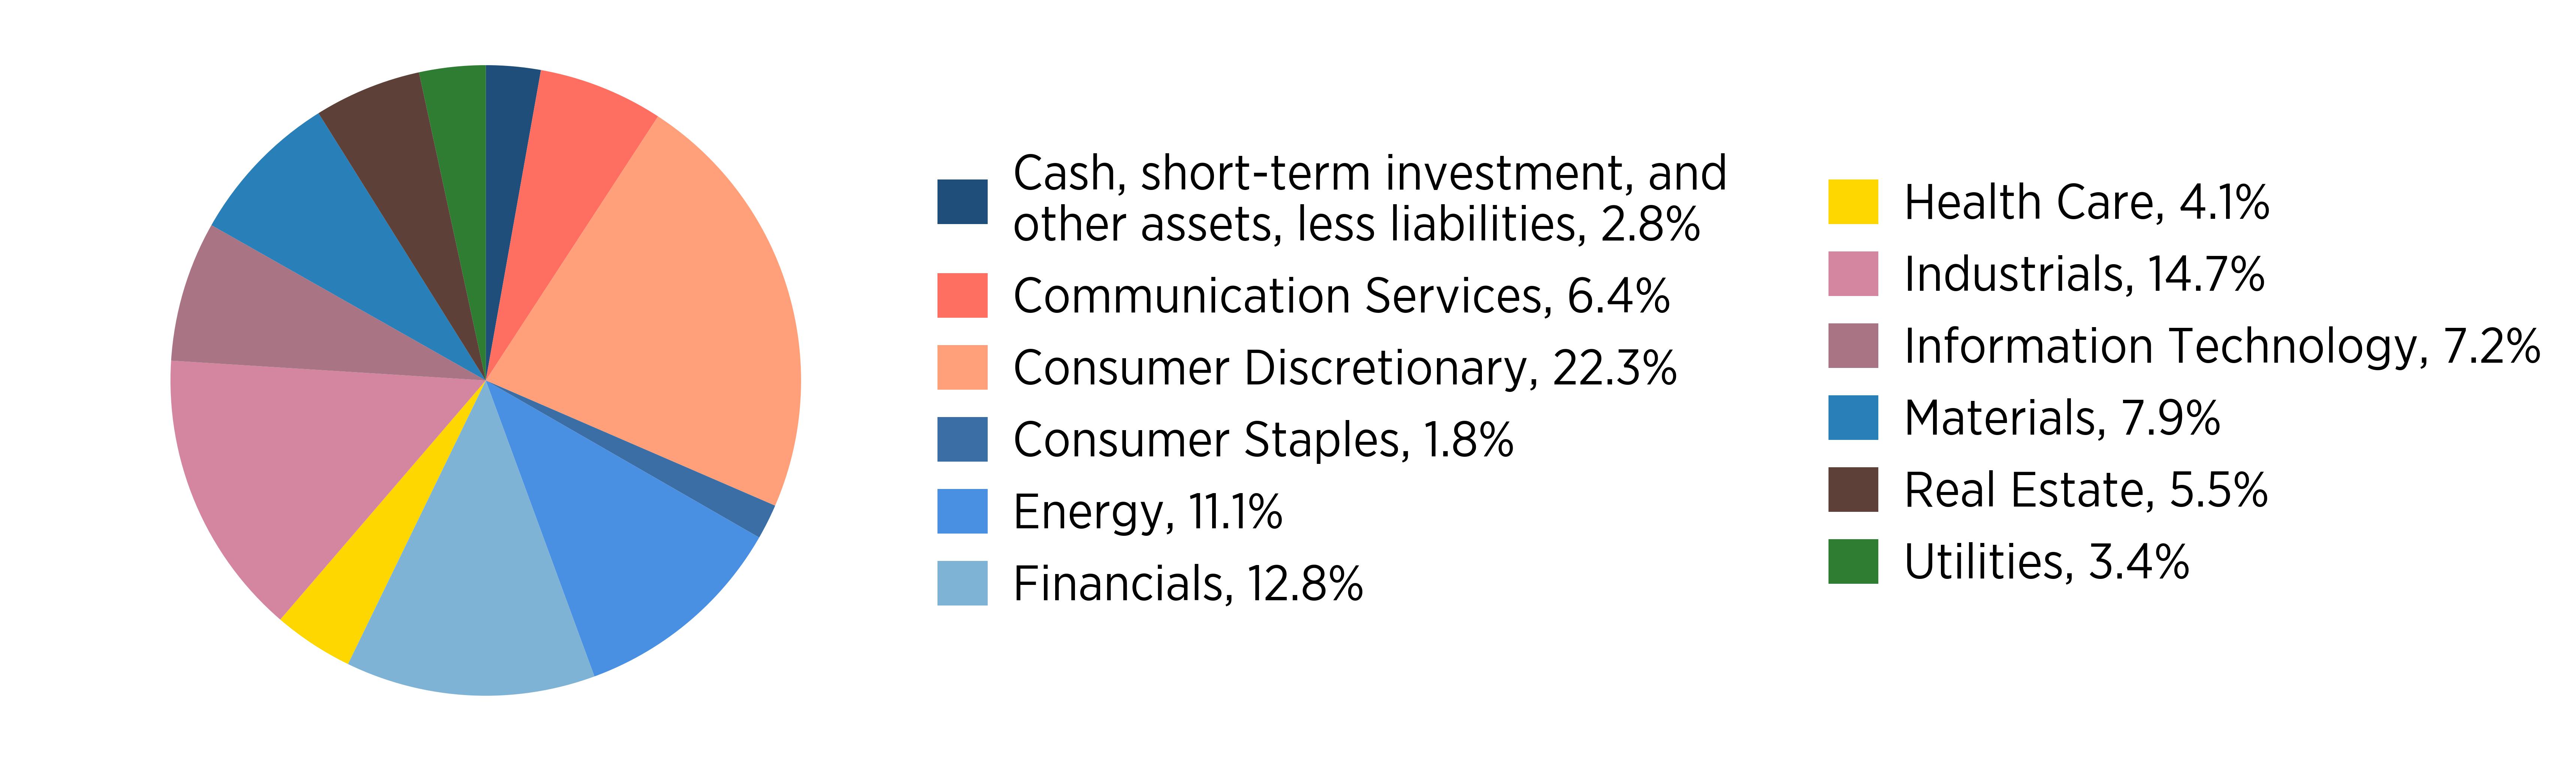
Sector Allocation (% of net assets)

(as of June 30, 2026)
 

Sector
Allocation
Cash, short-term investment, and other assets, less liabilities
0.012
Communication Services
0.049
Consumer Discretionary
0.111
Consumer Staples
0.155
Energy
0.135
Financials
0.181
Health Care
0.132
Industrials
0.041
Real Estate
0.175
Materials
0.009
pie

The Global Industry Classification Standard (GICS) was developed by and is exclusive property and a service mark of MSCI Inc. (MSCI) and Standard & Poor's a division of S&P Global Inc. (S&P), and is licensed for use by Manning & Napier when referencing GICS sectors. Neither MSCI, S&P, nor any third party involved in making or compiling the GICS or any GICS classifications makes any express or implied warranties or representations with respect to such standard or classification, nor shall any such party have any liability therefrom.
Largest Holdings [Text Block]

What did the Fund invest in?

(as of June 30, 2026)

Top Investment Types
%
Cash, short-term investment, and other assets, less liabilities
1.2
Common Stocks
98.8

Expressed as a percentage of net assets.

Credit Series (Class I)  
Shareholder Report [Line Items]  
Fund Name Credit Series
Class Name Class I
Trading Symbol MCDIX
Annual or Semi-Annual Statement [Text Block] This semi-annual shareholder report contains important information about Class I of Credit Series, a series of Manning & Napier Fund Inc., for the period of January 1, 2026 to June 30, 2026.
Shareholder Report Annual or Semi-Annual semi-annual shareholder report
Additional Information [Text Block] You can find additional information about the Fund at www.manning-napier.com/products/mutual-funds. You can also request this information by contacting us at (800) 466‑3863. Shareholders who own the Fund through a third-party advisor or intermediary platform should contact their financial advisor directly for additional information.
Additional Information Phone Number (800) 466‑3863
Additional Information Website www.manning-napier.com/products/mutual-funds
Expenses [Text Block]

What were the Fund costs for the period?

(based on a hypothetical $10,000 investment)

Class Name
Costs of a $10,000 investment
Costs paid as a percentage of a $10,000 investment
Class I
$25
0.50%

Expenses are equal to Class I shares' annualized expense ratio (for the six-month period) multiplied by the average account value over the period. The Class' expenses would have been higher had certain expenses not been waived or reimbursed during the period.

Expenses Paid, Amount $ 25
Expense Ratio, Percent 0.50%
Net Assets $ 302,301,500
Holdings Count | Holdings 159
Investment Company, Portfolio Turnover 27.00%
Additional Fund Statistics [Text Block]

Key Fund Statistics (as of June 30, 2026)

Net Assets
$302,301,500
Number of Holdings
159
Portfolio Turnover (for the period ended 06/30/26)
27%


Holdings [Text Block]

Sector Allocation (% of net assets)

(as of June 30, 2026)


Sector
Allocation
Cash, short-term investment, and other assets, less liabilities
0.022
Communication Services
0.023
Consumer Discretionary
0.023
Consumer Staples
0.007
Energy
0.032
Financials
0.151
Health Care
0.007
Industrials
0.015
Information Technology
0.011
Materials
0.019
Real Estate
0.027
Utilities
0.022
Foreign Government Bonds
0.01
Municipal Bonds
0.016
Exchange-Traded Funds
0.05
U.S. Government Agencies
0.12
Asset-Backed Securities
0.226
Commercial Mortgage-Backed Securities
0.219
pie


The Global Industry Classification Standard (GICS) was developed by and is exclusive property and a service mark of MSCI Inc. (MSCI) and Standard & Poor's a division of S&P Global Inc. (S&P), and is licensed for use by Manning & Napier when referencing GICS sectors. Neither MSCI, S&P, nor any third party involved in making or compiling the GICS or any GICS classifications makes any express or implied warranties or representations with respect to such standard or classification, nor shall any such party have any liability therefrom.
Credit Series (Class S)  
Shareholder Report [Line Items]  
Fund Name Credit Series
Class Name Class S
Trading Symbol MCDSX
Annual or Semi-Annual Statement [Text Block] This semi-annual shareholder report contains important information about Class S of Credit Series, a series of Manning & Napier Fund Inc., for the period of January 1, 2026 to June 30, 2026.
Shareholder Report Annual or Semi-Annual semi-annual shareholder report
Additional Information [Text Block] You can find additional information about the Fund at www.manning-napier.com/products/mutual-funds. You can also request this information by contacting us at (800) 466‑3863. Shareholders who own the Fund through a third-party advisor or intermediary platform should contact their financial advisor directly for additional information.
Additional Information Phone Number (800) 466‑3863
Additional Information Website www.manning-napier.com/products/mutual-funds
Expenses [Text Block]

What were the Fund costs for the period?

(based on a hypothetical $10,000 investment)

Class Name
Costs of a $10,000 investment
Costs paid as a percentage of a $10,000 investment
Class S
$34
0.69%

Expenses are equal to Class S shares' annualized expense ratio (for the six-month period) multiplied by the average account value over the period. The Class' expenses would have been higher had certain expenses not been waived or reimbursed during the period.

Expenses Paid, Amount $ 34
Expense Ratio, Percent 0.69%
Net Assets $ 302,301,500
Holdings Count | Holdings 159
Investment Company, Portfolio Turnover 27.00%
Additional Fund Statistics [Text Block]

Key Fund Statistics (as of June 30, 2026)

Net Assets
$302,301,500
Number of Holdings
159
Portfolio Turnover (for the period ended 06/30/26)
27%


Holdings [Text Block]

Sector Allocation (% of net assets)

(as of June 30, 2026)


Sector
Allocation
Cash, short-term investment, and other assets, less liabilities
0.022
Communication Services
0.023
Consumer Discretionary
0.023
Consumer Staples
0.007
Energy
0.032
Financials
0.151
Health Care
0.007
Industrials
0.015
Information Technology
0.011
Materials
0.019
Real Estate
0.027
Utilities
0.022
Foreign Government Bonds
0.01
Municipal Bonds
0.016
Exchange-Traded Funds
0.05
U.S. Government Agencies
0.12
Asset-Backed Securities
0.226
Commercial Mortgage-Backed Securities
0.219
pie


The Global Industry Classification Standard (GICS) was developed by and is exclusive property and a service mark of MSCI Inc. (MSCI) and Standard & Poor's a division of S&P Global Inc. (S&P), and is licensed for use by Manning & Napier when referencing GICS sectors. Neither MSCI, S&P, nor any third party involved in making or compiling the GICS or any GICS classifications makes any express or implied warranties or representations with respect to such standard or classification, nor shall any such party have any liability therefrom.
Credit Series (Class W)  
Shareholder Report [Line Items]  
Fund Name Credit Series
Class Name Class W
Trading Symbol MCDWX
Annual or Semi-Annual Statement [Text Block] This semi-annual shareholder report contains important information about Class W of Credit Series, a series of Manning & Napier Fund Inc., for the period of January 1, 2026 to June 30, 2026.
Shareholder Report Annual or Semi-Annual semi-annual shareholder report
Additional Information [Text Block] You can find additional information about the Fund at www.manning-napier.com/products/mutual-funds. You can also request this information by contacting us at (800) 466‑3863. Shareholders who own the Fund through a third-party advisor or intermediary platform should contact their financial advisor directly for additional information.
Additional Information Phone Number (800) 466‑3863
Additional Information Website www.manning-napier.com/products/mutual-funds
Expenses [Text Block]

What were the Fund costs for the period?

(based on a hypothetical $10,000 investment)

Class Name
Costs of a $10,000 investment
Costs paid as a percentage of a $10,000 investment
Class W
$5
0.10%

Expenses are equal to Class W shares' annualized expense ratio (for the six-month period) multiplied by the average account value over the period. The Class' expenses would have been higher had certain expenses not been waived or reimbursed during the period.

Expenses Paid, Amount $ 5
Expense Ratio, Percent 0.10%
Net Assets $ 302,301,500
Holdings Count | Holdings 159
Investment Company, Portfolio Turnover 27.00%
Additional Fund Statistics [Text Block]

Key Fund Statistics (as of June 30, 2026)

Net Assets
$302,301,500
Number of Holdings
159
Portfolio Turnover (for the period ended 06/30/26)
27%


Holdings [Text Block]

Sector Allocation (% of net assets)

(as of June 30, 2026)


Sector
Allocation
Cash, short-term investment, and other assets, less liabilities
0.022
Communication Services
0.023
Consumer Discretionary
0.023
Consumer Staples
0.007
Energy
0.032
Financials
0.151
Health Care
0.007
Industrials
0.015
Information Technology
0.011
Materials
0.019
Real Estate
0.027
Utilities
0.022
Foreign Government Bonds
0.01
Municipal Bonds
0.016
Exchange-Traded Funds
0.05
U.S. Government Agencies
0.12
Asset-Backed Securities
0.226
Commercial Mortgage-Backed Securities
0.219
pie


The Global Industry Classification Standard (GICS) was developed by and is exclusive property and a service mark of MSCI Inc. (MSCI) and Standard & Poor's a division of S&P Global Inc. (S&P), and is licensed for use by Manning & Napier when referencing GICS sectors. Neither MSCI, S&P, nor any third party involved in making or compiling the GICS or any GICS classifications makes any express or implied warranties or representations with respect to such standard or classification, nor shall any such party have any liability therefrom.
Systematic High Yield Bond Series (Class I)  
Shareholder Report [Line Items]  
Fund Name Systematic High Yield Bond Series
Class Name Class I
Trading Symbol MSHIX
Annual or Semi-Annual Statement [Text Block] This semi-annual shareholder report contains important information about Class I of Systematic High Yield Bond Series, a series of Manning & Napier Fund Inc., for the period of January 1, 2026 to June 30, 2026.
Shareholder Report Annual or Semi-Annual semi-annual shareholder report
Additional Information [Text Block] You can find additional information about the Fund at www.manning-napier.com/products/mutual-funds. You can also request this information by contacting us at (800) 466‑3863. Shareholders who own the Fund through a third-party advisor or intermediary platform should contact their financial advisor directly for additional information.
Additional Information Phone Number (800) 466‑3863
Additional Information Website www.manning-napier.com/products/mutual-funds
Expenses [Text Block]

What were the Fund costs for the period?

(based on a hypothetical $10,000 investment)

Class Name
Costs of a $10,000 investment
Costs paid as a percentage of a $10,000 investment
Class I
$30
0.60%

Expenses are equal to Class I shares' annualized expense ratio (for the six-month period) multiplied by the average account value over the period. The Class' expenses would have been higher had certain expenses not been waived or reimbursed during the period.

Expenses Paid, Amount $ 30
Expense Ratio, Percent 0.60%
Net Assets $ 27,129,405
Holdings Count | Holdings 260
Investment Company, Portfolio Turnover 103.00%
Additional Fund Statistics [Text Block]

Key Fund Statistics (as of June 30, 2026)

Net Assets
$27,129,405
Number of Holdings
260
Portfolio Turnover (for the period ended 06/30/26)
103%


Holdings [Text Block]

Sector Allocation (% of net assets)

(as of June 30, 2026)


Sector
Allocation
Cash, short-term investment, and other assets, less liabilities
0.028
Communication Services
0.064
Consumer Discretionary
0.223
Consumer Staples
0.018
Energy
0.111
Financials
0.128
Health Care
0.041
Industrials
0.147
Information Technology
0.072
Materials
0.079
Real Estate
0.055
Utilities
0.034
pie


The Global Industry Classification Standard (GICS) was developed by and is exclusive property and a service mark of MSCI Inc. (MSCI) and Standard & Poor's a division of S&P Global Inc. (S&P), and is licensed for use by Manning & Napier when referencing GICS sectors. Neither MSCI, S&P, nor any third party involved in making or compiling the GICS or any GICS classifications makes any express or implied warranties or representations with respect to such standard or classification, nor shall any such party have any liability therefrom.

Systematic High Yield Bond Series (Class S)  
Shareholder Report [Line Items]  
Fund Name Systematic High Yield Bond Series
Class Name Class S
Trading Symbol MSYSX
Annual or Semi-Annual Statement [Text Block] This semi-annual shareholder report contains important information about Class S of Systematic High Yield Bond Series, a series of Manning & Napier Fund Inc., for the period of January 1, 2026 to June 30, 2026.
Shareholder Report Annual or Semi-Annual semi-annual shareholder report
Additional Information [Text Block] You can find additional information about the Fund at www.manning-napier.com/products/mutual-funds. You can also request this information by contacting us at (800) 466‑3863. Shareholders who own the Fund through a third-party advisor or intermediary platform should contact their financial advisor directly for additional information.
Additional Information Phone Number (800) 466‑3863
Additional Information Website www.manning-napier.com/products/mutual-funds
Expenses [Text Block]

What were the Fund costs for the period?

(based on a hypothetical $10,000 investment)

Class Name
Costs of a $10,000 investment
Costs paid as a percentage of a $10,000 investment
Class S
$43
0.85%

Expenses are equal to Class S shares' annualized expense ratio (for the six-month period) multiplied by the average account value over the period. The Class' expenses would have been higher had certain expenses not been waived or reimbursed during the period.

Expenses Paid, Amount $ 43
Expense Ratio, Percent 0.85%
Net Assets $ 27,129,405
Holdings Count | Holdings 260
Investment Company, Portfolio Turnover 103.00%
Additional Fund Statistics [Text Block]

Key Fund Statistics (as of June 30, 2026)

Net Assets
$27,129,405
Number of Holdings
260
Portfolio Turnover (for the period ended 06/30/26)
103%


Holdings [Text Block]

Sector Allocation (% of net assets)

(as of June 30, 2026)


Sector
Allocation
Cash, short-term investment, and other assets, less liabilities
0.028
Communication Services
0.064
Consumer Discretionary
0.223
Consumer Staples
0.018
Energy
0.111
Financials
0.128
Health Care
0.041
Industrials
0.147
Information Technology
0.072
Materials
0.079
Real Estate
0.055
Utilities
0.034
pie


The Global Industry Classification Standard (GICS) was developed by and is exclusive property and a service mark of MSCI Inc. (MSCI) and Standard & Poor's a division of S&P Global Inc. (S&P), and is licensed for use by Manning & Napier when referencing GICS sectors. Neither MSCI, S&P, nor any third party involved in making or compiling the GICS or any GICS classifications makes any express or implied warranties or representations with respect to such standard or classification, nor shall any such party have any liability therefrom.

Systematic High Yield Bond Series (Class W)  
Shareholder Report [Line Items]  
Fund Name Systematic High Yield Bond Series
Class Name Class W
Trading Symbol MSHWX
Annual or Semi-Annual Statement [Text Block] This semi-annual shareholder report contains important information about Class W of Systematic High Yield Bond Series, a series of Manning & Napier Fund Inc., for the period of January 1, 2026 to June 30, 2026.
Shareholder Report Annual or Semi-Annual semi-annual shareholder report
Additional Information [Text Block] You can find additional information about the Fund at www.manning-napier.com/products/mutual-funds. You can also request this information by contacting us at (800) 466‑3863. Shareholders who own the Fund through a third-party advisor or intermediary platform should contact their financial advisor directly for additional information.
Additional Information Phone Number (800) 466‑3863
Additional Information Website www.manning-napier.com/products/mutual-funds
Expenses [Text Block]

What were the Fund costs for the period?

(based on a hypothetical $10,000 investment)

Class Name
Costs of a $10,000 investment
Costs paid as a percentage of a $10,000 investment
Class W
$5
0.10%

Expenses are equal to Class W shares' annualized expense ratio (for the six-month period) multiplied by the average account value over the period. The Class' expenses would have been higher had certain expenses not been waived or reimbursed during the period.

Expenses Paid, Amount $ 5
Expense Ratio, Percent 0.10%
Net Assets $ 27,129,405
Holdings Count | Holdings 260
Investment Company, Portfolio Turnover 103.00%
Additional Fund Statistics [Text Block]

Key Fund Statistics (as of June 30, 2026)

Net Assets
$27,129,405
Number of Holdings
260
Portfolio Turnover (for the period ended 06/30/26)
103%


Holdings [Text Block]

Sector Allocation (% of net assets)

(as of June 30, 2026)


Sector
Allocation
Cash, short-term investment, and other assets, less liabilities
0.028
Communication Services
0.064
Consumer Discretionary
0.223
Consumer Staples
0.018
Energy
0.111
Financials
0.128
Health Care
0.041
Industrials
0.147
Information Technology
0.072
Materials
0.079
Real Estate
0.055
Utilities
0.034
pie


The Global Industry Classification Standard (GICS) was developed by and is exclusive property and a service mark of MSCI Inc. (MSCI) and Standard & Poor's a division of S&P Global Inc. (S&P), and is licensed for use by Manning & Napier when referencing GICS sectors. Neither MSCI, S&P, nor any third party involved in making or compiling the GICS or any GICS classifications makes any express or implied warranties or representations with respect to such standard or classification, nor shall any such party have any liability therefrom.

Systematic High Yield Bond Series (Class Z)  
Shareholder Report [Line Items]  
Fund Name Systematic High Yield Bond Series
Class Name Class Z
Trading Symbol MSYZX
Annual or Semi-Annual Statement [Text Block] This semi-annual shareholder report contains important information about Class Z of Systematic High Yield Bond Series, a series of Manning & Napier Fund Inc., for the period of January 1, 2026 to June 30, 2026.
Shareholder Report Annual or Semi-Annual semi-annual shareholder report
Additional Information [Text Block] You can find additional information about the Fund at www.manning-napier.com/products/mutual-funds. You can also request this information by contacting us at (800) 466‑3863. Shareholders who own the Fund through a third-party advisor or intermediary platform should contact their financial advisor directly for additional information.
Additional Information Phone Number (800) 466‑3863
Additional Information Website www.manning-napier.com/products/mutual-funds
Expenses [Text Block]

What were the Fund costs for the period?

(based on a hypothetical $10,000 investment)

Class Name
Costs of a $10,000 investment
Costs paid as a percentage of a $10,000 investment
Class Z
$23
0.45%

Expenses are equal to Class Z shares' annualized expense ratio (for the six-month period) multiplied by the average account value over the period. The Class' expenses would have been higher had certain expenses not been waived or reimbursed during the period.

Expenses Paid, Amount $ 23
Expense Ratio, Percent 0.45%
Net Assets $ 27,129,405
Holdings Count | Holdings 260
Investment Company, Portfolio Turnover 103.00%
Additional Fund Statistics [Text Block]

Key Fund Statistics (as of June 30, 2026)

Net Assets
$27,129,405
Number of Holdings
260
Portfolio Turnover (for the period ended 06/30/26)
103%


Holdings [Text Block]

Sector Allocation (% of net assets)

(as of June 30, 2026)


Sector
Allocation
Cash, short-term investment, and other assets, less liabilities
0.028
Communication Services
0.064
Consumer Discretionary
0.223
Consumer Staples
0.018
Energy
0.111
Financials
0.128
Health Care
0.041
Industrials
0.147
Information Technology
0.072
Materials
0.079
Real Estate
0.055
Utilities
0.034
pie


The Global Industry Classification Standard (GICS) was developed by and is exclusive property and a service mark of MSCI Inc. (MSCI) and Standard & Poor's a division of S&P Global Inc. (S&P), and is licensed for use by Manning & Napier when referencing GICS sectors. Neither MSCI, S&P, nor any third party involved in making or compiling the GICS or any GICS classifications makes any express or implied warranties or representations with respect to such standard or classification, nor shall any such party have any liability therefrom.