Shareholder Report
Jun. 30, 2026
USD ($)
Holding
What were the Portfolio costs for the last six months?1
(Based on a hypothetical $10,000 investment)
| Share Class Name | Costs of a $10,000 investment | Costs paid as a percentage of a $10,000 investment2 |
| Service Class | $49 | 0.98% |
| 1. | Does not include any separate account or policy fees or charges imposed under the variable annuity policies and variable universal life insurance policies for which the Portfolio is an investment option. If they were included, your costs would be higher. |
| 2. | Annualized. |
Portfolio Performance
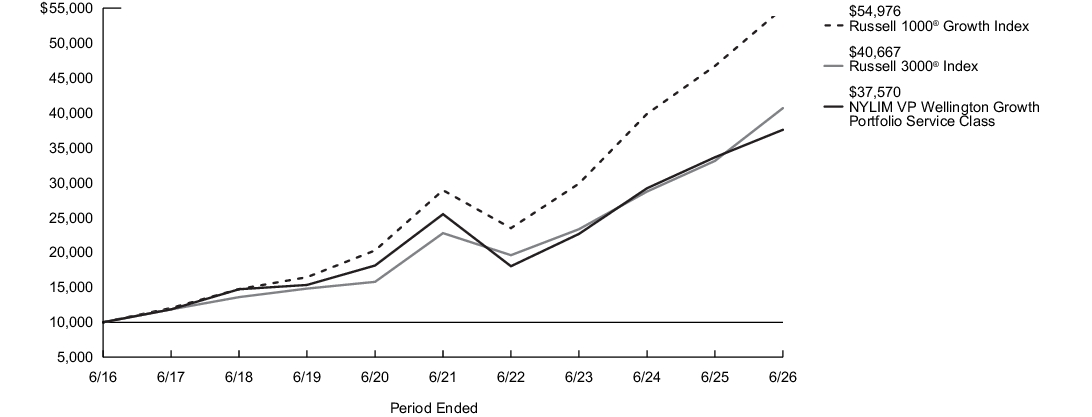
The following graph compares the initial and subsequent account values at the end of each of the most recently completed 10 semiannual reporting periods of the Portfolio (or for the life of the Portfolio, if shorter). It assumes a $10,000 initial investment at the beginning of the first fiscal period in an appropriate, broad-based securities market index and other indexes, if applicable, for the same period. Effective July 29, 2016, the Portfolio's principal investment strategies were modified in connection with changes to the Portfolio's subadvisor. The past performance in the graph and table prior to that date reflects the Portfolio's prior subadvisor and principal investment strategies. The Portfolio’s subadvisor changed effective January 1, 2018 due to an organizational restructuring whereby all investment personnel of Cornerstone Capital Management Holdings LLC, the former subadvisor, transitioned to MacKay Shields LLC. Effective May 1, 2021, the Portfolio replaced its subadvisor and modified its principal investment strategies. The past performance prior to these dates reflect the Portfolio's subadvisor and principal investment strategies.
| Average Annual Total Returns for the Period Ended June 30, 2026 | Inception Date |
Six Months1 |
One Year |
Five Years |
Ten Years |
| Service Class Shares | 6/5/2003 | 3.50% | 11.71% | 8.07% | 14.15% |
| Russell 3000®Index2 | 10.86% | 22.81% | 12.30% | 15.06% | |
| Russell 1000® Growth Index3 | 5.33% | 17.71% | 13.71% | 18.58% | |
| Morningstar Large Growth Category Average4 | 9.00% | 18.29% | 10.51% | 16.40% |
| 1. |
Not annualized. |
| 2. |
The Portfolio has selected the Russell 3000® Index to represent a broad measure of market performance. The Russell 3000® Index measures the performance of the largest 3,000 U.S. companies representing approximately 98% of the investable U.S. equity market. |
| 3. |
The Russell 1000® Growth Index, which is generally representative of the market sectors or types of investments in which the Portfolio invests, measures the performance of the large-cap growth segment of the U.S. equity universe. It includes those Russell 1000® Index companies with higher price-to-book ratios and higher forecasted growth values. |
| 4. |
The Morningstar Large Growth Category Average is representative of funds that invest primarily in big U.S. companies that are projected to grow faster than other large-cap stocks. Stocks in the top 70% of the capitalization of the U.S. equity market are defined as large cap. Growth is defined based on fast growth and high valuations. Most of these funds focus on companies in rapidly expanding industries. Results are based on average total returns of similar funds with all dividends and capital gain distributions reinvested. |
Key Portfolio Statistics
| Portfolio's net assets | $669,581,201 |
| Total number of portfolio holdings | 56 |
| Portfolio turnover rate | 43% |
Graphical Representation of Holdings
The tables below show the investment makeup of the Portfolio; percentages indicated are based on the Portfolio's net assets.
Top Ten Holdings and/or Issuers*
| NVIDIA Corp. | 11.6% |
| Alphabet, Inc., Class C | 10.5% |
| Apple, Inc. | 4.8% |
| Broadcom, Inc. | 4.7% |
| Eli Lilly & Co. | 4.5% |
| Tesla, Inc. | 3.7% |
| Microsoft Corp. | 3.1% |
| Micron Technology, Inc. | 2.9% |
| Mastercard, Inc., Class A | 2.4% |
| Western Digital Corp. | 2.1% |
| * Excluding short-term investments |
Top Industries
| Semiconductors & Semiconductor Equipment | 25.0% |
| Interactive Media & Services | 11.9% |
| Technology Hardware, Storage & Peripherals | 11.5% |
| Software | 9.0% |
| Electronic Equipment, Instruments & Components | 5.2% |
| Pharmaceuticals | 4.5% |
| Automobiles | 3.7% |
| Electrical Equipment | 3.5% |
| Financial Services | 3.3% |
| Aerospace & Defense | 3.2% |
| Other | 19.2% |
Top Ten Holdings and/or Issuers*
| NVIDIA Corp. | 11.6% |
| Alphabet, Inc., Class C | 10.5% |
| Apple, Inc. | 4.8% |
| Broadcom, Inc. | 4.7% |
| Eli Lilly & Co. | 4.5% |
| Tesla, Inc. | 3.7% |
| Microsoft Corp. | 3.1% |
| Micron Technology, Inc. | 2.9% |
| Mastercard, Inc., Class A | 2.4% |
| Western Digital Corp. | 2.1% |
| * Excluding short-term investments |
What were the Portfolio costs for the last six months?1
(Based on a hypothetical $10,000 investment)
| Share Class Name | Costs of a $10,000 investment | Costs paid as a percentage of a $10,000 investment2 |
| Initial Class | $37 | 0.73% |
| 1. | Does not include any separate account or policy fees or charges imposed under the variable annuity policies and variable universal life insurance policies for which the Portfolio is an investment option. If they were included, your costs would be higher. |
| 2. | Annualized. |
Portfolio Performance
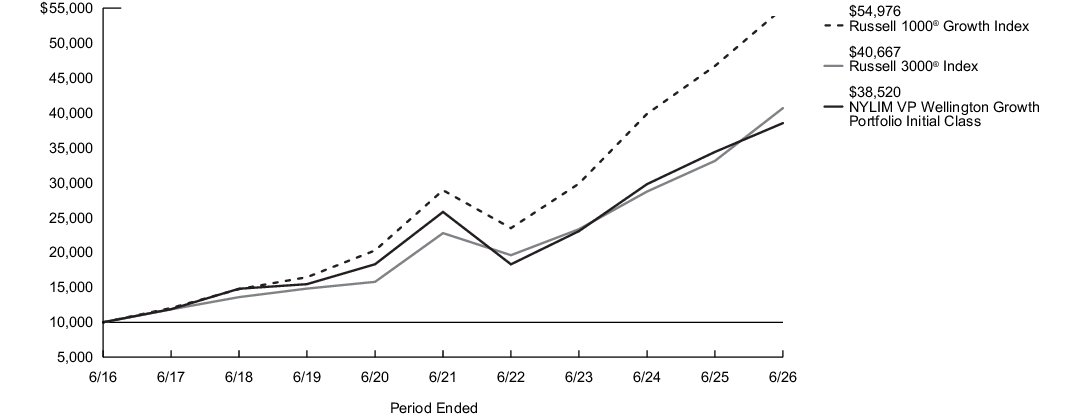
The following graph compares the initial and subsequent account values at the end of each of the most recently completed 10 semiannual reporting periods of the Portfolio (or for the life of the Portfolio, if shorter). It assumes a $10,000 initial investment at the beginning of the first fiscal period in an appropriate, broad-based securities market index and other indexes, if applicable, for the same period. Effective July 29, 2016, the Portfolio's principal investment strategies were modified in connection with changes to the Portfolio's subadvisor. The past performance in the graph and table prior to that date reflects the Portfolio's prior subadvisor and principal investment strategies. The Portfolio’s subadvisor changed effective January 1, 2018 due to an organizational restructuring whereby all investment personnel of Cornerstone Capital Management Holdings LLC, the former subadvisor, transitioned to MacKay Shields LLC. Effective May 1, 2021, the Portfolio replaced its subadvisor and modified its principal investment strategies. The past performance prior to these dates reflect the Portfolio's subadvisor and principal investment strategies.
| Average Annual Total Returns for the Period Ended June 30, 2026 | Inception Date |
Six Months1 |
One Year |
Five Years |
Ten Years |
| Initial Class Shares | 1/29/1993 | 3.63% | 11.99% | 8.34% | 14.44% |
| Russell 3000®Index2 | 10.86% | 22.81% | 12.30% | 15.06% | |
| Russell 1000® Growth Index3 | 5.33% | 17.71% | 13.71% | 18.58% | |
| Morningstar Large Growth Category Average4 | 9.00% | 18.29% | 10.51% | 16.40% |
| 1. |
Not annualized. |
| 2. |
The Portfolio has selected the Russell 3000® Index to represent a broad measure of market performance. The Russell 3000® Index measures the performance of the largest 3,000 U.S. companies representing approximately 98% of the investable U.S. equity market. |
| 3. |
The Russell 1000® Growth Index, which is generally representative of the market sectors or types of investments in which the Portfolio invests, measures the performance of the large-cap growth segment of the U.S. equity universe. It includes those Russell 1000® Index companies with higher price-to-book ratios and higher forecasted growth values. |
| 4. |
The Morningstar Large Growth Category Average is representative of funds that invest primarily in big U.S. companies that are projected to grow faster than other large-cap stocks. Stocks in the top 70% of the capitalization of the U.S. equity market are defined as large cap. Growth is defined based on fast growth and high valuations. Most of these funds focus on companies in rapidly expanding industries. Results are based on average total returns of similar funds with all dividends and capital gain distributions reinvested. |
Key Portfolio Statistics
| Portfolio's net assets | $669,581,201 |
| Total number of portfolio holdings | 56 |
| Portfolio turnover rate | 43% |
Graphical Representation of Holdings
The tables below show the investment makeup of the Portfolio; percentages indicated are based on the Portfolio's net assets.
Top Ten Holdings and/or Issuers*
| NVIDIA Corp. | 11.6% |
| Alphabet, Inc., Class C | 10.5% |
| Apple, Inc. | 4.8% |
| Broadcom, Inc. | 4.7% |
| Eli Lilly & Co. | 4.5% |
| Tesla, Inc. | 3.7% |
| Microsoft Corp. | 3.1% |
| Micron Technology, Inc. | 2.9% |
| Mastercard, Inc., Class A | 2.4% |
| Western Digital Corp. | 2.1% |
| * Excluding short-term investments |
Top Industries
| Semiconductors & Semiconductor Equipment | 25.0% |
| Interactive Media & Services | 11.9% |
| Technology Hardware, Storage & Peripherals | 11.5% |
| Software | 9.0% |
| Electronic Equipment, Instruments & Components | 5.2% |
| Pharmaceuticals | 4.5% |
| Automobiles | 3.7% |
| Electrical Equipment | 3.5% |
| Financial Services | 3.3% |
| Aerospace & Defense | 3.2% |
| Other | 19.2% |
Top Ten Holdings and/or Issuers*
| NVIDIA Corp. | 11.6% |
| Alphabet, Inc., Class C | 10.5% |
| Apple, Inc. | 4.8% |
| Broadcom, Inc. | 4.7% |
| Eli Lilly & Co. | 4.5% |
| Tesla, Inc. | 3.7% |
| Microsoft Corp. | 3.1% |
| Micron Technology, Inc. | 2.9% |
| Mastercard, Inc., Class A | 2.4% |
| Western Digital Corp. | 2.1% |
| * Excluding short-term investments |
What were the Portfolio costs for the last six months?1
(Based on a hypothetical $10,000 investment)
| Share Class Name | Costs of a $10,000 investment | Costs paid as a percentage of a $10,000 investment2 |
| Initial Class | $33 | 0.59% |
| 1. | Does not include any separate account or policy fees or charges imposed under the variable annuity policies and variable universal life insurance policies for which the Portfolio is an investment option. If they were included, your costs would be higher. |
| 2. | Annualized. |
Portfolio Performance
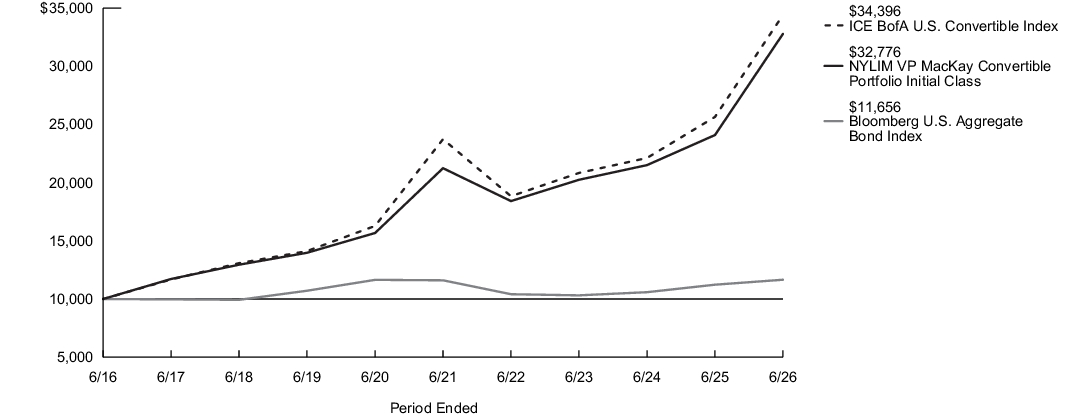
The following graph compares the initial and subsequent account values at the end of each of the most recently completed 10 semiannual reporting periods of the Portfolio (or for the life of the Portfolio, if shorter). It assumes a $10,000 initial investment at the beginning of the first fiscal period in an appropriate, broad-based securities market index and other indexes, if applicable, for the same period.
| Average Annual Total Returns for the Period Ended June 30, 2026 | Inception Date |
Six Months1 |
One Year |
Five Years |
Ten Years |
| Initial Class Shares | 10/1/1996 | 24.56% | 36.07% | 9.07% | 12.60% |
| Bloomberg U.S. Aggregate Bond Index2 | 0.62% | 3.79% | 0.08% | 1.54% | |
| ICE BofA U.S. Convertible Index3 | 21.12% | 34.12% | 7.71% | 13.15% | |
| Morningstar Convertibles Category Average4 | 18.31% | 29.56% | 6.33% | 11.50% |
| 1. |
Not annualized. |
| 2. |
The Portfolio has selected the Bloomberg U.S. Aggregate Bond Index to represent a broad measure of market performance. The Bloomberg U.S. Aggregate Bond Index is a broad-based benchmark that measures the investment grade, U.S. dollar-denominated, fixed-rate taxable bond market, including Treasuries, government-related and corporate securities, mortgage-backed securities (agency fixed-rate and hybrid adjustable rate mortgage pass-throughs), asset-backed securities and commercial mortgage-backed securities. |
| 3. |
The ICE BofA U.S. Convertible Index, which is generally representative of the market sectors or types of investments in which the Portfolio invests, is a market-capitalization weighted index of domestic corporate convertible securities. In order to be included in the ICE BofA U.S. Convertible Index, bonds and preferred stocks must be convertible only to common stock. |
| 4. |
The Morningstar Convertibles Category Average is representative of funds that are designed to offer some of the capital-appreciation potential of stock portfolios while also supplying some of the safety and yield of bond portfolios. Results are based on average total returns of similar funds with all dividends and capital gain distributions reinvested. |
Key Portfolio Statistics
| Portfolio's net assets | $1,322,778,510 |
| Total number of portfolio holdings | 96 |
| Portfolio turnover rate | 20% |
Graphical Representation of Holdings
The tables below show the investment makeup of the Portfolio; percentages indicated are based on the Portfolio's net assets.
Top Ten Holdings and/or Issuers*
| MKS, Inc., 1.25%, due 6/1/30 | 3.7% |
| Western Digital Corp., 3.00%, due 11/15/28 | 3.5% |
| Alphabet, Inc., 6.250%, Series A | 3.5% |
| Welltower OP LLC, 3.125%, due 7/15/29 | 2.7% |
| Hewlett Packard Enterprise Co., 7.625% | 2.2% |
| Lantheus Holdings, Inc., 2.625%, due 12/15/27 | 2.1% |
| Lumentum Holdings, Inc., 0.50%, due 6/15/28 | 2.0% |
| QXO, Inc., 5.50% | 1.8% |
| Boeing Co. (The), 6.00% | 1.7% |
| Uber Technologies, Inc., Series 2028, 0.875%, due 12/1/28 | 1.7% |
| * Excluding short-term investments |
Portfolio Composition
| Convertible Bonds | 80.3% |
| Convertible Preferred Stocks | 14.8% |
| Short-Term Investments | 7.8% |
| Other Assets, Less Liabilities | (2.9)% |
Top Ten Holdings and/or Issuers*
| MKS, Inc., 1.25%, due 6/1/30 | 3.7% |
| Western Digital Corp., 3.00%, due 11/15/28 | 3.5% |
| Alphabet, Inc., 6.250%, Series A | 3.5% |
| Welltower OP LLC, 3.125%, due 7/15/29 | 2.7% |
| Hewlett Packard Enterprise Co., 7.625% | 2.2% |
| Lantheus Holdings, Inc., 2.625%, due 12/15/27 | 2.1% |
| Lumentum Holdings, Inc., 0.50%, due 6/15/28 | 2.0% |
| QXO, Inc., 5.50% | 1.8% |
| Boeing Co. (The), 6.00% | 1.7% |
| Uber Technologies, Inc., Series 2028, 0.875%, due 12/1/28 | 1.7% |
| * Excluding short-term investments |
What were the Portfolio costs for the last six months?1
(Based on a hypothetical $10,000 investment)
| Share Class Name | Costs of a $10,000 investment | Costs paid as a percentage of a $10,000 investment2 |
| Service 2 Class | $52 | 0.94% |
| 1. | Does not include any separate account or policy fees or charges imposed under the variable annuity policies and variable universal life insurance policies for which the Portfolio is an investment option. If they were included, your costs would be higher. |
| 2. | Annualized. |
Portfolio Performance
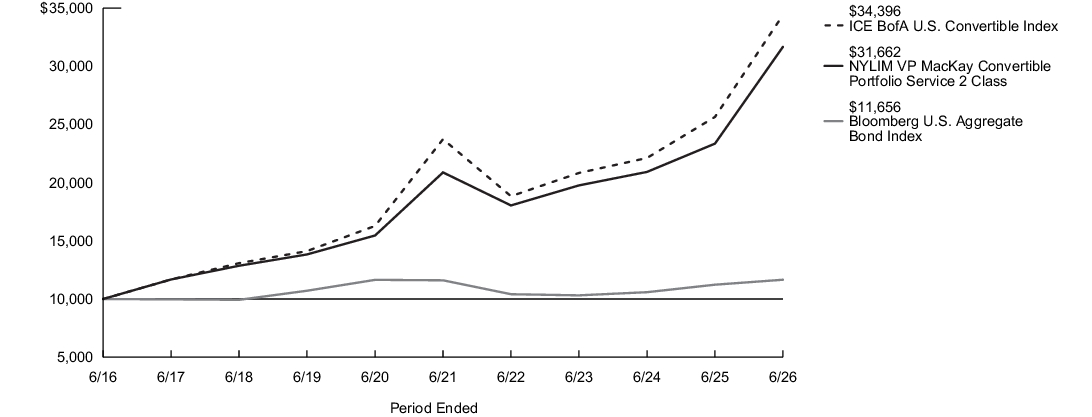
The following graph compares the initial and subsequent account values at the end of each of the most recently completed 10 semiannual reporting periods of the Portfolio (or for the life of the Portfolio, if shorter). It assumes a $10,000 initial investment at the beginning of the first fiscal period in an appropriate, broad-based securities market index and other indexes, if applicable, for the same period.
| Average Annual Total Returns for the Period Ended June 30, 2026 | Inception Date |
Six Months1 |
One Year |
Five Years |
Ten Years |
| Service 2 Class Shares | 4/26/2016 | 24.35% | 35.59% | 8.69% | 12.22% |
| Bloomberg U.S. Aggregate Bond Index2 | 0.62% | 3.79% | 0.08% | 1.54% | |
| ICE BofA U.S. Convertible Index3 | 21.12% | 34.12% | 7.71% | 13.15% | |
| Morningstar Convertibles Category Average4 | 18.31% | 29.56% | 6.33% | 11.50% |
| 1. |
Not annualized. |
| 2. |
The Portfolio has selected the Bloomberg U.S. Aggregate Bond Index to represent a broad measure of market performance. The Bloomberg U.S. Aggregate Bond Index is a broad-based benchmark that measures the investment grade, U.S. dollar-denominated, fixed-rate taxable bond market, including Treasuries, government-related and corporate securities, mortgage-backed securities (agency fixed-rate and hybrid adjustable rate mortgage pass-throughs), asset-backed securities and commercial mortgage-backed securities. |
| 3. |
The ICE BofA U.S. Convertible Index, which is generally representative of the market sectors or types of investments in which the Portfolio invests, is a market-capitalization weighted index of domestic corporate convertible securities. In order to be included in the ICE BofA U.S. Convertible Index, bonds and preferred stocks must be convertible only to common stock. |
| 4. |
The Morningstar Convertibles Category Average is representative of funds that are designed to offer some of the capital-appreciation potential of stock portfolios while also supplying some of the safety and yield of bond portfolios. Results are based on average total returns of similar funds with all dividends and capital gain distributions reinvested. |
Key Portfolio Statistics
| Portfolio's net assets | $1,322,778,510 |
| Total number of portfolio holdings | 96 |
| Portfolio turnover rate | 20% |
Graphical Representation of Holdings
The tables below show the investment makeup of the Portfolio; percentages indicated are based on the Portfolio's net assets.
Top Ten Holdings and/or Issuers*
| MKS, Inc., 1.25%, due 6/1/30 | 3.7% |
| Western Digital Corp., 3.00%, due 11/15/28 | 3.5% |
| Alphabet, Inc., 6.250%, Series A | 3.5% |
| Welltower OP LLC, 3.125%, due 7/15/29 | 2.7% |
| Hewlett Packard Enterprise Co., 7.625% | 2.2% |
| Lantheus Holdings, Inc., 2.625%, due 12/15/27 | 2.1% |
| Lumentum Holdings, Inc., 0.50%, due 6/15/28 | 2.0% |
| QXO, Inc., 5.50% | 1.8% |
| Boeing Co. (The), 6.00% | 1.7% |
| Uber Technologies, Inc., Series 2028, 0.875%, due 12/1/28 | 1.7% |
| * Excluding short-term investments |
Portfolio Composition
| Convertible Bonds | 80.3% |
| Convertible Preferred Stocks | 14.8% |
| Short-Term Investments | 7.8% |
| Other Assets, Less Liabilities | (2.9)% |
Top Ten Holdings and/or Issuers*
| MKS, Inc., 1.25%, due 6/1/30 | 3.7% |
| Western Digital Corp., 3.00%, due 11/15/28 | 3.5% |
| Alphabet, Inc., 6.250%, Series A | 3.5% |
| Welltower OP LLC, 3.125%, due 7/15/29 | 2.7% |
| Hewlett Packard Enterprise Co., 7.625% | 2.2% |
| Lantheus Holdings, Inc., 2.625%, due 12/15/27 | 2.1% |
| Lumentum Holdings, Inc., 0.50%, due 6/15/28 | 2.0% |
| QXO, Inc., 5.50% | 1.8% |
| Boeing Co. (The), 6.00% | 1.7% |
| Uber Technologies, Inc., Series 2028, 0.875%, due 12/1/28 | 1.7% |
| * Excluding short-term investments |
What were the Portfolio costs for the last six months?1
(Based on a hypothetical $10,000 investment)
| Share Class Name | Costs of a $10,000 investment | Costs paid as a percentage of a $10,000 investment2 |
| Service Class | $47 | 0.84% |
| 1. | Does not include any separate account or policy fees or charges imposed under the variable annuity policies and variable universal life insurance policies for which the Portfolio is an investment option. If they were included, your costs would be higher. |
| 2. | Annualized. |
Portfolio Performance
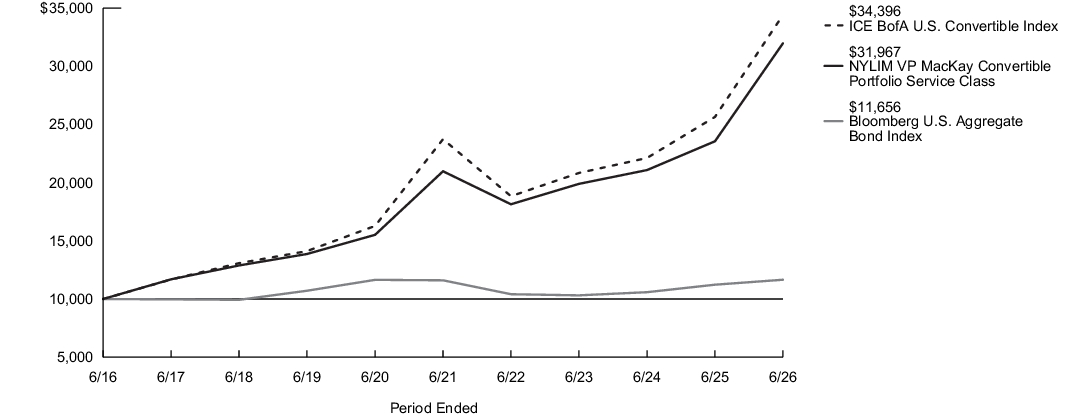
The following graph compares the initial and subsequent account values at the end of each of the most recently completed 10 semiannual reporting periods of the Portfolio (or for the life of the Portfolio, if shorter). It assumes a $10,000 initial investment at the beginning of the first fiscal period in an appropriate, broad-based securities market index and other indexes, if applicable, for the same period.
| Average Annual Total Returns for the Period Ended June 30, 2026 | Inception Date |
Six Months1 |
One Year |
Five Years |
Ten Years |
| Service Class Shares | 6/5/2003 | 24.41% | 35.73% | 8.79% | 12.32% |
| Bloomberg U.S. Aggregate Bond Index2 | 0.62% | 3.79% | 0.08% | 1.54% | |
| ICE BofA U.S. Convertible Index3 | 21.12% | 34.12% | 7.71% | 13.15% | |
| Morningstar Convertibles Category Average4 | 18.31% | 29.56% | 6.33% | 11.50% |
| 1. |
Not annualized. |
| 2. |
The Portfolio has selected the Bloomberg U.S. Aggregate Bond Index to represent a broad measure of market performance. The Bloomberg U.S. Aggregate Bond Index is a broad-based benchmark that measures the investment grade, U.S. dollar-denominated, fixed-rate taxable bond market, including Treasuries, government-related and corporate securities, mortgage-backed securities (agency fixed-rate and hybrid adjustable rate mortgage pass-throughs), asset-backed securities and commercial mortgage-backed securities. |
| 3. |
The ICE BofA U.S. Convertible Index, which is generally representative of the market sectors or types of investments in which the Portfolio invests, is a market-capitalization weighted index of domestic corporate convertible securities. In order to be included in the ICE BofA U.S. Convertible Index, bonds and preferred stocks must be convertible only to common stock. |
| 4. |
The Morningstar Convertibles Category Average is representative of funds that are designed to offer some of the capital-appreciation potential of stock portfolios while also supplying some of the safety and yield of bond portfolios. Results are based on average total returns of similar funds with all dividends and capital gain distributions reinvested. |
Key Portfolio Statistics
| Portfolio's net assets | $1,322,778,510 |
| Total number of portfolio holdings | 96 |
| Portfolio turnover rate | 20% |
Graphical Representation of Holdings
The tables below show the investment makeup of the Portfolio; percentages indicated are based on the Portfolio's net assets.
Top Ten Holdings and/or Issuers*
| MKS, Inc., 1.25%, due 6/1/30 | 3.7% |
| Western Digital Corp., 3.00%, due 11/15/28 | 3.5% |
| Alphabet, Inc., 6.250%, Series A | 3.5% |
| Welltower OP LLC, 3.125%, due 7/15/29 | 2.7% |
| Hewlett Packard Enterprise Co., 7.625% | 2.2% |
| Lantheus Holdings, Inc., 2.625%, due 12/15/27 | 2.1% |
| Lumentum Holdings, Inc., 0.50%, due 6/15/28 | 2.0% |
| QXO, Inc., 5.50% | 1.8% |
| Boeing Co. (The), 6.00% | 1.7% |
| Uber Technologies, Inc., Series 2028, 0.875%, due 12/1/28 | 1.7% |
| * Excluding short-term investments |
Portfolio Composition
| Convertible Bonds | 80.3% |
| Convertible Preferred Stocks | 14.8% |
| Short-Term Investments | 7.8% |
| Other Assets, Less Liabilities | (2.9)% |
Top Ten Holdings and/or Issuers*
| MKS, Inc., 1.25%, due 6/1/30 | 3.7% |
| Western Digital Corp., 3.00%, due 11/15/28 | 3.5% |
| Alphabet, Inc., 6.250%, Series A | 3.5% |
| Welltower OP LLC, 3.125%, due 7/15/29 | 2.7% |
| Hewlett Packard Enterprise Co., 7.625% | 2.2% |
| Lantheus Holdings, Inc., 2.625%, due 12/15/27 | 2.1% |
| Lumentum Holdings, Inc., 0.50%, due 6/15/28 | 2.0% |
| QXO, Inc., 5.50% | 1.8% |
| Boeing Co. (The), 6.00% | 1.7% |
| Uber Technologies, Inc., Series 2028, 0.875%, due 12/1/28 | 1.7% |
| * Excluding short-term investments |
What were the Portfolio costs for the last six months?1
(Based on a hypothetical $10,000 investment)
| Share Class Name | Costs of a $10,000 investment | Costs paid as a percentage of a $10,000 investment2,3 |
| Service Class | $50 | 0.93% |
| 1. | Does not include any separate account or policy fees or charges imposed under the variable annuity policies and variable universal life insurance policies for which the Portfolio is an investment option. If they were included, your costs would be higher. |
| 2. | Reflects fee waivers and/or expense reimbursements, without which expenses would have been higher. |
| 3. | Annualized. |
Portfolio Performance
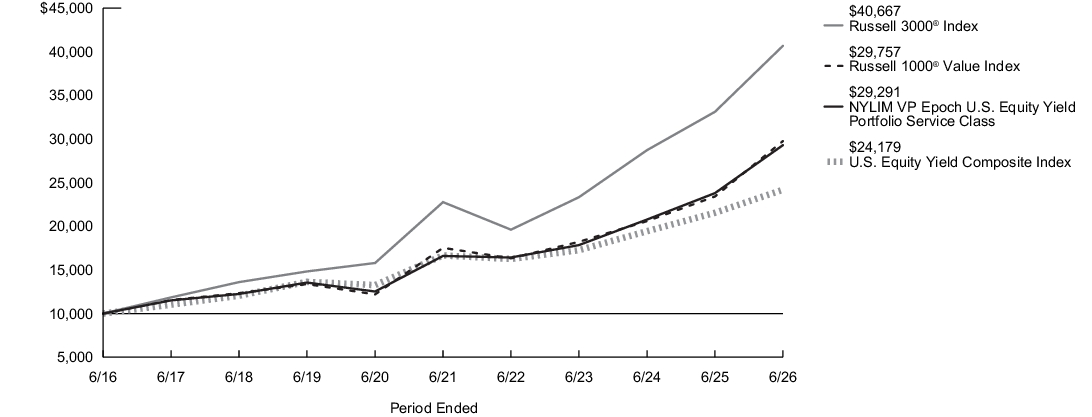
The following graph compares the initial and subsequent account values at the end of each of the most recently completed 10 semiannual reporting periods of the Portfolio (or for the life of the Portfolio, if shorter). It assumes a $10,000 initial investment at the beginning of the first fiscal period in an appropriate, broad-based securities market index and other indexes, if applicable, for the same period. The Portfolio's subadvisor changed effective January 9, 2017, and its principal investment strategies changed effective March 13, 2017. The past performance in the graph and table prior to those dates reflects the Portfolio’s prior subadvisor and principal investment strategies.
| Average Annual Total Returns for the Period Ended June 30, 2026 | Inception Date |
Six Months1 |
One Year |
Five Years |
Ten Years |
| Service Class Shares | 6/5/2003 | 14.86% | 23.09% | 12.03% | 11.35% |
| Russell 3000®Index2 | 10.86% | 22.81% | 12.30% | 15.06% | |
| Russell 1000® Value Index3 | 16.23% | 27.09% | 11.17% | 11.52% | |
| U.S. Equity Yield Composite Index4 | 7.75% | 12.22% | 7.74% | 9.23% | |
| Morningstar Large Value Category Average5 | 11.30% | 21.21% | 10.48% | 11.47% |
| 1. |
Not annualized. |
| 2. |
The Portfolio has selected the Russell 3000® Index to represent a broad measure of market performance. The Russell 3000® Index measures the performance of the largest 3,000 U.S. companies representing approximately 98% of the investable U.S. equity market. |
| 3. |
The Russell 1000® Value Index, which is generally representative of the market sectors or types of investments in which the Portfolio invests, measures the performance of the large-cap value segment of the U.S. equity universe. It includes those Russell 1000® Index companies with lower price-to-book ratios and lower expected growth values. |
| 4. |
The U.S. Equity Yield Composite Index, which is generally representative of the market sectors or types of investments in which the Portfolio invests, consists of the MSCI USA High Dividend Yield Index and the MSCI USA Minimum Volatility (USD) Index weighted at 60% and 40%, respectively. The MSCI USA High Dividend Yield Index is based on the MSCI USA Index and includes large- and mid-cap stocks. The MSCI USA High Dividend Yield Index is designed to reflect the performance of equities in the MSCI USA Index (excluding real estate investment trusts) with higher dividend income and quality characteristics than average dividend yields that are both sustainable and persistent. The MSCI USA Minimum Volatility (USD) Index aims to reflect the performance characteristics of a minimum variance strategy applied to the large- and mid-cap U.S. equity universe. The MSCI USA Minimum Volatility (USD) Index is calculated by optimizing the MSCI USA Index in U.S. dollars for the lowest absolute risk (within a given set of constraints). |
| 5. |
The Morningstar Large Value Category Average is representative of funds that invest primarily in big U.S. companies that are less expensive or growing more slowly than other large-cap stocks. Results are based on average total returns of similar funds with all dividends and capital gain distributions reinvested. |
Key Portfolio Statistics
| Portfolio's net assets | $940,928,088 |
| Total number of portfolio holdings | 110 |
| Portfolio turnover rate | 15% |
Graphical Representation of Holdings
The tables below show the investment makeup of the Portfolio; percentages indicated are based on the Portfolio's net assets.
Top Ten Holdings and/or Issuers*
| Dell Technologies, Inc., Class C | 2.3% |
| Cisco Systems, Inc. | 2.3% |
| JPMorgan Chase & Co. | 2.2% |
| Bank of America Corp. | 2.1% |
| Johnson & Johnson | 2.0% |
| CVS Health Corp. | 2.0% |
| AbbVie, Inc. | 1.8% |
| Broadcom, Inc. | 1.8% |
| MetLife, Inc. | 1.7% |
| Hewlett Packard Enterprise Co. | 1.7% |
| * Excluding short-term investments |
Top Industries
| Banks | 8.5% |
| Semiconductors & Semiconductor Equipment | 7.3% |
| Pharmaceuticals | 6.1% |
| Electric Utilities | 5.9% |
| Technology Hardware, Storage & Peripherals | 5.7% |
| Oil, Gas & Consumable Fuels | 4.3% |
| Insurance | 4.2% |
| Chemicals | 3.3% |
| Health Care Providers & Services | 3.3% |
| Electrical Equipment | 3.0% |
| Other | 48.4% |
Top Ten Holdings and/or Issuers*
| Dell Technologies, Inc., Class C | 2.3% |
| Cisco Systems, Inc. | 2.3% |
| JPMorgan Chase & Co. | 2.2% |
| Bank of America Corp. | 2.1% |
| Johnson & Johnson | 2.0% |
| CVS Health Corp. | 2.0% |
| AbbVie, Inc. | 1.8% |
| Broadcom, Inc. | 1.8% |
| MetLife, Inc. | 1.7% |
| Hewlett Packard Enterprise Co. | 1.7% |
| * Excluding short-term investments |
What were the Portfolio costs for the last six months?1
(Based on a hypothetical $10,000 investment)
| Share Class Name | Costs of a $10,000 investment | Costs paid as a percentage of a $10,000 investment2,3 |
| Initial Class | $36 | 0.68% |
| 1. | Does not include any separate account or policy fees or charges imposed under the variable annuity policies and variable universal life insurance policies for which the Portfolio is an investment option. If they were included, your costs would be higher. |
| 2. | Reflects fee waivers and/or expense reimbursements, without which expenses would have been higher. |
| 3. | Annualized. |
Portfolio Performance
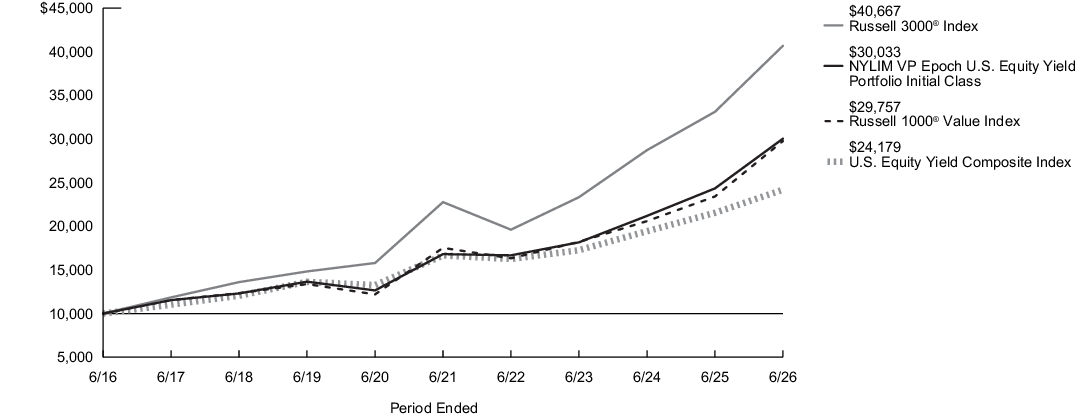
The following graph compares the initial and subsequent account values at the end of each of the most recently completed 10 semiannual reporting periods of the Portfolio (or for the life of the Portfolio, if shorter). It assumes a $10,000 initial investment at the beginning of the first fiscal period in an appropriate, broad-based securities market index and other indexes, if applicable, for the same period. The Portfolio's subadvisor changed effective January 9, 2017, and its principal investment strategies changed effective March 13, 2017. The past performance in the graph and table prior to those dates reflects the Portfolio’s prior subadvisor and principal investment strategies.
| Average Annual Total Returns for the Period Ended June 30, 2026 | Inception Date |
Six Months1 |
One Year |
Five Years |
Ten Years |
| Initial Class Shares | 5/1/1998 | 15.00% | 23.40% | 12.31% | 11.62% |
| Russell 3000®Index2 | 10.86% | 22.81% | 12.30% | 15.06% | |
| Russell 1000® Value Index3 | 16.23% | 27.09% | 11.17% | 11.52% | |
| U.S. Equity Yield Composite Index4 | 7.75% | 12.22% | 7.74% | 9.23% | |
| Morningstar Large Value Category Average5 | 11.30% | 21.21% | 10.48% | 11.47% |
| 1. |
Not annualized. |
| 2. |
The Portfolio has selected the Russell 3000® Index to represent a broad measure of market performance. The Russell 3000® Index measures the performance of the largest 3,000 U.S. companies representing approximately 98% of the investable U.S. equity market. |
| 3. |
The Russell 1000® Value Index, which is generally representative of the market sectors or types of investments in which the Portfolio invests, measures the performance of the large-cap value segment of the U.S. equity universe. It includes those Russell 1000® Index companies with lower price-to-book ratios and lower expected growth values. |
| 4. |
The U.S. Equity Yield Composite Index, which is generally representative of the market sectors or types of investments in which the Portfolio invests, consists of the MSCI USA High Dividend Yield Index and the MSCI USA Minimum Volatility (USD) Index weighted at 60% and 40%, respectively. The MSCI USA High Dividend Yield Index is based on the MSCI USA Index and includes large- and mid-cap stocks. The MSCI USA High Dividend Yield Index is designed to reflect the performance of equities in the MSCI USA Index (excluding real estate investment trusts) with higher dividend income and quality characteristics than average dividend yields that are both sustainable and persistent. The MSCI USA Minimum Volatility (USD) Index aims to reflect the performance characteristics of a minimum variance strategy applied to the large- and mid-cap U.S. equity universe. The MSCI USA Minimum Volatility (USD) Index is calculated by optimizing the MSCI USA Index in U.S. dollars for the lowest absolute risk (within a given set of constraints). |
| 5. |
The Morningstar Large Value Category Average is representative of funds that invest primarily in big U.S. companies that are less expensive or growing more slowly than other large-cap stocks. Results are based on average total returns of similar funds with all dividends and capital gain distributions reinvested. |
Key Portfolio Statistics
| Portfolio's net assets | $940,928,088 |
| Total number of portfolio holdings | 110 |
| Portfolio turnover rate | 15% |
Graphical Representation of Holdings
The tables below show the investment makeup of the Portfolio; percentages indicated are based on the Portfolio's net assets.
Top Ten Holdings and/or Issuers*
| Dell Technologies, Inc., Class C | 2.3% |
| Cisco Systems, Inc. | 2.3% |
| JPMorgan Chase & Co. | 2.2% |
| Bank of America Corp. | 2.1% |
| Johnson & Johnson | 2.0% |
| CVS Health Corp. | 2.0% |
| AbbVie, Inc. | 1.8% |
| Broadcom, Inc. | 1.8% |
| MetLife, Inc. | 1.7% |
| Hewlett Packard Enterprise Co. | 1.7% |
| * Excluding short-term investments |
Top Industries
| Banks | 8.5% |
| Semiconductors & Semiconductor Equipment | 7.3% |
| Pharmaceuticals | 6.1% |
| Electric Utilities | 5.9% |
| Technology Hardware, Storage & Peripherals | 5.7% |
| Oil, Gas & Consumable Fuels | 4.3% |
| Insurance | 4.2% |
| Chemicals | 3.3% |
| Health Care Providers & Services | 3.3% |
| Electrical Equipment | 3.0% |
| Other | 48.4% |
Top Ten Holdings and/or Issuers*
| Dell Technologies, Inc., Class C | 2.3% |
| Cisco Systems, Inc. | 2.3% |
| JPMorgan Chase & Co. | 2.2% |
| Bank of America Corp. | 2.1% |
| Johnson & Johnson | 2.0% |
| CVS Health Corp. | 2.0% |
| AbbVie, Inc. | 1.8% |
| Broadcom, Inc. | 1.8% |
| MetLife, Inc. | 1.7% |
| Hewlett Packard Enterprise Co. | 1.7% |
| * Excluding short-term investments |
What were the Portfolio costs for the last six months?1
(Based on a hypothetical $10,000 investment)
| Share Class Name | Costs of a $10,000 investment | Costs paid as a percentage of a $10,000 investment2,3 |
| Initial Class | $38 | 0.75% |
| 1. | Does not include any separate account or policy fees or charges imposed under the variable annuity policies and variable universal life insurance policies for which the Portfolio is an investment option. If they were included, your costs would be higher. |
| 2. | Reflects fee waivers and/or expense reimbursements, without which expenses would have been higher. |
| 3. | Annualized. |
Portfolio Performance
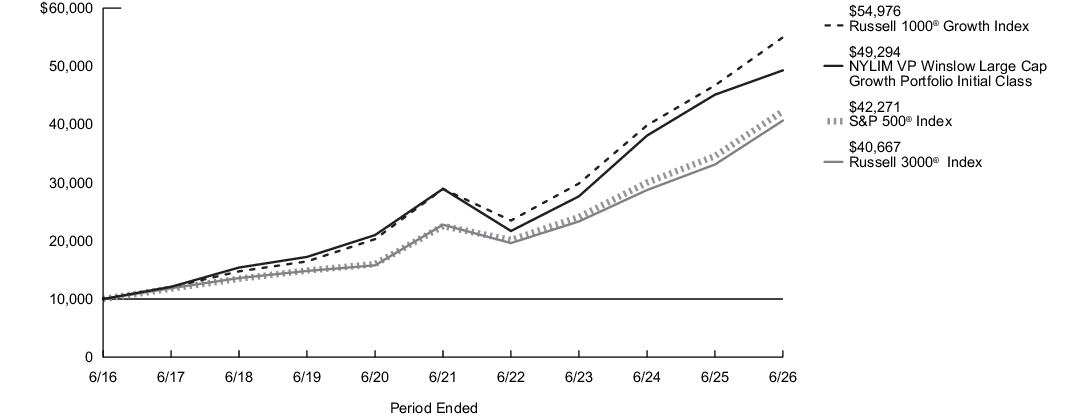
The following graph compares the initial and subsequent account values at the end of each of the most recently completed 10 semiannual reporting periods of the Portfolio (or for the life of the Portfolio, if shorter). It assumes a $10,000 initial investment at the beginning of the first fiscal period in an appropriate, broad-based securities market index and other indexes, if applicable, for the same period.
| Average Annual Total Returns for the Period Ended June 30, 2026 | Inception Date |
Six Months1 |
One Year |
Five Years |
Ten Years |
| Initial Class Shares | 5/1/1998 | 5.64% | 9.27% | 11.24% | 17.29% |
| Russell 3000®Index2 | 10.86% | 22.81% | 12.30% | 15.06% | |
| Russell 1000® Growth Index3 | 5.33% | 17.71% | 13.71% | 18.58% | |
| S&P 500®Index4 | 10.21% | 22.33% | 13.41% | 15.51% | |
| Morningstar Large Growth Category Average5 | 9.00% | 18.29% | 10.51% | 16.40% |
| 1. |
Not annualized. |
| 2. |
The Portfolio has selected the Russell 3000® Index to represent a broad measure of market performance. The Russell 3000® Index measures the performance of the largest 3,000 U.S. companies representing approximately 98% of the investable U.S. equity market. |
| 3. |
The Russell 1000® Growth Index, which is generally representative of the market sectors or types of investments in which the Portfolio invests, measures the performance of the large-cap growth segment of the U.S. equity universe. It includes those Russell 1000® Index companies with higher price-to-book ratios and higher forecasted growth values. |
| 4. |
The S&P 500® Index, which represents a broad measure of market performance, is generally representative of the market sectors or types of investments in which the Portfolio invests. S&P® and S&P 500® are registered trademarks of Standard & Poor’s Financial Services LLC. The S&P 500® Index is widely regarded as the standard index for measuring large-cap U.S. stock market performance. |
| 5. |
The Morningstar Large Growth Category Average is representative of funds that invest primarily in big U.S. companies that are projected to grow faster than other large-cap stocks. Stocks in the top 70% of the capitalization of the U.S. equity market are defined as large cap. Growth is defined based on fast growth and high valuations. Most of these funds focus on companies in rapidly expanding industries. Results are based on average total returns of similar funds with all dividends and capital gain distributions reinvested. |
Key Portfolio Statistics
| Portfolio's net assets | $1,966,427,223 |
| Total number of portfolio holdings | 57 |
| Portfolio turnover rate | 56% |
Graphical Representation of Holdings
The tables below show the investment makeup of the Portfolio; percentages indicated are based on the Portfolio's net assets.
Top Ten Holdings and/or Issuers*
| Alphabet, Inc., Class C | 10.0% |
| NVIDIA Corp. | 9.0% |
| Broadcom, Inc. | 5.7% |
| Apple, Inc. | 4.6% |
| Amazon.com, Inc. | 3.9% |
| KLA Corp. | 3.2% |
| Eli Lilly & Co. | 2.9% |
| Advanced Micro Devices, Inc. | 2.9% |
| Microsoft Corp. | 2.9% |
| Meta Platforms, Inc., Class A | 2.6% |
| * Excluding short-term investments |
Top Industries
| Semiconductors & Semiconductor Equipment | 27.8% |
| Interactive Media & Services | 12.6% |
| Software | 7.8% |
| Technology Hardware, Storage & Peripherals | 7.2% |
| Aerospace & Defense | 5.2% |
| Financial Services | 4.0% |
| Broadline Retail | 3.9% |
| Pharmaceuticals | 3.9% |
| Communications Equipment | 3.7% |
| Electrical Equipment | 3.0% |
| Other | 20.9% |
Top Ten Holdings and/or Issuers*
| Alphabet, Inc., Class C | 10.0% |
| NVIDIA Corp. | 9.0% |
| Broadcom, Inc. | 5.7% |
| Apple, Inc. | 4.6% |
| Amazon.com, Inc. | 3.9% |
| KLA Corp. | 3.2% |
| Eli Lilly & Co. | 2.9% |
| Advanced Micro Devices, Inc. | 2.9% |
| Microsoft Corp. | 2.9% |
| Meta Platforms, Inc., Class A | 2.6% |
| * Excluding short-term investments |
What were the Portfolio costs for the last six months?1
(Based on a hypothetical $10,000 investment)
| Share Class Name | Costs of a $10,000 investment | Costs paid as a percentage of a $10,000 investment2,3 |
| Service Class | $51 | 1.00% |
| 1. | Does not include any separate account or policy fees or charges imposed under the variable annuity policies and variable universal life insurance policies for which the Portfolio is an investment option. If they were included, your costs would be higher. |
| 2. | Reflects fee waivers and/or expense reimbursements, without which expenses would have been higher. |
| 3. | Annualized. |
Portfolio Performance
The following graph compares the initial and subsequent account values at the end of each of the most recently completed 10 semiannual reporting periods of the Portfolio (or for the life of the Portfolio, if shorter). It assumes a $10,000 initial investment at the beginning of the first fiscal period in an appropriate, broad-based securities market index and other indexes, if applicable, for the same period.
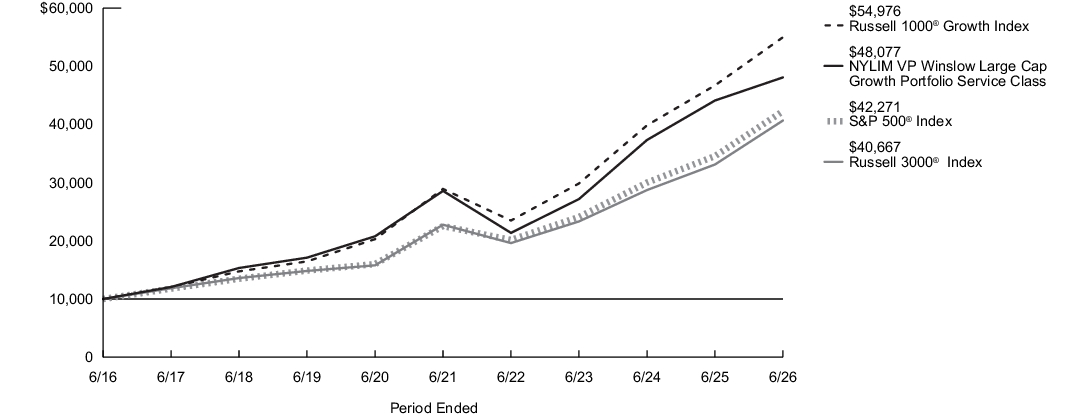
| Average Annual Total Returns for the Period Ended June 30, 2026 | Inception Date |
Six Months1 |
One Year |
Five Years |
Ten Years |
| Service Class Shares | 6/6/2003 | 5.51% | 9.00% | 10.96% | 17.00% |
| Russell 3000®Index2 | 10.86% | 22.81% | 12.30% | 15.06% | |
| Russell 1000® Growth Index3 | 5.33% | 17.71% | 13.71% | 18.58% | |
| S&P 500®Index4 | 10.21% | 22.33% | 13.41% | 15.51% | |
| Morningstar Large Growth Category Average5 | 9.00% | 18.29% | 10.51% | 16.40% |
| 1. |
Not annualized. |
| 2. |
The Portfolio has selected the Russell 3000® Index to represent a broad measure of market performance. The Russell 3000® Index measures the performance of the largest 3,000 U.S. companies representing approximately 98% of the investable U.S. equity market. |
| 3. |
The Russell 1000® Growth Index, which is generally representative of the market sectors or types of investments in which the Portfolio invests, measures the performance of the large-cap growth segment of the U.S. equity universe. It includes those Russell 1000® Index companies with higher price-to-book ratios and higher forecasted growth values. |
| 4. |
The S&P 500® Index, which represents a broad measure of market performance, is generally representative of the market sectors or types of investments in which the Portfolio invests. S&P® and S&P 500® are registered trademarks of Standard & Poor’s Financial Services LLC. The S&P 500® Index is widely regarded as the standard index for measuring large-cap U.S. stock market performance. |
| 5. |
The Morningstar Large Growth Category Average is representative of funds that invest primarily in big U.S. companies that are projected to grow faster than other large-cap stocks. Stocks in the top 70% of the capitalization of the U.S. equity market are defined as large cap. Growth is defined based on fast growth and high valuations. Most of these funds focus on companies in rapidly expanding industries. Results are based on average total returns of similar funds with all dividends and capital gain distributions reinvested. |
Key Portfolio Statistics
| Portfolio's net assets | $1,966,427,223 |
| Total number of portfolio holdings | 57 |
| Portfolio turnover rate | 56% |
Graphical Representation of Holdings
The tables below show the investment makeup of the Portfolio; percentages indicated are based on the Portfolio's net assets.
Top Ten Holdings and/or Issuers*
| Alphabet, Inc., Class C | 10.0% |
| NVIDIA Corp. | 9.0% |
| Broadcom, Inc. | 5.7% |
| Apple, Inc. | 4.6% |
| Amazon.com, Inc. | 3.9% |
| KLA Corp. | 3.2% |
| Eli Lilly & Co. | 2.9% |
| Advanced Micro Devices, Inc. | 2.9% |
| Microsoft Corp. | 2.9% |
| Meta Platforms, Inc., Class A | 2.6% |
| * Excluding short-term investments |
Top Industries
| Semiconductors & Semiconductor Equipment | 27.8% |
| Interactive Media & Services | 12.6% |
| Software | 7.8% |
| Technology Hardware, Storage & Peripherals | 7.2% |
| Aerospace & Defense | 5.2% |
| Financial Services | 4.0% |
| Broadline Retail | 3.9% |
| Pharmaceuticals | 3.9% |
| Communications Equipment | 3.7% |
| Electrical Equipment | 3.0% |
| Other | 20.9% |
Top Ten Holdings and/or Issuers*
| Alphabet, Inc., Class C | 10.0% |
| NVIDIA Corp. | 9.0% |
| Broadcom, Inc. | 5.7% |
| Apple, Inc. | 4.6% |
| Amazon.com, Inc. | 3.9% |
| KLA Corp. | 3.2% |
| Eli Lilly & Co. | 2.9% |
| Advanced Micro Devices, Inc. | 2.9% |
| Microsoft Corp. | 2.9% |
| Meta Platforms, Inc., Class A | 2.6% |
| * Excluding short-term investments |
What were the Portfolio costs for the last six months?1
(Based on a hypothetical $10,000 investment)
| Share Class Name | Costs of a $10,000 investment | Costs paid as a percentage of a $10,000 investment2,3 |
| Service Class | $59 | 1.08% |
| 1. | Does not include any separate account or policy fees or charges imposed under the variable annuity policies and variable universal life insurance policies for which the Portfolio is an investment option. If they were included, your costs would be higher. |
| 2. | Reflects fee waivers and/or expense reimbursements, without which expenses would have been higher. |
| 3. | Annualized. |
Portfolio Performance
The following graph compares the initial and subsequent account values at the end of each of the most recently completed 10 semiannual reporting periods of the Portfolio (or for the life of the Portfolio, if shorter). It assumes a $10,000 initial investment at the beginning of the first fiscal period in an appropriate, broad-based securities market index and other indexes, if applicable, for the same period. The Portfolio’s subadvisor changed effective January 1, 2018 due to an organizational restructuring whereby all investment personnel of Cornerstone Capital Management Holdings LLC, the former subadvisor, transitioned to MacKay Shields LLC. Effective May 1, 2021, the Portfolio replaced its subadvisor and modified its principal investment strategies. Effective August 12, 2024, the Portfolio again replaced its subadvisor and modified its principal investment strategies. The past performance in the graph and table prior to that date reflects the Portfolio’s prior subadvisors and principal investment strategies.
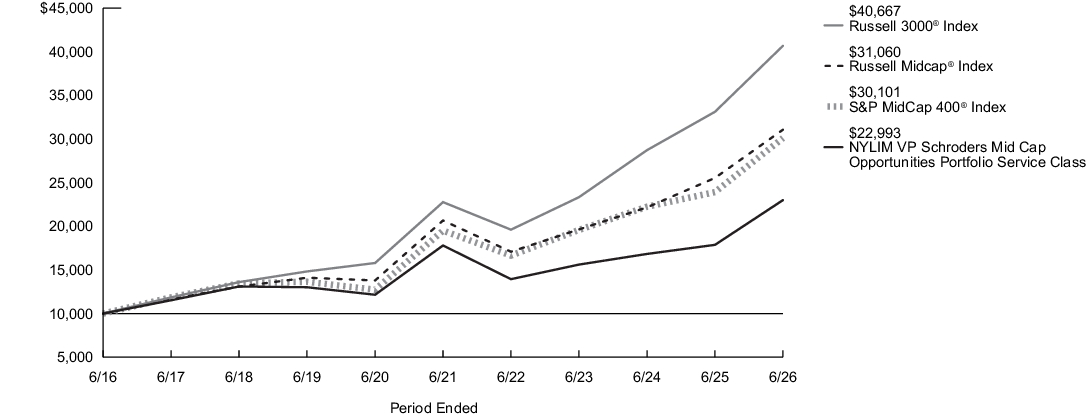
| Average Annual Total Returns for the Period Ended June 30, 2026 | Inception Date |
Six Months1 |
One Year |
Five Years |
Ten Years |
| Service Class Shares | 6/5/2003 | 18.49% | 28.66% | 5.25% | 8.68% |
| Russell 3000®Index2 | 10.86% | 22.81% | 12.30% | 15.06% | |
| Russell Midcap®Index3 | 15.30% | 21.63% | 8.50% | 12.00% | |
| S&P MidCap 400®Index4 | 17.34% | 25.89% | 9.07% | 11.65% | |
| Morningstar Mid-Cap Blend Category Average5 | 15.88% | 23.75% | 8.80% | 11.52% |
| 1. |
Not annualized. |
| 2. |
The Portfolio has selected the Russell 3000® Index to represent a broad measure of market performance. The Russell 3000® Index measures the performance of the largest 3,000 U.S. companies representing approximately 98% of the investable U.S. equity market. |
| 3. |
The Russell Midcap® Index, which is generally representative of the market sectors or types of investments in which the Portfolio invests, measures the performance of the mid-cap segment of the U.S. equity universe. The Russell Midcap® Index is a subset of the Russell 1000® Index and includes approximately 800 of the smallest companies based on a combination of their market cap and current index membership. The Russell Midcap® Index represents approximately 27% of the total market capitalization of the Russell 1000® Index companies. |
| 4. |
The S&P MidCap 400® Index, which is generally representative of the market sectors or types of investments in which the Portfolio invests, is a market capitalization-weighted index of common stocks representing the mid-cap U.S. equity market. |
| 5. |
The Morningstar Mid-Cap Blend Category Average is representative of funds that invest primarily in U.S. stocks of various sizes and styles, giving it a middle-of-the-road profile. The U.S. mid-cap range for market capitalization typically falls between $1 billion and $8 billion and represents 20% of the total capitalization of the U.S. equity market. The blend style is assigned to funds where neither growth nor value characteristics predominate. Results are based on average total returns of similar funds with all dividends and capital gain distributions reinvested. |
Key Portfolio Statistics
| Portfolio's net assets | $724,254,861 |
| Total number of portfolio holdings | 74 |
| Portfolio turnover rate | 39% |
Graphical Representation of Holdings
The tables below show the investment makeup of the Portfolio; percentages indicated are based on the Portfolio's net assets.
Top Ten Holdings and/or Issuers*
| Aramark | 2.7% |
| Bio-Techne Corp. | 2.2% |
| Assurant, Inc. | 2.1% |
| West Pharmaceutical Services, Inc. | 2.1% |
| Mettler-Toledo International, Inc. | 2.0% |
| Burlington Stores, Inc. | 1.9% |
| Snowflake, Inc., Class A | 1.8% |
| BWX Technologies, Inc. | 1.8% |
| TechnipFMC plc | 1.8% |
| Keysight Technologies, Inc. | 1.8% |
| * Excluding short-term investments |
Top Industries
| Electronic Equipment, Instruments & Components | 10.7% |
| Hotels, Restaurants & Leisure | 6.2% |
| Life Sciences Tools & Services | 6.2% |
| Insurance | 5.3% |
| Commercial Services & Supplies | 5.2% |
| IT Services | 4.8% |
| Building Products | 4.4% |
| Machinery | 4.0% |
| Oil, Gas & Consumable Fuels | 3.6% |
| Professional Services | 3.3% |
| Other | 46.3% |
Top Ten Holdings and/or Issuers*
| Aramark | 2.7% |
| Bio-Techne Corp. | 2.2% |
| Assurant, Inc. | 2.1% |
| West Pharmaceutical Services, Inc. | 2.1% |
| Mettler-Toledo International, Inc. | 2.0% |
| Burlington Stores, Inc. | 1.9% |
| Snowflake, Inc., Class A | 1.8% |
| BWX Technologies, Inc. | 1.8% |
| TechnipFMC plc | 1.8% |
| Keysight Technologies, Inc. | 1.8% |
| * Excluding short-term investments |
What were the Portfolio costs for the last six months?1
(Based on a hypothetical $10,000 investment)
| Share Class Name | Costs of a $10,000 investment | Costs paid as a percentage of a $10,000 investment2,3 |
| Initial Class | $45 | 0.83% |
| 1. | Does not include any separate account or policy fees or charges imposed under the variable annuity policies and variable universal life insurance policies for which the Portfolio is an investment option. If they were included, your costs would be higher. |
| 2. | Reflects fee waivers and/or expense reimbursements, without which expenses would have been higher. |
| 3. | Annualized. |
Portfolio Performance
The following graph compares the initial and subsequent account values at the end of each of the most recently completed 10 semiannual reporting periods of the Portfolio (or for the life of the Portfolio, if shorter). It assumes a $10,000 initial investment at the beginning of the first fiscal period in an appropriate, broad-based securities market index and other indexes, if applicable, for the same period. The Portfolio’s subadvisor changed effective January 1, 2018 due to an organizational restructuring whereby all investment personnel of Cornerstone Capital Management Holdings LLC, the former subadvisor, transitioned to MacKay Shields LLC. Effective May 1, 2021, the Portfolio replaced its subadvisor and modified its principal investment strategies. Effective August 12, 2024, the Portfolio again replaced its subadvisor and modified its principal investment strategies. The past performance in the graph and table prior to that date reflects the Portfolio’s prior subadvisors and principal investment strategies.
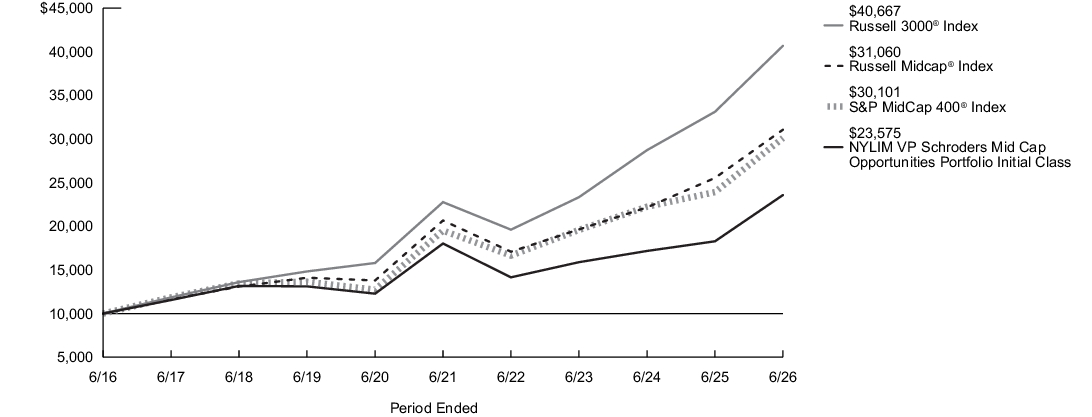
| Average Annual Total Returns for the Period Ended June 30, 2026 | Inception Date |
Six Months1 |
One Year |
Five Years |
Ten Years |
| Initial Class Shares | 7/2/2001 | 18.64% | 28.98% | 5.52% | 8.95% |
| Russell 3000®Index2 | 10.86% | 22.81% | 12.30% | 15.06% | |
| Russell Midcap®Index3 | 15.30% | 21.63% | 8.50% | 12.00% | |
| S&P MidCap 400®Index4 | 17.34% | 25.89% | 9.07% | 11.65% | |
| Morningstar Mid-Cap Blend Category Average5 | 15.88% | 23.75% | 8.80% | 11.52% |
| 1. |
Not annualized. |
| 2. |
The Portfolio has selected the Russell 3000® Index to represent a broad measure of market performance. The Russell 3000® Index measures the performance of the largest 3,000 U.S. companies representing approximately 98% of the investable U.S. equity market. |
| 3. |
The Russell Midcap® Index, which is generally representative of the market sectors or types of investments in which the Portfolio invests, measures the performance of the mid-cap segment of the U.S. equity universe. The Russell Midcap® Index is a subset of the Russell 1000® Index and includes approximately 800 of the smallest companies based on a combination of their market cap and current index membership. The Russell Midcap® Index represents approximately 27% of the total market capitalization of the Russell 1000® Index companies. |
| 4. |
The S&P MidCap 400® Index, which is generally representative of the market sectors or types of investments in which the Portfolio invests, is a market capitalization-weighted index of common stocks representing the mid-cap U.S. equity market. |
| 5. |
The Morningstar Mid-Cap Blend Category Average is representative of funds that invest primarily in U.S. stocks of various sizes and styles, giving it a middle-of-the-road profile. The U.S. mid-cap range for market capitalization typically falls between $1 billion and $8 billion and represents 20% of the total capitalization of the U.S. equity market. The blend style is assigned to funds where neither growth nor value characteristics predominate. Results are based on average total returns of similar funds with all dividends and capital gain distributions reinvested. |
Key Portfolio Statistics
| Portfolio's net assets | $724,254,861 |
| Total number of portfolio holdings | 74 |
| Portfolio turnover rate | 39% |
Graphical Representation of Holdings
The tables below show the investment makeup of the Portfolio; percentages indicated are based on the Portfolio's net assets.
Top Ten Holdings and/or Issuers*
| Aramark | 2.7% |
| Bio-Techne Corp. | 2.2% |
| Assurant, Inc. | 2.1% |
| West Pharmaceutical Services, Inc. | 2.1% |
| Mettler-Toledo International, Inc. | 2.0% |
| Burlington Stores, Inc. | 1.9% |
| Snowflake, Inc., Class A | 1.8% |
| BWX Technologies, Inc. | 1.8% |
| TechnipFMC plc | 1.8% |
| Keysight Technologies, Inc. | 1.8% |
| * Excluding short-term investments |
Top Industries
| Electronic Equipment, Instruments & Components | 10.7% |
| Hotels, Restaurants & Leisure | 6.2% |
| Life Sciences Tools & Services | 6.2% |
| Insurance | 5.3% |
| Commercial Services & Supplies | 5.2% |
| IT Services | 4.8% |
| Building Products | 4.4% |
| Machinery | 4.0% |
| Oil, Gas & Consumable Fuels | 3.6% |
| Professional Services | 3.3% |
| Other | 46.3% |
Top Ten Holdings and/or Issuers*
| Aramark | 2.7% |
| Bio-Techne Corp. | 2.2% |
| Assurant, Inc. | 2.1% |
| West Pharmaceutical Services, Inc. | 2.1% |
| Mettler-Toledo International, Inc. | 2.0% |
| Burlington Stores, Inc. | 1.9% |
| Snowflake, Inc., Class A | 1.8% |
| BWX Technologies, Inc. | 1.8% |
| TechnipFMC plc | 1.8% |
| Keysight Technologies, Inc. | 1.8% |
| * Excluding short-term investments |
What were the Portfolio costs for the last six months?1
(Based on a hypothetical $10,000 investment)
| Share Class Name | Costs of a $10,000 investment | Costs paid as a percentage of a $10,000 investment2 |
| Initial Class | $28 | 0.54% |
| 1. | Does not include any separate account or policy fees or charges imposed under the variable annuity policies and variable universal life insurance policies for which the Portfolio is an investment option. If they were included, your costs would be higher. |
| 2. | Annualized. |
Portfolio Performance
The following graph compares the initial and subsequent account values at the end of each of the most recently completed 10 semiannual reporting periods of the Portfolio (or for the life of the Portfolio, if shorter). It assumes a $10,000 initial investment at the beginning of the first fiscal period in an appropriate, broad-based securities market index and other indexes, if applicable, for the same period. Effective January 1, 2018, due to an organizational restructuring, all investment personnel of Cornerstone Capital Management Holdings LLC, the former subadvisor, transitioned to MacKay Shields LLC, the former subadvisor. Effective May 1, 2021, the Portfolio replaced its subadvisor and modified its principal investment strategies. Effective August 12, 2024, the Portfolio again replaced its subadvisor and modified its principal investment strategies. The past performance in the graph and table prior to that date reflects the Portfolio's prior subadvisors and principal investment strategies.
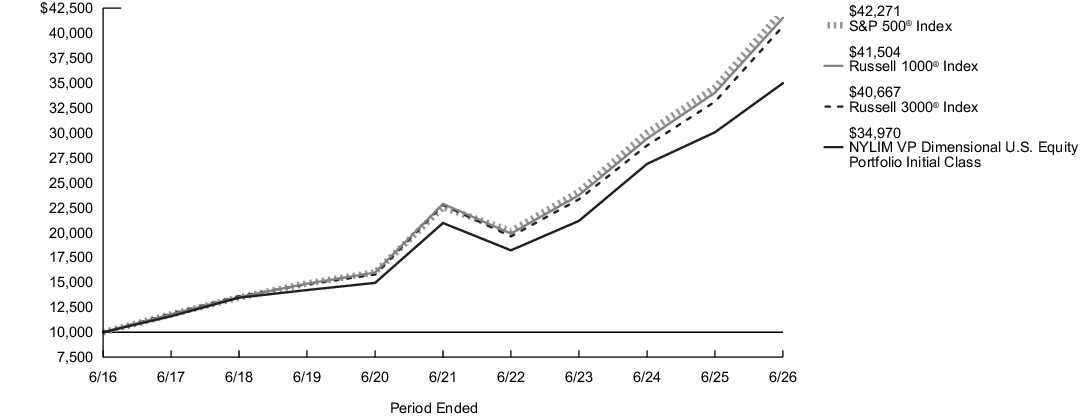
| Average Annual Total Returns for the Period Ended June 30, 2026 | Inception Date |
Six Months1 |
One Year |
Five Years |
Ten Years |
| Initial Class Shares | 1/23/1984 | 8.23% | 16.39% | 10.79% | 13.34% |
| Russell 3000®Index2 | 10.86% | 22.81% | 12.30% | 15.06% | |
| Russell 1000®Index3 | 10.32% | 22.01% | 12.66% | 15.29% | |
| S&P 500®Index4 | 10.21% | 22.33% | 13.41% | 15.51% | |
| Morningstar Large Blend Category Average5 | 9.74% | 20.23% | 11.51% | 14.04% |
| 1. |
Not annualized. |
| 2. |
The Portfolio has selected the Russell 3000® Index to represent a broad measure of market performance. The Russell 3000® Index measures the performance of the largest 3,000 U.S. companies representing approximately 98% of the investable U.S. equity market. |
| 3. |
The Russell 1000® Index, which is generally representative of the market sectors or types of investments in which the Portfolio invests, measures the performance of the large-cap segment of the U.S. equity universe. It is a subset of the Russell 3000® Index and includes approximately 1,000 of the largest securities based on a combination of their market cap and current index membership. |
| 4. |
The S&P 500® Index is generally representative of the market sectors or types of investments in which the Portfolio invests. S&P® and S&P 500® are registered trademarks of Standard & Poor’s Financial Services LLC. The S&P 500® Index is widely regarded as the standard index for measuring large-cap U.S. stock market performance. |
| 5. |
The Morningstar Large Blend Category Average is representative of funds that represent the overall U.S. stock market in size, growth rates and price. Stocks in the top 70% of the capitalization of the U.S. equity market are defined as large cap. The blend style is assigned to funds where neither growth nor value characteristics predominate. These funds tend to invest across the spectrum of U.S. industries, and owing to their broad exposure, the funds' returns are often similar to those of the S&P 500® Index. Results are based on average total returns of similar funds with all dividends and capital gain distributions reinvested. |
Key Portfolio Statistics
| Portfolio's net assets | $962,140,754 |
| Total number of portfolio holdings | 117 |
| Portfolio turnover rate | 5% |
Graphical Representation of Holdings
The tables below show the investment makeup of the Portfolio; percentages indicated are based on the Portfolio's net assets.
Top Ten Holdings and/or Issuers*
| NVIDIA Corp. | 7.5% |
| Apple, Inc. | 6.8% |
| Eli Lilly & Co. | 4.7% |
| Visa, Inc., Class A | 4.4% |
| Microsoft Corp. | 4.1% |
| Lam Research Corp. | 3.7% |
| Caterpillar, Inc. | 3.3% |
| KLA Corp. | 2.7% |
| Meta Platforms, Inc., Class A | 2.6% |
| Mastercard, Inc., Class A | 2.5% |
| * Excluding short-term investments |
Top Industries
| Semiconductors & Semiconductor Equipment | 18.0% |
| Technology Hardware, Storage & Peripherals | 8.7% |
| Software | 8.6% |
| Financial Services | 7.5% |
| Pharmaceuticals | 7.2% |
| Specialty Retail | 6.9% |
| Machinery | 3.9% |
| Biotechnology | 3.8% |
| Interactive Media & Services | 2.6% |
| Hotels, Restaurants & Leisure | 2.6% |
| Other | 30.2% |
Top Ten Holdings and/or Issuers*
| NVIDIA Corp. | 7.5% |
| Apple, Inc. | 6.8% |
| Eli Lilly & Co. | 4.7% |
| Visa, Inc., Class A | 4.4% |
| Microsoft Corp. | 4.1% |
| Lam Research Corp. | 3.7% |
| Caterpillar, Inc. | 3.3% |
| KLA Corp. | 2.7% |
| Meta Platforms, Inc., Class A | 2.6% |
| Mastercard, Inc., Class A | 2.5% |
| * Excluding short-term investments |
What were the Portfolio costs for the last six months?1
(Based on a hypothetical $10,000 investment)
| Share Class Name | Costs of a $10,000 investment | Costs paid as a percentage of a $10,000 investment2 |
| Service Class | $41 | 0.79% |
| 1. | Does not include any separate account or policy fees or charges imposed under the variable annuity policies and variable universal life insurance policies for which the Portfolio is an investment option. If they were included, your costs would be higher. |
| 2. | Annualized. |
Portfolio Performance
The following graph compares the initial and subsequent account values at the end of each of the most recently completed 10 semiannual reporting periods of the Portfolio (or for the life of the Portfolio, if shorter). It assumes a $10,000 initial investment at the beginning of the first fiscal period in an appropriate, broad-based securities market index and other indexes, if applicable, for the same period. Effective January 1, 2018, due to an organizational restructuring, all investment personnel of Cornerstone Capital Management Holdings LLC, the former subadvisor, transitioned to MacKay Shields LLC, the former subadvisor. Effective May 1, 2021, the Portfolio replaced its subadvisor and modified its principal investment strategies. Effective August 12, 2024, the Portfolio again replaced its subadvisor and modified its principal investment strategies. The past performance in the graph and table prior to that date reflects the Portfolio's prior subadvisors and principal investment strategies.
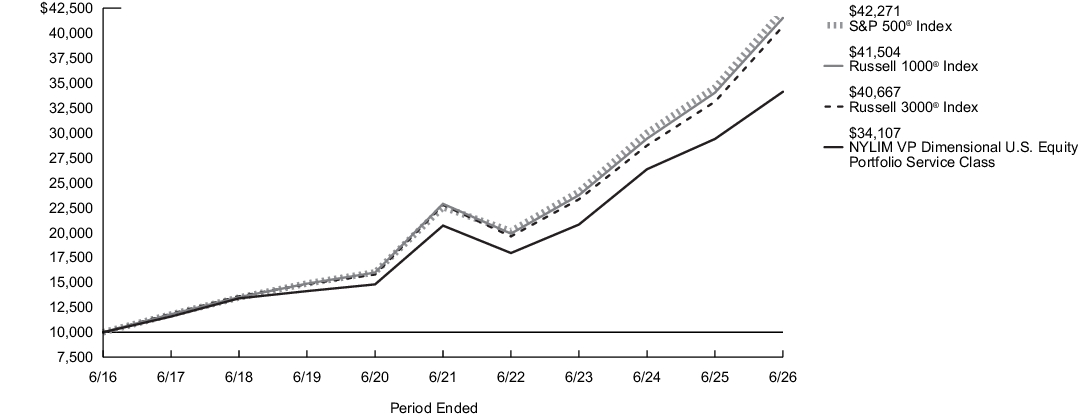
| Average Annual Total Returns for the Period Ended June 30, 2026 | Inception Date |
Six Months1 |
One Year |
Five Years |
Ten Years |
| Service Class Shares | 6/5/2003 | 8.09% | 16.10% | 10.51% | 13.05% |
| Russell 3000®Index2 | 10.86% | 22.81% | 12.30% | 15.06% | |
| Russell 1000®Index3 | 10.32% | 22.01% | 12.66% | 15.29% | |
| S&P 500®Index4 | 10.21% | 22.33% | 13.41% | 15.51% | |
| Morningstar Large Blend Category Average5 | 9.74% | 20.23% | 11.51% | 14.04% |
| 1. |
Not annualized. |
| 2. |
The Portfolio has selected the Russell 3000® Index to represent a broad measure of market performance. The Russell 3000® Index measures the performance of the largest 3,000 U.S. companies representing approximately 98% of the investable U.S. equity market. |
| 3. |
The Russell 1000® Index, which is generally representative of the market sectors or types of investments in which the Portfolio invests, measures the performance of the large-cap segment of the U.S. equity universe. It is a subset of the Russell 3000® Index and includes approximately 1,000 of the largest securities based on a combination of their market cap and current index membership. |
| 4. |
The S&P 500® Index is generally representative of the market sectors or types of investments in which the Portfolio invests. S&P® and S&P 500® are registered trademarks of Standard & Poor’s Financial Services LLC. The S&P 500® Index is widely regarded as the standard index for measuring large-cap U.S. stock market performance. |
| 5. |
The Morningstar Large Blend Category Average is representative of funds that represent the overall U.S. stock market in size, growth rates and price. Stocks in the top 70% of the capitalization of the U.S. equity market are defined as large cap. The blend style is assigned to funds where neither growth nor value characteristics predominate. These funds tend to invest across the spectrum of U.S. industries, and owing to their broad exposure, the funds' returns are often similar to those of the S&P 500® Index. Results are based on average total returns of similar funds with all dividends and capital gain distributions reinvested. |
Key Portfolio Statistics
| Portfolio's net assets | $962,140,754 |
| Total number of portfolio holdings | 117 |
| Portfolio turnover rate | 5% |
Graphical Representation of Holdings
The tables below show the investment makeup of the Portfolio; percentages indicated are based on the Portfolio's net assets.
Top Ten Holdings and/or Issuers*
| NVIDIA Corp. | 7.5% |
| Apple, Inc. | 6.8% |
| Eli Lilly & Co. | 4.7% |
| Visa, Inc., Class A | 4.4% |
| Microsoft Corp. | 4.1% |
| Lam Research Corp. | 3.7% |
| Caterpillar, Inc. | 3.3% |
| KLA Corp. | 2.7% |
| Meta Platforms, Inc., Class A | 2.6% |
| Mastercard, Inc., Class A | 2.5% |
| * Excluding short-term investments |
Top Industries
| Semiconductors & Semiconductor Equipment | 18.0% |
| Technology Hardware, Storage & Peripherals | 8.7% |
| Software | 8.6% |
| Financial Services | 7.5% |
| Pharmaceuticals | 7.2% |
| Specialty Retail | 6.9% |
| Machinery | 3.9% |
| Biotechnology | 3.8% |
| Interactive Media & Services | 2.6% |
| Hotels, Restaurants & Leisure | 2.6% |
| Other | 30.2% |
Top Ten Holdings and/or Issuers*
| NVIDIA Corp. | 7.5% |
| Apple, Inc. | 6.8% |
| Eli Lilly & Co. | 4.7% |
| Visa, Inc., Class A | 4.4% |
| Microsoft Corp. | 4.1% |
| Lam Research Corp. | 3.7% |
| Caterpillar, Inc. | 3.3% |
| KLA Corp. | 2.7% |
| Meta Platforms, Inc., Class A | 2.6% |
| Mastercard, Inc., Class A | 2.5% |
| * Excluding short-term investments |
What were the Portfolio costs for the last six months?1
(Based on a hypothetical $10,000 investment)
| Share Class Name | Costs of a $10,000 investment | Costs paid as a percentage of a $10,000 investment2,3 |
| Service Class | $48 | 0.95% |
| 1. | Does not include any separate account or policy fees or charges imposed under the variable annuity policies and variable universal life insurance policies for which the Portfolio is an investment option. If they were included, your costs would be higher. |
| 2. | Annualized. |
| 3. | Excludes the fees and expenses of the acquired (underlying) funds in which the Portfolio invested. |
Portfolio Performance
The following graph compares the initial and subsequent account values at the end of each of the most recently completed 10 semiannual reporting periods of the Portfolio (or for the life of the Portfolio, if shorter). It assumes a $10,000 initial investment at the beginning of the first fiscal period in an appropriate, broad-based securities market index and other indexes, if applicable, for the same period. The Portfolio's equity subadvisor changed effective January 1, 2018 due to an organizational restructuring whereby all investment personnel of Cornerstone Capital Management Holdings LLC, the former subadvisor, transitioned to MacKay Shields LLC. Effective May 1, 2021, the Portfolio replaced the subadvisor to the equity portion of the Portfolio and modified the equity portion of the Portfolio's principal investment strategies. The past performance in the graph and table prior to that date reflects the Portfolio's prior subadvisor and principal investment strategies for the equity portion of the Portfolio.
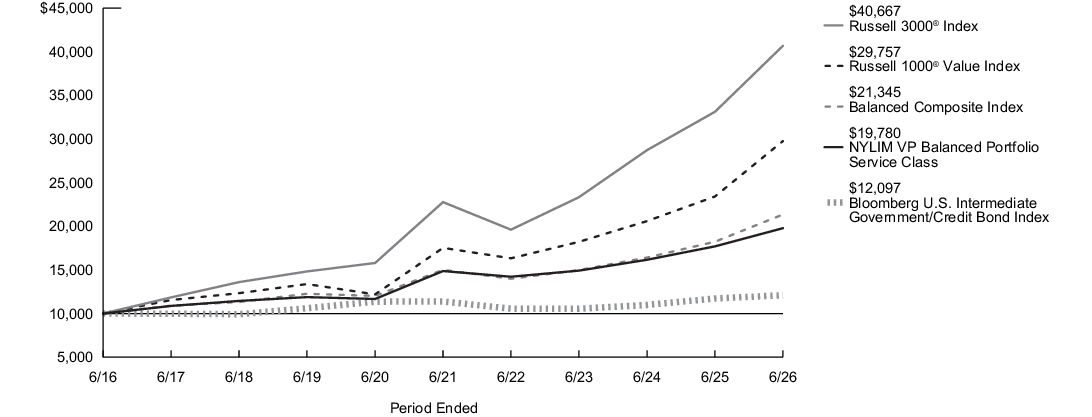
| Average Annual Total Returns for the Period Ended June 30, 2026 | Inception Date |
Six Months1 |
One Year |
Five Years |
Ten Years |
| Service Class Shares | 5/2/2005 | 5.02% | 11.76% | 5.87% | 7.06% |
| Russell 3000®Index2 | 10.86% | 22.81% | 12.30% | 15.06% | |
| Russell 1000® Value Index3 | 16.23% | 27.09% | 11.17% | 11.52% | |
| Bloomberg U.S. Intermediate Government/Credit Bond Index4 | 0.40% | 3.13% | 1.22% | 1.92% | |
| Balanced Composite Index5 | 9.76% | 17.07% | 7.30% | 7.88% | |
| Morningstar Moderate Allocation Category Average6 | 6.91% | 14.28% | 6.74% | 8.64% |
| 1. |
Not annualized. |
| 2. |
The Portfolio has selected the Russell 3000® Index to represent a broad measure of market performance. The Russell 3000® Index measures the performance of the largest 3,000 U.S. companies representing approximately 98% of the investable U.S. equity market. |
| 3. |
The Russell 1000® Value Index, which is generally representative of the market sectors or types of investments in which the Portfolio invests, measures the performance of the large-cap value segment of the U.S. equity universe. It includes those Russell 1000® Index companies with lower price-to-book ratios and lower expected growth values. |
| 4. |
The Bloomberg U.S. Intermediate Government/Credit Bond Index, which is generally representative of the market sectors or types of investments in which the Portfolio invests, measures the performance of U.S. dollar-denominated U.S. treasuries, government-related and investment grade U.S. corporate securities that have a remaining maturity of greater than one year and less than ten years. |
| 5. |
The Balanced Composite Index, which is generally representative of the market sectors or types of investments in which the Portfolio invests, consists of the Russell 1000® Value Index and the Bloomberg U.S. Intermediate Government/Credit Bond Index weighted 60%/40%, respectively. |
| 6. |
The Morningstar Moderate Allocation Category Average is representative of funds in allocation categories that seek to provide both income and capital appreciation by primarily investing in multiple asset classes, including stocks, bonds, and cash. These moderate strategies seek to balance preservation of capital with appreciation. They typically expect volatility similar to a strategic equity exposure between 50% and 70%. Results are based on average total returns of similar funds with all dividends and capital gain distributions reinvested. |
Key Portfolio Statistics
| Portfolio's net assets | $347,843,282 |
| Total number of portfolio holdings | 257 |
| Portfolio turnover rate | 70% |
Graphical Representation of Holdings
The tables below show the investment makeup of the Portfolio; percentages indicated are based on the Portfolio's net assets.
Top Ten Holdings and/or Issuers*
| U.S. Treasury Notes, 3.75%-4.375%, due 4/30/28-5/15/36 | 11.2% |
| iShares Intermediate Government/Credit Bond ETF | 3.9% |
| Vanguard Intermediate-Term Treasury ETF | 3.6% |
| Microsoft Corp. | 3.4% |
| JPMorgan Chase & Co. | 2.2% |
| Johnson & Johnson | 1.8% |
| Merck & Co., Inc. | 1.6% |
| Vanguard Russell 1000 Value ETF | 1.5% |
| Cisco Systems, Inc. | 1.4% |
| UnitedHealth Group, Inc. | 1.4% |
| * Excluding short-term investments |
Portfolio Composition
| Common Stocks | 61.9% |
| U.S. Government & Federal Agencies | 11.5% |
| Corporate Bonds | 10.3% |
| Exchange-Traded Funds | 9.0% |
| Mortgage-Backed Securities | 3.0% |
| Asset-Backed Securities | 2.5% |
| Short-Term Investments | 0.7% |
| Other Assets, Less Liabilities | 1.1% |
Top Ten Holdings and/or Issuers*
| U.S. Treasury Notes, 3.75%-4.375%, due 4/30/28-5/15/36 | 11.2% |
| iShares Intermediate Government/Credit Bond ETF | 3.9% |
| Vanguard Intermediate-Term Treasury ETF | 3.6% |
| Microsoft Corp. | 3.4% |
| JPMorgan Chase & Co. | 2.2% |
| Johnson & Johnson | 1.8% |
| Merck & Co., Inc. | 1.6% |
| Vanguard Russell 1000 Value ETF | 1.5% |
| Cisco Systems, Inc. | 1.4% |
| UnitedHealth Group, Inc. | 1.4% |
| * Excluding short-term investments |
What were the Portfolio costs for the last six months?1
(Based on a hypothetical $10,000 investment)
| Share Class Name | Costs of a $10,000 investment | Costs paid as a percentage of a $10,000 investment2,3 |
| Initial Class | $36 | 0.70% |
| 1. | Does not include any separate account or policy fees or charges imposed under the variable annuity policies and variable universal life insurance policies for which the Portfolio is an investment option. If they were included, your costs would be higher. |
| 2. | Annualized. |
| 3. | Excludes the fees and expenses of the acquired (underlying) funds in which the Portfolio invested. |
Portfolio Performance
The following graph compares the initial and subsequent account values at the end of each of the most recently completed 10 semiannual reporting periods of the Portfolio (or for the life of the Portfolio, if shorter). It assumes a $10,000 initial investment at the beginning of the first fiscal period in an appropriate, broad-based securities market index and other indexes, if applicable, for the same period. The Portfolio's equity subadvisor changed effective January 1, 2018 due to an organizational restructuring whereby all investment personnel of Cornerstone Capital Management Holdings LLC, the former subadvisor, transitioned to MacKay Shields LLC. Effective May 1, 2021, the Portfolio replaced the subadvisor to the equity portion of the Portfolio and modified the equity portion of the Portfolio's principal investment strategies. The past performance in the graph and table prior to that date reflects the Portfolio's prior subadvisor and principal investment strategies for the equity portion of the Portfolio.
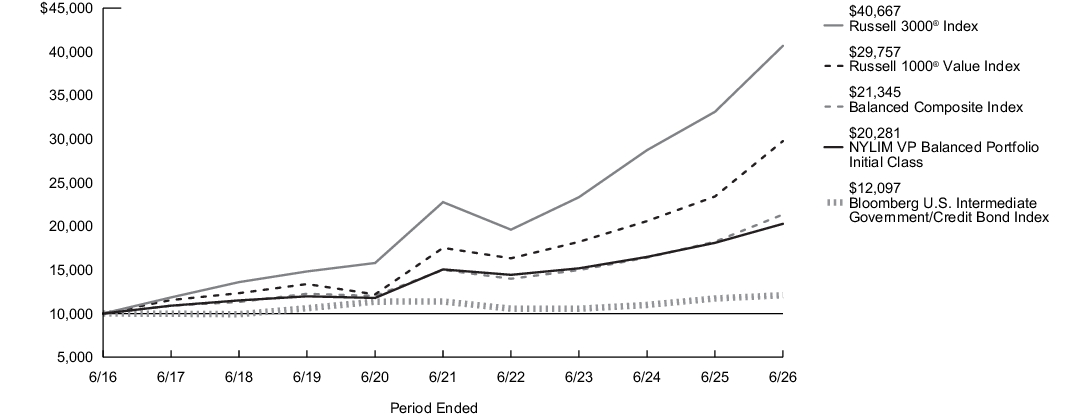
| Average Annual Total Returns for the Period Ended June 30, 2026 | Inception Date |
Six Months1 |
One Year |
Five Years |
Ten Years |
| Initial Class Shares | 5/2/2005 | 5.15% | 12.04% | 6.14% | 7.33% |
| Russell 3000®Index2 | 10.86% | 22.81% | 12.30% | 15.06% | |
| Russell 1000® Value Index3 | 16.23% | 27.09% | 11.17% | 11.52% | |
| Bloomberg U.S. Intermediate Government/Credit Bond Index4 | 0.40% | 3.13% | 1.22% | 1.92% | |
| Balanced Composite Index5 | 9.76% | 17.07% | 7.30% | 7.88% | |
| Morningstar Moderate Allocation Category Average6 | 6.91% | 14.28% | 6.74% | 8.64% |
| 1. |
Not annualized. |
| 2. |
The Portfolio has selected the Russell 3000® Index to represent a broad measure of market performance. The Russell 3000® Index measures the performance of the largest 3,000 U.S. companies representing approximately 98% of the investable U.S. equity market. |
| 3. |
The Russell 1000® Value Index, which is generally representative of the market sectors or types of investments in which the Portfolio invests, measures the performance of the large-cap value segment of the U.S. equity universe. It includes those Russell 1000® Index companies with lower price-to-book ratios and lower expected growth values. |
| 4. |
The Bloomberg U.S. Intermediate Government/Credit Bond Index, which is generally representative of the market sectors or types of investments in which the Portfolio invests, measures the performance of U.S. dollar-denominated U.S. treasuries, government-related and investment grade U.S. corporate securities that have a remaining maturity of greater than one year and less than ten years. |
| 5. |
The Balanced Composite Index, which is generally representative of the market sectors or types of investments in which the Portfolio invests, consists of the Russell 1000® Value Index and the Bloomberg U.S. Intermediate Government/Credit Bond Index weighted 60%/40%, respectively. |
| 6. |
The Morningstar Moderate Allocation Category Average is representative of funds in allocation categories that seek to provide both income and capital appreciation by primarily investing in multiple asset classes, including stocks, bonds, and cash. These moderate strategies seek to balance preservation of capital with appreciation. They typically expect volatility similar to a strategic equity exposure between 50% and 70%. Results are based on average total returns of similar funds with all dividends and capital gain distributions reinvested. |
Key Portfolio Statistics
| Portfolio's net assets | $347,843,282 |
| Total number of portfolio holdings | 257 |
| Portfolio turnover rate | 70% |
Graphical Representation of Holdings
The tables below show the investment makeup of the Portfolio; percentages indicated are based on the Portfolio's net assets.
Top Ten Holdings and/or Issuers*
| U.S. Treasury Notes, 3.75%-4.375%, due 4/30/28-5/15/36 | 11.2% |
| iShares Intermediate Government/Credit Bond ETF | 3.9% |
| Vanguard Intermediate-Term Treasury ETF | 3.6% |
| Microsoft Corp. | 3.4% |
| JPMorgan Chase & Co. | 2.2% |
| Johnson & Johnson | 1.8% |
| Merck & Co., Inc. | 1.6% |
| Vanguard Russell 1000 Value ETF | 1.5% |
| Cisco Systems, Inc. | 1.4% |
| UnitedHealth Group, Inc. | 1.4% |
| * Excluding short-term investments |
Portfolio Composition
| Common Stocks | 61.9% |
| U.S. Government & Federal Agencies | 11.5% |
| Corporate Bonds | 10.3% |
| Exchange-Traded Funds | 9.0% |
| Mortgage-Backed Securities | 3.0% |
| Asset-Backed Securities | 2.5% |
| Short-Term Investments | 0.7% |
| Other Assets, Less Liabilities | 1.1% |
Top Ten Holdings and/or Issuers*
| U.S. Treasury Notes, 3.75%-4.375%, due 4/30/28-5/15/36 | 11.2% |
| iShares Intermediate Government/Credit Bond ETF | 3.9% |
| Vanguard Intermediate-Term Treasury ETF | 3.6% |
| Microsoft Corp. | 3.4% |
| JPMorgan Chase & Co. | 2.2% |
| Johnson & Johnson | 1.8% |
| Merck & Co., Inc. | 1.6% |
| Vanguard Russell 1000 Value ETF | 1.5% |
| Cisco Systems, Inc. | 1.4% |
| UnitedHealth Group, Inc. | 1.4% |
| * Excluding short-term investments |
What were the Portfolio costs for the last six months?1
(Based on a hypothetical $10,000 investment)
| Share Class Name | Costs of a $10,000 investment | Costs paid as a percentage of a $10,000 investment2 |
| Initial Class | $32 | 0.64% |
| 1. | Does not include any separate account or policy fees or charges imposed under the variable annuity policies and variable universal life insurance policies for which the Portfolio is an investment option. If they were included, your costs would be higher. |
| 2. | Annualized. |
Portfolio Performance
The following graph compares the initial and subsequent account values at the end of each of the most recently completed 10 semiannual reporting periods of the Portfolio (or for the life of the Portfolio, if shorter). It assumes a $10,000 initial investment at the beginning of the first fiscal period in an appropriate, broad-based securities market index and other indexes, if applicable, for the same period.
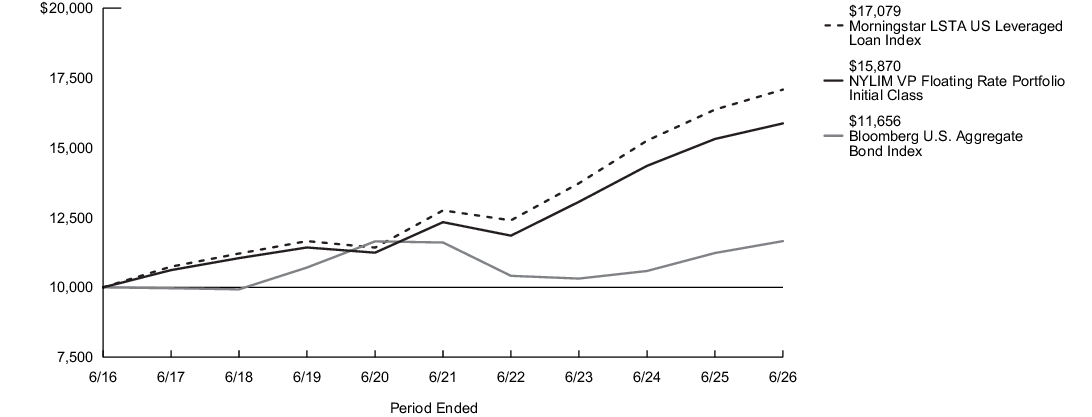
| Average Annual Total Returns for the Period Ended June 30, 2026 | Inception Date |
Six Months1 |
One Year |
Five Years |
Ten Years |
| Initial Class Shares | 5/2/2005 | 1.14% | 3.63% | 5.17% | 4.73% |
| Bloomberg U.S. Aggregate Bond Index2 | 0.62% | 3.79% | 0.08% | 1.54% | |
| Morningstar LSTA US Leveraged Loan Index3 | 1.31% | 4.36% | 6.01% | 5.50% | |
| Morningstar Bank Loan Category Average4 | 1.36% | 4.11% | 5.11% | 4.53% |
| 1. |
Not annualized. |
| 2. |
The Portfolio has selected the Bloomberg U.S. Aggregate Bond Index to represent a broad measure of market performance. The Bloomberg U.S. Aggregate Bond Index is a broad-based benchmark that measures the performance of the investment grade, U.S. dollar-denominated, fixed-rate taxable bond market, including Treasuries, government-related and corporate securities, mortgage-backed securities (agency fixed-rate and hybrid adjustable rate mortgage pass-throughs), asset-backed securities and commercial mortgage-backed securities. |
| 3. |
The Morningstar LSTA US Leveraged Loan Index, which is generally representative of the market sectors or types of investments in which the Portfolio invests, is a broad index designed to reflect the performance of U.S. dollar facilities in the leveraged loan market. |
| 4. |
The Morningstar Bank Loan Category Average is representative of funds that invest in floating-rate bank loans instead of bonds. In exchange for their credit risk, these loans offer high interest payments that typically float above a common short-term benchmark. Results are based on average total returns of similar funds with all dividends and capital gain distributions reinvested. |
Key Portfolio Statistics
| Portfolio's net assets | $1,131,732,615 |
| Total number of portfolio holdings | 487 |
| Portfolio turnover rate | 19% |
Graphical Representation of Holdings
The tables below show the investment makeup of the Portfolio; percentages indicated are based on the Portfolio's net assets.
Top Ten Holdings and/or Issuers*
| TransDigm, Inc., 5.894%-6.75%, due 3/22/30-1/31/34 | 1.0% |
| Univision Communications, Inc., 7.008%-8.50%, due 1/23/29-7/31/31 | 0.8% |
| McAfee Corp., 6.644%, due 3/1/29 | 0.8% |
| Hologic, Inc., 5.995%, due 4/7/33 | 0.8% |
| Indy US Holdco LLC, 5.894%, due 10/31/30 | 0.7% |
| Acrisure LLC, 6.644%-8.50%, due 2/1/29-6/21/32 | 0.7% |
| Clydesdale Acquisition Holdings, Inc., 6.75%-8.75%, due 4/13/29-4/15/32 | 0.7% |
| AthenaHealth Group, Inc., 6.894%, due 2/16/32 | 0.7% |
| Asurion LLC, 7.413%-9.175%, due 1/19/29-2/23/33 | 0.7% |
| SCIH Salt Holdings, Inc., 6.35%, due 1/31/29 | 0.6% |
| * Excluding short-term investments |
Top Industries
| Services: Business | 7.5% |
| Finance | 7.5% |
| Software | 5.5% |
| Chemicals, Plastics & Rubber | 5.4% |
| Insurance | 4.5% |
| Electronics | 4.4% |
| High Tech Industries | 3.8% |
| Aerospace & Defense | 3.7% |
| Automobile | 3.5% |
| Other Asset-Backed Securities | 3.5% |
| Other | 50.7% |
Top Ten Holdings and/or Issuers*
| TransDigm, Inc., 5.894%-6.75%, due 3/22/30-1/31/34 | 1.0% |
| Univision Communications, Inc., 7.008%-8.50%, due 1/23/29-7/31/31 | 0.8% |
| McAfee Corp., 6.644%, due 3/1/29 | 0.8% |
| Hologic, Inc., 5.995%, due 4/7/33 | 0.8% |
| Indy US Holdco LLC, 5.894%, due 10/31/30 | 0.7% |
| Acrisure LLC, 6.644%-8.50%, due 2/1/29-6/21/32 | 0.7% |
| Clydesdale Acquisition Holdings, Inc., 6.75%-8.75%, due 4/13/29-4/15/32 | 0.7% |
| AthenaHealth Group, Inc., 6.894%, due 2/16/32 | 0.7% |
| Asurion LLC, 7.413%-9.175%, due 1/19/29-2/23/33 | 0.7% |
| SCIH Salt Holdings, Inc., 6.35%, due 1/31/29 | 0.6% |
| * Excluding short-term investments |
What were the Portfolio costs for the last six months?1
(Based on a hypothetical $10,000 investment)
| Share Class Name | Costs of a $10,000 investment | Costs paid as a percentage of a $10,000 investment2 |
| Service Class | $44 | 0.89% |
| 1. | Does not include any separate account or policy fees or charges imposed under the variable annuity policies and variable universal life insurance policies for which the Portfolio is an investment option. If they were included, your costs would be higher. |
| 2. | Annualized. |
Portfolio Performance
The following graph compares the initial and subsequent account values at the end of each of the most recently completed 10 semiannual reporting periods of the Portfolio (or for the life of the Portfolio, if shorter). It assumes a $10,000 initial investment at the beginning of the first fiscal period in an appropriate, broad-based securities market index and other indexes, if applicable, for the same period.
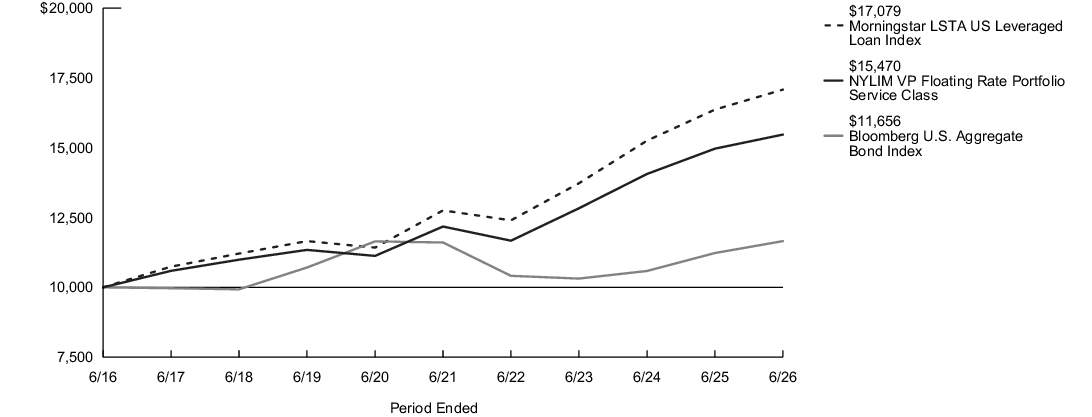
| Average Annual Total Returns for the Period Ended June 30, 2026 | Inception Date |
Six Months1 |
One Year |
Five Years |
Ten Years |
| Service Class Shares | 5/2/2005 | 1.01% | 3.37% | 4.90% | 4.46% |
| Bloomberg U.S. Aggregate Bond Index2 | 0.62% | 3.79% | 0.08% | 1.54% | |
| Morningstar LSTA US Leveraged Loan Index3 | 1.31% | 4.36% | 6.01% | 5.50% | |
| Morningstar Bank Loan Category Average4 | 1.36% | 4.11% | 5.11% | 4.53% |
| 1. |
Not annualized. |
| 2. |
The Portfolio has selected the Bloomberg U.S. Aggregate Bond Index to represent a broad measure of market performance. The Bloomberg U.S. Aggregate Bond Index is a broad-based benchmark that measures the performance of the investment grade, U.S. dollar-denominated, fixed-rate taxable bond market, including Treasuries, government-related and corporate securities, mortgage-backed securities (agency fixed-rate and hybrid adjustable rate mortgage pass-throughs), asset-backed securities and commercial mortgage-backed securities. |
| 3. |
The Morningstar LSTA US Leveraged Loan Index, which is generally representative of the market sectors or types of investments in which the Portfolio invests, is a broad index designed to reflect the performance of U.S. dollar facilities in the leveraged loan market. |
| 4. |
The Morningstar Bank Loan Category Average is representative of funds that invest in floating-rate bank loans instead of bonds. In exchange for their credit risk, these loans offer high interest payments that typically float above a common short-term benchmark. Results are based on average total returns of similar funds with all dividends and capital gain distributions reinvested. |
Key Portfolio Statistics
| Portfolio's net assets | $1,131,732,615 |
| Total number of portfolio holdings | 487 |
| Portfolio turnover rate | 19% |
Graphical Representation of Holdings
The tables below show the investment makeup of the Portfolio; percentages indicated are based on the Portfolio's net assets.
Top Ten Holdings and/or Issuers*
| TransDigm, Inc., 5.894%-6.75%, due 3/22/30-1/31/34 | 1.0% |
| Univision Communications, Inc., 7.008%-8.50%, due 1/23/29-7/31/31 | 0.8% |
| McAfee Corp., 6.644%, due 3/1/29 | 0.8% |
| Hologic, Inc., 5.995%, due 4/7/33 | 0.8% |
| Indy US Holdco LLC, 5.894%, due 10/31/30 | 0.7% |
| Acrisure LLC, 6.644%-8.50%, due 2/1/29-6/21/32 | 0.7% |
| Clydesdale Acquisition Holdings, Inc., 6.75%-8.75%, due 4/13/29-4/15/32 | 0.7% |
| AthenaHealth Group, Inc., 6.894%, due 2/16/32 | 0.7% |
| Asurion LLC, 7.413%-9.175%, due 1/19/29-2/23/33 | 0.7% |
| SCIH Salt Holdings, Inc., 6.35%, due 1/31/29 | 0.6% |
| * Excluding short-term investments |
Top Industries
| Services: Business | 7.5% |
| Finance | 7.5% |
| Software | 5.5% |
| Chemicals, Plastics & Rubber | 5.4% |
| Insurance | 4.5% |
| Electronics | 4.4% |
| High Tech Industries | 3.8% |
| Aerospace & Defense | 3.7% |
| Automobile | 3.5% |
| Other Asset-Backed Securities | 3.5% |
| Other | 50.7% |
Top Ten Holdings and/or Issuers*
| TransDigm, Inc., 5.894%-6.75%, due 3/22/30-1/31/34 | 1.0% |
| Univision Communications, Inc., 7.008%-8.50%, due 1/23/29-7/31/31 | 0.8% |
| McAfee Corp., 6.644%, due 3/1/29 | 0.8% |
| Hologic, Inc., 5.995%, due 4/7/33 | 0.8% |
| Indy US Holdco LLC, 5.894%, due 10/31/30 | 0.7% |
| Acrisure LLC, 6.644%-8.50%, due 2/1/29-6/21/32 | 0.7% |
| Clydesdale Acquisition Holdings, Inc., 6.75%-8.75%, due 4/13/29-4/15/32 | 0.7% |
| AthenaHealth Group, Inc., 6.894%, due 2/16/32 | 0.7% |
| Asurion LLC, 7.413%-9.175%, due 1/19/29-2/23/33 | 0.7% |
| SCIH Salt Holdings, Inc., 6.35%, due 1/31/29 | 0.6% |
| * Excluding short-term investments |
What were the Portfolio costs for the last six months?1
(Based on a hypothetical $10,000 investment)
| Share Class Name | Costs of a $10,000 investment | Costs paid as a percentage of a $10,000 investment2,3 |
| Service Class | $15 | 0.29% |
| 1. | Does not include any separate account or policy fees or charges imposed under the variable annuity policies and variable universal life insurance policies for which the Portfolio is an investment option. If they were included, your costs would be higher. |
| 2. | Annualized. |
| 3. | Excludes the fees and expenses of the acquired (underlying) funds in which the Portfolio invested. |
Portfolio Performance
The following graph compares the initial and subsequent account values at the end of each of the most recently completed 10 semiannual reporting periods of the Portfolio (or for the life of the Portfolio, if shorter). It assumes a $10,000 initial investment at the beginning of the first fiscal period in an appropriate, broad-based securities market index and other indexes, if applicable, for the same period.
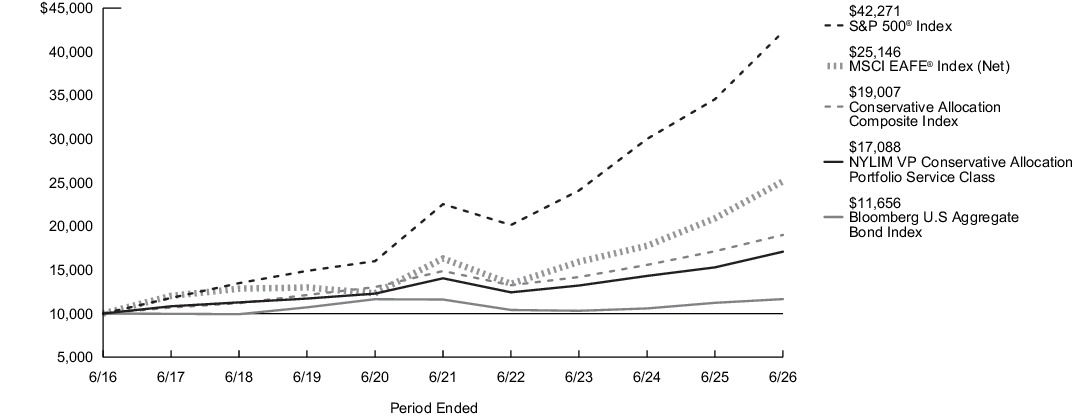
| Average Annual Total Returns for the Period Ended June 30, 2026 | Inception Date |
Six Months1 |
One Year |
Five Years |
Ten Years |
| Service Class Shares | 2/13/2006 | 6.21% | 11.75% | 4.01% | 5.50% |
| Bloomberg U.S. Aggregate Bond Index2 | 0.62% | 3.79% | 0.08% | 1.54% | |
| S&P 500®Index3 | 10.21% | 22.33% | 13.41% | 15.51% | |
| MSCI EAFE® Index (Net)4 | 9.44% | 20.23% | 9.05% | 9.66% | |
| Conservative Allocation Composite Index5 | 4.48% | 10.89% | 5.03% | 6.63% | |
| Morningstar Global Moderately Conservative Allocation Category Average6 | 5.96% | 12.32% | 4.31% | 5.68% |
| 1. |
Not annualized. |
| 2. |
The Bloomberg U.S. Aggregate Bond Index is generally representative of the market sectors or types of investments in which the Portfolio invests. The Bloomberg U.S. Aggregate Bond Index is a broad-based benchmark that measures the performance of the investment grade, U.S. dollar-denominated, fixed-rate taxable bond market, including Treasuries, government-related and corporate securities, mortgage-backed securities (agency fixed-rate and hybrid adjustable rate mortgage pass-throughs), asset-backed securities and commercial mortgage-backed securities. |
| 3. |
The S&P 500® Index, which represents a broad measure of market performance, is generally representative of the market sectors or types of investments in which the Portfolio invests. S&P® and S&P 500® are registered trademarks of Standard & Poor’s Financial Services LLC. The S&P 500® Index is widely regarded as the standard index for measuring large-cap U.S. stock market performance. |
| 4. |
The MSCI EAFE® Index (Net), which is generally representative of the market sectors or types of investments in which the Portfolio invests, consists of international stocks representing the developed world outside of North America. |
| 5. |
The Conservative Allocation Composite Index, which is generally representative of the market sectors or types of investments in which the Portfolio invests, consists of the Bloomberg U.S. Aggregate Bond Index, the S&P 500® Index and the MSCI EAFE® Index (Net) weighted 60%, 30% and 10%,respectively. |
| 6. |
The Morningstar Global Moderately Conservative Allocation Category Average is representative of funds in allocation categories that seek to provide both income and capital appreciation by primarily investing in multiple asset classes, including stocks, bonds, and cash. These moderately conservative strategies prioritize preservation of capital over appreciation. They typically expect volatility similar to a strategic equity exposure between 30% and 50%. Results are based on average total returns of similar funds with all dividends and capital gain distributions reinvested. |
Key Portfolio Statistics
| Portfolio's net assets | $346,044,046 |
| Total number of portfolio holdings | 42 |
| Portfolio turnover rate | 17% |
Asset Diversification
(as a Percentage of Net Asset Value)
(as a Percentage of Net Asset Value)
| Equity Funds | 36.6% |
| Fixed Income Funds | 53.3% |
| Short-Term Investment | 9.3% |
| Other Assets, Less Liabilities | 0.8% |
What were the Portfolio costs for the last six months?1
(Based on a hypothetical $10,000 investment)
| Share Class Name | Costs of a $10,000 investment | Costs paid as a percentage of a $10,000 investment2,3 |
| Initial Class | $2 | 0.04% |
| 1. | Does not include any separate account or policy fees or charges imposed under the variable annuity policies and variable universal life insurance policies for which the Portfolio is an investment option. If they were included, your costs would be higher. |
| 2. | Annualized. |
| 3. | Excludes the fees and expenses of the acquired (underlying) funds in which the Portfolio invested. |
Portfolio Performance
The following graph compares the initial and subsequent account values at the end of each of the most recently completed 10 semiannual reporting periods of the Portfolio (or for the life of the Portfolio, if shorter). It assumes a $10,000 initial investment at the beginning of the first fiscal period in an appropriate, broad-based securities market index and other indexes, if applicable, for the same period.
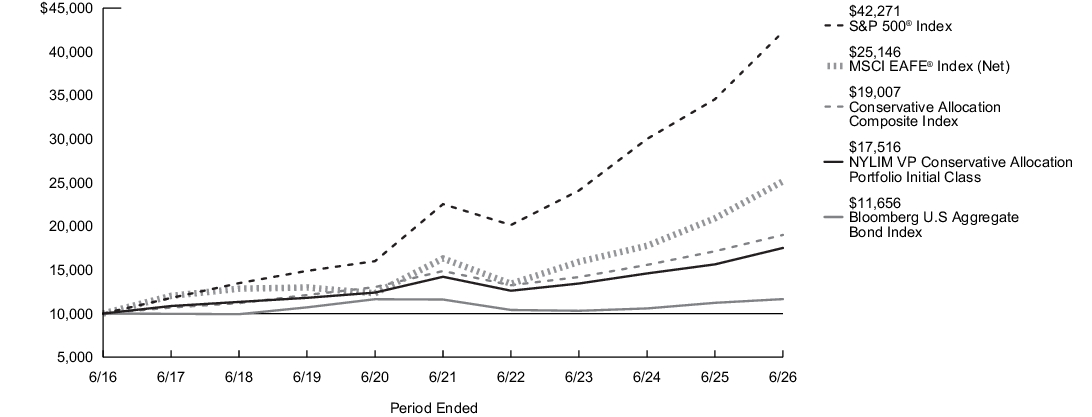
| Average Annual Total Returns for the Period Ended June 30, 2026 | Inception Date |
Six Months1 |
One Year |
Five Years |
Ten Years |
| Initial Class Shares | 2/13/2006 | 6.34% | 12.03% | 4.27% | 5.77% |
| Bloomberg U.S. Aggregate Bond Index2 | 0.62% | 3.79% | 0.08% | 1.54% | |
| S&P 500®Index3 | 10.21% | 22.33% | 13.41% | 15.51% | |
| MSCI EAFE® Index (Net)4 | 9.44% | 20.23% | 9.05% | 9.66% | |
| Conservative Allocation Composite Index5 | 4.48% | 10.89% | 5.03% | 6.63% | |
| Morningstar Global Moderately Conservative Allocation Category Average6 | 5.96% | 12.32% | 4.31% | 5.68% |
| 1. |
Not annualized. |
| 2. |
The Bloomberg U.S. Aggregate Bond Index is generally representative of the market sectors or types of investments in which the Portfolio invests. The Bloomberg U.S. Aggregate Bond Index is a broad-based benchmark that measures the performance of the investment grade, U.S. dollar-denominated, fixed-rate taxable bond market, including Treasuries, government-related and corporate securities, mortgage-backed securities (agency fixed-rate and hybrid adjustable rate mortgage pass-throughs), asset-backed securities and commercial mortgage-backed securities. |
| 3. |
The S&P 500® Index, which represents a broad measure of market performance, is generally representative of the market sectors or types of investments in which the Portfolio invests. S&P® and S&P 500® are registered trademarks of Standard & Poor’s Financial Services LLC. The S&P 500® Index is widely regarded as the standard index for measuring large-cap U.S. stock market performance. |
| 4. |
The MSCI EAFE® Index (Net), which is generally representative of the market sectors or types of investments in which the Portfolio invests, consists of international stocks representing the developed world outside of North America. |
| 5. |
The Conservative Allocation Composite Index, which is generally representative of the market sectors or types of investments in which the Portfolio invests, consists of the Bloomberg U.S. Aggregate Bond Index, the S&P 500® Index and the MSCI EAFE® Index (Net) weighted 60%, 30% and 10%,respectively. |
| 6. |
The Morningstar Global Moderately Conservative Allocation Category Average is representative of funds in allocation categories that seek to provide both income and capital appreciation by primarily investing in multiple asset classes, including stocks, bonds, and cash. These moderately conservative strategies prioritize preservation of capital over appreciation. They typically expect volatility similar to a strategic equity exposure between 30% and 50%. Results are based on average total returns of similar funds with all dividends and capital gain distributions reinvested. |
Key Portfolio Statistics
| Portfolio's net assets | $346,044,046 |
| Total number of portfolio holdings | 42 |
| Portfolio turnover rate | 17% |
Asset Diversification
(as a Percentage of Net Asset Value)
(as a Percentage of Net Asset Value)
| Equity Funds | 36.6% |
| Fixed Income Funds | 53.3% |
| Short-Term Investment | 9.3% |
| Other Assets, Less Liabilities | 0.8% |
What were the Portfolio costs for the last six months?1
(Based on a hypothetical $10,000 investment)
| Share Class Name | Costs of a $10,000 investment | Costs paid as a percentage of a $10,000 investment2,3 |
| Initial Class | $2 | 0.03% |
| 1. | Does not include any separate account or policy fees or charges imposed under the variable annuity policies and variable universal life insurance policies for which the Portfolio is an investment option. If they were included, your costs would be higher. |
| 2. | Annualized. |
| 3. | Excludes the fees and expenses of the acquired (underlying) funds in which the Portfolio invested. |
Portfolio Performance
The following graph compares the initial and subsequent account values at the end of each of the most recently completed 10 semiannual reporting periods of the Portfolio (or for the life of the Portfolio, if shorter). It assumes a $10,000 initial investment at the beginning of the first fiscal period in an appropriate, broad-based securities market index and other indexes, if applicable, for the same period.
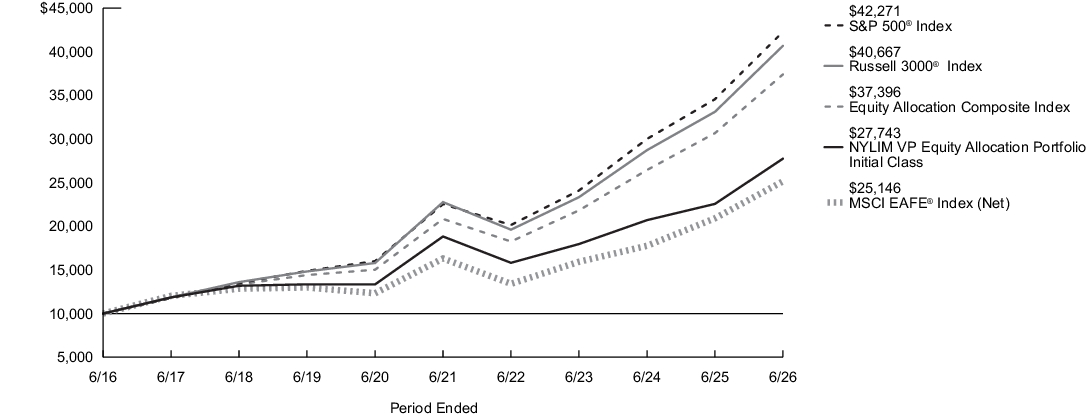
| Average Annual Total Returns for the Period Ended June 30, 2026 | Inception Date |
Six Months1 |
One Year |
Five Years |
Ten Years |
| Initial Class Shares | 2/13/2006 | 13.20% | 22.95% | 8.06% | 10.74% |
| Russell 3000®Index2 | 10.86% | 22.81% | 12.30% | 15.06% | |
| S&P 500®Index3 | 10.21% | 22.33% | 13.41% | 15.51% | |
| MSCI EAFE® Index (Net)4 | 9.44% | 20.23% | 9.05% | 9.66% | |
| Equity Allocation Composite Index5 | 10.11% | 21.93% | 12.41% | 14.10% | |
| Morningstar Global Aggressive Allocation Category Average6 | 10.84% | 20.47% | 8.53% | 11.04% |
| 1. |
Not annualized. |
| 2. |
The Portfolio has selected the Russell 3000® Index to represent a broad measure of market performance. The Russell 3000® Index measures the performance of the largest 3,000 U.S. companies representing approximately 98% of the investable U.S. equity market. |
| 3. |
The S&P 500® Index, which represents a broad measure of market performance, is generally representative of the market sectors or types of investments in which the Portfolio invests. S&P® and S&P 500® are registered trademarks of Standard & Poor’s Financial Services LLC. The S&P 500® Index is widely regarded as the standard index for measuring large-cap U.S. stock market performance. |
| 4. |
The MSCI EAFE® Index (Net), which is generally representative of the market sectors or types of investments in which the Portfolio invests, consists of international stocks representing the developed world outside of North America. |
| 5. |
The Equity Allocation Composite Index, which is generally representative of the market sectors or types of investments in which the Portfolio invests, consists of the S&P 500® Index and the MSCI EAFE® Index (Net) weighted 75% and 25%, respectively. |
| 6. |
The Morningstar Global Aggressive Allocation Category Average is representative of funds in allocation categories that seek to provide both income and capital appreciation by primarily investing in multiple asset classes, including stocks, bonds, and cash. These aggressive strategies typically allocate at least 10% to equities of foreign companies and prioritize capital appreciation over preservation. They typically expect volatility similar to a strategic equity exposure of more than 85%. Results are based on average total returns of similar funds with all dividends and capital gain distributions reinvested. |
Key Portfolio Statistics
| Portfolio's net assets | $724,329,281 |
| Total number of portfolio holdings | 35 |
| Portfolio turnover rate | 13% |
Asset Diversification
(as a Percentage of Net Asset Value)
(as a Percentage of Net Asset Value)
| Equity Funds | 97.7% |
| Short-Term Investment | 2.1% |
| Other Assets, Less Liabilities | 0.2% |
What were the Portfolio costs for the last six months?1
(Based on a hypothetical $10,000 investment)
| Share Class Name | Costs of a $10,000 investment | Costs paid as a percentage of a $10,000 investment2,3 |
| Service Class | $15 | 0.28% |
| 1. | Does not include any separate account or policy fees or charges imposed under the variable annuity policies and variable universal life insurance policies for which the Portfolio is an investment option. If they were included, your costs would be higher. |
| 2. | Annualized. |
| 3. | Excludes the fees and expenses of the acquired (underlying) funds in which the Portfolio invested. |
Portfolio Performance
The following graph compares the initial and subsequent account values at the end of each of the most recently completed 10 semiannual reporting periods of the Portfolio (or for the life of the Portfolio, if shorter). It assumes a $10,000 initial investment at the beginning of the first fiscal period in an appropriate, broad-based securities market index and other indexes, if applicable, for the same period.
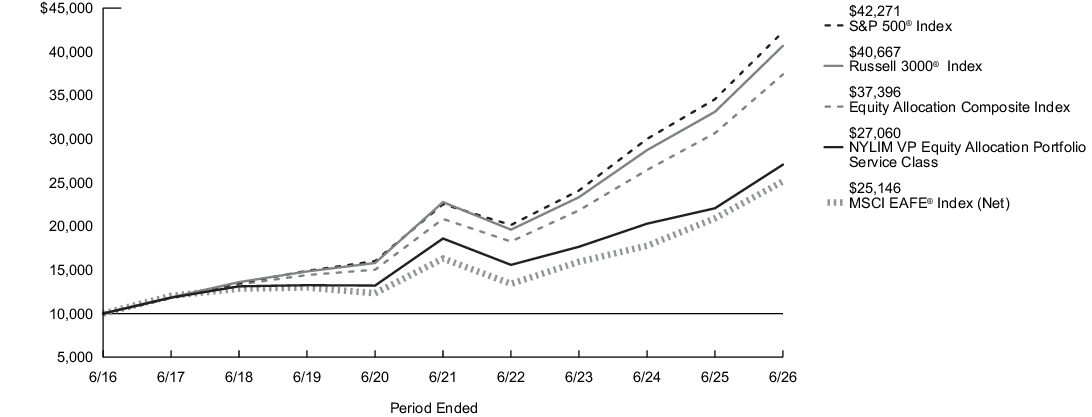
| Average Annual Total Returns for the Period Ended June 30, 2026 | Inception Date |
Six Months1 |
One Year |
Five Years |
Ten Years |
| Service Class Shares | 2/13/2006 | 13.06% | 22.65% | 7.79% | 10.47% |
| Russell 3000®Index2 | 10.86% | 22.81% | 12.30% | 15.06% | |
| S&P 500®Index3 | 10.21% | 22.33% | 13.41% | 15.51% | |
| MSCI EAFE® Index (Net)4 | 9.44% | 20.23% | 9.05% | 9.66% | |
| Equity Allocation Composite Index5 | 10.11% | 21.93% | 12.41% | 14.10% | |
| Morningstar Global Aggressive Allocation Category Average6 | 10.84% | 20.47% | 8.53% | 11.04% |
| 1. |
Not annualized. |
| 2. |
The Portfolio has selected the Russell 3000® Index to represent a broad measure of market performance. The Russell 3000® Index measures the performance of the largest 3,000 U.S. companies representing approximately 98% of the investable U.S. equity market. |
| 3. |
The S&P 500® Index, which represents a broad measure of market performance, is generally representative of the market sectors or types of investments in which the Portfolio invests. S&P® and S&P 500® are registered trademarks of Standard & Poor’s Financial Services LLC. The S&P 500® Index is widely regarded as the standard index for measuring large-cap U.S. stock market performance. |
| 4. |
The MSCI EAFE® Index (Net), which is generally representative of the market sectors or types of investments in which the Portfolio invests, consists of international stocks representing the developed world outside of North America. |
| 5. |
The Equity Allocation Composite Index, which is generally representative of the market sectors or types of investments in which the Portfolio invests, consists of the S&P 500® Index and the MSCI EAFE® Index (Net) weighted 75% and 25%, respectively. |
| 6. |
The Morningstar Global Aggressive Allocation Category Average is representative of funds in allocation categories that seek to provide both income and capital appreciation by primarily investing in multiple asset classes, including stocks, bonds, and cash. These aggressive strategies typically allocate at least 10% to equities of foreign companies and prioritize capital appreciation over preservation. They typically expect volatility similar to a strategic equity exposure of more than 85%. Results are based on average total returns of similar funds with all dividends and capital gain distributions reinvested. |
Key Portfolio Statistics
| Portfolio's net assets | $724,329,281 |
| Total number of portfolio holdings | 35 |
| Portfolio turnover rate | 13% |
Asset Diversification
(as a Percentage of Net Asset Value)
(as a Percentage of Net Asset Value)
| Equity Funds | 97.7% |
| Short-Term Investment | 2.1% |
| Other Assets, Less Liabilities | 0.2% |
What were the Portfolio costs for the last six months?1
(Based on a hypothetical $10,000 investment)
| Share Class Name | Costs of a $10,000 investment | Costs paid as a percentage of a $10,000 investment2,3 |
| Service Class | $15 | 0.28% |
| 1. | Does not include any separate account or policy fees or charges imposed under the variable annuity policies and variable universal life insurance policies for which the Portfolio is an investment option. If they were included, your costs would be higher. |
| 2. | Annualized. |
| 3. | Excludes the fees and expenses of the acquired (underlying) funds in which the Portfolio invested. |
Portfolio Performance
The following graph compares the initial and subsequent account values at the end of each of the most recently completed 10 semiannual reporting periods of the Portfolio (or for the life of the Portfolio, if shorter). It assumes a $10,000 initial investment at the beginning of the first fiscal period in an appropriate, broad-based securities market index and other indexes, if applicable, for the same period.
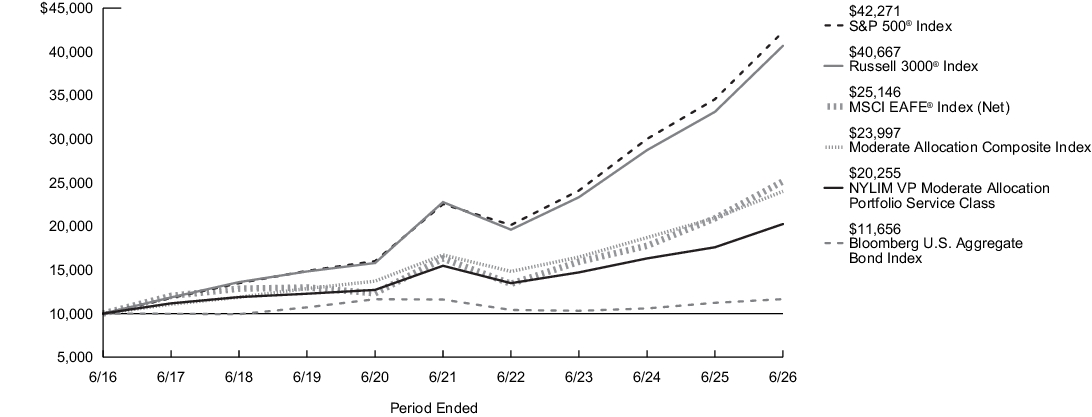
| Average Annual Total Returns for the Period Ended June 30, 2026 | Inception Date |
Six Months1 |
One Year |
Five Years |
Ten Years |
| Service Class Shares | 2/13/2006 | 8.31% | 15.12% | 5.53% | 7.31% |
| Russell 3000®Index2 | 10.86% | 22.81% | 12.30% | 15.06% | |
| S&P 500®Index3 | 10.21% | 22.33% | 13.41% | 15.51% | |
| MSCI EAFE® Index (Net)4 | 9.44% | 20.23% | 9.05% | 9.66% | |
| Bloomberg U.S. Aggregate Bond Index5 | 0.62% | 3.79% | 0.08% | 1.54% | |
| Moderate Allocation Composite Index6 | 6.38% | 14.52% | 7.49% | 9.15% | |
| Morningstar Global Moderate Allocation Category Average7 | 8.07% | 16.58% | 6.47% | 7.55% |
| 1. |
Not annualized. |
| 2. |
The Portfolio has selected the Russell 3000® Index to represent a broad measure of market performance. The Russell 3000® Index measures the performance of the largest 3,000 U.S. companies representing approximately 98% of the investable U.S. equity market. |
| 3. |
The S&P 500® Index, which represents a broad measure of market performance, is generally representative of the market sectors or types of investments in which the Portfolio invests. S&P® and S&P 500® are registered trademarks of Standard & Poor’s Financial Services LLC. The S&P 500® Index is widely regarded as the standard index for measuring large-cap U.S. stock market performance. |
| 4. |
The MSCI EAFE® Index (Net), which is generally representative of the market sectors or types of investments in which the Portfolio invests, consists of international stocks representing the developed world outside of North America. |
| 5. |
The Bloomberg U.S. Aggregate Bond Index, which is generally representative of the market sectors or types of investments in which the Portfolio invests, is a broad-based benchmark that measures the performance of the investment grade, U.S. dollar-denominated, fixed-rate taxable bond market, including Treasuries, government-related and corporate securities, mortgage-backed securities (agency fixed-rate and hybrid adjustable rate mortgage pass-throughs), asset-backed securities and commercial mortgage-backed securities. |
| 6. |
The Moderate Allocation Composite Index, which is generally representative of the market sectors or types of investments in which the Portfolio invests, consists of the S&P 500® Index, the MSCI EAFE® Index (Net) and the Bloomberg U.S. Aggregate Bond Index weighted 45%,15% and 40%, respectively. |
| 7. |
The Morningstar Global Moderate Allocation Category Average is representative of funds in allocation categories that seek to provide both income and capital appreciation by primarily investing in multiple asset classes, including stocks, bonds, and cash. These moderate strategies seek to balance preservation of capital with appreciation. They typically expect volatility similar to a strategic equity exposure between 50% and 70%. Results are based on average total returns of similar funds with all dividends and capital gain distributions reinvested. |
Key Portfolio Statistics
| Portfolio's net assets | $661,134,675 |
| Total number of portfolio holdings | 44 |
| Portfolio turnover rate | 18% |
Asset Diversification
(as a Percentage of Net Asset Value)
(as a Percentage of Net Asset Value)
| Equity Funds | 56.9% |
| Fixed Income Funds | 33.5% |
| Short-Term Investment | 9.1% |
| Other Assets, Less Liabilities | 0.5% |
What were the Portfolio costs for the last six months?1
(Based on a hypothetical $10,000 investment)
| Share Class Name | Costs of a $10,000 investment | Costs paid as a percentage of a $10,000 investment2,3 |
| Initial Class | $2 | 0.03% |
| 1. | Does not include any separate account or policy fees or charges imposed under the variable annuity policies and variable universal life insurance policies for which the Portfolio is an investment option. If they were included, your costs would be higher. |
| 2. | Annualized. |
| 3. | Excludes the fees and expenses of the acquired (underlying) funds in which the Portfolio invested. |
Portfolio Performance
The following graph compares the initial and subsequent account values at the end of each of the most recently completed 10 semiannual reporting periods of the Portfolio (or for the life of the Portfolio, if shorter). It assumes a $10,000 initial investment at the beginning of the first fiscal period in an appropriate, broad-based securities market index and other indexes, if applicable, for the same period.
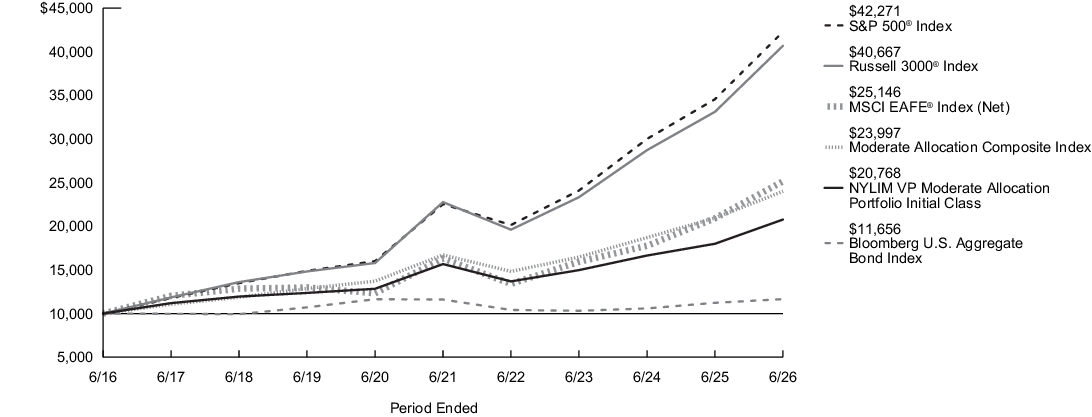
| Average Annual Total Returns for the Period Ended June 30, 2026 | Inception Date |
Six Months1 |
One Year |
Five Years |
Ten Years |
| Initial Class Shares | 2/13/2006 | 8.44% | 15.41% | 5.80% | 7.58% |
| Russell 3000®Index2 | 10.86% | 22.81% | 12.30% | 15.06% | |
| S&P 500®Index3 | 10.21% | 22.33% | 13.41% | 15.51% | |
| MSCI EAFE® Index (Net)4 | 9.44% | 20.23% | 9.05% | 9.66% | |
| Bloomberg U.S. Aggregate Bond Index5 | 0.62% | 3.79% | 0.08% | 1.54% | |
| Moderate Allocation Composite Index6 | 6.38% | 14.52% | 7.49% | 9.15% | |
| Morningstar Global Moderate Allocation Category Average7 | 8.07% | 16.58% | 6.47% | 7.55% |
| 1. |
Not annualized. |
| 2. |
The Portfolio has selected the Russell 3000® Index to represent a broad measure of market performance. The Russell 3000® Index measures the performance of the largest 3,000 U.S. companies representing approximately 98% of the investable U.S. equity market. |
| 3. |
The S&P 500® Index, which represents a broad measure of market performance, is generally representative of the market sectors or types of investments in which the Portfolio invests. S&P® and S&P 500® are registered trademarks of Standard & Poor’s Financial Services LLC. The S&P 500® Index is widely regarded as the standard index for measuring large-cap U.S. stock market performance. |
| 4. |
The MSCI EAFE® Index (Net), which is generally representative of the market sectors or types of investments in which the Portfolio invests, consists of international stocks representing the developed world outside of North America. |
| 5. |
The Bloomberg U.S. Aggregate Bond Index, which is generally representative of the market sectors or types of investments in which the Portfolio invests, is a broad-based benchmark that measures the performance of the investment grade, U.S. dollar-denominated, fixed-rate taxable bond market, including Treasuries, government-related and corporate securities, mortgage-backed securities (agency fixed-rate and hybrid adjustable rate mortgage pass-throughs), asset-backed securities and commercial mortgage-backed securities. |
| 6. |
The Moderate Allocation Composite Index, which is generally representative of the market sectors or types of investments in which the Portfolio invests, consists of the S&P 500® Index, the MSCI EAFE® Index (Net) and the Bloomberg U.S. Aggregate Bond Index weighted 45%,15% and 40%, respectively. |
| 7. |
The Morningstar Global Moderate Allocation Category Average is representative of funds in allocation categories that seek to provide both income and capital appreciation by primarily investing in multiple asset classes, including stocks, bonds, and cash. These moderate strategies seek to balance preservation of capital with appreciation. They typically expect volatility similar to a strategic equity exposure between 50% and 70%. Results are based on average total returns of similar funds with all dividends and capital gain distributions reinvested. |
Key Portfolio Statistics
| Portfolio's net assets | $661,134,675 |
| Total number of portfolio holdings | 44 |
| Portfolio turnover rate | 18% |
Asset Diversification
(as a Percentage of Net Asset Value)
(as a Percentage of Net Asset Value)
| Equity Funds | 56.9% |
| Fixed Income Funds | 33.5% |
| Short-Term Investment | 9.1% |
| Other Assets, Less Liabilities | 0.5% |
What were the Portfolio costs for the last six months?1
(Based on a hypothetical $10,000 investment)
| Share Class Name | Costs of a $10,000 investment | Costs paid as a percentage of a $10,000 investment2,3 |
| Initial Class | $2 | 0.03% |
| 1. | Does not include any separate account or policy fees or charges imposed under the variable annuity policies and variable universal life insurance policies for which the Portfolio is an investment option. If they were included, your costs would be higher. |
| 2. | Annualized. |
| 3. | Excludes the fees and expenses of the acquired (underlying) funds in which the Portfolio invested. |
Portfolio Performance
The following graph compares the initial and subsequent account values at the end of each of the most recently completed 10 semiannual reporting periods of the Portfolio (or for the life of the Portfolio, if shorter). It assumes a $10,000 initial investment at the beginning of the first fiscal period in an appropriate, broad-based securities market index and other indexes, if applicable, for the same period.
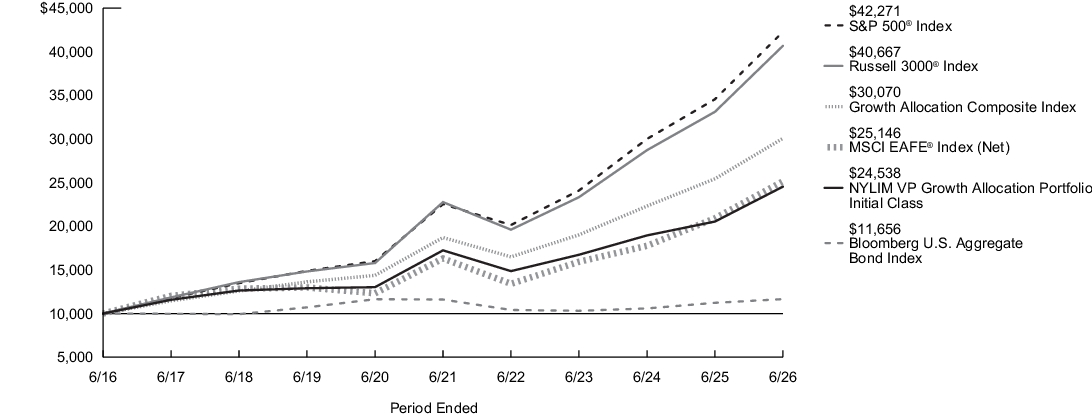
| Average Annual Total Returns for the Period Ended June 30, 2026 | Inception Date |
Six Months1 |
One Year |
Five Years |
Ten Years |
| Initial Class Shares | 2/13/2006 | 10.88% | 19.46% | 7.31% | 9.39% |
| Russell 3000®Index2 | 10.86% | 22.81% | 12.30% | 15.06% | |
| S&P 500®Index3 | 10.21% | 22.33% | 13.41% | 15.51% | |
| MSCI EAFE® Index (Net)4 | 9.44% | 20.23% | 9.05% | 9.66% | |
| Bloomberg U.S. Aggregate Bond Index5 | 0.62% | 3.79% | 0.08% | 1.54% | |
| Growth Allocation Composite Index6 | 8.25% | 18.20% | 9.95% | 11.64% | |
| Morningstar Global Moderately Aggressive Allocation Category Average7 | 10.12% | 19.63% | 8.02% | 9.51% |
| 1. |
Not annualized. |
| 2. |
The Portfolio has selected the Russell 3000® Index to represent a broad measure of market performance. The Russell 3000® Index measures the performance of the largest 3,000 U.S. companies representing approximately 98% of the investable U.S. equity market. |
| 3. |
The S&P 500® Index, which represents a broad measure of market performance, is generally representative of the market sectors or types of investments in which the Portfolio invests. S&P® and S&P 500® are registered trademarks of Standard & Poor’s Financial Services LLC. The S&P 500® Index is widely regarded as the standard index for measuring large-cap U.S. stock market performance. |
| 4. |
The MSCI EAFE® Index (Net), which is generally representative of the market sectors or types of investments in which the Portfolio invests, consists of international stocks representing the developed world outside of North America. |
| 5. |
The Bloomberg U.S. Aggregate Bond Index, which is generally representative of the market sectors or types of investments in which the Portfolio invests, is a broad-based benchmark that measures the performance of the investment grade, U.S. dollar-denominated, fixed-rate taxable bond market, including Treasuries, government-related and corporate securities, mortgage-backed securities (agency fixed-rate and hybrid adjustable rate mortgage pass-throughs), asset-backed securities and commercial mortgage-backed securities. |
| 6. |
The Growth Allocation Composite Index, which is generally representative of the market sectors or types of investments in which the Portfolio invests, consists of the S&P 500® Index, the MSCI EAFE® Index (Net) and the Bloomberg U.S. Aggregate Bond Index weighted 60%, 20% and 20%, respectively. |
| 7. |
The Morningstar Global Moderately Aggressive Allocation Category Average is representative of funds in allocation categories that seek to provide both income and capital appreciation by primarily investing in multiple asset classes, including stocks, bonds, and cash. These moderately aggressive strategies prioritize capital appreciation over preservation. They typically expect volatility similar to a strategic equity exposure between 70% and 85%. Results are based on average total returns of similar funds with all dividends and capital gain distributions reinvested. |
Key Portfolio Statistics
| Portfolio's net assets | $993,953,411 |
| Total number of portfolio holdings | 44 |
| Portfolio turnover rate | 16% |
Asset Diversification
(as a Percentage of Net Asset Value)
(as a Percentage of Net Asset Value)
| Equity Funds | 77.3% |
| Fixed Income Funds | 13.7% |
| Short-Term Investment | 8.8% |
| Other Assets, Less Liabilities | 0.2% |
What were the Portfolio costs for the last six months?1
(Based on a hypothetical $10,000 investment)
| Share Class Name | Costs of a $10,000 investment | Costs paid as a percentage of a $10,000 investment2,3 |
| Service Class | $15 | 0.28% |
| 1. | Does not include any separate account or policy fees or charges imposed under the variable annuity policies and variable universal life insurance policies for which the Portfolio is an investment option. If they were included, your costs would be higher. |
| 2. | Annualized. |
| 3. | Excludes the fees and expenses of the acquired (underlying) funds in which the Portfolio invested. |
Portfolio Performance
The following graph compares the initial and subsequent account values at the end of each of the most recently completed 10 semiannual reporting periods of the Portfolio (or for the life of the Portfolio, if shorter). It assumes a $10,000 initial investment at the beginning of the first fiscal period in an appropriate, broad-based securities market index and other indexes, if applicable, for the same period.
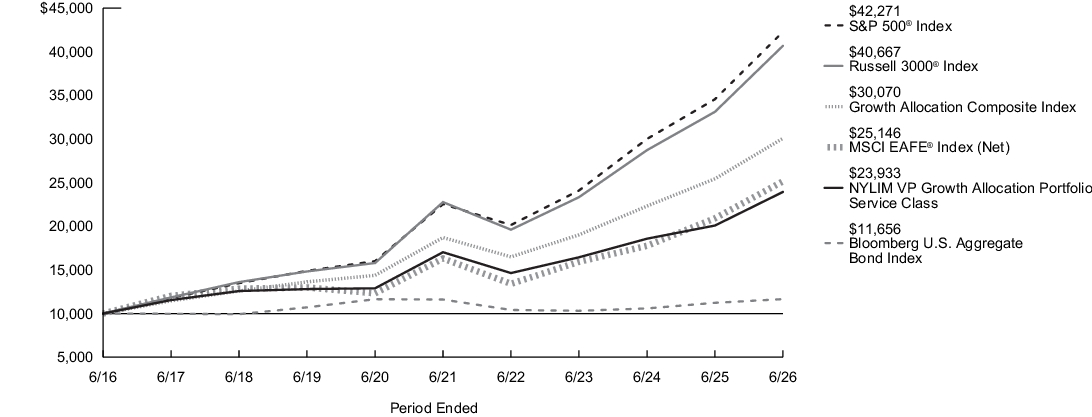
| Average Annual Total Returns for the Period Ended June 30, 2026 | Inception Date |
Six Months1 |
One Year |
Five Years |
Ten Years |
| Service Class Shares | 2/13/2006 | 10.74% | 19.16% | 7.05% | 9.12% |
| Russell 3000®Index2 | 10.86% | 22.81% | 12.30% | 15.06% | |
| S&P 500®Index3 | 10.21% | 22.33% | 13.41% | 15.51% | |
| MSCI EAFE® Index (Net)4 | 9.44% | 20.23% | 9.05% | 9.66% | |
| Bloomberg U.S. Aggregate Bond Index5 | 0.62% | 3.79% | 0.08% | 1.54% | |
| Growth Allocation Composite Index6 | 8.25% | 18.20% | 9.95% | 11.64% | |
| Morningstar Global Moderately Aggressive Allocation Category Average7 | 10.12% | 19.63% | 8.02% | 9.51% |
| 1. |
Not annualized. |
| 2. |
The Portfolio has selected the Russell 3000® Index to represent a broad measure of market performance. The Russell 3000® Index measures the performance of the largest 3,000 U.S. companies representing approximately 98% of the investable U.S. equity market. |
| 3. |
The S&P 500® Index, which represents a broad measure of market performance, is generally representative of the market sectors or types of investments in which the Portfolio invests. S&P® and S&P 500® are registered trademarks of Standard & Poor’s Financial Services LLC. The S&P 500® Index is widely regarded as the standard index for measuring large-cap U.S. stock market performance. |
| 4. |
The MSCI EAFE® Index (Net), which is generally representative of the market sectors or types of investments in which the Portfolio invests, consists of international stocks representing the developed world outside of North America. |
| 5. |
The Bloomberg U.S. Aggregate Bond Index, which is generally representative of the market sectors or types of investments in which the Portfolio invests, is a broad-based benchmark that measures the performance of the investment grade, U.S. dollar-denominated, fixed-rate taxable bond market, including Treasuries, government-related and corporate securities, mortgage-backed securities (agency fixed-rate and hybrid adjustable rate mortgage pass-throughs), asset-backed securities and commercial mortgage-backed securities. |
| 6. |
The Growth Allocation Composite Index, which is generally representative of the market sectors or types of investments in which the Portfolio invests, consists of the S&P 500® Index, the MSCI EAFE® Index (Net) and the Bloomberg U.S. Aggregate Bond Index weighted 60%, 20% and 20%, respectively. |
| 7. |
The Morningstar Global Moderately Aggressive Allocation Category Average is representative of funds in allocation categories that seek to provide both income and capital appreciation by primarily investing in multiple asset classes, including stocks, bonds, and cash. These moderately aggressive strategies prioritize capital appreciation over preservation. They typically expect volatility similar to a strategic equity exposure between 70% and 85%. Results are based on average total returns of similar funds with all dividends and capital gain distributions reinvested. |
Key Portfolio Statistics
| Portfolio's net assets | $993,953,411 |
| Total number of portfolio holdings | 44 |
| Portfolio turnover rate | 16% |
Asset Diversification
(as a Percentage of Net Asset Value)
(as a Percentage of Net Asset Value)
| Equity Funds | 77.3% |
| Fixed Income Funds | 13.7% |
| Short-Term Investment | 8.8% |
| Other Assets, Less Liabilities | 0.2% |
What were the Portfolio costs for the last six months?1
(Based on a hypothetical $10,000 investment)
| Share Class Name | Costs of a $10,000 investment | Costs paid as a percentage of a $10,000 investment2,3 |
| Service Class | $19 | 0.37% |
| 1. | Does not include any separate account or policy fees or charges imposed under the variable annuity policies and variable universal life insurance policies for which the Portfolio is an investment option. If they were included, your costs would be higher. |
| 2. | Reflects fee waivers and/or expense reimbursements, without which expenses would have been higher. |
| 3. | Annualized. |
Portfolio Performance
The following graph compares the initial and subsequent account values at the end of each of the most recently completed 10 semiannual reporting periods of the Portfolio (or for the life of the Portfolio, if shorter). It assumes a $10,000 initial investment at the beginning of the first fiscal period in an appropriate, broad-based securities market index and other indexes, if applicable, for the same period. The Portfolio’s subadvisor changed effective January 1, 2018 due to an organizational restructuring whereby all investment personnel of Cornerstone Capital Management Holdings LLC, the former subadvisor, transitioned to MacKay Shields LLC. The Portfolio's subadvisor changed again effective June 10, 2022 due to the transition of Francis J. Ok, the Portfolio's portfolio manager, from MacKay Shields LLC, a former subadvisor, to IndexIQ Advisors LLC, which is a wholly-owned, indirect subsidiary of New York Life Investment Holdings LLC. Effective August 28, 2024, all investment personnel of IndexIQ Advisors LLC, a former subadvisor, and the day-to-day investment services provided by IndexIQ Advisors LLC to the Portfolio, were transitioned to New York Life Investment Management LLC. The past performance in the graph and table prior to the dates above reflects the Portfolio's prior subadvisors.
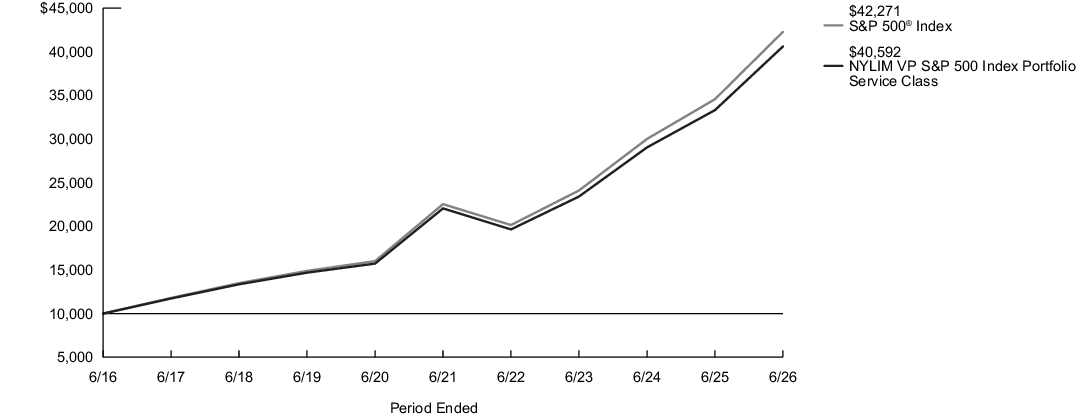
| Average Annual Total Returns for the Period Ended June 30, 2026 | Inception Date |
Six Months1 |
One Year |
Five Years |
Ten Years |
| Service Class Shares | 6/5/2003 | 10.01% | 21.87% | 12.98% | 15.04% |
| S&P 500®Index2 | 10.21% | 22.33% | 13.41% | 15.51% | |
| Morningstar Large Blend Category Average3 | 9.74% | 20.23% | 11.51% | 14.04% |
| 1. |
Not annualized. |
| 2. |
The Portfolio has selected the S&P 500® Index, which represents a broad measure of market performance, and is generally representative of the market sectors or types of investments in which the Portfolio invests. The S&P 500® Index is widely regarded as the standard index for measuring large-cap U.S. stock market performance. S&P® and S&P 500® are registered trademarks of Standard & Poor’s Financial Services LLC (“S&P”) and Dow Jones® is a registered trademark of Dow Jones Trademark Holdings LLC (“Dow Jones”). The foregoing trademarks have been licensed for use by S&P Dow Jones Indices LLC and sublicensed for certain purposes by New York Life Investment Management LLC. The S&P 500® Index is a product of S&P Dow Jones Indices LLC and has been licensed for use by New York Life Investment Management LLC. NYLI VP S&P 500 Index Portfolio is not sponsored, endorsed, sold or promoted by S&P Dow Jones Indices LLC, Dow Jones, S&P or their respective affiliates and neither S&P Dow Jones Indices LLC, Dow Jones, S&P nor their respective affiliates make any representation regarding the advisability of investing in such product(s). |
| 3. |
The Morningstar Large Blend Category Average is representative of funds that represent the overall U.S. stock market in size, growth rates and price. Stocks in the top 70% of the capitalization of the U.S. equity market are defined as large cap. The blend style is assigned to funds where neither growth nor value characteristics predominate. These funds tend to invest across the spectrum of U.S. industries, and owing to their broad exposure, the funds' returns are often similar to those of the S&P 500® Index. Results are based on average total returns of similar funds with all dividends and capital gain distributions reinvested. |
Key Portfolio Statistics
| Portfolio's net assets | $6,471,028,477 |
| Total number of portfolio holdings | 510 |
| Portfolio turnover rate | 0.0%1 |
| 1. |
Less than 0.5%. |
Graphical Representation of Holdings
The tables below show the investment makeup of the Portfolio; percentages indicated are based on the Portfolio's net assets.
Top Ten Holdings and/or Issuers*
| NVIDIA Corp. | 7.4% |
| Apple, Inc. | 6.5% |
| Alphabet, Inc., Class A | 5.8% |
| Microsoft Corp. | 4.3% |
| Amazon.com, Inc. | 3.6% |
| Broadcom, Inc. | 2.7% |
| Micron Technology, Inc. | 2.0% |
| Meta Platforms, Inc., Class A | 1.9% |
| Tesla, Inc. | 1.8% |
| Eli Lilly & Co. | 1.5% |
| * Excluding short-term investments |
Top Industries
| Semiconductors & Semiconductor Equipment | 18.9% |
| Technology Hardware, Storage & Peripherals | 8.1% |
| Interactive Media & Services | 7.7% |
| Software | 7.4% |
| Broadline Retail | 3.7% |
| Banks | 3.4% |
| Pharmaceuticals | 3.4% |
| Financial Services | 3.3% |
| Capital Markets | 2.9% |
| Oil, Gas & Consumable Fuels | 2.7% |
| Other | 38.5% |
Top Ten Holdings and/or Issuers*
| NVIDIA Corp. | 7.4% |
| Apple, Inc. | 6.5% |
| Alphabet, Inc., Class A | 5.8% |
| Microsoft Corp. | 4.3% |
| Amazon.com, Inc. | 3.6% |
| Broadcom, Inc. | 2.7% |
| Micron Technology, Inc. | 2.0% |
| Meta Platforms, Inc., Class A | 1.9% |
| Tesla, Inc. | 1.8% |
| Eli Lilly & Co. | 1.5% |
| * Excluding short-term investments |
What were the Portfolio costs for the last six months?1
(Based on a hypothetical $10,000 investment)
| Share Class Name | Costs of a $10,000 investment | Costs paid as a percentage of a $10,000 investment2,3 |
| Initial Class | $6 | 0.12% |
| 1. | Does not include any separate account or policy fees or charges imposed under the variable annuity policies and variable universal life insurance policies for which the Portfolio is an investment option. If they were included, your costs would be higher. |
| 2. | Reflects fee waivers and/or expense reimbursements, without which expenses would have been higher. |
| 3. | Annualized. |
Portfolio Performance
The following graph compares the initial and subsequent account values at the end of each of the most recently completed 10 semiannual reporting periods of the Portfolio (or for the life of the Portfolio, if shorter). It assumes a $10,000 initial investment at the beginning of the first fiscal period in an appropriate, broad-based securities market index and other indexes, if applicable, for the same period. The Portfolio’s subadvisor changed effective January 1, 2018 due to an organizational restructuring whereby all investment personnel of Cornerstone Capital Management Holdings LLC, the former subadvisor, transitioned to MacKay Shields LLC. The Portfolio's subadvisor changed again effective June 10, 2022 due to the transition of Francis J. Ok, the Portfolio's portfolio manager, from MacKay Shields LLC, a former subadvisor, to IndexIQ Advisors LLC, which is a wholly-owned, indirect subsidiary of New York Life Investment Holdings LLC. Effective August 28, 2024, all investment personnel of IndexIQ Advisors LLC, a former subadvisor, and the day-to-day investment services provided by IndexIQ Advisors LLC to the Portfolio, were transitioned to New York Life Investment Management LLC. The past performance in the graph and table prior to the dates above reflects the Portfolio's prior subadvisors.
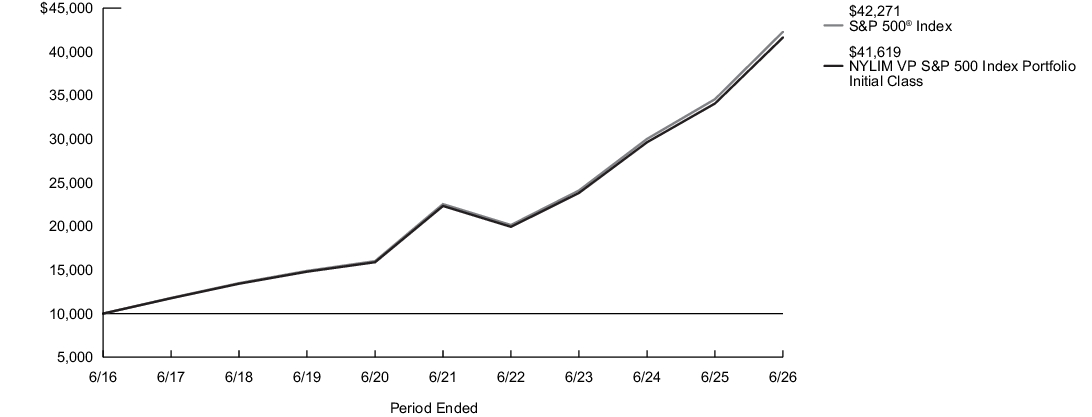
| Average Annual Total Returns for the Period Ended June 30, 2026 | Inception Date |
Six Months1 |
One Year |
Five Years |
Ten Years |
| Initial Class Shares | 1/29/1993 | 10.14% | 22.18% | 13.27% | 15.33% |
| S&P 500®Index2 | 10.21% | 22.33% | 13.41% | 15.51% | |
| Morningstar Large Blend Category Average3 | 9.74% | 20.23% | 11.51% | 14.04% |
| 1. |
Not annualized. |
| 2. |
The Portfolio has selected the S&P 500® Index, which represents a broad measure of market performance, and is generally representative of the market sectors or types of investments in which the Portfolio invests. The S&P 500® Index is widely regarded as the standard index for measuring large-cap U.S. stock market performance. S&P® and S&P 500® are registered trademarks of Standard & Poor’s Financial Services LLC (“S&P”) and Dow Jones® is a registered trademark of Dow Jones Trademark Holdings LLC (“Dow Jones”). The foregoing trademarks have been licensed for use by S&P Dow Jones Indices LLC and sublicensed for certain purposes by New York Life Investment Management LLC. The S&P 500® Index is a product of S&P Dow Jones Indices LLC and has been licensed for use by New York Life Investment Management LLC. NYLI VP S&P 500 Index Portfolio is not sponsored, endorsed, sold or promoted by S&P Dow Jones Indices LLC, Dow Jones, S&P or their respective affiliates and neither S&P Dow Jones Indices LLC, Dow Jones, S&P nor their respective affiliates make any representation regarding the advisability of investing in such product(s). |
| 3. |
The Morningstar Large Blend Category Average is representative of funds that represent the overall U.S. stock market in size, growth rates and price. Stocks in the top 70% of the capitalization of the U.S. equity market are defined as large cap. The blend style is assigned to funds where neither growth nor value characteristics predominate. These funds tend to invest across the spectrum of U.S. industries, and owing to their broad exposure, the funds' returns are often similar to those of the S&P 500® Index. Results are based on average total returns of similar funds with all dividends and capital gain distributions reinvested. |
Key Portfolio Statistics
| Portfolio's net assets | $6,471,028,477 |
| Total number of portfolio holdings | 510 |
| Portfolio turnover rate | 0.0%1 |
| 1. |
Less than 0.5%. |
Graphical Representation of Holdings
The tables below show the investment makeup of the Portfolio; percentages indicated are based on the Portfolio's net assets.
Top Ten Holdings and/or Issuers*
| NVIDIA Corp. | 7.4% |
| Apple, Inc. | 6.5% |
| Alphabet, Inc., Class A | 5.8% |
| Microsoft Corp. | 4.3% |
| Amazon.com, Inc. | 3.6% |
| Broadcom, Inc. | 2.7% |
| Micron Technology, Inc. | 2.0% |
| Meta Platforms, Inc., Class A | 1.9% |
| Tesla, Inc. | 1.8% |
| Eli Lilly & Co. | 1.5% |
| * Excluding short-term investments |
Top Industries
| Semiconductors & Semiconductor Equipment | 18.9% |
| Technology Hardware, Storage & Peripherals | 8.1% |
| Interactive Media & Services | 7.7% |
| Software | 7.4% |
| Broadline Retail | 3.7% |
| Banks | 3.4% |
| Pharmaceuticals | 3.4% |
| Financial Services | 3.3% |
| Capital Markets | 2.9% |
| Oil, Gas & Consumable Fuels | 2.7% |
| Other | 38.5% |
Top Ten Holdings and/or Issuers*
| NVIDIA Corp. | 7.4% |
| Apple, Inc. | 6.5% |
| Alphabet, Inc., Class A | 5.8% |
| Microsoft Corp. | 4.3% |
| Amazon.com, Inc. | 3.6% |
| Broadcom, Inc. | 2.7% |
| Micron Technology, Inc. | 2.0% |
| Meta Platforms, Inc., Class A | 1.9% |
| Tesla, Inc. | 1.8% |
| Eli Lilly & Co. | 1.5% |
| * Excluding short-term investments |
What were the Portfolio costs for the last six months?1
(Based on a hypothetical $10,000 investment)
| Share Class Name | Costs of a $10,000 investment | Costs paid as a percentage of a $10,000 investment2,3 |
| Initial Class | $33 | 0.63% |
| 1. | Does not include any separate account or policy fees or charges imposed under the variable annuity policies and variable universal life insurance policies for which the Portfolio is an investment option. If they were included, your costs would be higher. |
| 2. | Reflects fee waivers and/or expense reimbursements, without which expenses would have been higher. |
| 3. | Annualized. |
Portfolio Performance
The following graph compares the initial and subsequent account values at the end of each of the most recently completed 10 semiannual reporting periods of the Portfolio (or for the life of the Portfolio, if shorter). It assumes a $10,000 initial investment at the beginning of the first fiscal period in an appropriate, broad-based securities market index and other indexes, if applicable, for the same period.
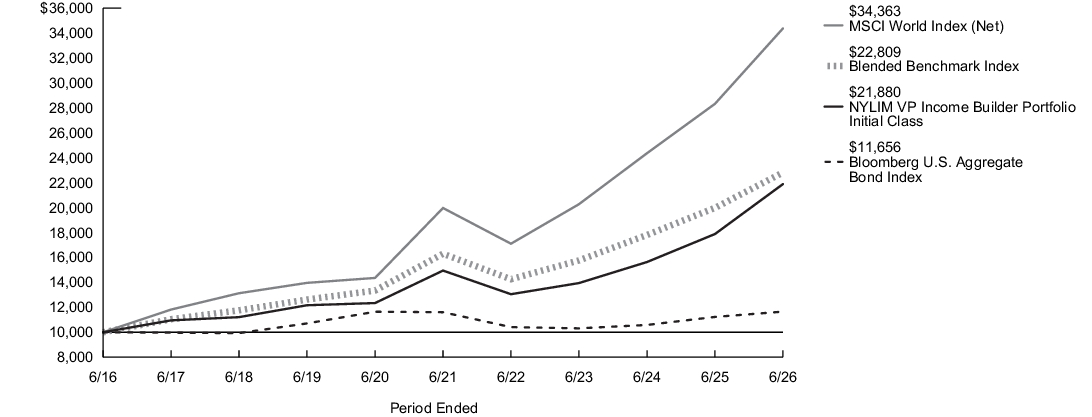
| Average Annual Total Returns for the Period Ended June 30, 2026 | Inception Date |
Six Months1 |
One Year |
Five Years |
Ten Years |
| Initial Class Shares | 1/29/1993 | 14.20% | 22.37% | 7.92% | 8.14% |
| MSCI World Index (Net)2 | 9.69% | 21.34% | 11.47% | 13.14% | |
| Bloomberg U.S. Aggregate Bond Index3 | 0.62% | 3.79% | 0.08% | 1.54% | |
| Blended Benchmark Index4 | 6.13% | 14.18% | 6.96% | 8.60% | |
| Morningstar Global Moderate Allocation Category Average5 | (1.07)% | 16.58% | 6.47% | 7.55% |
| 1. |
Not annualized. |
| 2. |
The Portfolio has selected the MSCI World Index (Net) to represent a broad measure of market performance. The MSCI World Index (Net) is a free float-adjusted market capitalization weighted index that is designed to measure the equity market performance of developed markets. |
| 3. |
The Bloomberg U.S. Aggregate Bond Index is a broad-based benchmark that measures the performance of the investment-grade, U.S. dollar-denominated, fixed-rate taxable bond market, including Treasuries, government-related and corporate securities, mortgage-backed securities (agency fixed-rate and hybrid adjustable-rate mortgage pass-throughs), asset-backed securities and commercial mortgage-backed securities. |
| 4. |
The Blended Benchmark Index is comprised of the MSCI World Index (Net) and the Bloomberg U.S. Aggregate Bond Index weighted 60%/40%, respectively. |
| 5. |
Morningstar Global Moderate Allocation Category Average funds seek to provide both income and capital appreciation by primarily investing in multiple asset classes, including stocks, bonds, and cash. These moderate strategies seek to balance preservation of capital with appreciation. They typically expect volatility similar to a strategic equity exposure between 50% and 70%. Results are based on average total returns of similar funds with all dividends and capital gain distributions reinvested. |
Key Portfolio Statistics
| Portfolio's net assets | $617,116,537 |
| Total number of portfolio holdings | 639 |
| Portfolio turnover rate | 41% |
Graphical Representation of Holdings
The tables below show the investment makeup of the Portfolio; percentages indicated are based on the Portfolio's net assets.
Top Ten Holdings and/or Issuers*
| U.S. Treasury Bonds, 5.00%, due 5/15/46-5/15/56 | 3.1% |
| U.S. Treasury Notes, 3.875%-4.375%, due 4/30/31-5/15/36 | 2.9% |
| UMBS, 30 Year, 2.00%-6.00%, due 8/1/48-3/1/56 | 2.6% |
| GNMA, (zero coupon)-7.833%, due 7/20/44-3/16/66 | 1.8% |
| Taiwan Semiconductor Manufacturing Co. Ltd. | 1.5% |
| Dell Technologies, Inc., Class C | 1.4% |
| Cisco Systems, Inc. | 1.4% |
| CVS Health Corp. | 1.3% |
| Texas Instruments, Inc. | 1.2% |
| Broadcom, Inc. | 1.2% |
| * Excluding short-term investments |
Portfolio Composition
| Common Stocks | 59.0% |
| Corporate Bonds | 11.4% |
| U.S. Government & Federal Agencies | 10.3% |
| Mortgage-Backed Securities | 9.7% |
| Asset-Backed Securities | 3.8% |
| Short-Term Investments | 2.9% |
| Loan Assignments | 1.1% |
| Foreign Government Bonds | 0.8% |
| Other Assets, Less Liabilities | 1.0% |
Top Ten Holdings and/or Issuers*
| U.S. Treasury Bonds, 5.00%, due 5/15/46-5/15/56 | 3.1% |
| U.S. Treasury Notes, 3.875%-4.375%, due 4/30/31-5/15/36 | 2.9% |
| UMBS, 30 Year, 2.00%-6.00%, due 8/1/48-3/1/56 | 2.6% |
| GNMA, (zero coupon)-7.833%, due 7/20/44-3/16/66 | 1.8% |
| Taiwan Semiconductor Manufacturing Co. Ltd. | 1.5% |
| Dell Technologies, Inc., Class C | 1.4% |
| Cisco Systems, Inc. | 1.4% |
| CVS Health Corp. | 1.3% |
| Texas Instruments, Inc. | 1.2% |
| Broadcom, Inc. | 1.2% |
| * Excluding short-term investments |
What were the Portfolio costs for the last six months?1
(Based on a hypothetical $10,000 investment)
| Share Class Name | Costs of a $10,000 investment | Costs paid as a percentage of a $10,000 investment2,3 |
| Service Class | $47 | 0.88% |
| 1. | Does not include any separate account or policy fees or charges imposed under the variable annuity policies and variable universal life insurance policies for which the Portfolio is an investment option. If they were included, your costs would be higher. |
| 2. | Reflects fee waivers and/or expense reimbursements, without which expenses would have been higher. |
| 3. | Annualized. |
Portfolio Performance
The following graph compares the initial and subsequent account values at the end of each of the most recently completed 10 semiannual reporting periods of the Portfolio (or for the life of the Portfolio, if shorter). It assumes a $10,000 initial investment at the beginning of the first fiscal period in an appropriate, broad-based securities market index and other indexes, if applicable, for the same period.
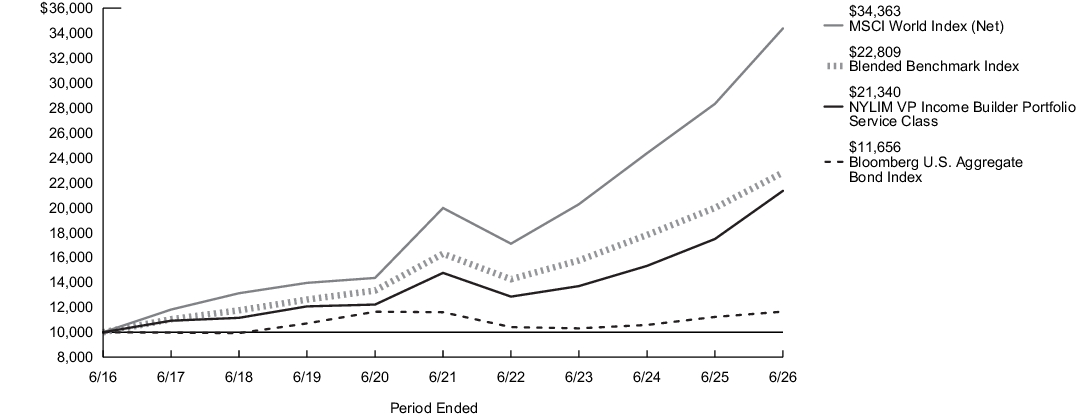
| Average Annual Total Returns for the Period Ended June 30, 2026 | Inception Date |
Six Months1 |
One Year |
Five Years |
Ten Years |
| Service Class Shares | 6/4/2003 | 14.06% | 22.07% | 7.65% | 7.87% |
| MSCI World Index (Net)2 | 9.69% | 21.34% | 11.47% | 13.14% | |
| Bloomberg U.S. Aggregate Bond Index3 | 0.62% | 3.79% | 0.08% | 1.54% | |
| Blended Benchmark Index4 | 6.13% | 14.18% | 6.96% | 8.60% | |
| Morningstar Global Moderate Allocation Category Average5 | (1.07)% | 16.58% | 6.47% | 7.55% |
| 1. |
Not annualized. |
| 2. |
The Portfolio has selected the MSCI World Index (Net) to represent a broad measure of market performance. The MSCI World Index (Net) is a free float-adjusted market capitalization weighted index that is designed to measure the equity market performance of developed markets. |
| 3. |
The Bloomberg U.S. Aggregate Bond Index is a broad-based benchmark that measures the performance of the investment-grade, U.S. dollar-denominated, fixed-rate taxable bond market, including Treasuries, government-related and corporate securities, mortgage-backed securities (agency fixed-rate and hybrid adjustable-rate mortgage pass-throughs), asset-backed securities and commercial mortgage-backed securities. |
| 4. |
The Blended Benchmark Index is comprised of the MSCI World Index (Net) and the Bloomberg U.S. Aggregate Bond Index weighted 60%/40%, respectively. |
| 5. |
Morningstar Global Moderate Allocation Category Average funds seek to provide both income and capital appreciation by primarily investing in multiple asset classes, including stocks, bonds, and cash. These moderate strategies seek to balance preservation of capital with appreciation. They typically expect volatility similar to a strategic equity exposure between 50% and 70%. Results are based on average total returns of similar funds with all dividends and capital gain distributions reinvested. |
Key Portfolio Statistics
| Portfolio's net assets | $617,116,537 |
| Total number of portfolio holdings | 639 |
| Portfolio turnover rate | 41% |
Graphical Representation of Holdings
The tables below show the investment makeup of the Portfolio; percentages indicated are based on the Portfolio's net assets.
Top Ten Holdings and/or Issuers*
| U.S. Treasury Bonds, 5.00%, due 5/15/46-5/15/56 | 3.1% |
| U.S. Treasury Notes, 3.875%-4.375%, due 4/30/31-5/15/36 | 2.9% |
| UMBS, 30 Year, 2.00%-6.00%, due 8/1/48-3/1/56 | 2.6% |
| GNMA, (zero coupon)-7.833%, due 7/20/44-3/16/66 | 1.8% |
| Taiwan Semiconductor Manufacturing Co. Ltd. | 1.5% |
| Dell Technologies, Inc., Class C | 1.4% |
| Cisco Systems, Inc. | 1.4% |
| CVS Health Corp. | 1.3% |
| Texas Instruments, Inc. | 1.2% |
| Broadcom, Inc. | 1.2% |
| * Excluding short-term investments |
Portfolio Composition
| Common Stocks | 59.0% |
| Corporate Bonds | 11.4% |
| U.S. Government & Federal Agencies | 10.3% |
| Mortgage-Backed Securities | 9.7% |
| Asset-Backed Securities | 3.8% |
| Short-Term Investments | 2.9% |
| Loan Assignments | 1.1% |
| Foreign Government Bonds | 0.8% |
| Other Assets, Less Liabilities | 1.0% |
Top Ten Holdings and/or Issuers*
| U.S. Treasury Bonds, 5.00%, due 5/15/46-5/15/56 | 3.1% |
| U.S. Treasury Notes, 3.875%-4.375%, due 4/30/31-5/15/36 | 2.9% |
| UMBS, 30 Year, 2.00%-6.00%, due 8/1/48-3/1/56 | 2.6% |
| GNMA, (zero coupon)-7.833%, due 7/20/44-3/16/66 | 1.8% |
| Taiwan Semiconductor Manufacturing Co. Ltd. | 1.5% |
| Dell Technologies, Inc., Class C | 1.4% |
| Cisco Systems, Inc. | 1.4% |
| CVS Health Corp. | 1.3% |
| Texas Instruments, Inc. | 1.2% |
| Broadcom, Inc. | 1.2% |
| * Excluding short-term investments |
What were the Portfolio costs for the last six months?1
(Based on a hypothetical $10,000 investment)
| Share Class Name | Costs of a $10,000 investment | Costs paid as a percentage of a $10,000 investment2 |
| Service Class | $40 | 0.80% |
| 1. | Does not include any separate account or policy fees or charges imposed under the variable annuity policies and variable universal life insurance policies for which the Portfolio is an investment option. If they were included, your costs would be higher. |
| 2. | Annualized. |
Portfolio Performance
The following graph compares the initial and subsequent account values at the end of each of the most recently completed 10 semiannual reporting periods of the Portfolio (or for the life of the Portfolio, if shorter). It assumes a $10,000 initial investment at the beginning of the first fiscal period in an appropriate, broad-based securities market index and other indexes, if applicable, for the same period.
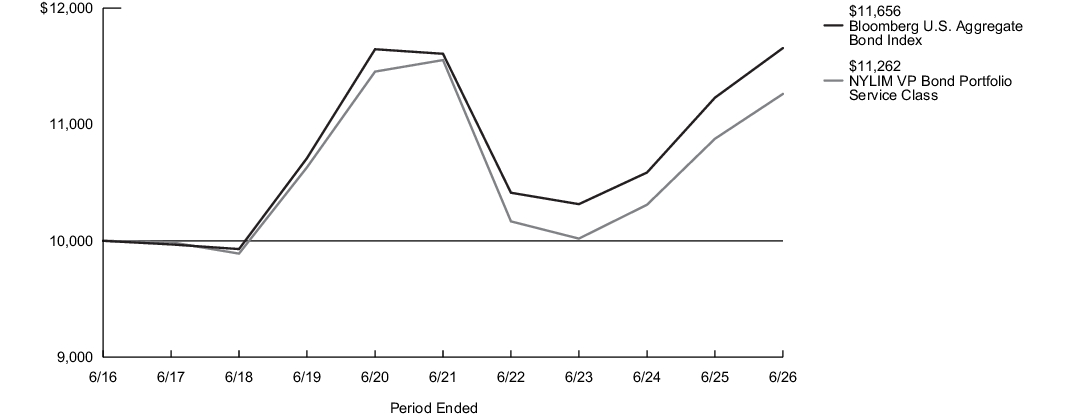
| Average Annual Total Returns for the Period Ended June 30, 2026 | Inception Date |
Six Months1 |
One Year |
Five Years |
Ten Years |
| Service Class Shares | 6/4/2003 | 0.55% | 3.54% | (0.51)% | 1.20% |
| Bloomberg U.S. Aggregate Bond Index2 | 0.62% | 3.79% | 0.08% | 1.54% | |
| Morningstar Intermediate Core Bond Category Average3 | 0.69% | 3.77% | 0.08% | 1.57% |
| 1. |
Not annualized. |
| 2. |
The Portfolio has selected the Bloomberg U.S. Aggregate Bond Index to represent a broad measure of market performance. The Bloomberg U.S. Aggregate Bond Index, which is generally representative of the market sectors or types of investments in which the Portfolio invests, is a broad-based benchmark that measures the performance of the investment grade, U.S. dollar-denominated, fixed-rate taxable bond market, including Treasuries, government-related and corporate securities, mortgage-backed securities (agency fixed-rate and hybrid adjustable rate mortgage pass-throughs), asset-backed securities and commercial mortgage-backed securities. |
| 3. |
The Morningstar Intermediate Core Bond Category Average is representative of funds that invest primarily in investment-grade U.S. fixed-income issues including government, corporate, and securitized debt, and hold less than 5% in below-investment-grade exposures. Their durations (a measure of interest-rate sensitivity) typically range between 75% and 125% of the three-year average of the effective duration of the Morningstar Core Bond Index. Results are based on average total returns of similar funds with all dividends and capital gain distributions reinvested. |
Key Portfolio Statistics
| Portfolio's net assets | $536,895,098 |
| Total number of portfolio holdings | 293 |
| Portfolio turnover rate | 139% |
Graphical Representation of Holdings
The tables below show the investment makeup of the Portfolio; percentages indicated are based on the Portfolio's net assets.
Top Ten Holdings and/or Issuers*
| U.S. Treasury Bonds, 5.00%, due 5/15/46-5/15/56 | 11.8% |
| UMBS, 30 Year, 1.50%-7.50%, due 7/1/28-5/1/54 | 10.0% |
| U.S. Treasury Notes, 3.75%-4.125%, due 4/30/28-4/30/33 | 7.0% |
| UMBS Pool, 30 Year, 2.00%-5.50%, due 11/1/50-2/1/55 | 4.1% |
| GNMA, 0.689%-6.00%, due 6/20/51-4/16/65 | 3.2% |
| FNMA, Other, 2.50%-4.50%, due 6/1/62-6/1/64 | 2.2% |
| GNMA II, Single Family, 30 Year, 2.50%-5.50%, due 10/20/51-7/15/56 | 2.2% |
| GNMA II, 30 Year, 2.00%-4.50%, due 3/20/51-9/20/52 | 1.3% |
| BX Trust, 3.856%-5.325%, due 12/9/41-7/15/44 | 1.3% |
| Pacific Gas and Electric Co., 5.45%-6.95%, due 6/15/27-3/1/55 | 1.1% |
| * Excluding short-term investments |
Portfolio Composition
| U.S. Government & Federal Agencies | 39.7% |
| Corporate Bonds | 32.8% |
| Mortgage-Backed Securities | 16.2% |
| Asset-Backed Securities | 10.2% |
| Short-Term Investment | 0.3% |
| Other Assets, Less Liabilities | 0.8% |
Top Ten Holdings and/or Issuers*
| U.S. Treasury Bonds, 5.00%, due 5/15/46-5/15/56 | 11.8% |
| UMBS, 30 Year, 1.50%-7.50%, due 7/1/28-5/1/54 | 10.0% |
| U.S. Treasury Notes, 3.75%-4.125%, due 4/30/28-4/30/33 | 7.0% |
| UMBS Pool, 30 Year, 2.00%-5.50%, due 11/1/50-2/1/55 | 4.1% |
| GNMA, 0.689%-6.00%, due 6/20/51-4/16/65 | 3.2% |
| FNMA, Other, 2.50%-4.50%, due 6/1/62-6/1/64 | 2.2% |
| GNMA II, Single Family, 30 Year, 2.50%-5.50%, due 10/20/51-7/15/56 | 2.2% |
| GNMA II, 30 Year, 2.00%-4.50%, due 3/20/51-9/20/52 | 1.3% |
| BX Trust, 3.856%-5.325%, due 12/9/41-7/15/44 | 1.3% |
| Pacific Gas and Electric Co., 5.45%-6.95%, due 6/15/27-3/1/55 | 1.1% |
| * Excluding short-term investments |
What were the Portfolio costs for the last six months?1
(Based on a hypothetical $10,000 investment)
| Share Class Name | Costs of a $10,000 investment | Costs paid as a percentage of a $10,000 investment2 |
| Initial Class | $27 | 0.55% |
| 1. | Does not include any separate account or policy fees or charges imposed under the variable annuity policies and variable universal life insurance policies for which the Portfolio is an investment option. If they were included, your costs would be higher. |
| 2. | Annualized. |
Portfolio Performance
The following graph compares the initial and subsequent account values at the end of each of the most recently completed 10 semiannual reporting periods of the Portfolio (or for the life of the Portfolio, if shorter). It assumes a $10,000 initial investment at the beginning of the first fiscal period in an appropriate, broad-based securities market index and other indexes, if applicable, for the same period.
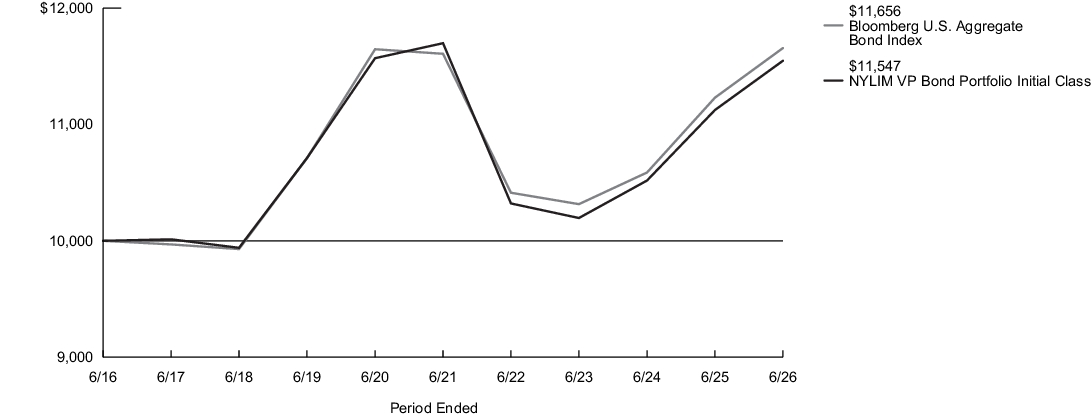
| Average Annual Total Returns for the Period Ended June 30, 2026 | Inception Date |
Six Months1 |
One Year |
Five Years |
Ten Years |
| Initial Class Shares | 1/23/1984 | 0.67% | 3.80% | (0.26)% | 1.45% |
| Bloomberg U.S. Aggregate Bond Index2 | 0.62% | 3.79% | 0.08% | 1.54% | |
| Morningstar Intermediate Core Bond Category Average3 | 0.69% | 3.77% | 0.08% | 1.57% |
| 1. |
Not annualized. |
| 2. |
The Portfolio has selected the Bloomberg U.S. Aggregate Bond Index to represent a broad measure of market performance. The Bloomberg U.S. Aggregate Bond Index, which is generally representative of the market sectors or types of investments in which the Portfolio invests, is a broad-based benchmark that measures the performance of the investment grade, U.S. dollar-denominated, fixed-rate taxable bond market, including Treasuries, government-related and corporate securities, mortgage-backed securities (agency fixed-rate and hybrid adjustable rate mortgage pass-throughs), asset-backed securities and commercial mortgage-backed securities. |
| 3. |
The Morningstar Intermediate Core Bond Category Average is representative of funds that invest primarily in investment-grade U.S. fixed-income issues including government, corporate, and securitized debt, and hold less than 5% in below-investment-grade exposures. Their durations (a measure of interest-rate sensitivity) typically range between 75% and 125% of the three-year average of the effective duration of the Morningstar Core Bond Index. Results are based on average total returns of similar funds with all dividends and capital gain distributions reinvested. |
Key Portfolio Statistics
| Portfolio's net assets | $536,895,098 |
| Total number of portfolio holdings | 293 |
| Portfolio turnover rate | 139% |
Graphical Representation of Holdings
The tables below show the investment makeup of the Portfolio; percentages indicated are based on the Portfolio's net assets.
Top Ten Holdings and/or Issuers*
| U.S. Treasury Bonds, 5.00%, due 5/15/46-5/15/56 | 11.8% |
| UMBS, 30 Year, 1.50%-7.50%, due 7/1/28-5/1/54 | 10.0% |
| U.S. Treasury Notes, 3.75%-4.125%, due 4/30/28-4/30/33 | 7.0% |
| UMBS Pool, 30 Year, 2.00%-5.50%, due 11/1/50-2/1/55 | 4.1% |
| GNMA, 0.689%-6.00%, due 6/20/51-4/16/65 | 3.2% |
| FNMA, Other, 2.50%-4.50%, due 6/1/62-6/1/64 | 2.2% |
| GNMA II, Single Family, 30 Year, 2.50%-5.50%, due 10/20/51-7/15/56 | 2.2% |
| GNMA II, 30 Year, 2.00%-4.50%, due 3/20/51-9/20/52 | 1.3% |
| BX Trust, 3.856%-5.325%, due 12/9/41-7/15/44 | 1.3% |
| Pacific Gas and Electric Co., 5.45%-6.95%, due 6/15/27-3/1/55 | 1.1% |
| * Excluding short-term investments |
Portfolio Composition
| U.S. Government & Federal Agencies | 39.7% |
| Corporate Bonds | 32.8% |
| Mortgage-Backed Securities | 16.2% |
| Asset-Backed Securities | 10.2% |
| Short-Term Investment | 0.3% |
| Other Assets, Less Liabilities | 0.8% |
Top Ten Holdings and/or Issuers*
| U.S. Treasury Bonds, 5.00%, due 5/15/46-5/15/56 | 11.8% |
| UMBS, 30 Year, 1.50%-7.50%, due 7/1/28-5/1/54 | 10.0% |
| U.S. Treasury Notes, 3.75%-4.125%, due 4/30/28-4/30/33 | 7.0% |
| UMBS Pool, 30 Year, 2.00%-5.50%, due 11/1/50-2/1/55 | 4.1% |
| GNMA, 0.689%-6.00%, due 6/20/51-4/16/65 | 3.2% |
| FNMA, Other, 2.50%-4.50%, due 6/1/62-6/1/64 | 2.2% |
| GNMA II, Single Family, 30 Year, 2.50%-5.50%, due 10/20/51-7/15/56 | 2.2% |
| GNMA II, 30 Year, 2.00%-4.50%, due 3/20/51-9/20/52 | 1.3% |
| BX Trust, 3.856%-5.325%, due 12/9/41-7/15/44 | 1.3% |
| Pacific Gas and Electric Co., 5.45%-6.95%, due 6/15/27-3/1/55 | 1.1% |
| * Excluding short-term investments |
What were the Portfolio costs for the last six months?1
(Based on a hypothetical $10,000 investment)
| Share Class Name | Costs of a $10,000 investment | Costs paid as a percentage of a $10,000 investment2 |
| Initial Class | $28 | 0.57% |
| 1. | Does not include any separate account or policy fees or charges imposed under the variable annuity policies and variable universal life insurance policies for which the Portfolio is an investment option. If they were included, your costs would be higher. |
| 2. | Annualized. |
Portfolio Performance
The following graph compares the initial and subsequent account values at the end of each of the most recently completed 10 semiannual reporting periods of the Portfolio (or for the life of the Portfolio, if shorter). It assumes a $10,000 initial investment at the beginning of the first fiscal period in an appropriate, broad-based securities market index and other indexes, if applicable, for the same period. Effective May 1, 2024, the Portfolio modified its principal investment strategies. The past performance in the graph and table prior to that date reflects the Portfolio's prior principal investment strategies.
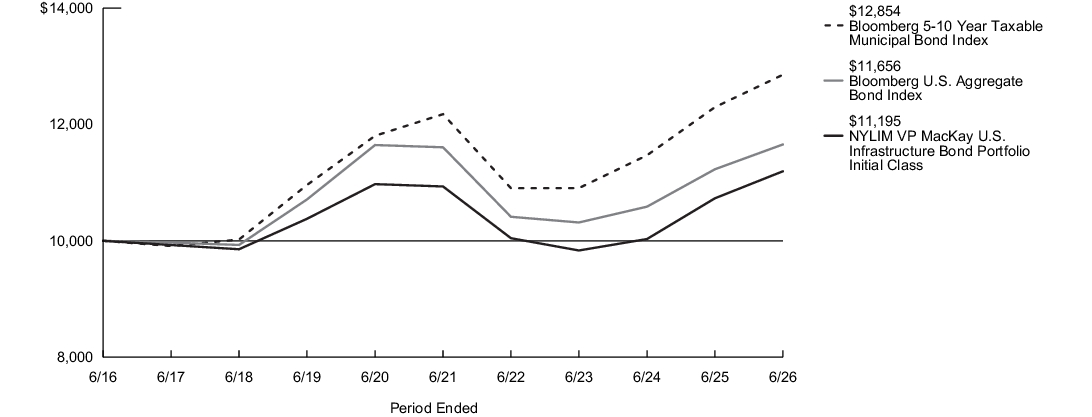
| Average Annual Total Returns for the Period Ended June 30, 2026 | Inception Date |
Six Months1 |
One Year |
Five Years |
Ten Years |
| Initial Class Shares | 1/29/1993 | 0.81% | 4.32% | 0.47% | 1.13% |
| Bloomberg U.S. Aggregate Bond Index2 | 0.62% | 3.79% | 0.08% | 1.54% | |
| Bloomberg 5-10 Year Taxable Municipal Bond Index3 | 0.60% | 4.53% | 1.09% | 2.54% | |
| Morningstar Intermediate Core Bond Category Average4 | 0.69% | 3.77% | 0.08% | 1.57% |
| 1. |
Not annualized. |
| 2. |
The Portfolio has selected the Bloomberg U.S. Aggregate Bond Index to represent a broad measure of market performance. The Bloomberg U.S. Aggregate Bond Index is a broad-based benchmark that measures the performance of the investment grade, U.S. dollar-denominated, fixed-rate taxable bond market, including Treasuries, government-related and corporate securities, mortgage-backed securities (agency fixed-rate and hybrid adjustable rate mortgage pass-throughs), asset-backed securities and commercial mortgage-backed securities. |
| 3. |
The Bloomberg 5-10 Year Taxable Municipal Bond Index, which is generally representative of the market sectors or types of investments in which the Portfolio invests, is the 5-10 year component of the Bloomberg Taxable Municipal Bond Index. |
| 4. |
The Morningstar Intermediate Core Bond Category Average is representative of funds that invest primarily in investment-grade U.S. fixed-income issues including government, corporate, and securitized debt, and hold less than 5% in below-investment-grade exposures. Their durations (a measure of interest-rate sensitivity) typically range between 75% and 125% of the three-year average of the effective duration of the Morningstar Core Bond Index. Results are based on average total returns of similar funds with all dividends and capital gain distributions reinvested. |
Key Portfolio Statistics
| Portfolio's net assets | $225,805,966 |
| Total number of portfolio holdings | 151 |
| Portfolio turnover rate | 18% |
Graphical Representation of Holdings
The tables below show the investment makeup of the Portfolio; percentages indicated are based on the Portfolio's net assets.
Top Ten Holdings and/or Issuers*
| State of Hawaii, 1.695%-5.159%, due 8/1/32-10/1/41 | 3.7% |
| State of Illinois, 4.62%-6.725%, due 5/1/31-6/15/38 | 3.5% |
| City of New York, 1.923%-5.75%, due 8/1/31-2/1/40 | 3.3% |
| State of California, 7.55%-7.60%, due 4/1/39-11/1/40 | 3.2% |
| New York City Transitional Finance Authority, 1.97%-5.01%, due 5/1/32-5/1/34 | 3.1% |
| New York State Dormitory Authority, 2.202%-5.228%, due 7/1/32-7/1/35 | 3.0% |
| Commonwealth of Massachusetts, 1.67%-3.769%, due 7/15/29-9/1/43 | 2.8% |
| Massachusetts Educational Financing Authority, 5.95%-6.166%, due 7/1/44-7/1/50 | 2.5% |
| Oregon State Lottery, 5.031%-5.093%, due 4/1/34-4/1/35 | 2.3% |
| New York City Housing Development Corp., 5.458%-6.033%, due 12/15/31 | 2.2% |
| * Excluding short-term investments |
Portfolio Composition
| Municipal Bonds | 93.9% |
| Corporate Bonds | 4.6% |
| Short-Term Investment | 1.4% |
| Other Assets, Less Liabilities | 0.1% |
Top Ten Holdings and/or Issuers*
| State of Hawaii, 1.695%-5.159%, due 8/1/32-10/1/41 | 3.7% |
| State of Illinois, 4.62%-6.725%, due 5/1/31-6/15/38 | 3.5% |
| City of New York, 1.923%-5.75%, due 8/1/31-2/1/40 | 3.3% |
| State of California, 7.55%-7.60%, due 4/1/39-11/1/40 | 3.2% |
| New York City Transitional Finance Authority, 1.97%-5.01%, due 5/1/32-5/1/34 | 3.1% |
| New York State Dormitory Authority, 2.202%-5.228%, due 7/1/32-7/1/35 | 3.0% |
| Commonwealth of Massachusetts, 1.67%-3.769%, due 7/15/29-9/1/43 | 2.8% |
| Massachusetts Educational Financing Authority, 5.95%-6.166%, due 7/1/44-7/1/50 | 2.5% |
| Oregon State Lottery, 5.031%-5.093%, due 4/1/34-4/1/35 | 2.3% |
| New York City Housing Development Corp., 5.458%-6.033%, due 12/15/31 | 2.2% |
| * Excluding short-term investments |
What were the Portfolio costs for the last six months?1
(Based on a hypothetical $10,000 investment)
| Share Class Name | Costs of a $10,000 investment | Costs paid as a percentage of a $10,000 investment2 |
| Service Class | $41 | 0.82% |
| 1. | Does not include any separate account or policy fees or charges imposed under the variable annuity policies and variable universal life insurance policies for which the Portfolio is an investment option. If they were included, your costs would be higher. |
| 2. | Annualized. |
Portfolio Performance
The following graph compares the initial and subsequent account values at the end of each of the most recently completed 10 semiannual reporting periods of the Portfolio (or for the life of the Portfolio, if shorter). It assumes a $10,000 initial investment at the beginning of the first fiscal period in an appropriate, broad-based securities market index and other indexes, if applicable, for the same period. Effective May 1, 2024, the Portfolio modified its principal investment strategies. The past performance in the graph and table prior to that date reflects the Portfolio's prior principal investment strategies.
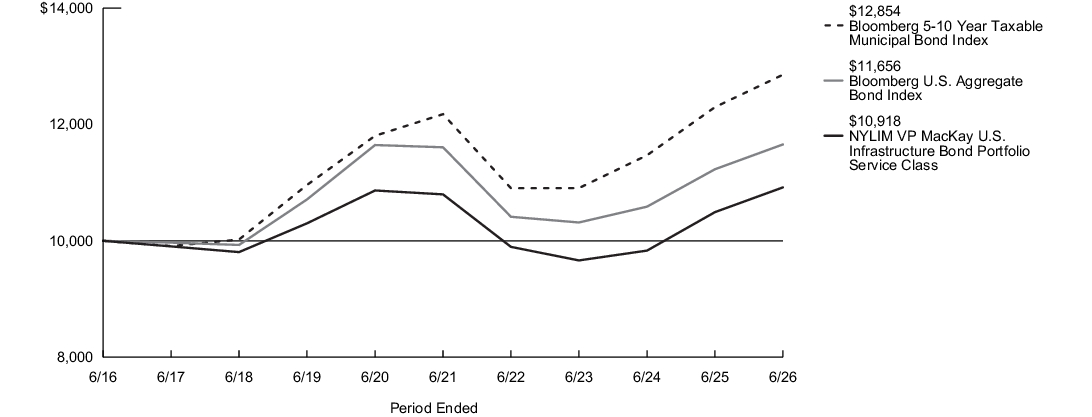
| Average Annual Total Returns for the Period Ended June 30, 2026 | Inception Date |
Six Months1 |
One Year |
Five Years |
Ten Years |
| Service Class Shares | 6/4/2003 | 0.68% | 4.05% | 0.22% | 0.88% |
| Bloomberg U.S. Aggregate Bond Index2 | 0.62% | 3.79% | 0.08% | 1.54% | |
| Bloomberg 5-10 Year Taxable Municipal Bond Index3 | 0.60% | 4.53% | 1.09% | 2.54% | |
| Morningstar Intermediate Core Bond Category Average4 | 0.69% | 3.77% | 0.08% | 1.57% |
| 1. |
Not annualized. |
| 2. |
The Portfolio has selected the Bloomberg U.S. Aggregate Bond Index to represent a broad measure of market performance. The Bloomberg U.S. Aggregate Bond Index is a broad-based benchmark that measures the performance of the investment grade, U.S. dollar-denominated, fixed-rate taxable bond market, including Treasuries, government-related and corporate securities, mortgage-backed securities (agency fixed-rate and hybrid adjustable rate mortgage pass-throughs), asset-backed securities and commercial mortgage-backed securities. |
| 3. |
The Bloomberg 5-10 Year Taxable Municipal Bond Index, which is generally representative of the market sectors or types of investments in which the Portfolio invests, is the 5-10 year component of the Bloomberg Taxable Municipal Bond Index. |
| 4. |
The Morningstar Intermediate Core Bond Category Average is representative of funds that invest primarily in investment-grade U.S. fixed-income issues including government, corporate, and securitized debt, and hold less than 5% in below-investment-grade exposures. Their durations (a measure of interest-rate sensitivity) typically range between 75% and 125% of the three-year average of the effective duration of the Morningstar Core Bond Index. Results are based on average total returns of similar funds with all dividends and capital gain distributions reinvested. |
Key Portfolio Statistics
| Portfolio's net assets | $225,805,966 |
| Total number of portfolio holdings | 151 |
| Portfolio turnover rate | 18% |
Graphical Representation of Holdings
The tables below show the investment makeup of the Portfolio; percentages indicated are based on the Portfolio's net assets.
Top Ten Holdings and/or Issuers*
| State of Hawaii, 1.695%-5.159%, due 8/1/32-10/1/41 | 3.7% |
| State of Illinois, 4.62%-6.725%, due 5/1/31-6/15/38 | 3.5% |
| City of New York, 1.923%-5.75%, due 8/1/31-2/1/40 | 3.3% |
| State of California, 7.55%-7.60%, due 4/1/39-11/1/40 | 3.2% |
| New York City Transitional Finance Authority, 1.97%-5.01%, due 5/1/32-5/1/34 | 3.1% |
| New York State Dormitory Authority, 2.202%-5.228%, due 7/1/32-7/1/35 | 3.0% |
| Commonwealth of Massachusetts, 1.67%-3.769%, due 7/15/29-9/1/43 | 2.8% |
| Massachusetts Educational Financing Authority, 5.95%-6.166%, due 7/1/44-7/1/50 | 2.5% |
| Oregon State Lottery, 5.031%-5.093%, due 4/1/34-4/1/35 | 2.3% |
| New York City Housing Development Corp., 5.458%-6.033%, due 12/15/31 | 2.2% |
| * Excluding short-term investments |
Portfolio Composition
| Municipal Bonds | 93.9% |
| Corporate Bonds | 4.6% |
| Short-Term Investment | 1.4% |
| Other Assets, Less Liabilities | 0.1% |
Top Ten Holdings and/or Issuers*
| State of Hawaii, 1.695%-5.159%, due 8/1/32-10/1/41 | 3.7% |
| State of Illinois, 4.62%-6.725%, due 5/1/31-6/15/38 | 3.5% |
| City of New York, 1.923%-5.75%, due 8/1/31-2/1/40 | 3.3% |
| State of California, 7.55%-7.60%, due 4/1/39-11/1/40 | 3.2% |
| New York City Transitional Finance Authority, 1.97%-5.01%, due 5/1/32-5/1/34 | 3.1% |
| New York State Dormitory Authority, 2.202%-5.228%, due 7/1/32-7/1/35 | 3.0% |
| Commonwealth of Massachusetts, 1.67%-3.769%, due 7/15/29-9/1/43 | 2.8% |
| Massachusetts Educational Financing Authority, 5.95%-6.166%, due 7/1/44-7/1/50 | 2.5% |
| Oregon State Lottery, 5.031%-5.093%, due 4/1/34-4/1/35 | 2.3% |
| New York City Housing Development Corp., 5.458%-6.033%, due 12/15/31 | 2.2% |
| * Excluding short-term investments |
What were the Portfolio costs for the last six months?1
(Based on a hypothetical $10,000 investment)
| Share Class Name | Costs of a $10,000 investment | Costs paid as a percentage of a $10,000 investment2,3 |
| Initial Class | $14 | 0.28% |
| 1. | Does not include any separate account or policy fees or charges imposed under the variable annuity policies and variable universal life insurance policies for which the Portfolio is an investment option. If they were included, your costs would be higher. |
| 2. | Reflects fee waivers and/or expense reimbursements, without which expenses would have been higher. |
| 3. | Annualized. |
Portfolio Performance
The following graph compares the initial and subsequent account values at the end of each of the most recently completed 10 semiannual reporting periods of the Portfolio (or for the life of the Portfolio, if shorter). It assumes a $10,000 initial investment at the beginning of the first fiscal period in an appropriate, broad-based securities market index and other indexes, if applicable, for the same period. Effective August 26, 2016 and October 14, 2016, the Portfolio modified its principal investment strategies in connection with commencing operations as a “government money market fund.” Consequently the performance information below may have been different if the current investment strategies had been in effect during the period prior to the Portfolio commencing operations as a “government money market fund.” For certain periods, the Manager voluntarily has waived or reimbursed the Portfolio’s expenses to the extent it deemed appropriate to enhance the Portfolio's yield during periods when expenses had a significant impact on yield because of low interest rates. Without these waivers or reimbursements, the Portfolio’s returns would have been lower.
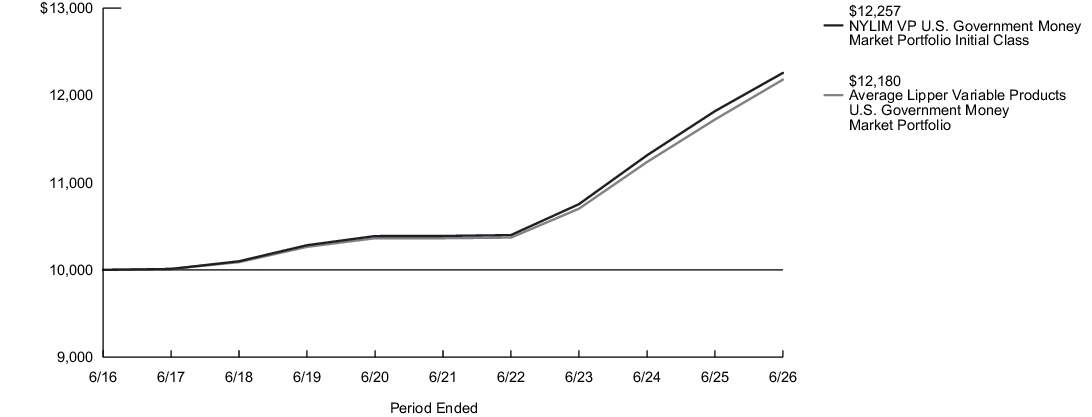
| Average Annual Total Returns for the Period Ended June 30, 2026 | Inception Date |
Six Months1 |
One Year |
Five Years |
Ten Years |
| Initial Class Shares | 1/29/1993 | 1.70% | 3.70% | 3.36% | 2.06% |
| Average Lipper Variable Products U.S. Government Money Market Portfolio2 | 1.62% | 3.55% | 3.24% | 1.99% | |
| Morningstar Prime Money Market Category Average3 | 1.65% | 3.64% | 3.34% | 2.16% |
| 1. |
Not annualized. |
| 2. |
The Average Lipper Variable Products U.S. Government Money Market Portfolio is an equally weighted performance average consisting of funds that invest 99.5% of their assets in cash, government securities and/or repurchase agreements that are collateralized solely by government securities or cash, and have a weighted average maturity of 60 days or less. These funds intend to keep a constant net asset value. |
| 3. |
The Morningstar Prime Money Market Category Average is representative of funds that invest in short-term money market securities in order to provide a level of current income that is consistent with the preservation of capital. Results are based on average total returns of similar funds with all dividends and capital gain distributions reinvested. |
Key Portfolio Statistics
| Portfolio's net assets | $814,089,896 |
| Total number of portfolio holdings | 31 |
Graphical Representation of Holdings
The table below shows the investment makeup of the Portfolio; percentages indicated are based on the Portfolio's net assets.
Portfolio Composition
| Government Agency Debt | 37.9% |
| Treasury Debt | 31.1% |
| Treasury Repurchase Agreements | 31.0% |
| Other Assets, Less Liabilities | (0.0)%‡ |
| ‡ Less than one-tenth of a percent. |
What were the Portfolio costs for the last six months?1
(Based on a hypothetical $10,000 investment)
| Share Class Name | Costs of a $10,000 investment | Costs paid as a percentage of a $10,000 investment2,3 |
| Initial Class | $29 | 0.59% |
| 1. | Does not include any separate account or policy fees or charges imposed under the variable annuity policies and variable universal life insurance policies for which the Portfolio is an investment option. If they were included, your costs would be higher. |
| 2. | Reflects fee waivers and/or expense reimbursements, without which expenses would have been higher. |
| 3. | Annualized. |
Portfolio Performance
The following graph compares the initial and subsequent account values at the end of each of the most recently completed 10 semiannual reporting periods of the Portfolio (or for the life of the Portfolio, if shorter). It assumes a $10,000 initial investment at the beginning of the first fiscal period in an appropriate, broad-based securities market index and other indexes, if applicable, for the same period.
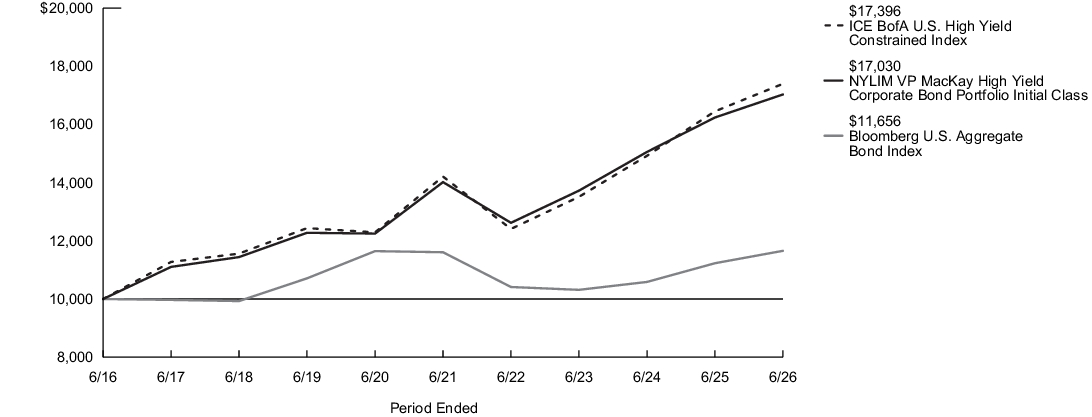
| Average Annual Total Returns for the Period Ended June 30, 2026 | Inception Date |
Six Months1 |
One Year |
Five Years |
Ten Years |
| Initial Class Shares | 5/1/1995 | 1.83% | 4.88% | 3.97% | 5.47% |
| Bloomberg U.S. Aggregate Bond Index2 | 0.62% | 3.79% | 0.08% | 1.54% | |
| ICE BofA U.S. High Yield Constrained Index3 | 1.89% | 5.74% | 4.13% | 5.69% | |
| Morningstar High Yield Bond Category Average4 | 1.96% | 5.70% | 3.89% | 5.12% |
| 1. |
Not annualized. |
| 2. |
The Portfolio has selected the Bloomberg U.S. Aggregate Bond Index to represent a broad measure of market performance. The Bloomberg U.S. Aggregate Bond Index is a broad-based benchmark that measures the performance of the investment grade, U.S. dollar-denominated, fixed-rate taxable bond market, including Treasuries, government-related and corporate securities, mortgage-backed securities (agency fixed-rate and hybrid adjustable rate mortgage pass-throughs), asset-backed securities and commercial mortgage-backed securities. |
| 3. |
The ICE BofA U.S. High Yield Constrained Index, which is generally representative of the market sectors or types of investments in which the Portfolio invests, is a market value-weighted index of all domestic and Yankee high-yield bonds, including deferred interest bonds and payment-in-kind securities. Issuers included in the ICE BofA U.S. High Yield Constrained Index have maturities of one year or more and have a credit rating lower than BBB-/Baa3, but are not in default. No single issuer may constitute greater than 2% of the ICE BofA U.S. High Yield Constrained Index. |
| 4. |
The Morningstar High Yield Bond Category Average is representative of funds that concentrate on lower-quality bonds, which are riskier than those of higher-quality companies. These funds primarily invest in U.S. high-income debt securities where at least 65% or more of bond assets are not rated or are rated by a major agency such as Standard & Poor’s or Moody’s at the level of BB and below. Results are based on average total returns of similar funds with all dividends and capital gain distributions reinvested. |
Key Portfolio Statistics
| Portfolio's net assets | $3,114,444,584 |
| Total number of portfolio holdings | 666 |
| Portfolio turnover rate | 16% |
Graphical Representation of Holdings
The tables below show the investment makeup of the Portfolio; percentages indicated are based on the Portfolio's net assets.
Top Ten Holdings and/or Issuers*
| TransDigm, Inc., 4.625%-7.125%, due 8/15/28-7/31/34 | 2.5% |
| CCO Holdings LLC, 4.25%-5.375%, due 5/1/27-1/15/34 | 1.7% |
| Hilton Domestic Operating Co., Inc., 4.00%-6.125%, due 1/15/30-3/31/34 | 1.4% |
| Yum! Brands, Inc., 3.625%-6.875%, due 1/15/30-11/15/37 | 1.3% |
| Talen Energy Supply LLC, 5.644%-6.50%, due 5/1/31-2/1/36 | 1.2% |
| Churchill Downs, Inc., 4.75%-6.75%, due 4/1/27-5/1/31 | 1.1% |
| NRG Energy, Inc., 5.75%-6.25%, due 2/1/33-5/15/36 | 1.0% |
| IHO Verwaltungs GmbH, 6.375%-8.00%, due 5/15/29-5/15/33 | 1.0% |
| LifePoint Health, Inc., 5.375%-10.00%, due 1/15/29-5/1/34 | 1.0% |
| Mineral Resources Ltd., 6.00%-9.25%, due 10/1/28-5/1/34 | 0.9% |
| * Excluding short-term investments |
Portfolio Composition
| Corporate Bonds | 88.4% |
| Loan Assignments | 5.4% |
| Common Stocks | 0.9% |
| Preferred Stock | 0.5% |
| Convertible Bond | 0.2% |
| Other Assets, Less Liabilities | 4.6% |
Top Ten Holdings and/or Issuers*
| TransDigm, Inc., 4.625%-7.125%, due 8/15/28-7/31/34 | 2.5% |
| CCO Holdings LLC, 4.25%-5.375%, due 5/1/27-1/15/34 | 1.7% |
| Hilton Domestic Operating Co., Inc., 4.00%-6.125%, due 1/15/30-3/31/34 | 1.4% |
| Yum! Brands, Inc., 3.625%-6.875%, due 1/15/30-11/15/37 | 1.3% |
| Talen Energy Supply LLC, 5.644%-6.50%, due 5/1/31-2/1/36 | 1.2% |
| Churchill Downs, Inc., 4.75%-6.75%, due 4/1/27-5/1/31 | 1.1% |
| NRG Energy, Inc., 5.75%-6.25%, due 2/1/33-5/15/36 | 1.0% |
| IHO Verwaltungs GmbH, 6.375%-8.00%, due 5/15/29-5/15/33 | 1.0% |
| LifePoint Health, Inc., 5.375%-10.00%, due 1/15/29-5/1/34 | 1.0% |
| Mineral Resources Ltd., 6.00%-9.25%, due 10/1/28-5/1/34 | 0.9% |
| * Excluding short-term investments |
What were the Portfolio costs for the last six months?1
(Based on a hypothetical $10,000 investment)
| Share Class Name | Costs of a $10,000 investment | Costs paid as a percentage of a $10,000 investment2,3 |
| Service Class | $42 | 0.84% |
| 1. | Does not include any separate account or policy fees or charges imposed under the variable annuity policies and variable universal life insurance policies for which the Portfolio is an investment option. If they were included, your costs would be higher. |
| 2. | Reflects fee waivers and/or expense reimbursements, without which expenses would have been higher. |
| 3. | Annualized. |
Portfolio Performance
The following graph compares the initial and subsequent account values at the end of each of the most recently completed 10 semiannual reporting periods of the Portfolio (or for the life of the Portfolio, if shorter). It assumes a $10,000 initial investment at the beginning of the first fiscal period in an appropriate, broad-based securities market index and other indexes, if applicable, for the same period.
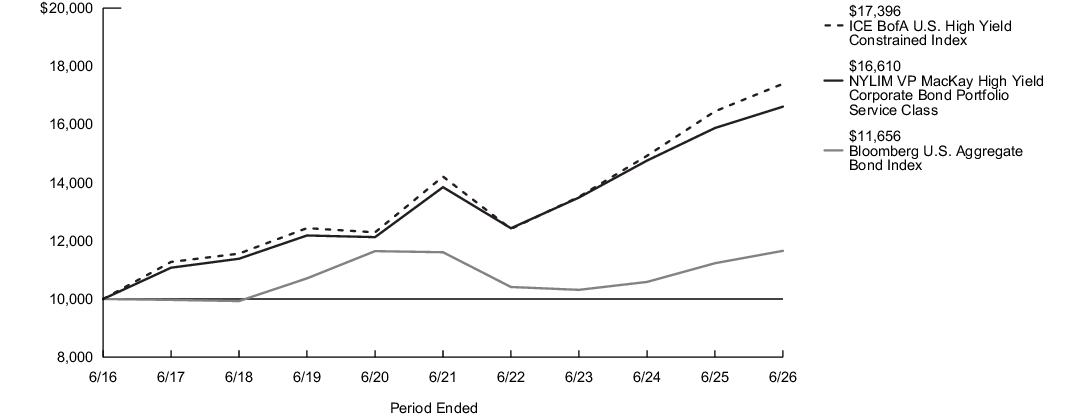
| Average Annual Total Returns for the Period Ended June 30, 2026 | Inception Date |
Six Months1 |
One Year |
Five Years |
Ten Years |
| Service Class Shares | 6/4/2003 | 1.70% | 4.61% | 3.71% | 5.20% |
| Bloomberg U.S. Aggregate Bond Index2 | 0.62% | 3.79% | 0.08% | 1.54% | |
| ICE BofA U.S. High Yield Constrained Index3 | 1.89% | 5.74% | 4.13% | 5.69% | |
| Morningstar High Yield Bond Category Average4 | 1.96% | 5.70% | 3.89% | 5.12% |
| 1. |
Not annualized. |
| 2. |
The Portfolio has selected the Bloomberg U.S. Aggregate Bond Index to represent a broad measure of market performance. The Bloomberg U.S. Aggregate Bond Index is a broad-based benchmark that measures the performance of the investment grade, U.S. dollar-denominated, fixed-rate taxable bond market, including Treasuries, government-related and corporate securities, mortgage-backed securities (agency fixed-rate and hybrid adjustable rate mortgage pass-throughs), asset-backed securities and commercial mortgage-backed securities. |
| 3. |
The ICE BofA U.S. High Yield Constrained Index, which is generally representative of the market sectors or types of investments in which the Portfolio invests, is a market value-weighted index of all domestic and Yankee high-yield bonds, including deferred interest bonds and payment-in-kind securities. Issuers included in the ICE BofA U.S. High Yield Constrained Index have maturities of one year or more and have a credit rating lower than BBB-/Baa3, but are not in default. No single issuer may constitute greater than 2% of the ICE BofA U.S. High Yield Constrained Index. |
| 4. |
The Morningstar High Yield Bond Category Average is representative of funds that concentrate on lower-quality bonds, which are riskier than those of higher-quality companies. These funds primarily invest in U.S. high-income debt securities where at least 65% or more of bond assets are not rated or are rated by a major agency such as Standard & Poor’s or Moody’s at the level of BB and below. Results are based on average total returns of similar funds with all dividends and capital gain distributions reinvested. |
Key Portfolio Statistics
| Portfolio's net assets | $3,114,444,584 |
| Total number of portfolio holdings | 666 |
| Portfolio turnover rate | 16% |
Graphical Representation of Holdings
The tables below show the investment makeup of the Portfolio; percentages indicated are based on the Portfolio's net assets.
Top Ten Holdings and/or Issuers*
| TransDigm, Inc., 4.625%-7.125%, due 8/15/28-7/31/34 | 2.5% |
| CCO Holdings LLC, 4.25%-5.375%, due 5/1/27-1/15/34 | 1.7% |
| Hilton Domestic Operating Co., Inc., 4.00%-6.125%, due 1/15/30-3/31/34 | 1.4% |
| Yum! Brands, Inc., 3.625%-6.875%, due 1/15/30-11/15/37 | 1.3% |
| Talen Energy Supply LLC, 5.644%-6.50%, due 5/1/31-2/1/36 | 1.2% |
| Churchill Downs, Inc., 4.75%-6.75%, due 4/1/27-5/1/31 | 1.1% |
| NRG Energy, Inc., 5.75%-6.25%, due 2/1/33-5/15/36 | 1.0% |
| IHO Verwaltungs GmbH, 6.375%-8.00%, due 5/15/29-5/15/33 | 1.0% |
| LifePoint Health, Inc., 5.375%-10.00%, due 1/15/29-5/1/34 | 1.0% |
| Mineral Resources Ltd., 6.00%-9.25%, due 10/1/28-5/1/34 | 0.9% |
| * Excluding short-term investments |
Portfolio Composition
| Corporate Bonds | 88.4% |
| Loan Assignments | 5.4% |
| Common Stocks | 0.9% |
| Preferred Stock | 0.5% |
| Convertible Bond | 0.2% |
| Other Assets, Less Liabilities | 4.6% |
Top Ten Holdings and/or Issuers*
| TransDigm, Inc., 4.625%-7.125%, due 8/15/28-7/31/34 | 2.5% |
| CCO Holdings LLC, 4.25%-5.375%, due 5/1/27-1/15/34 | 1.7% |
| Hilton Domestic Operating Co., Inc., 4.00%-6.125%, due 1/15/30-3/31/34 | 1.4% |
| Yum! Brands, Inc., 3.625%-6.875%, due 1/15/30-11/15/37 | 1.3% |
| Talen Energy Supply LLC, 5.644%-6.50%, due 5/1/31-2/1/36 | 1.2% |
| Churchill Downs, Inc., 4.75%-6.75%, due 4/1/27-5/1/31 | 1.1% |
| NRG Energy, Inc., 5.75%-6.25%, due 2/1/33-5/15/36 | 1.0% |
| IHO Verwaltungs GmbH, 6.375%-8.00%, due 5/15/29-5/15/33 | 1.0% |
| LifePoint Health, Inc., 5.375%-10.00%, due 1/15/29-5/1/34 | 1.0% |
| Mineral Resources Ltd., 6.00%-9.25%, due 10/1/28-5/1/34 | 0.9% |
| * Excluding short-term investments |
What were the Portfolio costs for the last six months?1
(Based on a hypothetical $10,000 investment)
| Share Class Name | Costs of a $10,000 investment | Costs paid as a percentage of a $10,000 investment2 |
| Service Class | $57 | 1.11% |
| 1. | Does not include any separate account or policy fees or charges imposed under the variable annuity policies and variable universal life insurance policies for which the Portfolio is an investment option. If they were included, your costs would be higher. |
| 2. | Annualized. |
Portfolio Performance
The following graph compares the initial and subsequent account values at the end of each of the most recently completed 10 semiannual reporting periods of the Portfolio (or for the life of the Portfolio, if shorter). It assumes a $10,000 initial investment at the beginning of the first fiscal period in an appropriate, broad-based securities market index and other indexes, if applicable, for the same period. The Portfolio’s subadvisor changed effective January 1, 2018 due to an organizational restructuring whereby all investment personnel of Cornerstone Capital Management Holdings LLC, the former subadvisor, transitioned to MacKay Shields LLC. Effective August 28, 2023, the Portfolio replaced its subadvisor, changed its investment objective and modified its principal investment strategies. The past performance in the graph and table prior to that date reflects the Portfolio's prior subadvisor, investment objective and principal investment strategies.
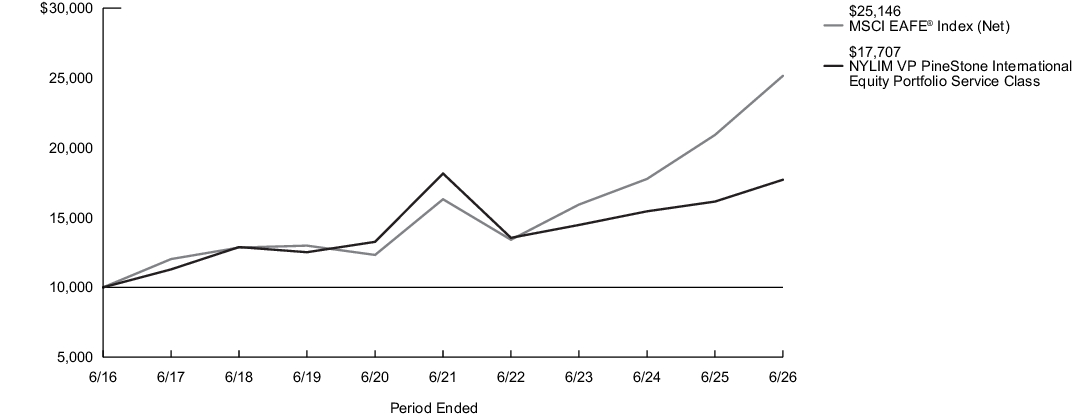
| Average Annual Total Returns for the Period Ended June 30, 2026 | Inception Date |
Six Months1 |
One Year |
Five Years |
Ten Years |
| Service Class Shares | 6/5/2003 | 6.34% | 9.69% | (0.50)% | 5.88% |
| MSCI EAFE® Index (Net)2 | 9.44% | 20.23% | 9.05% | 9.66% | |
| Morningstar Foreign Large Growth Category Average3 | 10.18% | 14.02% | 4.14% | 8.98% |
| 1. |
Not annualized. |
| 2. |
The Portfolio has selected the MSCI EAFE® Index (Net) to represent a broad measure of market performance, and it is generally representative of the market sectors or types of investments in which the Portfolio invests. The MSCI EAFE® Index (Net) consists of international stocks representing the developed world outside of North America. |
| 3. |
The Morningstar Foreign Large Growth Category Average is representative of funds that focus on high-priced growth stocks, mainly outside of the United States. Most of these funds divide their assets among a dozen or more developed markets, including Japan, Britain, France, and Germany. These funds primarily invest in stocks that have market caps in the top 70% of each economically integrated market and will have less than 20% of assets invested in U.S. stocks. Results are based on average total returns of similar funds with all dividends and capital gain distributions reinvested. |
Key Portfolio Statistics
| Portfolio's net assets | $328,935,504 |
| Total number of portfolio holdings | 35 |
| Portfolio turnover rate | 5% |
Graphical Representation of Holdings
The tables below show the investment makeup of the Portfolio; percentages indicated are based on the Portfolio's net assets.
Top Ten Holdings and/or Issuers*
| Taiwan Semiconductor Manufacturing Co. Ltd., Sponsored ADR | 11.6% |
| ASML Holding NV | 9.5% |
| InterContinental Hotels Group plc | 6.4% |
| Air Liquide SA | 6.3% |
| Keyence Corp. | 6.0% |
| London Stock Exchange Group plc | 5.1% |
| Cie Financiere Richemont SA (Registered) | 4.9% |
| Nestle SA (Registered) | 4.1% |
| LVMH Moet Hennessy Louis Vuitton SE | 3.4% |
| L'Oreal SA | 3.1% |
| * Excluding short-term investments |
Top Countries
| United States | 16.7% |
| France | 16.6% |
| Switzerland | 13.6% |
| Taiwan | 11.6% |
| United Kingdom | 10.8% |
| Netherlands | 9.5% |
| Japan | 6.0% |
| Spain | 5.5% |
| Canada | 4.0% |
| Germany | 4.0% |
| Other | 1.7% |
Top Ten Holdings and/or Issuers*
| Taiwan Semiconductor Manufacturing Co. Ltd., Sponsored ADR | 11.6% |
| ASML Holding NV | 9.5% |
| InterContinental Hotels Group plc | 6.4% |
| Air Liquide SA | 6.3% |
| Keyence Corp. | 6.0% |
| London Stock Exchange Group plc | 5.1% |
| Cie Financiere Richemont SA (Registered) | 4.9% |
| Nestle SA (Registered) | 4.1% |
| LVMH Moet Hennessy Louis Vuitton SE | 3.4% |
| L'Oreal SA | 3.1% |
| * Excluding short-term investments |
What were the Portfolio costs for the last six months?1
(Based on a hypothetical $10,000 investment)
| Share Class Name | Costs of a $10,000 investment | Costs paid as a percentage of a $10,000 investment2 |
| Initial Class | $44 | 0.86% |
| 1. | Does not include any separate account or policy fees or charges imposed under the variable annuity policies and variable universal life insurance policies for which the Portfolio is an investment option. If they were included, your costs would be higher. |
| 2. | Annualized. |
Portfolio Performance
The following graph compares the initial and subsequent account values at the end of each of the most recently completed 10 semiannual reporting periods of the Portfolio (or for the life of the Portfolio, if shorter). It assumes a $10,000 initial investment at the beginning of the first fiscal period in an appropriate, broad-based securities market index and other indexes, if applicable, for the same period. The Portfolio’s subadvisor changed effective January 1, 2018 due to an organizational restructuring whereby all investment personnel of Cornerstone Capital Management Holdings LLC, the former subadvisor, transitioned to MacKay Shields LLC. Effective August 28, 2023, the Portfolio replaced its subadvisor, changed its investment objective and modified its principal investment strategies. The past performance in the graph and table prior to that date reflects the Portfolio's prior subadvisor, investment objective and principal investment strategies.
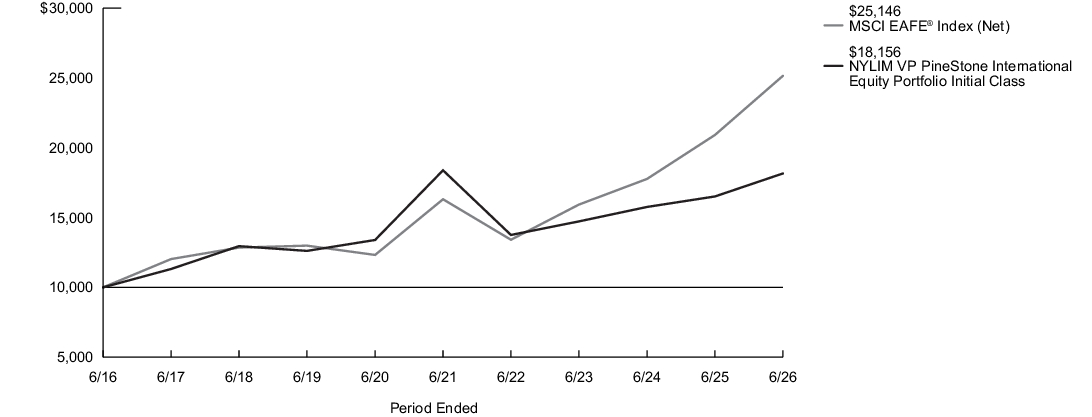
| Average Annual Total Returns for the Period Ended June 30, 2026 | Inception Date |
Six Months1 |
One Year |
Five Years |
Ten Years |
| Initial Class Shares | 5/1/1995 | 6.47% | 9.96% | (0.25)% | 6.15% |
| MSCI EAFE® Index (Net)2 | 9.44% | 20.23% | 9.05% | 9.66% | |
| Morningstar Foreign Large Growth Category Average3 | 10.18% | 14.02% | 4.14% | 8.98% |
| 1. |
Not annualized. |
| 2. |
The Portfolio has selected the MSCI EAFE® Index (Net) to represent a broad measure of market performance, and it is generally representative of the market sectors or types of investments in which the Portfolio invests. The MSCI EAFE® Index (Net) consists of international stocks representing the developed world outside of North America. |
| 3. |
The Morningstar Foreign Large Growth Category Average is representative of funds that focus on high-priced growth stocks, mainly outside of the United States. Most of these funds divide their assets among a dozen or more developed markets, including Japan, Britain, France, and Germany. These funds primarily invest in stocks that have market caps in the top 70% of each economically integrated market and will have less than 20% of assets invested in U.S. stocks. Results are based on average total returns of similar funds with all dividends and capital gain distributions reinvested. |
Key Portfolio Statistics
| Portfolio's net assets | $328,935,504 |
| Total number of portfolio holdings | 35 |
| Portfolio turnover rate | 5% |
Graphical Representation of Holdings
The tables below show the investment makeup of the Portfolio; percentages indicated are based on the Portfolio's net assets.
Top Ten Holdings and/or Issuers*
| Taiwan Semiconductor Manufacturing Co. Ltd., Sponsored ADR | 11.6% |
| ASML Holding NV | 9.5% |
| InterContinental Hotels Group plc | 6.4% |
| Air Liquide SA | 6.3% |
| Keyence Corp. | 6.0% |
| London Stock Exchange Group plc | 5.1% |
| Cie Financiere Richemont SA (Registered) | 4.9% |
| Nestle SA (Registered) | 4.1% |
| LVMH Moet Hennessy Louis Vuitton SE | 3.4% |
| L'Oreal SA | 3.1% |
| * Excluding short-term investments |
Top Countries
| United States | 16.7% |
| France | 16.6% |
| Switzerland | 13.6% |
| Taiwan | 11.6% |
| United Kingdom | 10.8% |
| Netherlands | 9.5% |
| Japan | 6.0% |
| Spain | 5.5% |
| Canada | 4.0% |
| Germany | 4.0% |
| Other | 1.7% |
Top Ten Holdings and/or Issuers*
| Taiwan Semiconductor Manufacturing Co. Ltd., Sponsored ADR | 11.6% |
| ASML Holding NV | 9.5% |
| InterContinental Hotels Group plc | 6.4% |
| Air Liquide SA | 6.3% |
| Keyence Corp. | 6.0% |
| London Stock Exchange Group plc | 5.1% |
| Cie Financiere Richemont SA (Registered) | 4.9% |
| Nestle SA (Registered) | 4.1% |
| LVMH Moet Hennessy Louis Vuitton SE | 3.4% |
| L'Oreal SA | 3.1% |
| * Excluding short-term investments |
What were the Portfolio costs for the last six months?1
(Based on a hypothetical $10,000 investment)
| Share Class Name | Costs of a $10,000 investment | Costs paid as a percentage of a $10,000 investment2 |
| Initial Class | $33 | 0.65% |
| 1. | Does not include any separate account or policy fees or charges imposed under the variable annuity policies and variable universal life insurance policies for which the Portfolio is an investment option. If they were included, your costs would be higher. |
| 2. | Annualized. |
Portfolio Performance
The following graph compares the initial and subsequent account values at the end of each of the most recently completed 10 semiannual reporting periods of the Portfolio (or for the life of the Portfolio, if shorter). It assumes a $10,000 initial investment at the beginning of the first fiscal period in an appropriate, broad-based securities market index and other indexes, if applicable, for the same period.
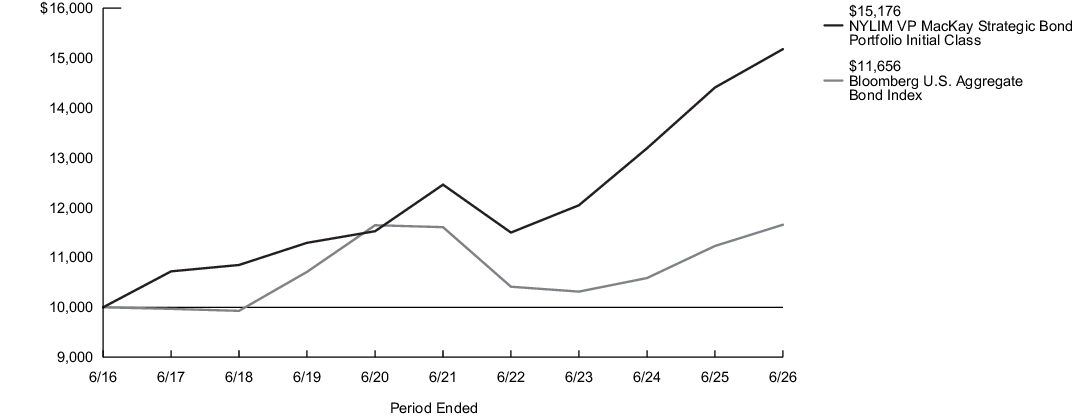
| Average Annual Total Returns for the Period Ended June 30, 2026 | Inception Date |
Six Months1 |
One Year |
Five Years |
Ten Years |
| Initial Class Shares | 4/29/2011 | 1.83% | 5.33% | 4.02% | 4.26% |
| Bloomberg U.S. Aggregate Bond Index2 | 0.62% | 3.79% | 0.08% | 1.54% | |
| Morningstar Multisector Bond Category Average3 | 0.99% | 5.31% | 2.75% | 3.77% |
| 1. |
Not annualized. |
| 2. |
The Portfolio has selected the Bloomberg U.S. Aggregate Bond Index to represent a broad measure of market performance, and is generally representative of the market sectors or types of investments in which the Portfolio invests. The Bloomberg U.S. Aggregate Bond Index is a broad-based benchmark that measures the performance of the investment grade, U.S. dollar-denominated, fixed-rate taxable bond market, including Treasuries, government-related and corporate securities, mortgage-backed securities (agency fixed-rate and hybrid adjustable-rate mortgage pass-throughs), asset-backed securities and commercial mortgage-backed securities. |
| 3. |
The Morningstar Multisector Bond Category Average is representative of funds that seek income by diversifying their assets among several fixed-income sectors, usually U.S. government obligations, U.S. corporate bonds, foreign bonds, and high-yield U.S. debt securities. These portfolios typically hold 35% to 65% of bonds assets in securities that are not rated by a major agency such as Standard & Poor’s or Moody’s at the level of BB (considered speculative for taxable bonds) and below. Results are based on average total returns of similar funds with all dividends and capital gain distributions reinvested. |
Key Portfolio Statistics
| Portfolio's net assets | $521,477,172 |
| Total number of portfolio holdings | 525 |
| Portfolio turnover rate | 41% |
Graphical Representation of Holdings
The tables below show the investment makeup of the Portfolio; percentages indicated are based on the Portfolio's net assets.
Top Ten Holdings and/or Issuers*
| U.S. Treasury Notes, 3.875%-4.375%, due 4/15/29-5/15/36 | 5.4% |
| GNMA, (zero coupon)-5.083%, due 7/20/44-3/16/66 | 3.7% |
| Connecticut Avenue Securities Trust, 5.328%-12.992%, due 11/25/39-2/25/45 | 3.0% |
| FHLMC STACR REMIC Trust, 5.278%-12.128%, due 9/25/41-1/25/50 | 1.9% |
| Flagship Credit Auto Trust, 2.26%-5.80%, due 12/15/27-3/15/29 | 1.6% |
| FHLMC STACR Trust, 8.542%-14.992%, due 9/25/47-4/25/49 | 1.6% |
| Multifamily Connecticut Avenue Securities Trust, 6.728%-11.242%, due 10/25/49-5/25/55 | 1.3% |
| Commercial Mortgage Trust, 2.773%-4.921%, due 9/15/33-2/10/49 | 1.3% |
| Exeter Automobile Receivables Trust, 5.57%-7.52%, due 10/15/29-6/15/33 | 1.2% |
| FHLMC, (zero coupon)-3.50%, due 12/25/48-8/15/56 | 1.1% |
| * Excluding short-term investments |
Portfolio Composition
| Corporate Bonds | 41.7% |
| Mortgage-Backed Securities | 25.9% |
| Asset-Backed Securities | 12.3% |
| Foreign Government Bonds | 7.2% |
| U.S. Government & Federal Agencies | 5.8% |
| Loan Assignments | 5.0% |
| Short-Term Investments | 3.3% |
| Other Assets, Less Liabilities | (1.2)% |
Top Ten Holdings and/or Issuers*
| U.S. Treasury Notes, 3.875%-4.375%, due 4/15/29-5/15/36 | 5.4% |
| GNMA, (zero coupon)-5.083%, due 7/20/44-3/16/66 | 3.7% |
| Connecticut Avenue Securities Trust, 5.328%-12.992%, due 11/25/39-2/25/45 | 3.0% |
| FHLMC STACR REMIC Trust, 5.278%-12.128%, due 9/25/41-1/25/50 | 1.9% |
| Flagship Credit Auto Trust, 2.26%-5.80%, due 12/15/27-3/15/29 | 1.6% |
| FHLMC STACR Trust, 8.542%-14.992%, due 9/25/47-4/25/49 | 1.6% |
| Multifamily Connecticut Avenue Securities Trust, 6.728%-11.242%, due 10/25/49-5/25/55 | 1.3% |
| Commercial Mortgage Trust, 2.773%-4.921%, due 9/15/33-2/10/49 | 1.3% |
| Exeter Automobile Receivables Trust, 5.57%-7.52%, due 10/15/29-6/15/33 | 1.2% |
| FHLMC, (zero coupon)-3.50%, due 12/25/48-8/15/56 | 1.1% |
| * Excluding short-term investments |
What were the Portfolio costs for the last six months?1
(Based on a hypothetical $10,000 investment)
| Share Class Name | Costs of a $10,000 investment | Costs paid as a percentage of a $10,000 investment2 |
| Service Class | $45 | 0.90% |
| 1. | Does not include any separate account or policy fees or charges imposed under the variable annuity policies and variable universal life insurance policies for which the Portfolio is an investment option. If they were included, your costs would be higher. |
| 2. | Annualized. |
Portfolio Performance
The following graph compares the initial and subsequent account values at the end of each of the most recently completed 10 semiannual reporting periods of the Portfolio (or for the life of the Portfolio, if shorter). It assumes a $10,000 initial investment at the beginning of the first fiscal period in an appropriate, broad-based securities market index and other indexes, if applicable, for the same period.
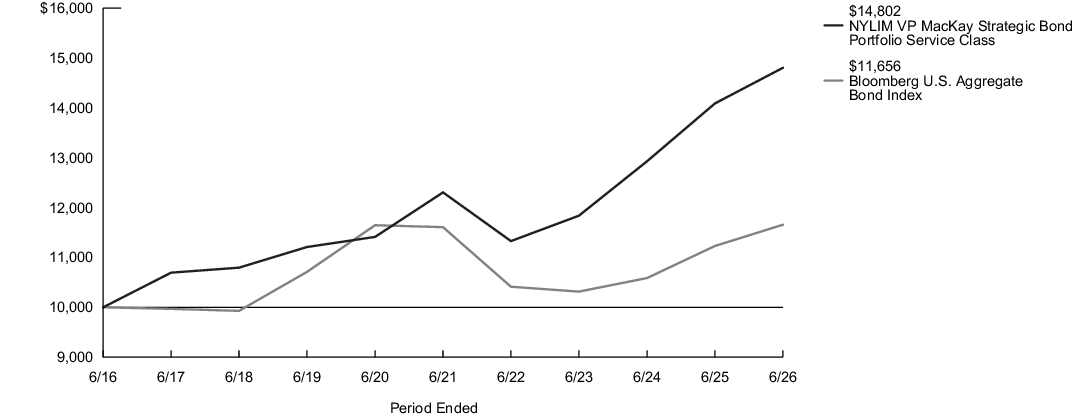
| Average Annual Total Returns for the Period Ended June 30, 2026 | Inception Date |
Six Months1 |
One Year |
Five Years |
Ten Years |
| Service Class Shares | 4/29/2011 | 1.71% | 5.07% | 3.77% | 4.00% |
| Bloomberg U.S. Aggregate Bond Index2 | 0.62% | 3.79% | 0.08% | 1.54% | |
| Morningstar Multisector Bond Category Average3 | 0.99% | 5.31% | 2.75% | 3.77% |
| 1. |
Not annualized. |
| 2. |
The Portfolio has selected the Bloomberg U.S. Aggregate Bond Index to represent a broad measure of market performance, and is generally representative of the market sectors or types of investments in which the Portfolio invests. The Bloomberg U.S. Aggregate Bond Index is a broad-based benchmark that measures the performance of the investment grade, U.S. dollar-denominated, fixed-rate taxable bond market, including Treasuries, government-related and corporate securities, mortgage-backed securities (agency fixed-rate and hybrid adjustable-rate mortgage pass-throughs), asset-backed securities and commercial mortgage-backed securities. |
| 3. |
The Morningstar Multisector Bond Category Average is representative of funds that seek income by diversifying their assets among several fixed-income sectors, usually U.S. government obligations, U.S. corporate bonds, foreign bonds, and high-yield U.S. debt securities. These portfolios typically hold 35% to 65% of bonds assets in securities that are not rated by a major agency such as Standard & Poor’s or Moody’s at the level of BB (considered speculative for taxable bonds) and below. Results are based on average total returns of similar funds with all dividends and capital gain distributions reinvested. |
Key Portfolio Statistics
| Portfolio's net assets | $521,477,172 |
| Total number of portfolio holdings | 525 |
| Portfolio turnover rate | 41% |
Graphical Representation of Holdings
The tables below show the investment makeup of the Portfolio; percentages indicated are based on the Portfolio's net assets.
Top Ten Holdings and/or Issuers*
| U.S. Treasury Notes, 3.875%-4.375%, due 4/15/29-5/15/36 | 5.4% |
| GNMA, (zero coupon)-5.083%, due 7/20/44-3/16/66 | 3.7% |
| Connecticut Avenue Securities Trust, 5.328%-12.992%, due 11/25/39-2/25/45 | 3.0% |
| FHLMC STACR REMIC Trust, 5.278%-12.128%, due 9/25/41-1/25/50 | 1.9% |
| Flagship Credit Auto Trust, 2.26%-5.80%, due 12/15/27-3/15/29 | 1.6% |
| FHLMC STACR Trust, 8.542%-14.992%, due 9/25/47-4/25/49 | 1.6% |
| Multifamily Connecticut Avenue Securities Trust, 6.728%-11.242%, due 10/25/49-5/25/55 | 1.3% |
| Commercial Mortgage Trust, 2.773%-4.921%, due 9/15/33-2/10/49 | 1.3% |
| Exeter Automobile Receivables Trust, 5.57%-7.52%, due 10/15/29-6/15/33 | 1.2% |
| FHLMC, (zero coupon)-3.50%, due 12/25/48-8/15/56 | 1.1% |
| * Excluding short-term investments |
Portfolio Composition
| Corporate Bonds | 41.7% |
| Mortgage-Backed Securities | 25.9% |
| Asset-Backed Securities | 12.3% |
| Foreign Government Bonds | 7.2% |
| U.S. Government & Federal Agencies | 5.8% |
| Loan Assignments | 5.0% |
| Short-Term Investments | 3.3% |
| Other Assets, Less Liabilities | (1.2)% |
Top Ten Holdings and/or Issuers*
| U.S. Treasury Notes, 3.875%-4.375%, due 4/15/29-5/15/36 | 5.4% |
| GNMA, (zero coupon)-5.083%, due 7/20/44-3/16/66 | 3.7% |
| Connecticut Avenue Securities Trust, 5.328%-12.992%, due 11/25/39-2/25/45 | 3.0% |
| FHLMC STACR REMIC Trust, 5.278%-12.128%, due 9/25/41-1/25/50 | 1.9% |
| Flagship Credit Auto Trust, 2.26%-5.80%, due 12/15/27-3/15/29 | 1.6% |
| FHLMC STACR Trust, 8.542%-14.992%, due 9/25/47-4/25/49 | 1.6% |
| Multifamily Connecticut Avenue Securities Trust, 6.728%-11.242%, due 10/25/49-5/25/55 | 1.3% |
| Commercial Mortgage Trust, 2.773%-4.921%, due 9/15/33-2/10/49 | 1.3% |
| Exeter Automobile Receivables Trust, 5.57%-7.52%, due 10/15/29-6/15/33 | 1.2% |
| FHLMC, (zero coupon)-3.50%, due 12/25/48-8/15/56 | 1.1% |
| * Excluding short-term investments |
What were the Portfolio costs for the last six months?1
(Based on a hypothetical $10,000 investment)
| Share Class Name | Costs of a $10,000 investment | Costs paid as a percentage of a $10,000 investment2 |
| Service Class | $81 | 1.42% |
| 1. | Does not include any separate account or policy fees or charges imposed under the variable annuity policies and variable universal life insurance policies for which the Portfolio is an investment option. If they were included, your costs would be higher. |
| 2. | Annualized. |
Portfolio Performance
The following graph compares the initial and subsequent account values at the end of each of the most recently completed 10 semiannual reporting periods of the Portfolio (or for the life of the Portfolio, if shorter). It assumes a $10,000 initial investment at the beginning of the first fiscal period in an appropriate, broad-based securities market index and other indexes, if applicable, for the same period. One of the Portfolio's subadvisors changed effective January 1, 2018 due to an organizational restructuring whereby all investment personnel of Cornerstone Capital Management Holdings LLC, the former subadvisor, transitioned to MacKay Shields LLC. Effective May 1, 2021, the Portfolio replaced one of its subadvisors and modified its principal investment strategies. The past performance in the graph and table prior to that date reflects the Portfolio's prior subadvisors and principal investment strategies.
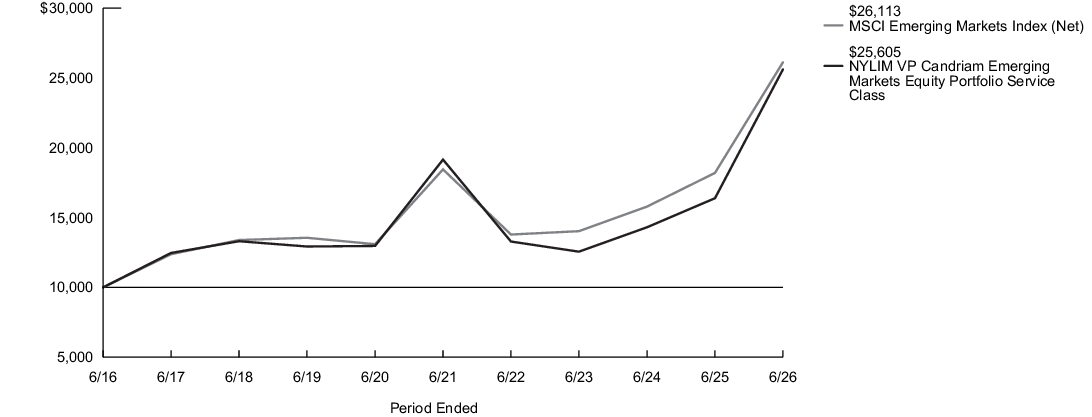
| Average Annual Total Returns for the Period Ended June 30, 2026 | Inception Date |
Six Months1 |
One Year |
Five Years |
Ten Years |
| Service Class Shares | 2/17/2012 | 30.48% | 56.29% | 5.98% | 9.86% |
| MSCI Emerging Markets Index (Net)2 | 23.85% | 43.51% | 7.20% | 10.07% | |
| Morningstar Diversified Emerging Markets Category Average3 | 24.19% | 41.91% | 6.65% | 9.33% |
| 1. |
Not annualized. |
| 2. |
The Portfolio has selected MSCI Emerging Markets Index (Net), which represents a broad measure of market performance, and is generally representative of the market sectors or types of investments in which the Portfolio invests. The MSCI Emerging Markets Index (Net) is a free float-adjusted market capitalization index that is designed to measure equity market performance in the global emerging markets. |
| 3. |
The Morningstar Diversified Emerging Markets Category Average is representative of funds that tend to divide their assets among 20 or more nations, although they tend to focus on the emerging markets of Asia and Latin America rather than on those of the Middle East, Africa, or Europe. These funds invest predominantly in emerging market equities, but some funds also invest in both equities and fixed income investments from emerging markets. Results are based on average total returns of similar funds with all dividends and capital gain distributions reinvested. |
Key Portfolio Statistics
| Portfolio's net assets | $234,669,418 |
| Total number of portfolio holdings | 116 |
| Portfolio turnover rate | 81% |
Graphical Representation of Holdings
The tables below show the investment makeup of the Portfolio; percentages indicated are based on the Portfolio's net assets.
Top Ten Holdings and/or Issuers*
| Taiwan Semiconductor Manufacturing Co. Ltd. | 9.7% |
| Samsung Electronics Co. Ltd. | 9.2% |
| SK hynix, Inc. | 4.2% |
| SK Square Co. Ltd. | 4.0% |
| Tencent Holdings Ltd. | 2.8% |
| MediaTek, Inc. | 2.4% |
| SK, Inc. | 1.7% |
| Yageo Corp. | 1.4% |
| ASE Technology Holding Co. Ltd. | 1.3% |
| Delta Electronics, Inc. | 1.3% |
| * Excluding short-term investments |
Top Countries
| Taiwan | 26.4% |
| Republic of Korea | 25.0% |
| China | 20.2% |
| India | 11.0% |
| Brazil | 2.3% |
| Argentina | 1.8% |
| Turkey | 1.5% |
| Peru | 1.4% |
| South Africa | 1.2% |
| Saudi Arabia | 1.1% |
| Other | 8.1% |
Top Ten Holdings and/or Issuers*
| Taiwan Semiconductor Manufacturing Co. Ltd. | 9.7% |
| Samsung Electronics Co. Ltd. | 9.2% |
| SK hynix, Inc. | 4.2% |
| SK Square Co. Ltd. | 4.0% |
| Tencent Holdings Ltd. | 2.8% |
| MediaTek, Inc. | 2.4% |
| SK, Inc. | 1.7% |
| Yageo Corp. | 1.4% |
| ASE Technology Holding Co. Ltd. | 1.3% |
| Delta Electronics, Inc. | 1.3% |
| * Excluding short-term investments |
What were the Portfolio costs for the last six months?1
(Based on a hypothetical $10,000 investment)
| Share Class Name | Costs of a $10,000 investment | Costs paid as a percentage of a $10,000 investment2 |
| Initial Class | $67 | 1.17% |
| 1. | Does not include any separate account or policy fees or charges imposed under the variable annuity policies and variable universal life insurance policies for which the Portfolio is an investment option. If they were included, your costs would be higher. |
| 2. | Annualized. |
Portfolio Performance
The following graph compares the initial and subsequent account values at the end of each of the most recently completed 10 semiannual reporting periods of the Portfolio (or for the life of the Portfolio, if shorter). It assumes a $10,000 initial investment at the beginning of the first fiscal period in an appropriate, broad-based securities market index and other indexes, if applicable, for the same period. One of the Portfolio's subadvisors changed effective January 1, 2018 due to an organizational restructuring whereby all investment personnel of Cornerstone Capital Management Holdings LLC, the former subadvisor, transitioned to MacKay Shields LLC. Effective May 1, 2021, the Portfolio replaced one of its subadvisors and modified its principal investment strategies. The past performance in the graph and table prior to that date reflects the Portfolio's prior subadvisors and principal investment strategies.
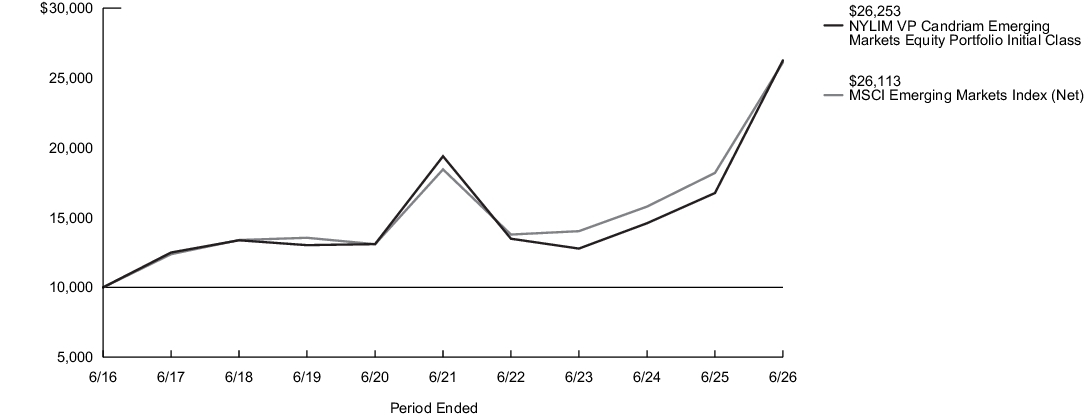
| Average Annual Total Returns for the Period Ended June 30, 2026 | Inception Date |
Six Months1 |
One Year |
Five Years |
Ten Years |
| Initial Class Shares | 2/17/2012 | 30.64% | 56.68% | 6.25% | 10.13% |
| MSCI Emerging Markets Index (Net)2 | 23.85% | 43.51% | 7.20% | 10.07% | |
| Morningstar Diversified Emerging Markets Category Average3 | 24.19% | 41.91% | 6.65% | 9.33% |
| 1. |
Not annualized. |
| 2. |
The Portfolio has selected MSCI Emerging Markets Index (Net), which represents a broad measure of market performance, and is generally representative of the market sectors or types of investments in which the Portfolio invests. The MSCI Emerging Markets Index (Net) is a free float-adjusted market capitalization index that is designed to measure equity market performance in the global emerging markets. |
| 3. |
The Morningstar Diversified Emerging Markets Category Average is representative of funds that tend to divide their assets among 20 or more nations, although they tend to focus on the emerging markets of Asia and Latin America rather than on those of the Middle East, Africa, or Europe. These funds invest predominantly in emerging market equities, but some funds also invest in both equities and fixed income investments from emerging markets. Results are based on average total returns of similar funds with all dividends and capital gain distributions reinvested. |
Key Portfolio Statistics
| Portfolio's net assets | $234,669,418 |
| Total number of portfolio holdings | 116 |
| Portfolio turnover rate | 81% |
Graphical Representation of Holdings
The tables below show the investment makeup of the Portfolio; percentages indicated are based on the Portfolio's net assets.
Top Ten Holdings and/or Issuers*
| Taiwan Semiconductor Manufacturing Co. Ltd. | 9.7% |
| Samsung Electronics Co. Ltd. | 9.2% |
| SK hynix, Inc. | 4.2% |
| SK Square Co. Ltd. | 4.0% |
| Tencent Holdings Ltd. | 2.8% |
| MediaTek, Inc. | 2.4% |
| SK, Inc. | 1.7% |
| Yageo Corp. | 1.4% |
| ASE Technology Holding Co. Ltd. | 1.3% |
| Delta Electronics, Inc. | 1.3% |
| * Excluding short-term investments |
Top Countries
| Taiwan | 26.4% |
| Republic of Korea | 25.0% |
| China | 20.2% |
| India | 11.0% |
| Brazil | 2.3% |
| Argentina | 1.8% |
| Turkey | 1.5% |
| Peru | 1.4% |
| South Africa | 1.2% |
| Saudi Arabia | 1.1% |
| Other | 8.1% |
Top Ten Holdings and/or Issuers*
| Taiwan Semiconductor Manufacturing Co. Ltd. | 9.7% |
| Samsung Electronics Co. Ltd. | 9.2% |
| SK hynix, Inc. | 4.2% |
| SK Square Co. Ltd. | 4.0% |
| Tencent Holdings Ltd. | 2.8% |
| MediaTek, Inc. | 2.4% |
| SK, Inc. | 1.7% |
| Yageo Corp. | 1.4% |
| ASE Technology Holding Co. Ltd. | 1.3% |
| Delta Electronics, Inc. | 1.3% |
| * Excluding short-term investments |
What were the Portfolio costs for the last six months?1
(Based on a hypothetical $10,000 investment)
| Share Class Name | Costs of a $10,000 investment | Costs paid as a percentage of a $10,000 investment2 |
| Initial Class | $47 | 0.86% |
| 1. | Does not include any separate account or policy fees or charges imposed under the variable annuity policies and variable universal life insurance policies for which the Portfolio is an investment option. If they were included, your costs would be higher. |
| 2. | Annualized. |
Portfolio Performance
The following graph compares the initial and subsequent account values at the end of each of the most recently completed 10 semiannual reporting periods of the Portfolio (or for the life of the Portfolio, if shorter). It assumes a $10,000 initial investment at the beginning of the first fiscal period in an appropriate, broad-based securities market index and other indexes, if applicable, for the same period. Effective May 1, 2020, the Portfolio replaced its subadvisor and modified its principal investment strategies. The past performance in the graph and table prior to that date reflects the Portfolio’s prior subadvisor and principal investment strategies.
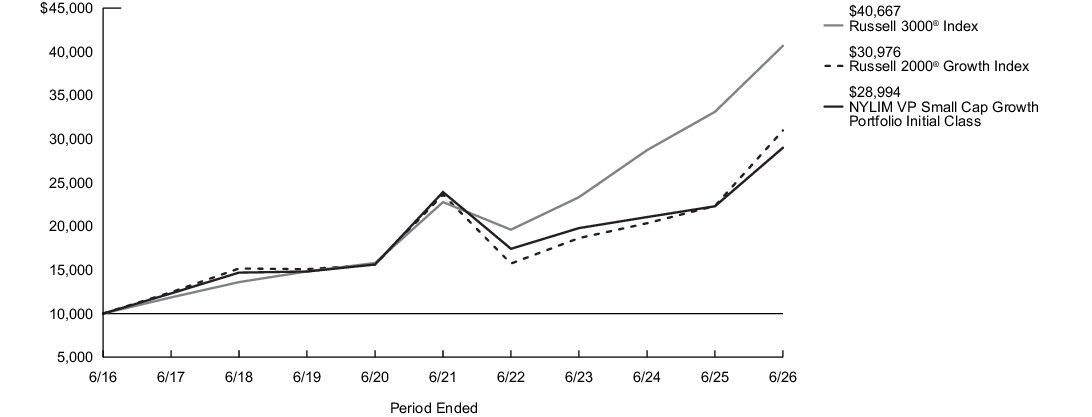
| Average Annual Total Returns for the Period Ended June 30, 2026 | Inception Date |
Six Months1 |
One Year |
Five Years |
Ten Years |
| Initial Class Shares | 2/17/2012 | 22.23% | 30.06% | 3.92% | 11.23% |
| Russell 3000®Index2 | 10.86% | 22.81% | 12.30% | 15.06% | |
| Russell 2000® Growth Index3 | 22.18% | 38.74% | 5.57% | 11.97% | |
| Morningstar Small Growth Category Average4 | 21.77% | 33.31% | 4.65% | 12.46% |
| 1. |
Not annualized. |
| 2. |
The Portfolio has selected the Russell 3000® Index to represent a broad measure of market performance. The Russell 3000® Index measures the performance of the largest 3,000 U.S. companies representing approximately 98% of the investable U.S. equity market. |
| 3. |
The Russell 2000® Growth Index, which is generally representative of the market sectors or types of investments in which the Portfolio invests, measures the performance of the small-cap growth segment of the U.S. equity universe. It includes those Russell 2000® Index companies with higher price-to-book ratios and higher forecasted growth values. |
| 4. |
The Morningstar Small Growth Category Average is representative of funds that focus on faster-growing companies whose shares are at the lower end of the market-capitalization range. These funds tend to favor companies in up-and-coming industries or young firms in their early growth stages. Results are based on average total returns of similar funds with all dividends and capital gain distributions reinvested. |
Key Portfolio Statistics
| Portfolio's net assets | $428,358,464 |
| Total number of portfolio holdings | 143 |
| Portfolio turnover rate | 25% |
Graphical Representation of Holdings
The tables below show the investment makeup of the Portfolio; percentages indicated are based on the Portfolio's net assets.
Top Ten Holdings and/or Issuers*
| Guardant Health, Inc. | 2.2% |
| HealthEquity, Inc. | 2.2% |
| Oceaneering International, Inc. | 1.9% |
| Materion Corp. | 1.8% |
| Establishment Labs Holdings, Inc. | 1.6% |
| Novanta, Inc. | 1.6% |
| Cytokinetics, Inc. | 1.5% |
| Prosperity Bancshares, Inc. | 1.5% |
| Casella Waste Systems, Inc., Class A | 1.5% |
| StoneX Group, Inc. | 1.4% |
| * Excluding short-term investments |
Top Industries
| Biotechnology | 8.5% |
| Semiconductors & Semiconductor Equipment | 8.1% |
| Health Care Providers & Services | 8.0% |
| Aerospace & Defense | 6.2% |
| Machinery | 5.7% |
| Commercial Services & Supplies | 5.2% |
| Software | 5.2% |
| Electronic Equipment, Instruments & Components | 5.0% |
| Health Care Equipment & Supplies | 4.9% |
| Capital Markets | 4.5% |
| Other | 38.7% |
Top Ten Holdings and/or Issuers*
| Guardant Health, Inc. | 2.2% |
| HealthEquity, Inc. | 2.2% |
| Oceaneering International, Inc. | 1.9% |
| Materion Corp. | 1.8% |
| Establishment Labs Holdings, Inc. | 1.6% |
| Novanta, Inc. | 1.6% |
| Cytokinetics, Inc. | 1.5% |
| Prosperity Bancshares, Inc. | 1.5% |
| Casella Waste Systems, Inc., Class A | 1.5% |
| StoneX Group, Inc. | 1.4% |
| * Excluding short-term investments |
What were the Portfolio costs for the last six months?1
(Based on a hypothetical $10,000 investment)
| Share Class Name | Costs of a $10,000 investment | Costs paid as a percentage of a $10,000 investment2 |
| Service Class | $61 | 1.11% |
| 1. | Does not include any separate account or policy fees or charges imposed under the variable annuity policies and variable universal life insurance policies for which the Portfolio is an investment option. If they were included, your costs would be higher. |
| 2. | Annualized. |
Portfolio Performance
The following graph compares the initial and subsequent account values at the end of each of the most recently completed 10 semiannual reporting periods of the Portfolio (or for the life of the Portfolio, if shorter). It assumes a $10,000 initial investment at the beginning of the first fiscal period in an appropriate, broad-based securities market index and other indexes, if applicable, for the same period. Effective May 1, 2020, the Portfolio replaced its subadvisor and modified its principal investment strategies. The past performance in the graph and table prior to that date reflects the Portfolio’s prior subadvisor and principal investment strategies.
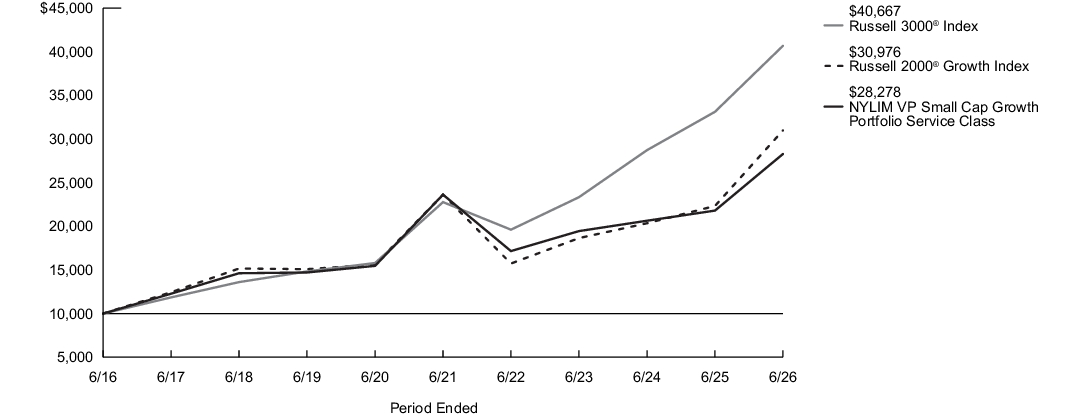
| Average Annual Total Returns for the Period Ended June 30, 2026 | Inception Date |
Six Months1 |
One Year |
Five Years |
Ten Years |
| Service Class Shares | 2/17/2012 | 22.08% | 29.74% | 3.67% | 10.95% |
| Russell 3000®Index2 | 10.86% | 22.81% | 12.30% | 15.06% | |
| Russell 2000® Growth Index3 | 22.18% | 38.74% | 5.57% | 11.97% | |
| Morningstar Small Growth Category Average4 | 21.77% | 33.31% | 4.65% | 12.46% |
| 1. |
Not annualized. |
| 2. |
The Portfolio has selected the Russell 3000® Index to represent a broad measure of market performance. The Russell 3000® Index measures the performance of the largest 3,000 U.S. companies representing approximately 98% of the investable U.S. equity market. |
| 3. |
The Russell 2000® Growth Index, which is generally representative of the market sectors or types of investments in which the Portfolio invests, measures the performance of the small-cap growth segment of the U.S. equity universe. It includes those Russell 2000® Index companies with higher price-to-book ratios and higher forecasted growth values. |
| 4. |
The Morningstar Small Growth Category Average is representative of funds that focus on faster-growing companies whose shares are at the lower end of the market-capitalization range. These funds tend to favor companies in up-and-coming industries or young firms in their early growth stages. Results are based on average total returns of similar funds with all dividends and capital gain distributions reinvested. |
Key Portfolio Statistics
| Portfolio's net assets | $428,358,464 |
| Total number of portfolio holdings | 143 |
| Portfolio turnover rate | 25% |
Graphical Representation of Holdings
The tables below show the investment makeup of the Portfolio; percentages indicated are based on the Portfolio's net assets.
Top Ten Holdings and/or Issuers*
| Guardant Health, Inc. | 2.2% |
| HealthEquity, Inc. | 2.2% |
| Oceaneering International, Inc. | 1.9% |
| Materion Corp. | 1.8% |
| Establishment Labs Holdings, Inc. | 1.6% |
| Novanta, Inc. | 1.6% |
| Cytokinetics, Inc. | 1.5% |
| Prosperity Bancshares, Inc. | 1.5% |
| Casella Waste Systems, Inc., Class A | 1.5% |
| StoneX Group, Inc. | 1.4% |
| * Excluding short-term investments |
Top Industries
| Biotechnology | 8.5% |
| Semiconductors & Semiconductor Equipment | 8.1% |
| Health Care Providers & Services | 8.0% |
| Aerospace & Defense | 6.2% |
| Machinery | 5.7% |
| Commercial Services & Supplies | 5.2% |
| Software | 5.2% |
| Electronic Equipment, Instruments & Components | 5.0% |
| Health Care Equipment & Supplies | 4.9% |
| Capital Markets | 4.5% |
| Other | 38.7% |
Top Ten Holdings and/or Issuers*
| Guardant Health, Inc. | 2.2% |
| HealthEquity, Inc. | 2.2% |
| Oceaneering International, Inc. | 1.9% |
| Materion Corp. | 1.8% |
| Establishment Labs Holdings, Inc. | 1.6% |
| Novanta, Inc. | 1.6% |
| Cytokinetics, Inc. | 1.5% |
| Prosperity Bancshares, Inc. | 1.5% |
| Casella Waste Systems, Inc., Class A | 1.5% |
| StoneX Group, Inc. | 1.4% |
| * Excluding short-term investments |
What were the Portfolio costs for the last six months?1
(Based on a hypothetical $10,000 investment)
| Share Class Name | Costs of a $10,000 investment | Costs paid as a percentage of a $10,000 investment2 |
| Initial Class | $45 | 0.84% |
| 1. | Does not include any separate account or policy fees or charges imposed under the variable annuity policies and variable universal life insurance policies for which the Portfolio is an investment option. If they were included, your costs would be higher. |
| 2. | Annualized. |
Portfolio Performance
The following graph compares the initial and subsequent account values at the end of each of the most recently completed 10 semiannual reporting periods of the Portfolio (or for the life of the Portfolio, if shorter). It assumes a $10,000 initial investment at the beginning of the first fiscal period in an appropriate, broad-based securities market index and other indexes, if applicable, for the same period. The Portfolio replaced its subadvisor, changed its investment objective and modified its principal investment strategies as of November 30, 2018. The past performance in the graph and table prior to that date reflects the Portfolio’s prior subadvisor, investment objective and principal investment strategies. The Portfolio's subadvisor changed effective September 1, 2021 due to an organizational restructuring whereby all investment personnel of Mellon Investments Corporation, the former subadvisor, transitioned to Newton Investment Management North America, LLC.
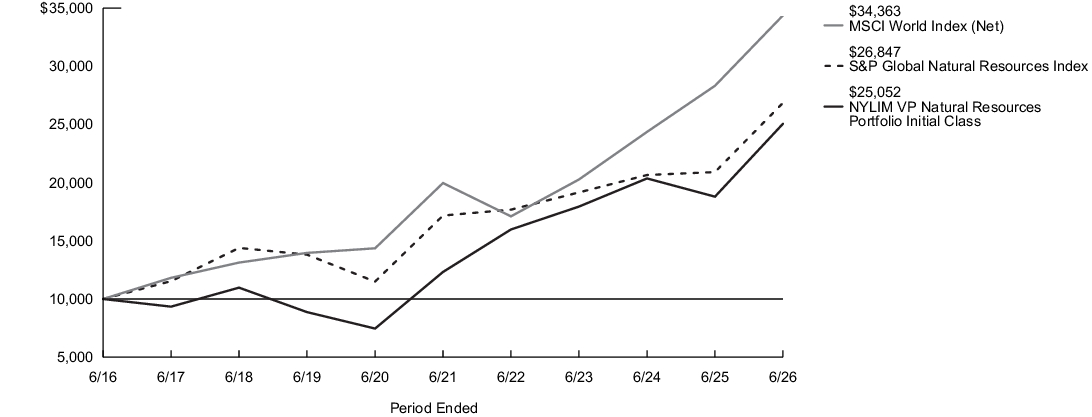
| Average Annual Total Returns for the Period Ended June 30, 2026 | Inception Date |
Six Months1 |
One Year |
Five Years |
Ten Years |
| Initial Class Shares | 2/17/2012 | 14.68% | 33.29% | 15.24% | 9.62% |
| MSCI World Index (Net)2 | 9.69% | 21.34% | 11.47% | 13.14% | |
| S&P Global Natural Resources Index3 | 9.71% | 28.41% | 9.35% | 10.38% | |
| Morningstar Natural Resources Category Average4 | 9.25% | 37.66% | 9.09% | 10.57% |
| 1. |
Not annualized. |
| 2. |
The Portfolio has selected the MSCI World Index (Net), to represent a broad measure of market performance. The MSCI World Index (Net) is a free float-adjusted market capitalization weighted index that is designed to measure the equity market performance of developed markets. |
| 3. |
The S&P Global Natural Resources Index, which is generally representative of the market sectors or types of investments in which the Portfolio invests, includes 90 of the largest publicly-traded companies in natural resources and commodities businesses that meet specific investability requirements, offering investors diversified and investable equity exposure to agribusiness, energy, and metals & mining. |
| 4. |
The Morningstar Natural Resources Category Average is representative of funds that invest primarily on commodity-based industries such as energy, chemicals, minerals, and forest products in the United States or outside of the United States. Some funds invest across this spectrum to offer broad natural-resources exposure. Others concentrate heavily or even exclusively in specific industries. Funds that concentrate primarily in energy-related industries are part of the equity energy category. Results are based on average total returns of similar funds with all dividends and capital gain distributions reinvested. |
Key Portfolio Statistics
| Portfolio's net assets | $324,200,385 |
| Total number of portfolio holdings | 42 |
| Portfolio turnover rate | 43% |
Graphical Representation of Holdings
The tables below show the investment makeup of the Portfolio; percentages indicated are based on the Portfolio's net assets.
Top Ten Holdings and/or Issuers*
| Freeport-McMoRan, Inc. | 4.5% |
| International Paper Co. | 4.3% |
| Exxon Mobil Corp. | 4.2% |
| BP plc | 4.2% |
| Newmont Corp. | 4.1% |
| SLB Ltd. | 4.0% |
| Diamondback Energy, Inc. | 4.0% |
| ConocoPhillips | 3.9% |
| Suncor Energy, Inc. | 3.9% |
| Agnico Eagle Mines Ltd. | 3.7% |
| * Excluding short-term investments |
Top Countries
| United States | 76.4% |
| Canada | 16.7% |
| Australia | 2.8% |
| Luxembourg | 2.7% |
| South Africa | 2.4% |
| Norway | 1.3% |
| Other | (2.3)% |
Top Ten Holdings and/or Issuers*
| Freeport-McMoRan, Inc. | 4.5% |
| International Paper Co. | 4.3% |
| Exxon Mobil Corp. | 4.2% |
| BP plc | 4.2% |
| Newmont Corp. | 4.1% |
| SLB Ltd. | 4.0% |
| Diamondback Energy, Inc. | 4.0% |
| ConocoPhillips | 3.9% |
| Suncor Energy, Inc. | 3.9% |
| Agnico Eagle Mines Ltd. | 3.7% |
| * Excluding short-term investments |
What were the Portfolio costs for the last six months?1
(Based on a hypothetical $10,000 investment)
| Share Class Name | Costs of a $10,000 investment | Costs paid as a percentage of a $10,000 investment2 |
| Initial Class | $29 | 0.57% |
| 1. | Does not include any separate account or policy fees or charges imposed under the variable annuity policies and variable universal life insurance policies for which the Portfolio is an investment option. If they were included, your costs would be higher. |
| 2. | Annualized. |
Portfolio Performance
The following graph compares the initial and subsequent account values at the end of each of the most recently completed 10 semiannual reporting periods of the Portfolio (or for the life of the Portfolio, if shorter). It assumes a $10,000 initial investment at the beginning of the first fiscal period in an appropriate, broad-based securities market index and other indexes, if applicable, for the same period. Effective May 1, 2024, the Portfolio modified its principal investment strategies. The past performance in the graph and table prior to that date reflects the Portfolio’s prior principal investment strategies.
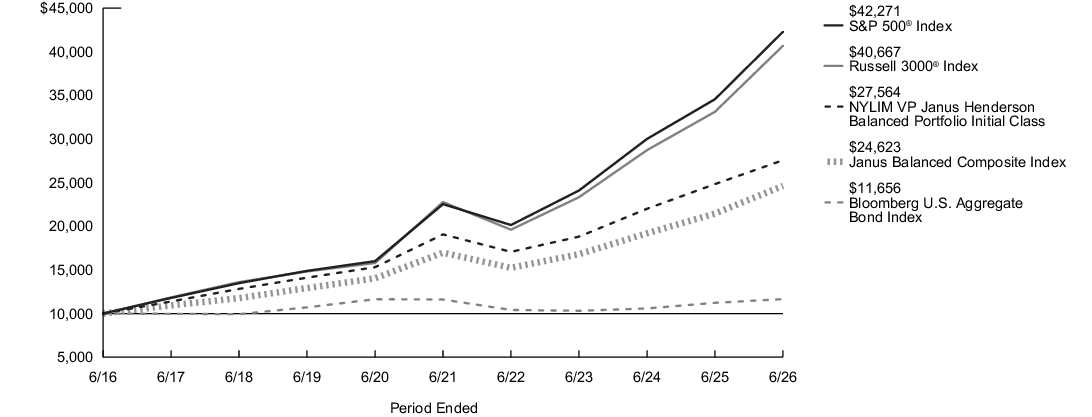
| Average Annual Total Returns for the Period Ended June 30, 2026 | Inception Date |
Six Months1 |
One Year |
Five Years |
Ten Years |
| Initial Class Shares | 2/17/2012 | 4.09% | 11.00% | 7.65% | 10.67% |
| Russell 3000®Index2 | 10.86% | 22.81% | 12.30% | 15.06% | |
| S&P 500®Index3 | 10.21% | 22.33% | 13.41% | 15.51% | |
| Bloomberg U.S. Aggregate Bond Index4 | 0.62% | 3.79% | 0.08% | 1.54% | |
| Janus Balanced Composite Index5 | 6.45% | 14.76% | 7.72% | 9.43% | |
| Morningstar Moderate Allocation Category Average6 | 6.91% | 14.28% | 6.74% | 8.64% |
| 1. |
Not annualized. |
| 2. |
The Portfolio has selected the Russell 3000® Index to represent a broad measure of market performance. The Russell 3000® Index measures the performance of the largest 3,000 U.S. companies representing approximately 98% of the investable U.S. equity market. |
| 3. |
The S&P 500® Index, which represents a broad measure of market performance, is generally representative of the market sectors or types of investments in which the Portfolio invests. S&P® and S&P 500® are registered trademarks of Standard & Poor’s Financial Services LLC. The S&P 500® Index is widely regarded as the standard index for measuring large-cap U.S. stock market performance. |
| 4. |
The Bloomberg U.S. Aggregate Bond Index, which is generally representative of the market sectors or types of investments in which the Portfolio invests, is a broad-based benchmark that measures the performance of the investment grade, U.S. dollar-denominated, fixed-rate taxable bond market, including Treasuries, government-related and corporate securities, mortgage-backed securities (agency fixed-rate and hybrid adjustable rate mortgage pass-throughs), asset-backed securities and commercial mortgage-backed securities. |
| 5. |
The Janus Balanced Composite Index, which is generally representative of the market sectors or types of investments in which the Portfolio invests, is comprised of the S&P 500® Index and the Bloomberg U.S. Aggregate Bond Index weighted 60%/40%, respectively. |
| 6. |
The Morningstar Moderate Allocation Category Average is representative of funds in allocation categories that seek to provide both income and capital appreciation by primarily investing in multiple asset classes, including stocks, bonds, and cash. These moderate strategies seek to balance preservation of capital with appreciation. They typically expect volatility similar to a strategic equity exposure between 50% and 70%. Results are based on average total returns of similar funds with all dividends and capital gain distributions reinvested. |
Key Portfolio Statistics
| Portfolio's net assets | $2,069,554,163 |
| Total number of portfolio holdings | 728 |
| Portfolio turnover rate | 76% |
Graphical Representation of Holdings
The tables below show the investment makeup of the Portfolio; percentages indicated are based on the Portfolio's net assets.
Top Ten Holdings and/or Issuers*
| U.S. Treasury Notes, 3.75%-4.375%, due 4/30/28-5/15/36 | 6.3% |
| NVIDIA Corp. | 5.6% |
| Alphabet, Inc., Class C | 4.4% |
| Microsoft Corp. | 3.3% |
| Amazon.com, Inc. | 3.1% |
| Apple, Inc. | 2.7% |
| Broadcom, Inc. | 2.5% |
| U.S. Treasury Bonds, 4.75%-5.00%, due 5/15/46-2/15/56 | 2.5% |
| UMBS, 30 Year, 2.00%-6.00%, due 2/1/37-12/1/55 | 2.2% |
| Micron Technology, Inc. | 2.2% |
| * Excluding short-term investments |
Portfolio Composition
| Common Stocks | 65.1% |
| U.S. Government & Federal Agencies | 16.0% |
| Corporate Bonds | 7.3% |
| Asset-Backed Securities | 5.2% |
| Mortgage-Backed Securities | 5.0% |
| Short-Term Investments | 2.6% |
| Loan Assignments | 0.8% |
| Other Assets, Less Liabilities | (2.0)% |
Top Ten Holdings and/or Issuers*
| U.S. Treasury Notes, 3.75%-4.375%, due 4/30/28-5/15/36 | 6.3% |
| NVIDIA Corp. | 5.6% |
| Alphabet, Inc., Class C | 4.4% |
| Microsoft Corp. | 3.3% |
| Amazon.com, Inc. | 3.1% |
| Apple, Inc. | 2.7% |
| Broadcom, Inc. | 2.5% |
| U.S. Treasury Bonds, 4.75%-5.00%, due 5/15/46-2/15/56 | 2.5% |
| UMBS, 30 Year, 2.00%-6.00%, due 2/1/37-12/1/55 | 2.2% |
| Micron Technology, Inc. | 2.2% |
| * Excluding short-term investments |
What were the Portfolio costs for the last six months?1
(Based on a hypothetical $10,000 investment)
| Share Class Name | Costs of a $10,000 investment | Costs paid as a percentage of a $10,000 investment2 |
| Service Class | $42 | 0.82% |
| 1. | Does not include any separate account or policy fees or charges imposed under the variable annuity policies and variable universal life insurance policies for which the Portfolio is an investment option. If they were included, your costs would be higher. |
| 2. | Annualized. |
Portfolio Performance
The following graph compares the initial and subsequent account values at the end of each of the most recently completed 10 semiannual reporting periods of the Portfolio (or for the life of the Portfolio, if shorter). It assumes a $10,000 initial investment at the beginning of the first fiscal period in an appropriate, broad-based securities market index and other indexes, if applicable, for the same period. Effective May 1, 2024, the Portfolio modified its principal investment strategies. The past performance in the graph and table prior to that date reflects the Portfolio’s prior principal investment strategies.
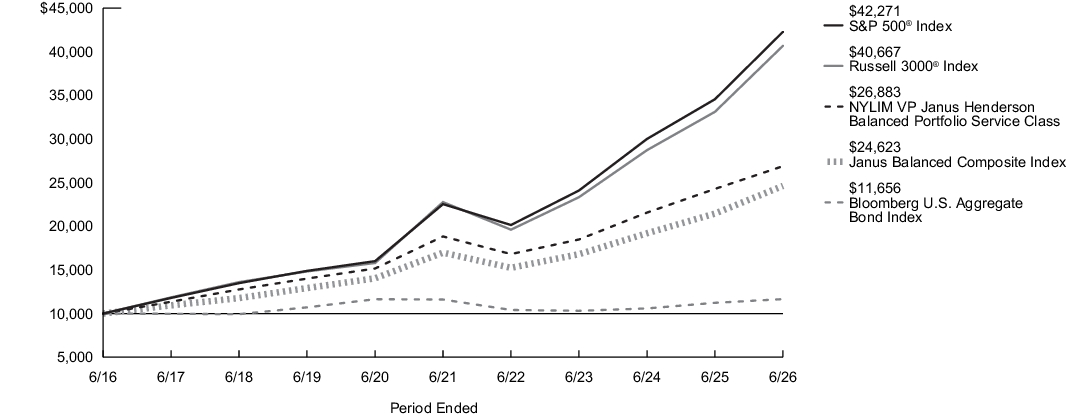
| Average Annual Total Returns for the Period Ended June 30, 2026 | Inception Date |
Six Months1 |
One Year |
Five Years |
Ten Years |
| Service Class Shares | 2/17/2012 | 3.96% | 10.72% | 7.38% | 10.39% |
| Russell 3000®Index2 | 10.86% | 22.81% | 12.30% | 15.06% | |
| S&P 500®Index3 | 10.21% | 22.33% | 13.41% | 15.51% | |
| Bloomberg U.S. Aggregate Bond Index4 | 0.62% | 3.79% | 0.08% | 1.54% | |
| Janus Balanced Composite Index5 | 6.45% | 14.76% | 7.72% | 9.43% | |
| Morningstar Moderate Allocation Category Average6 | 6.91% | 14.28% | 6.74% | 8.64% |
| 1. |
Not annualized. |
| 2. |
The Portfolio has selected the Russell 3000® Index to represent a broad measure of market performance. The Russell 3000® Index measures the performance of the largest 3,000 U.S. companies representing approximately 98% of the investable U.S. equity market. |
| 3. |
The S&P 500® Index, which represents a broad measure of market performance, is generally representative of the market sectors or types of investments in which the Portfolio invests. S&P® and S&P 500® are registered trademarks of Standard & Poor’s Financial Services LLC. The S&P 500® Index is widely regarded as the standard index for measuring large-cap U.S. stock market performance. |
| 4. |
The Bloomberg U.S. Aggregate Bond Index, which is generally representative of the market sectors or types of investments in which the Portfolio invests, is a broad-based benchmark that measures the performance of the investment grade, U.S. dollar-denominated, fixed-rate taxable bond market, including Treasuries, government-related and corporate securities, mortgage-backed securities (agency fixed-rate and hybrid adjustable rate mortgage pass-throughs), asset-backed securities and commercial mortgage-backed securities. |
| 5. |
The Janus Balanced Composite Index, which is generally representative of the market sectors or types of investments in which the Portfolio invests, is comprised of the S&P 500® Index and the Bloomberg U.S. Aggregate Bond Index weighted 60%/40%, respectively. |
| 6. |
The Morningstar Moderate Allocation Category Average is representative of funds in allocation categories that seek to provide both income and capital appreciation by primarily investing in multiple asset classes, including stocks, bonds, and cash. These moderate strategies seek to balance preservation of capital with appreciation. They typically expect volatility similar to a strategic equity exposure between 50% and 70%. Results are based on average total returns of similar funds with all dividends and capital gain distributions reinvested. |
Key Portfolio Statistics
| Portfolio's net assets | $2,069,554,163 |
| Total number of portfolio holdings | 728 |
| Portfolio turnover rate | 76% |
Graphical Representation of Holdings
The tables below show the investment makeup of the Portfolio; percentages indicated are based on the Portfolio's net assets.
Top Ten Holdings and/or Issuers*
| U.S. Treasury Notes, 3.75%-4.375%, due 4/30/28-5/15/36 | 6.3% |
| NVIDIA Corp. | 5.6% |
| Alphabet, Inc., Class C | 4.4% |
| Microsoft Corp. | 3.3% |
| Amazon.com, Inc. | 3.1% |
| Apple, Inc. | 2.7% |
| Broadcom, Inc. | 2.5% |
| U.S. Treasury Bonds, 4.75%-5.00%, due 5/15/46-2/15/56 | 2.5% |
| UMBS, 30 Year, 2.00%-6.00%, due 2/1/37-12/1/55 | 2.2% |
| Micron Technology, Inc. | 2.2% |
| * Excluding short-term investments |
Portfolio Composition
| Common Stocks | 65.1% |
| U.S. Government & Federal Agencies | 16.0% |
| Corporate Bonds | 7.3% |
| Asset-Backed Securities | 5.2% |
| Mortgage-Backed Securities | 5.0% |
| Short-Term Investments | 2.6% |
| Loan Assignments | 0.8% |
| Other Assets, Less Liabilities | (2.0)% |
Top Ten Holdings and/or Issuers*
| U.S. Treasury Notes, 3.75%-4.375%, due 4/30/28-5/15/36 | 6.3% |
| NVIDIA Corp. | 5.6% |
| Alphabet, Inc., Class C | 4.4% |
| Microsoft Corp. | 3.3% |
| Amazon.com, Inc. | 3.1% |
| Apple, Inc. | 2.7% |
| Broadcom, Inc. | 2.5% |
| U.S. Treasury Bonds, 4.75%-5.00%, due 5/15/46-2/15/56 | 2.5% |
| UMBS, 30 Year, 2.00%-6.00%, due 2/1/37-12/1/55 | 2.2% |
| Micron Technology, Inc. | 2.2% |
| * Excluding short-term investments |
What were the Portfolio costs for the last six months?1
(Based on a hypothetical $10,000 investment)
| Share Class Name | Costs of a $10,000 investment | Costs paid as a percentage of a $10,000 investment2 |
| Service Class | $47 | 0.92% |
| 1. | Does not include any separate account or policy fees or charges imposed under the variable annuity policies and variable universal life insurance policies for which the Portfolio is an investment option. If they were included, your costs would be higher. |
| 2. | Annualized. |
Portfolio Performance
The following graph compares the initial and subsequent account values at the end of each of the most recently completed 10 semiannual reporting periods of the Portfolio (or for the life of the Portfolio, if shorter). It assumes a $10,000 initial investment at the beginning of the first fiscal period in an appropriate, broad-based securities market index and other indexes, if applicable, for the same period.
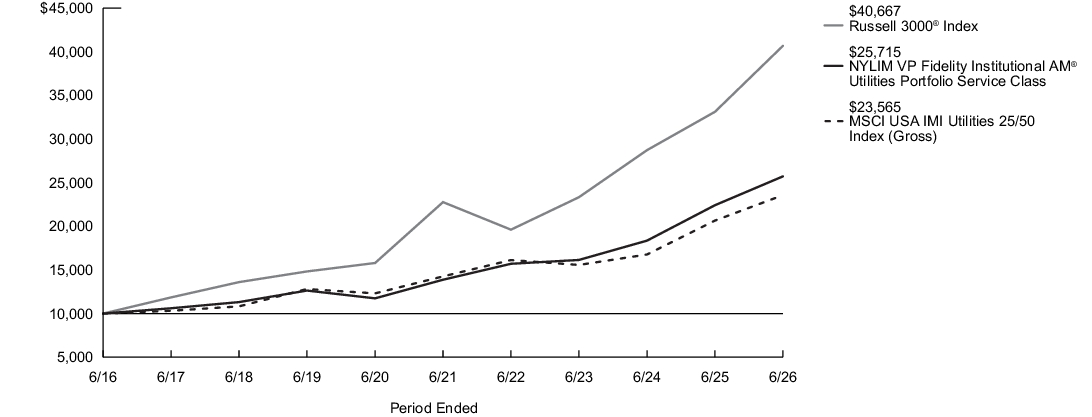
| Average Annual Total Returns for the Period Ended June 30, 2026 | Inception Date |
Six Months1 |
One Year |
Five Years |
Ten Years |
| Service Class Shares | 2/17/2012 | 7.15% | 14.73% | 13.13% | 9.91% |
| Russell 3000®Index2 | 10.86% | 22.81% | 12.30% | 15.06% | |
| MSCI USA IMI Utilities 25/50 Index (Gross)3 | 7.33% | 14.11% | 10.58% | 8.95% | |
| Morningstar Utilities Category Average4 | 9.81% | 16.75% | 10.82% | 8.75% |
| 1. |
Not annualized. |
| 2. |
The Portfolio has selected the Russell 3000® Index to represent a broad measure of market performance. The Russell 3000® Index measures the performance of the largest 3,000 U.S. companies representing approximately 98% of the investable U.S. equity market. |
| 3. |
The MSCI USA IMI Utilities 25/50 Index (Gross), which is generally representative of the market sectors or types of investments in which the Portfolio invests, is a modified market capitalization-weighted index of stocks designed to measure the performance of utilities companies in the MSCI U.S. Investable Market 2500 Index. |
| 4. |
The Morningstar Utilities Category Average is representative of funds that seek capital appreciation by investing primarily in equity securities of U.S. or non-U.S. public utilities including electric, gas, and telephone-service providers. Results are based on average total returns of similar funds with all dividends and capital gain distributions reinvested. |
Key Portfolio Statistics
| Portfolio's net assets | $857,060,577 |
| Total number of portfolio holdings | 40 |
| Portfolio turnover rate | 21% |
Graphical Representation of Holdings
The tables below show the investment makeup of the Portfolio; percentages indicated are based on the Portfolio's net assets.
Top Ten Holdings and/or Issuers*
| NextEra Energy, Inc. | 12.9% |
| American Electric Power Co., Inc. | 6.9% |
| Sempra | 5.4% |
| Duke Energy Corp. | 5.3% |
| Constellation Energy Corp. | 5.3% |
| Entergy Corp. | 5.1% |
| Xcel Energy, Inc. | 4.9% |
| Vistra Corp. | 4.8% |
| NRG Energy, Inc. | 4.7% |
| CenterPoint Energy, Inc. | 4.0% |
| * Excluding short-term investments |
Top Industries
| Electric Utilities | 65.8% |
| Multi–Utilities | 19.7% |
| Independent Power and Renewable Electricity Producers | 6.5% |
| Electrical Equipment | 2.1% |
| Construction & Engineering | 1.7% |
| Semiconductors & Semiconductor Equipment | 0.3% |
| Machinery | 0.3% |
| Oil, Gas & Consumable Fuels | 0.2% |
| Short–Term Investments | 3.7% |
| Other | (0.3)% |
Top Ten Holdings and/or Issuers*
| NextEra Energy, Inc. | 12.9% |
| American Electric Power Co., Inc. | 6.9% |
| Sempra | 5.4% |
| Duke Energy Corp. | 5.3% |
| Constellation Energy Corp. | 5.3% |
| Entergy Corp. | 5.1% |
| Xcel Energy, Inc. | 4.9% |
| Vistra Corp. | 4.8% |
| NRG Energy, Inc. | 4.7% |
| CenterPoint Energy, Inc. | 4.0% |
| * Excluding short-term investments |
What were the Portfolio costs for the last six months?1
(Based on a hypothetical $10,000 investment)
| Share Class Name | Costs of a $10,000 investment | Costs paid as a percentage of a $10,000 investment2 |
| Initial Class | $35 | 0.67% |
| 1. | Does not include any separate account or policy fees or charges imposed under the variable annuity policies and variable universal life insurance policies for which the Portfolio is an investment option. If they were included, your costs would be higher. |
| 2. | Annualized. |
Portfolio Performance
The following graph compares the initial and subsequent account values at the end of each of the most recently completed 10 semiannual reporting periods of the Portfolio (or for the life of the Portfolio, if shorter). It assumes a $10,000 initial investment at the beginning of the first fiscal period in an appropriate, broad-based securities market index and other indexes, if applicable, for the same period.
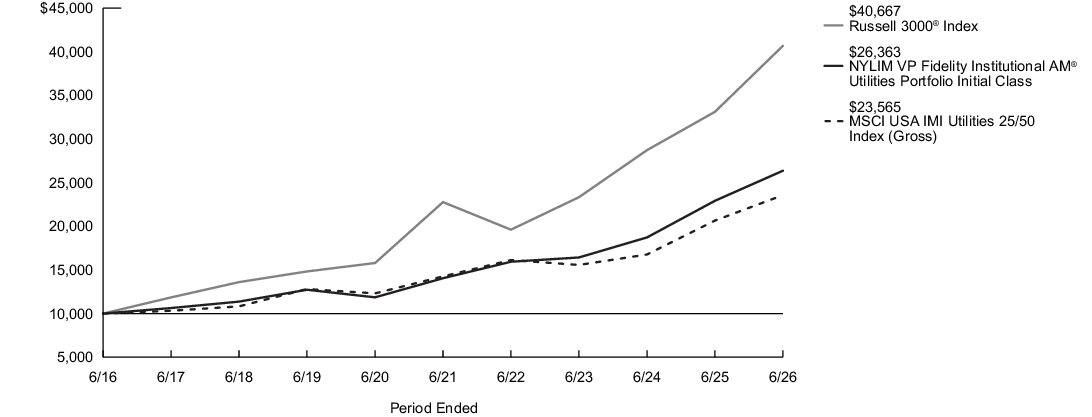
| Average Annual Total Returns for the Period Ended June 30, 2026 | Inception Date |
Six Months1 |
One Year |
Five Years |
Ten Years |
| Initial Class Shares | 2/17/2012 | 7.28% | 15.02% | 13.42% | 10.18% |
| Russell 3000®Index2 | 10.86% | 22.81% | 12.30% | 15.06% | |
| MSCI USA IMI Utilities 25/50 Index (Gross)3 | 7.33% | 14.11% | 10.58% | 8.95% | |
| Morningstar Utilities Category Average4 | 9.81% | 16.75% | 10.82% | 8.75% |
| 1. |
Not annualized. |
| 2. |
The Portfolio has selected the Russell 3000® Index to represent a broad measure of market performance. The Russell 3000® Index measures the performance of the largest 3,000 U.S. companies representing approximately 98% of the investable U.S. equity market. |
| 3. |
The MSCI USA IMI Utilities 25/50 Index (Gross), which is generally representative of the market sectors or types of investments in which the Portfolio invests, is a modified market capitalization-weighted index of stocks designed to measure the performance of utilities companies in the MSCI U.S. Investable Market 2500 Index. |
| 4. |
The Morningstar Utilities Category Average is representative of funds that seek capital appreciation by investing primarily in equity securities of U.S. or non-U.S. public utilities including electric, gas, and telephone-service providers. Results are based on average total returns of similar funds with all dividends and capital gain distributions reinvested. |
Key Portfolio Statistics
| Portfolio's net assets | $857,060,577 |
| Total number of portfolio holdings | 40 |
| Portfolio turnover rate | 21% |
Graphical Representation of Holdings
The tables below show the investment makeup of the Portfolio; percentages indicated are based on the Portfolio's net assets.
Top Ten Holdings and/or Issuers*
| NextEra Energy, Inc. | 12.9% |
| American Electric Power Co., Inc. | 6.9% |
| Sempra | 5.4% |
| Duke Energy Corp. | 5.3% |
| Constellation Energy Corp. | 5.3% |
| Entergy Corp. | 5.1% |
| Xcel Energy, Inc. | 4.9% |
| Vistra Corp. | 4.8% |
| NRG Energy, Inc. | 4.7% |
| CenterPoint Energy, Inc. | 4.0% |
| * Excluding short-term investments |
Top Industries
| Electric Utilities | 65.8% |
| Multi–Utilities | 19.7% |
| Independent Power and Renewable Electricity Producers | 6.5% |
| Electrical Equipment | 2.1% |
| Construction & Engineering | 1.7% |
| Semiconductors & Semiconductor Equipment | 0.3% |
| Machinery | 0.3% |
| Oil, Gas & Consumable Fuels | 0.2% |
| Short–Term Investments | 3.7% |
| Other | (0.3)% |
Top Ten Holdings and/or Issuers*
| NextEra Energy, Inc. | 12.9% |
| American Electric Power Co., Inc. | 6.9% |
| Sempra | 5.4% |
| Duke Energy Corp. | 5.3% |
| Constellation Energy Corp. | 5.3% |
| Entergy Corp. | 5.1% |
| Xcel Energy, Inc. | 4.9% |
| Vistra Corp. | 4.8% |
| NRG Energy, Inc. | 4.7% |
| CenterPoint Energy, Inc. | 4.0% |
| * Excluding short-term investments |
What were the Portfolio costs for the last six months?1
(Based on a hypothetical $10,000 investment)
| Share Class Name | Costs of a $10,000 investment | Costs paid as a percentage of a $10,000 investment2 |
| Initial Class | $35 | 0.68% |
| 1. | Does not include any separate account or policy fees or charges imposed under the variable annuity policies and variable universal life insurance policies for which the Portfolio is an investment option. If they were included, your costs would be higher. |
| 2. | Annualized. |
Portfolio Performance
The following graph compares the initial and subsequent account values at the end of each of the most recently completed 10 semiannual reporting periods of the Portfolio (or for the life of the Portfolio, if shorter). It assumes a $10,000 initial investment at the beginning of the first fiscal period in an appropriate, broad-based securities market index and other indexes, if applicable, for the same period. Effective May 1, 2022, the Portfolio replaced its subadvisor, changed its investment objective and modified its principal investment strategies. Effective May 1, 2026, the Portfolio modified it's principal investment strategies. The past performance in the graph and table prior to that date reflects the Portfolio’s prior subadvisor, investment objective and principal investment strategies.
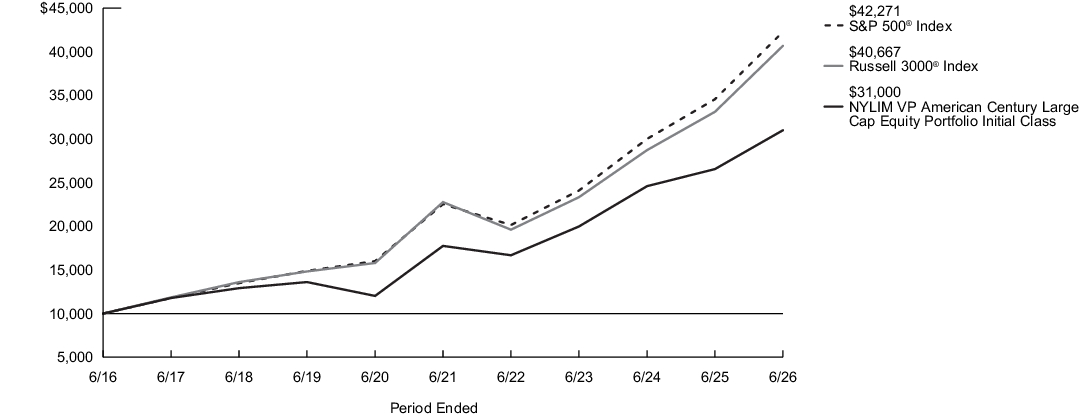
| Average Annual Total Returns for the Period Ended June 30, 2026 | Inception Date |
Six Months1 |
One Year |
Five Years |
Ten Years |
| Initial Class Shares | 2/17/2012 | 7.53% | 16.75% | 11.80% | 11.98% |
| Russell 3000®Index2 | 10.86% | 22.81% | 12.30% | 15.06% | |
| S&P 500®Index3 | 10.21% | 22.33% | 13.41% | 15.51% | |
| Morningstar Large Blend Category Average4 | 9.74% | 21.21% | 10.48% | 11.47% |
| 1. |
Not annualized. |
| 2. |
The Portfolio has selected the Russell 3000® Index to represent a broad measure of market performance. The Russell 3000® Index measures the performance of the largest 3,000 U.S. companies representing approximately 98% of the investable U.S. equity market. |
| 3. |
The S&P 500® Index, which represents a broad measure of market performance, is generally representative of the market sectors or types of investments in which the Portfolio invests. S&P® and S&P 500® are registered trademarks of Standard & Poor’s Financial Services LLC. The S&P 500® Index is widely regarded as the standard index for measuring large-cap U.S. stock market performance. |
| 4. |
The Morningstar Large Blend Category Average is representative of funds that represent the overall U.S. stock market in size, growth rates and price. Stocks in the top 70% of the capitalization of the U.S. equity market are defined as large cap. The blend style is assigned to funds where neither growth nor value characteristics predominate. These funds tend to invest across the spectrum of U.S. industries, and owing to their broad exposure, the funds' returns are often similar to those of the S&P 500® Index. Results are based on average total returns of similar funds with all dividends and capital gain distributions reinvested. |
Key Portfolio Statistics
| Portfolio's net assets | $336,512,063 |
| Total number of portfolio holdings | 109 |
| Portfolio turnover rate | 9% |
Graphical Representation of Holdings
The tables below show the investment makeup of the Portfolio; percentages indicated are based on the Portfolio's net assets.
Top Ten Holdings and/or Issuers*
| NVIDIA Corp. | 8.0% |
| Alphabet, Inc., Class A | 6.5% |
| Microsoft Corp. | 5.5% |
| Apple, Inc. | 4.9% |
| Amazon.com, Inc. | 3.4% |
| Broadcom, Inc. | 3.3% |
| Micron Technology, Inc. | 2.1% |
| Applied Materials, Inc. | 1.8% |
| Eli Lilly & Co. | 1.6% |
| NextEra Energy, Inc. | 1.6% |
| * Excluding short-term investments |
Top Industries
| Semiconductors & Semiconductor Equipment | 20.0% |
| Software | 9.0% |
| Interactive Media & Services | 8.0% |
| Technology Hardware, Storage & Peripherals | 5.7% |
| Banks | 4.3% |
| Broadline Retail | 3.4% |
| Capital Markets | 3.3% |
| Machinery | 3.1% |
| Specialty Retail | 2.7% |
| Financial Services | 2.4% |
| Other | 38.1% |
Top Ten Holdings and/or Issuers*
| NVIDIA Corp. | 8.0% |
| Alphabet, Inc., Class A | 6.5% |
| Microsoft Corp. | 5.5% |
| Apple, Inc. | 4.9% |
| Amazon.com, Inc. | 3.4% |
| Broadcom, Inc. | 3.3% |
| Micron Technology, Inc. | 2.1% |
| Applied Materials, Inc. | 1.8% |
| Eli Lilly & Co. | 1.6% |
| NextEra Energy, Inc. | 1.6% |
| * Excluding short-term investments |
What were the Portfolio costs for the last six months?1
(Based on a hypothetical $10,000 investment)
| Share Class Name | Costs of a $10,000 investment | Costs paid as a percentage of a $10,000 investment2 |
| Service Class | $48 | 0.93% |
| 1. | Does not include any separate account or policy fees or charges imposed under the variable annuity policies and variable universal life insurance policies for which the Portfolio is an investment option. If they were included, your costs would be higher. |
| 2. | Annualized. |
Portfolio Performance
The following graph compares the initial and subsequent account values at the end of each of the most recently completed 10 semiannual reporting periods of the Portfolio (or for the life of the Portfolio, if shorter). It assumes a $10,000 initial investment at the beginning of the first fiscal period in an appropriate, broad-based securities market index and other indexes, if applicable, for the same period. Effective May 1, 2022, the Portfolio replaced its subadvisor, changed its investment objective and modified its principal investment strategies. Effective May 1, 2026, the Portfolio modified it's principal investment strategies. The past performance in the graph and table prior to that date reflects the Portfolio’s prior subadvisor, investment objective and principal investment strategies.
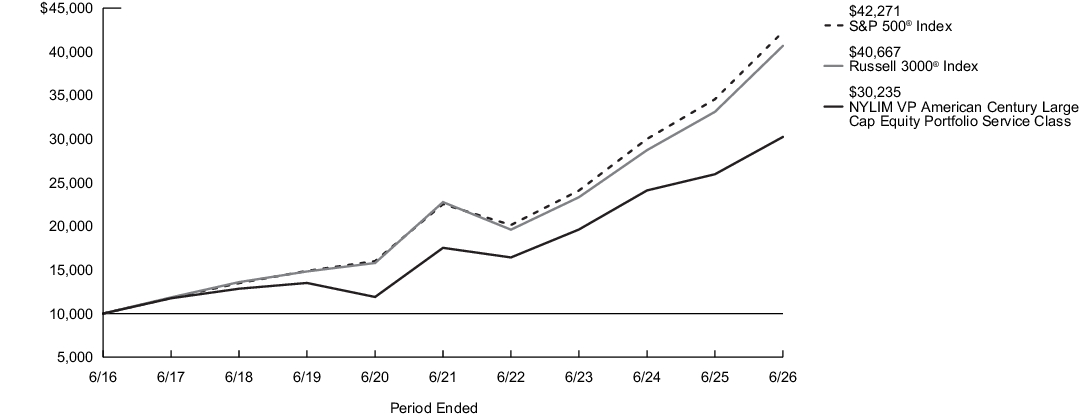
| Average Annual Total Returns for the Period Ended June 30, 2026 | Inception Date |
Six Months1 |
One Year |
Five Years |
Ten Years |
| Service Class Shares | 2/17/2012 | 7.40% | 16.46% | 11.52% | 11.70% |
| Russell 3000®Index2 | 10.86% | 22.81% | 12.30% | 15.06% | |
| S&P 500®Index3 | 10.21% | 22.33% | 13.41% | 15.51% | |
| Morningstar Large Blend Category Average4 | 9.74% | 21.21% | 10.48% | 11.47% |
| 1. |
Not annualized. |
| 2. |
The Portfolio has selected the Russell 3000® Index to represent a broad measure of market performance. The Russell 3000® Index measures the performance of the largest 3,000 U.S. companies representing approximately 98% of the investable U.S. equity market. |
| 3. |
The S&P 500® Index, which represents a broad measure of market performance, is generally representative of the market sectors or types of investments in which the Portfolio invests. S&P® and S&P 500® are registered trademarks of Standard & Poor’s Financial Services LLC. The S&P 500® Index is widely regarded as the standard index for measuring large-cap U.S. stock market performance. |
| 4. |
The Morningstar Large Blend Category Average is representative of funds that represent the overall U.S. stock market in size, growth rates and price. Stocks in the top 70% of the capitalization of the U.S. equity market are defined as large cap. The blend style is assigned to funds where neither growth nor value characteristics predominate. These funds tend to invest across the spectrum of U.S. industries, and owing to their broad exposure, the funds' returns are often similar to those of the S&P 500® Index. Results are based on average total returns of similar funds with all dividends and capital gain distributions reinvested. |
Key Portfolio Statistics
| Portfolio's net assets | $336,512,063 |
| Total number of portfolio holdings | 109 |
| Portfolio turnover rate | 9% |
Graphical Representation of Holdings
The tables below show the investment makeup of the Portfolio; percentages indicated are based on the Portfolio's net assets.
Top Ten Holdings and/or Issuers*
| NVIDIA Corp. | 8.0% |
| Alphabet, Inc., Class A | 6.5% |
| Microsoft Corp. | 5.5% |
| Apple, Inc. | 4.9% |
| Amazon.com, Inc. | 3.4% |
| Broadcom, Inc. | 3.3% |
| Micron Technology, Inc. | 2.1% |
| Applied Materials, Inc. | 1.8% |
| Eli Lilly & Co. | 1.6% |
| NextEra Energy, Inc. | 1.6% |
| * Excluding short-term investments |
Top Industries
| Semiconductors & Semiconductor Equipment | 20.0% |
| Software | 9.0% |
| Interactive Media & Services | 8.0% |
| Technology Hardware, Storage & Peripherals | 5.7% |
| Banks | 4.3% |
| Broadline Retail | 3.4% |
| Capital Markets | 3.3% |
| Machinery | 3.1% |
| Specialty Retail | 2.7% |
| Financial Services | 2.4% |
| Other | 38.1% |
Top Ten Holdings and/or Issuers*
| NVIDIA Corp. | 8.0% |
| Alphabet, Inc., Class A | 6.5% |
| Microsoft Corp. | 5.5% |
| Apple, Inc. | 4.9% |
| Amazon.com, Inc. | 3.4% |
| Broadcom, Inc. | 3.3% |
| Micron Technology, Inc. | 2.1% |
| Applied Materials, Inc. | 1.8% |
| Eli Lilly & Co. | 1.6% |
| NextEra Energy, Inc. | 1.6% |
| * Excluding short-term investments |
What were the Portfolio costs for the last six months?1
(Based on a hypothetical $10,000 investment)
| Share Class Name | Costs of a $10,000 investment | Costs paid as a percentage of a $10,000 investment2,3 |
| Service Class | $61 | 1.23% |
| 1. | Does not include any separate account or policy fees or charges imposed under the variable annuity policies and variable universal life insurance policies for which the Portfolio is an investment option. If they were included, your costs would be higher. |
| 2. | Reflects fee waivers and/or expense reimbursements, without which expenses would have been higher. |
| 3. | Annualized. |
Portfolio Performance
The following graph compares the initial and subsequent account values at the end of each of the most recently completed 10 semiannual reporting periods of the Portfolio (or for the life of the Portfolio, if shorter). It assumes a $10,000 initial investment at the beginning of the first fiscal period in an appropriate, broad-based securities market index and other indexes, if applicable, for the same period.
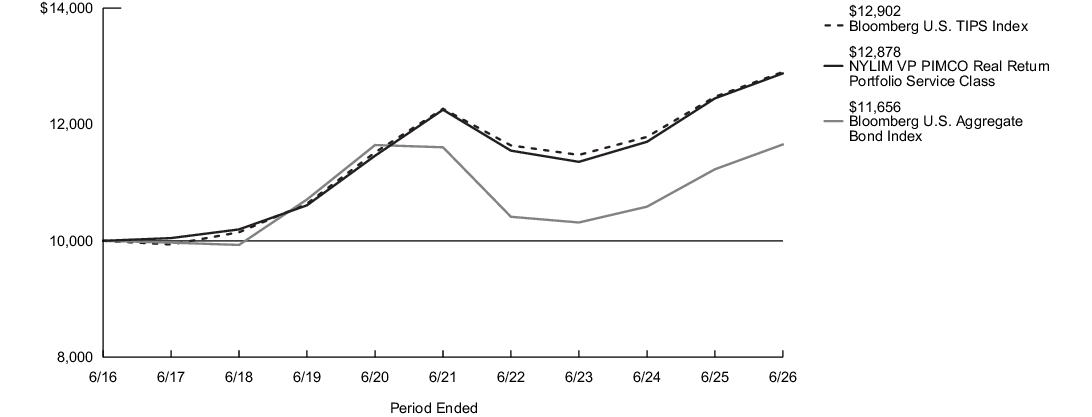
| Average Annual Total Returns for the Period Ended June 30, 2026 | Inception Date |
Six Months1 |
One Year |
Five Years |
Ten Years |
| Service Class Shares | 2/17/2012 | 0.99% | 3.45% | 1.00% | 2.56% |
| Bloomberg U.S. Aggregate Bond Index2 | 0.62% | 3.79% | 0.08% | 1.54% | |
| Bloomberg U.S. TIPS Index3 | 1.15% | 3.42% | 1.01% | 2.58% | |
| Morningstar Inflation-Protected Bond Category Average4 | 0.98% | 3.03% | 0.27% | 2.17% |
| 1. |
Not annualized. |
| 2. |
The Portfolio has selected the Bloomberg U.S. Aggregate Bond Index to represent a broad measure of market performance. The Bloomberg U.S. Aggregate Bond Index is a broad-based benchmark that measures the performance of the investment grade, U.S. dollar-denominated, fixed-rate taxable bond market, including Treasuries, government-related and corporate securities, mortgage-backed securities (agency fixed-rate and hybrid adjustable-rate mortgage pass-throughs), asset-backed securities and commercial mortgage-backed securities. |
| 3. |
The Bloomberg U.S. TIPS Index, which is generally representative of the market sectors or types of investments in which the Portfolio invests, includes all publicly issued, U.S. Treasury inflation-protected securities that have at least one year remaining to maturity and are rated investment grade. |
| 4. |
The Morningstar Inflation-Protected Bond Category Average is representative of funds that invest primarily in debt securities that adjust their principal values in line with the rate of inflation. These bonds can be issued by any organization, but the U.S. Treasury is currently the largest issuer for these types of securities. Results are based on average total returns of similar funds with all dividends and capital gain distributions reinvested. |
Key Portfolio Statistics
| Portfolio's net assets | $396,640,254 |
| Total number of portfolio holdings | 459 |
| Portfolio turnover rate | 71% |
Graphical Representation of Holdings
The tables below show the investment makeup of the Portfolio; percentages indicated are based on the Portfolio's net assets.
Top Ten Holdings and/or Issuers*
| U.S. Treasury Inflation Linked Notes, 0.125%-2.375%, due 4/15/27-1/15/36 | 75.7% |
| U.S. Treasury Inflation Linked Bonds, 0.125%-3.375%, due 1/15/28-2/15/55 | 21.4% |
| UMBS, Single Family, 30 Year, 4.00%-6.00%, due 7/25/56-8/25/56 | 10.4% |
| GNMA, 4.389%-4.926%, due 9/20/55-10/20/75 | 3.3% |
| GNMA II, Single Family, 30 Year, 3.50%, due 3/20/52-3/20/56 | 3.0% |
| Italy Buoni Poliennali del Tesoro, 0.10%-1.80%, due 5/15/30-5/15/36 | 2.4% |
| FHLMC, 4.107%-5.128%, due 7/15/44-8/15/57 | 2.3% |
| Japan Government CPI Linked Bond, 0.005%-0.10%, due 3/10/28-3/10/35 | 2.3% |
| United Kingdom Gilt, 4.00%, due 10/22/31 | 2.0% |
| FNMA, 4.658%-6.207%, due 11/1/34-6/25/55 | 0.8% |
| * Excluding short-term investments |
Portfolio Composition
| U.S. Government & Federal Agencies | 111.2% |
| Foreign Government Bonds | 8.7% |
| Mortgage-Backed Securities | 7.5% |
| Asset-Backed Securities | 5.5% |
| Corporate Bonds | 1.4% |
| Short-Term Investment | 0.6% |
| Short-Term Investments Sold Short | (18.8)% |
| Other Assets, Less Liabilities | (16.1)% |
Top Ten Holdings and/or Issuers*
| U.S. Treasury Inflation Linked Notes, 0.125%-2.375%, due 4/15/27-1/15/36 | 75.7% |
| U.S. Treasury Inflation Linked Bonds, 0.125%-3.375%, due 1/15/28-2/15/55 | 21.4% |
| UMBS, Single Family, 30 Year, 4.00%-6.00%, due 7/25/56-8/25/56 | 10.4% |
| GNMA, 4.389%-4.926%, due 9/20/55-10/20/75 | 3.3% |
| GNMA II, Single Family, 30 Year, 3.50%, due 3/20/52-3/20/56 | 3.0% |
| Italy Buoni Poliennali del Tesoro, 0.10%-1.80%, due 5/15/30-5/15/36 | 2.4% |
| FHLMC, 4.107%-5.128%, due 7/15/44-8/15/57 | 2.3% |
| Japan Government CPI Linked Bond, 0.005%-0.10%, due 3/10/28-3/10/35 | 2.3% |
| United Kingdom Gilt, 4.00%, due 10/22/31 | 2.0% |
| FNMA, 4.658%-6.207%, due 11/1/34-6/25/55 | 0.8% |
| * Excluding short-term investments |
What were the Portfolio costs for the last six months?1
(Based on a hypothetical $10,000 investment)
| Share Class Name | Costs of a $10,000 investment | Costs paid as a percentage of a $10,000 investment2,3 |
| Initial Class | $49 | 0.98% |
| 1. | Does not include any separate account or policy fees or charges imposed under the variable annuity policies and variable universal life insurance policies for which the Portfolio is an investment option. If they were included, your costs would be higher. |
| 2. | Reflects fee waivers and/or expense reimbursements, without which expenses would have been higher. |
| 3. | Annualized. |
Portfolio Performance
The following graph compares the initial and subsequent account values at the end of each of the most recently completed 10 semiannual reporting periods of the Portfolio (or for the life of the Portfolio, if shorter). It assumes a $10,000 initial investment at the beginning of the first fiscal period in an appropriate, broad-based securities market index and other indexes, if applicable, for the same period.
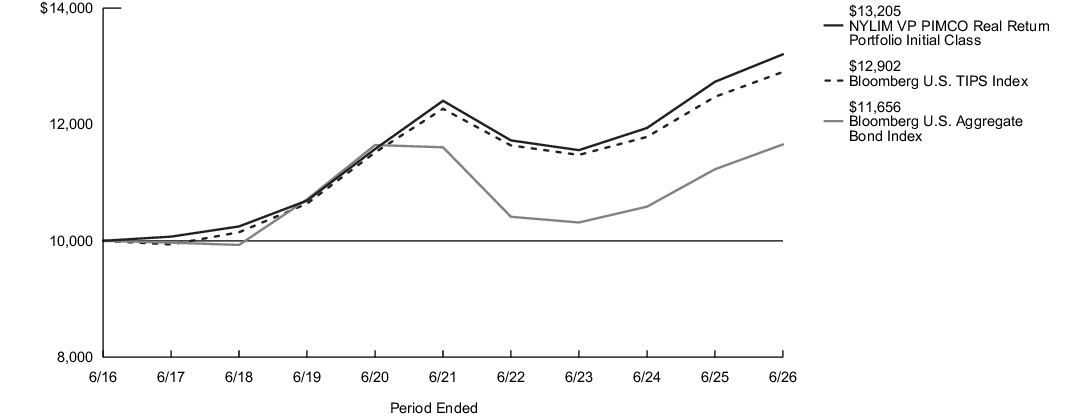
| Average Annual Total Returns for the Period Ended June 30, 2026 | Inception Date |
Six Months1 |
One Year |
Five Years |
Ten Years |
| Initial Class Shares | 2/17/2012 | 1.11% | 3.71% | 1.26% | 2.82% |
| Bloomberg U.S. Aggregate Bond Index2 | 0.62% | 3.79% | 0.08% | 1.54% | |
| Bloomberg U.S. TIPS Index3 | 1.15% | 3.42% | 1.01% | 2.58% | |
| Morningstar Inflation-Protected Bond Category Average4 | 0.98% | 3.03% | 0.27% | 2.17% |
| 1. |
Not annualized. |
| 2. |
The Portfolio has selected the Bloomberg U.S. Aggregate Bond Index to represent a broad measure of market performance. The Bloomberg U.S. Aggregate Bond Index is a broad-based benchmark that measures the performance of the investment grade, U.S. dollar-denominated, fixed-rate taxable bond market, including Treasuries, government-related and corporate securities, mortgage-backed securities (agency fixed-rate and hybrid adjustable-rate mortgage pass-throughs), asset-backed securities and commercial mortgage-backed securities. |
| 3. |
The Bloomberg U.S. TIPS Index, which is generally representative of the market sectors or types of investments in which the Portfolio invests, includes all publicly issued, U.S. Treasury inflation-protected securities that have at least one year remaining to maturity and are rated investment grade. |
| 4. |
The Morningstar Inflation-Protected Bond Category Average is representative of funds that invest primarily in debt securities that adjust their principal values in line with the rate of inflation. These bonds can be issued by any organization, but the U.S. Treasury is currently the largest issuer for these types of securities. Results are based on average total returns of similar funds with all dividends and capital gain distributions reinvested. |
Key Portfolio Statistics
| Portfolio's net assets | $396,640,254 |
| Total number of portfolio holdings | 459 |
| Portfolio turnover rate | 71% |
Graphical Representation of Holdings
The tables below show the investment makeup of the Portfolio; percentages indicated are based on the Portfolio's net assets.
Top Ten Holdings and/or Issuers*
| U.S. Treasury Inflation Linked Notes, 0.125%-2.375%, due 4/15/27-1/15/36 | 75.7% |
| U.S. Treasury Inflation Linked Bonds, 0.125%-3.375%, due 1/15/28-2/15/55 | 21.4% |
| UMBS, Single Family, 30 Year, 4.00%-6.00%, due 7/25/56-8/25/56 | 10.4% |
| GNMA, 4.389%-4.926%, due 9/20/55-10/20/75 | 3.3% |
| GNMA II, Single Family, 30 Year, 3.50%, due 3/20/52-3/20/56 | 3.0% |
| Italy Buoni Poliennali del Tesoro, 0.10%-1.80%, due 5/15/30-5/15/36 | 2.4% |
| FHLMC, 4.107%-5.128%, due 7/15/44-8/15/57 | 2.3% |
| Japan Government CPI Linked Bond, 0.005%-0.10%, due 3/10/28-3/10/35 | 2.3% |
| United Kingdom Gilt, 4.00%, due 10/22/31 | 2.0% |
| FNMA, 4.658%-6.207%, due 11/1/34-6/25/55 | 0.8% |
| * Excluding short-term investments |
Portfolio Composition
| U.S. Government & Federal Agencies | 111.2% |
| Foreign Government Bonds | 8.7% |
| Mortgage-Backed Securities | 7.5% |
| Asset-Backed Securities | 5.5% |
| Corporate Bonds | 1.4% |
| Short-Term Investment | 0.6% |
| Short-Term Investments Sold Short | (18.8)% |
| Other Assets, Less Liabilities | (16.1)% |
Top Ten Holdings and/or Issuers*
| U.S. Treasury Inflation Linked Notes, 0.125%-2.375%, due 4/15/27-1/15/36 | 75.7% |
| U.S. Treasury Inflation Linked Bonds, 0.125%-3.375%, due 1/15/28-2/15/55 | 21.4% |
| UMBS, Single Family, 30 Year, 4.00%-6.00%, due 7/25/56-8/25/56 | 10.4% |
| GNMA, 4.389%-4.926%, due 9/20/55-10/20/75 | 3.3% |
| GNMA II, Single Family, 30 Year, 3.50%, due 3/20/52-3/20/56 | 3.0% |
| Italy Buoni Poliennali del Tesoro, 0.10%-1.80%, due 5/15/30-5/15/36 | 2.4% |
| FHLMC, 4.107%-5.128%, due 7/15/44-8/15/57 | 2.3% |
| Japan Government CPI Linked Bond, 0.005%-0.10%, due 3/10/28-3/10/35 | 2.3% |
| United Kingdom Gilt, 4.00%, due 10/22/31 | 2.0% |
| FNMA, 4.658%-6.207%, due 11/1/34-6/25/55 | 0.8% |
| * Excluding short-term investments |
What were the Portfolio costs for the last six months?1
(Based on a hypothetical $10,000 investment)
| Share Class Name | Costs of a $10,000 investment | Costs paid as a percentage of a $10,000 investment2,3 |
| Initial Class | $50 | 0.95% |
| 1. | Does not include any separate account or policy fees or charges imposed under the variable annuity policies and variable universal life insurance policies for which the Portfolio is an investment option. If they were included, your costs would be higher. |
| 2. | Reflects fee waivers and/or expense reimbursements, without which expenses would have been higher. |
| 3. | Annualized. |
Portfolio Performance
The following graph compares the initial and subsequent account values at the end of each of the most recently completed 10 semiannual reporting periods of the Portfolio (or for the life of the Portfolio, if shorter). It assumes a $10,000 initial investment at the beginning of the first fiscal period in an appropriate, broad-based securities market index and other indexes, if applicable, for the same period. Effective February 28, 2020, the Portfolio replaced its subadvisor and modified its principal investment strategies. The past performance in the graph and table prior to that date reflects the Portfolio’s prior subadvisor and principal investment strategies.
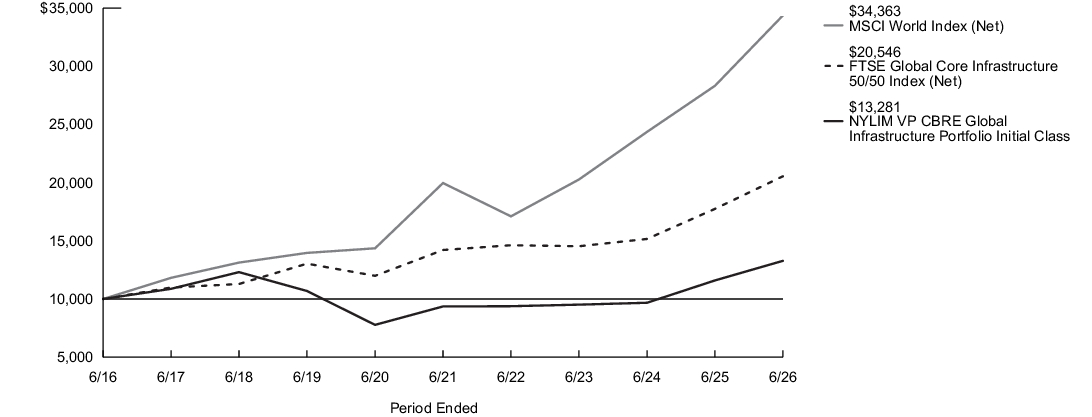
| Average Annual Total Returns for the Period Ended June 30, 2026 | Inception Date |
Six Months1 |
One Year |
Five Years |
Ten Years |
| Initial Class Shares | 5/1/2015 | 9.51% | 14.52% | 7.25% | 2.88% |
| MSCI World Index (Net)2 | 9.69% | 21.34% | 11.47% | 13.14% | |
| FTSE Global Core Infrastructure 50/50 Index (Net)3 | 10.66% | 15.78% | 7.65% | 7.47% | |
| Morningstar Infrastructure Category Average4 | 14.08% | 19.14% | 9.12% | 8.38% |
| 1. |
Not annualized. |
| 2. |
The Portfolio has selected the MSCI World Index (Net) to represent a broad measure of market performance. The MSCI World Index (Net) is a free float-adjusted market capitalization weighted index that is designed to measure the equity market performance of developed markets. |
| 3. |
The FTSE Global Core Infrastructure 50/50 Index (Net), which is generally representative of the market sectors or types of investments in which the Portfolio invests, is a market-capitalization-weighted index of worldwide infrastructure and infrastructure-related securities. Constituent weights are adjusted semi-annually according to three broad industry sectors: 50% utilities, 30% transportation, and a 20% mix of other sectors. |
| 4. |
The Morningstar Infrastructure Category Average is representative of funds that invest more than 60% of their assets in stocks of companies engaged in infrastructure activities. Industries considered to be part of the infrastructure sector include: oil & gas midstream; waste management; airports; integrated shipping; railroads; shipping & ports; trucking; engineering & construction; infrastructure operations; and the utilities sector. Results are based on average total returns of similar funds with all dividends and capital gain distributions reinvested. |
Key Portfolio Statistics
| Portfolio's net assets | $48,315,726 |
| Total number of portfolio holdings | 47 |
| Portfolio turnover rate | 45% |
Graphical Representation of Holdings
The tables below show the investment makeup of the Portfolio; percentages indicated are based on the Portfolio's net assets.
Top Ten Holdings and/or Issuers*
| American Electric Power Co., Inc. | 5.0% |
| Canadian National Railway Co. | 4.8% |
| Xcel Energy, Inc. | 4.5% |
| Ferrovial NV | 4.4% |
| Enbridge, Inc. | 4.3% |
| SSE plc | 4.2% |
| Atmos Energy Corp. | 4.1% |
| PPL Corp. | 4.0% |
| American Tower Corp. | 3.9% |
| Vinci SA | 3.7% |
| * Excluding short-term investments |
Top Countries
| United States | 56.8% |
| Canada | 11.3% |
| Spain | 7.0% |
| United Kingdom | 6.9% |
| Germany | 4.6% |
| Mexico | 4.2% |
| France | 3.7% |
| Japan | 2.6% |
| New Zealand | 1.7% |
| Italy | 1.2% |
| Other | (0.0)%‡ |
| ‡ Less than one-tenth of a percent. |
Top Ten Holdings and/or Issuers*
| American Electric Power Co., Inc. | 5.0% |
| Canadian National Railway Co. | 4.8% |
| Xcel Energy, Inc. | 4.5% |
| Ferrovial NV | 4.4% |
| Enbridge, Inc. | 4.3% |
| SSE plc | 4.2% |
| Atmos Energy Corp. | 4.1% |
| PPL Corp. | 4.0% |
| American Tower Corp. | 3.9% |
| Vinci SA | 3.7% |
| * Excluding short-term investments |
What were the Portfolio costs for the last six months?1
(Based on a hypothetical $10,000 investment)
| Share Class Name | Costs of a $10,000 investment | Costs paid as a percentage of a $10,000 investment2,3 |
| Service Class | $62 | 1.20% |
| 1. | Does not include any separate account or policy fees or charges imposed under the variable annuity policies and variable universal life insurance policies for which the Portfolio is an investment option. If they were included, your costs would be higher. |
| 2. | Reflects fee waivers and/or expense reimbursements, without which expenses would have been higher. |
| 3. | Annualized. |
Portfolio Performance
The following graph compares the initial and subsequent account values at the end of each of the most recently completed 10 semiannual reporting periods of the Portfolio (or for the life of the Portfolio, if shorter). It assumes a $10,000 initial investment at the beginning of the first fiscal period in an appropriate, broad-based securities market index and other indexes, if applicable, for the same period. Effective February 28, 2020, the Portfolio replaced its subadvisor and modified its principal investment strategies. The past performance in the graph and table prior to that date reflects the Portfolio’s prior subadvisor and principal investment strategies.
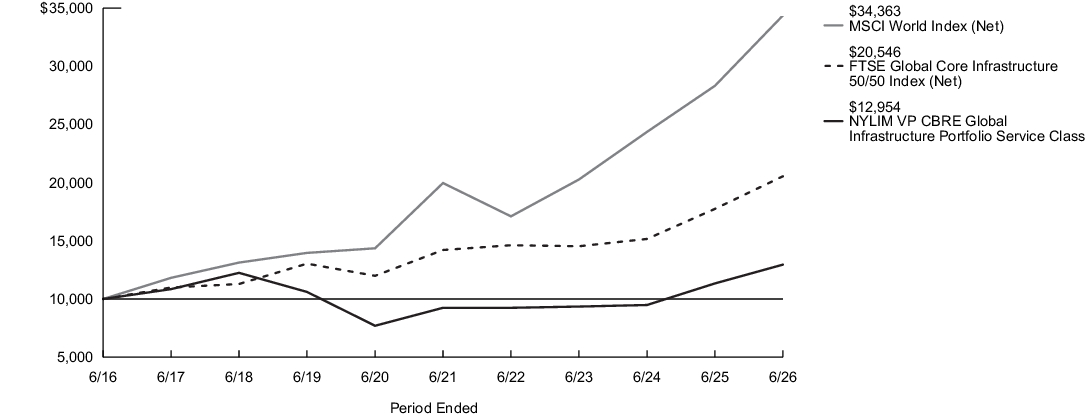
| Average Annual Total Returns for the Period Ended June 30, 2026 | Inception Date |
Six Months1 |
One Year |
Five Years |
Ten Years |
| Service Class Shares | 5/1/2015 | 9.38% | 14.23% | 6.98% | 2.62% |
| MSCI World Index (Net)2 | 9.69% | 21.34% | 11.47% | 13.14% | |
| FTSE Global Core Infrastructure 50/50 Index (Net)3 | 10.66% | 15.78% | 7.65% | 7.47% | |
| Morningstar Infrastructure Category Average4 | 14.08% | 19.14% | 9.12% | 8.38% |
| 1. |
Not annualized. |
| 2. |
The Portfolio has selected the MSCI World Index (Net) to represent a broad measure of market performance. The MSCI World Index (Net) is a free float-adjusted market capitalization weighted index that is designed to measure the equity market performance of developed markets. |
| 3. |
The FTSE Global Core Infrastructure 50/50 Index (Net), which is generally representative of the market sectors or types of investments in which the Portfolio invests, is a market-capitalization-weighted index of worldwide infrastructure and infrastructure-related securities. Constituent weights are adjusted semi-annually according to three broad industry sectors: 50% utilities, 30% transportation, and a 20% mix of other sectors. |
| 4. |
The Morningstar Infrastructure Category Average is representative of funds that invest more than 60% of their assets in stocks of companies engaged in infrastructure activities. Industries considered to be part of the infrastructure sector include: oil & gas midstream; waste management; airports; integrated shipping; railroads; shipping & ports; trucking; engineering & construction; infrastructure operations; and the utilities sector. Results are based on average total returns of similar funds with all dividends and capital gain distributions reinvested. |
Key Portfolio Statistics
| Portfolio's net assets | $48,315,726 |
| Total number of portfolio holdings | 47 |
| Portfolio turnover rate | 45% |
Graphical Representation of Holdings
The tables below show the investment makeup of the Portfolio; percentages indicated are based on the Portfolio's net assets.
Top Ten Holdings and/or Issuers*
| American Electric Power Co., Inc. | 5.0% |
| Canadian National Railway Co. | 4.8% |
| Xcel Energy, Inc. | 4.5% |
| Ferrovial NV | 4.4% |
| Enbridge, Inc. | 4.3% |
| SSE plc | 4.2% |
| Atmos Energy Corp. | 4.1% |
| PPL Corp. | 4.0% |
| American Tower Corp. | 3.9% |
| Vinci SA | 3.7% |
| * Excluding short-term investments |
Top Countries
| United States | 56.8% |
| Canada | 11.3% |
| Spain | 7.0% |
| United Kingdom | 6.9% |
| Germany | 4.6% |
| Mexico | 4.2% |
| France | 3.7% |
| Japan | 2.6% |
| New Zealand | 1.7% |
| Italy | 1.2% |
| Other | (0.0)%‡ |
| ‡ Less than one-tenth of a percent. |
Top Ten Holdings and/or Issuers*
| American Electric Power Co., Inc. | 5.0% |
| Canadian National Railway Co. | 4.8% |
| Xcel Energy, Inc. | 4.5% |
| Ferrovial NV | 4.4% |
| Enbridge, Inc. | 4.3% |
| SSE plc | 4.2% |
| Atmos Energy Corp. | 4.1% |
| PPL Corp. | 4.0% |
| American Tower Corp. | 3.9% |
| Vinci SA | 3.7% |
| * Excluding short-term investments |
What were the Portfolio costs for the last six months?1
(Based on a hypothetical $10,000 investment)
| Share Class Name | Costs of a $10,000 investment | Costs paid as a percentage of a $10,000 investment2,3 |
| Service Class | $56 | 0.99% |
| 1. | Does not include any separate account or policy fees or charges imposed under the variable annuity policies and variable universal life insurance policies for which the Portfolio is an investment option. If they were included, your costs would be higher. |
| 2. | Reflects fee waivers and/or expense reimbursements, without which expenses would have been higher. |
| 3. | Annualized. |
Portfolio Performance
The following graph compares the initial and subsequent account values at the end of each of the most recently completed 10 semiannual reporting periods of the Portfolio (or for the life of the Portfolio, if shorter). It assumes a $10,000 initial investment at the beginning of the first fiscal period in an appropriate, broad-based securities market index and other indexes, if applicable, for the same period. The Portfolio's subadvisor changed effective January 1, 2018, due to an organizational restructuring whereby all investment personnel of Cornerstone Capital Management Holdings LLC, the former subadvisor, transitioned to MacKay Shields LLC. Effective May 1, 2021, the Portfolio replaced its subadvisor, MacKay Shields LLC, and modified its principal investment strategies. The past performance in the graph and table prior to those dates reflect the Portfolio's subadvisors and principal investment strategies.
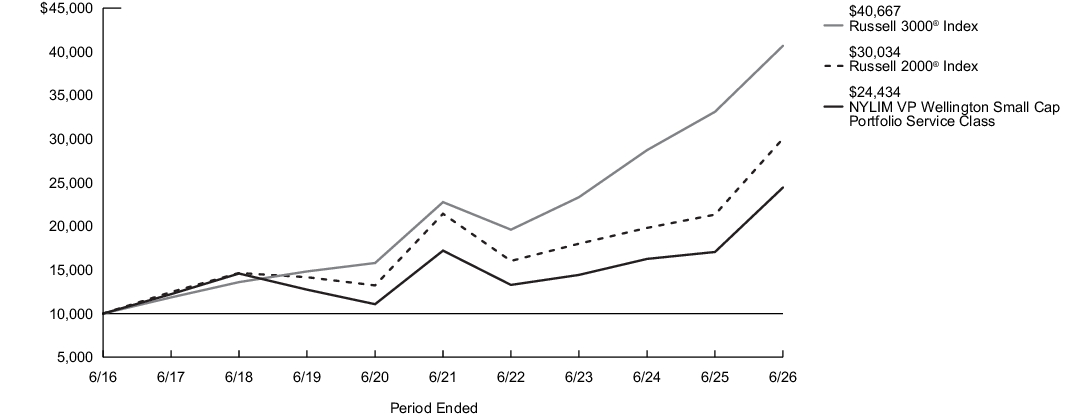
| Average Annual Total Returns for the Period Ended June 30, 2026 | Inception Date |
Six Months1 |
One Year |
Five Years |
Ten Years |
| Service Class Shares | 5/2/2016 | 25.80% | 43.26% | 7.26% | 9.34% |
| Russell 3000®Index2 | 10.86% | 22.81% | 12.30% | 15.06% | |
| Russell 2000®Index3 | 22.57% | 40.78% | 6.98% | 11.62% | |
| Morningstar Small Blend Category Average4 | 21.59% | 33.88% | 8.03% | 11.34% |
| 1. |
Not annualized. |
| 2. |
The Portfolio has selected the Russell 3000® Index to represent a broad measure of market performance. The Russell 3000® Index measures the performance of the largest 3,000 U.S. companies representing approximately 98% of the investable U.S. equity market. |
| 3. |
The Russell 2000® Index, which is generally representative of the market sectors or types of investments in which the Portfolio invests, measures the performance of the small-cap segment of the U.S. equity universe. It is a subset of the Russell 3000® Index and includes approximately 2,000 of the smallest securities based on a combination of their market cap and current index membership. |
| 4. |
The Morningstar Small Blend Category Average is representative of funds that favor U.S. firms at the smaller end of the market-capitalization range. Some aim to own an array of value and growth stocks while others employ a discipline that leads to holdings with valuations and growth rates close to the small-cap averages. Stocks in the bottom 10% of the capitalization of the U.S. equity market are defined as small cap. The blend style is assigned to funds where neither growth nor value characteristics predominate. Results are based on average total returns of similar funds with all dividends and capital gain distributions reinvested. |
Key Portfolio Statistics
| Portfolio's net assets | $429,272,438 |
| Total number of portfolio holdings | 274 |
| Portfolio turnover rate | 37% |
Graphical Representation of Holdings
The tables below show the investment makeup of the Portfolio; percentages indicated are based on the Portfolio's net assets.
Top Ten Holdings and/or Issuers*
| Xometry, Inc., Class A | 2.3% |
| MKS, Inc. | 1.4% |
| iShares Russell 2000 ETF | 1.4% |
| DigitalOcean Holdings, Inc. | 1.3% |
| Nextpower, Inc., Class A | 1.3% |
| TTM Technologies, Inc. | 1.3% |
| Kaiser Aluminum Corp. | 1.2% |
| Champion Homes, Inc. | 1.1% |
| Life Time Group Holdings, Inc. | 1.1% |
| Lundin Mining Corp. | 1.0% |
| * Excluding short-term investments |
Top Industries
| Banks | 9.1% |
| Biotechnology | 8.4% |
| Semiconductors & Semiconductor Equipment | 5.4% |
| Software | 5.1% |
| Trading Companies & Distributors | 4.5% |
| Electronic Equipment, Instruments & Components | 3.7% |
| Metals & Mining | 3.0% |
| Financial Services | 2.9% |
| Hotels, Restaurants & Leisure | 2.8% |
| Consumer Finance | 2.6% |
| Other | 52.5% |
Top Ten Holdings and/or Issuers*
| Xometry, Inc., Class A | 2.3% |
| MKS, Inc. | 1.4% |
| iShares Russell 2000 ETF | 1.4% |
| DigitalOcean Holdings, Inc. | 1.3% |
| Nextpower, Inc., Class A | 1.3% |
| TTM Technologies, Inc. | 1.3% |
| Kaiser Aluminum Corp. | 1.2% |
| Champion Homes, Inc. | 1.1% |
| Life Time Group Holdings, Inc. | 1.1% |
| Lundin Mining Corp. | 1.0% |
| * Excluding short-term investments |
What were the Portfolio costs for the last six months?1
(Based on a hypothetical $10,000 investment)
| Share Class Name | Costs of a $10,000 investment | Costs paid as a percentage of a $10,000 investment2,3 |
| Initial Class | $42 | 0.74% |
| 1. | Does not include any separate account or policy fees or charges imposed under the variable annuity policies and variable universal life insurance policies for which the Portfolio is an investment option. If they were included, your costs would be higher. |
| 2. | Reflects fee waivers and/or expense reimbursements, without which expenses would have been higher. |
| 3. | Annualized. |
Portfolio Performance
The following graph compares the initial and subsequent account values at the end of each of the most recently completed 10 semiannual reporting periods of the Portfolio (or for the life of the Portfolio, if shorter). It assumes a $10,000 initial investment at the beginning of the first fiscal period in an appropriate, broad-based securities market index and other indexes, if applicable, for the same period. The Portfolio's subadvisor changed effective January 1, 2018, due to an organizational restructuring whereby all investment personnel of Cornerstone Capital Management Holdings LLC, the former subadvisor, transitioned to MacKay Shields LLC. Effective May 1, 2021, the Portfolio replaced its subadvisor, MacKay Shields LLC, and modified its principal investment strategies. The past performance in the graph and table prior to those dates reflect the Portfolio's subadvisors and principal investment strategies.
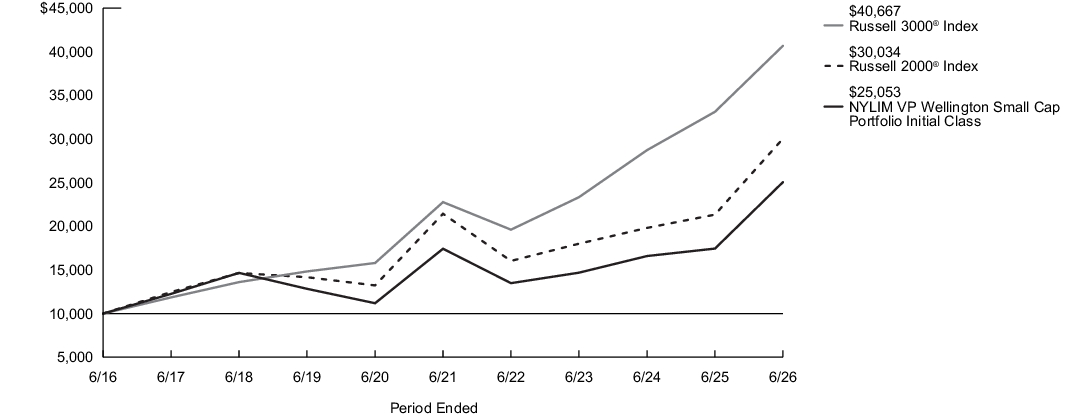
| Average Annual Total Returns for the Period Ended June 30, 2026 | Inception Date |
Six Months1 |
One Year |
Five Years |
Ten Years |
| Initial Class Shares | 5/2/2016 | 25.95% | 43.62% | 7.53% | 9.62% |
| Russell 3000®Index2 | 10.86% | 22.81% | 12.30% | 15.06% | |
| Russell 2000®Index3 | 22.57% | 40.78% | 6.98% | 11.62% | |
| Morningstar Small Blend Category Average4 | 21.59% | 33.88% | 8.03% | 11.34% |
| 1. |
Not annualized. |
| 2. |
The Portfolio has selected the Russell 3000® Index to represent a broad measure of market performance. The Russell 3000® Index measures the performance of the largest 3,000 U.S. companies representing approximately 98% of the investable U.S. equity market. |
| 3. |
The Russell 2000® Index, which is generally representative of the market sectors or types of investments in which the Portfolio invests, measures the performance of the small-cap segment of the U.S. equity universe. It is a subset of the Russell 3000® Index and includes approximately 2,000 of the smallest securities based on a combination of their market cap and current index membership. |
| 4. |
The Morningstar Small Blend Category Average is representative of funds that favor U.S. firms at the smaller end of the market-capitalization range. Some aim to own an array of value and growth stocks while others employ a discipline that leads to holdings with valuations and growth rates close to the small-cap averages. Stocks in the bottom 10% of the capitalization of the U.S. equity market are defined as small cap. The blend style is assigned to funds where neither growth nor value characteristics predominate. Results are based on average total returns of similar funds with all dividends and capital gain distributions reinvested. |
Key Portfolio Statistics
| Portfolio's net assets | $429,272,438 |
| Total number of portfolio holdings | 274 |
| Portfolio turnover rate | 37% |
Graphical Representation of Holdings
The tables below show the investment makeup of the Portfolio; percentages indicated are based on the Portfolio's net assets.
Top Ten Holdings and/or Issuers*
| Xometry, Inc., Class A | 2.3% |
| MKS, Inc. | 1.4% |
| iShares Russell 2000 ETF | 1.4% |
| DigitalOcean Holdings, Inc. | 1.3% |
| Nextpower, Inc., Class A | 1.3% |
| TTM Technologies, Inc. | 1.3% |
| Kaiser Aluminum Corp. | 1.2% |
| Champion Homes, Inc. | 1.1% |
| Life Time Group Holdings, Inc. | 1.1% |
| Lundin Mining Corp. | 1.0% |
| * Excluding short-term investments |
Top Industries
| Banks | 9.1% |
| Biotechnology | 8.4% |
| Semiconductors & Semiconductor Equipment | 5.4% |
| Software | 5.1% |
| Trading Companies & Distributors | 4.5% |
| Electronic Equipment, Instruments & Components | 3.7% |
| Metals & Mining | 3.0% |
| Financial Services | 2.9% |
| Hotels, Restaurants & Leisure | 2.8% |
| Consumer Finance | 2.6% |
| Other | 52.5% |
Top Ten Holdings and/or Issuers*
| Xometry, Inc., Class A | 2.3% |
| MKS, Inc. | 1.4% |
| iShares Russell 2000 ETF | 1.4% |
| DigitalOcean Holdings, Inc. | 1.3% |
| Nextpower, Inc., Class A | 1.3% |
| TTM Technologies, Inc. | 1.3% |
| Kaiser Aluminum Corp. | 1.2% |
| Champion Homes, Inc. | 1.1% |
| Life Time Group Holdings, Inc. | 1.1% |
| Lundin Mining Corp. | 1.0% |
| * Excluding short-term investments |
What were the Portfolio costs for the last six months?1
(Based on a hypothetical $10,000 investment)
| Share Class Name | Costs of a $10,000 investment | Costs paid as a percentage of a $10,000 investment2,3 |
| Initial Class | $36 | 0.70% |
| 1. | Does not include any separate account or policy fees or charges imposed under the variable annuity policies and variable universal life insurance policies for which the Portfolio is an investment option. If they were included, your costs would be higher. |
| 2. | Reflects fee waivers and/or expense reimbursements, without which expenses would have been higher. |
| 3. | Annualized. |
Portfolio Performance
The following graph compares the initial and subsequent account values at the end of each of the most recently completed 10 semiannual reporting periods of the Portfolio (or for the life of the Portfolio, if shorter). It assumes a $10,000 initial investment at the beginning of the first fiscal period in an appropriate, broad-based securities market index and other indexes, if applicable, for the same period. The Portfolio commenced operations on September 10, 2018. Effective November 30, 2018, the Portfolio entered into a reorganization with MainStay VP Absolute Return Multi-Strategy Portfolio (the "Reorganization"). As part of the Reorganization, the Portfolio assumed the performance history of MainStay VP Absolute Return Multi-Strategy Portfolio. Therefore, performance information for periods prior to November 30, 2018, reflects the performance of MainStay VP Absolute Return Multi-Strategy Portfolio.
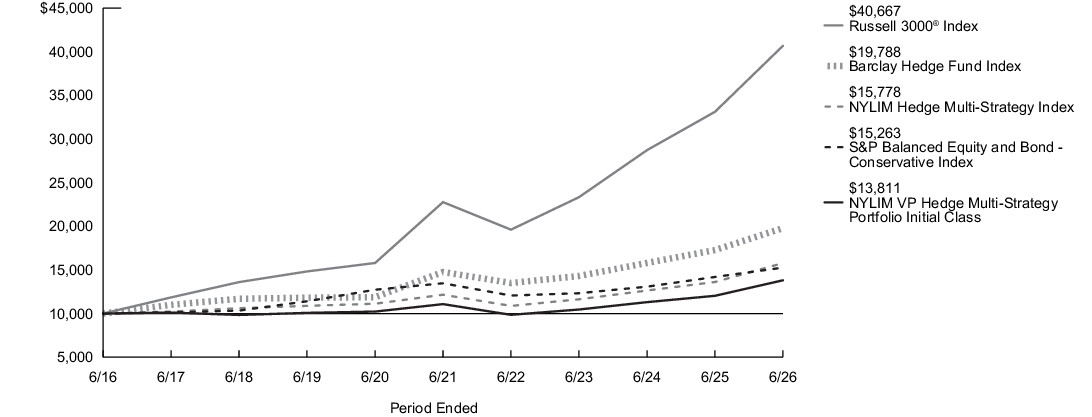
| Average Annual Total Returns for the Period Ended June 30, 2026 | Inception Date |
Six Months1 |
One Year |
Five Years |
Ten Years |
| Initial Class Shares | 5/1/2013 | 9.19% | 14.77% | 4.50% | 3.28% |
| Russell 3000®Index2 | 10.86% | 22.81% | 12.30% | 15.06% | |
| S&P Balanced Equity and Bond - Conservative Index3 | 2.56% | 7.54% | 2.53% | 4.32% | |
| Barclay Hedge Fund Index4 | 6.92% | 14.56% | 6.04% | 7.06% | |
| NYLIM Hedge Multi-Strategy Index5 | 9.71% | 15.86% | 5.35% | 4.67% | |
| Morningstar Multistrategy Category Average6 | 3.74% | 9.22% | 5.36% | 3.72% |
| 1. |
Not annualized. |
| 2. |
The Portfolio has selected the Russell 3000® Index to represent a broad measure of market performance. The Russell 3000® Index measures the performance of the largest 3,000 U.S. companies representing approximately 98% of the investable U.S. equity market. |
| 3. |
The S&P Balanced Equity and Bond - Conservative Index, which is generally representative of the market sectors or types of investments in which the Portfolio invests, consists of a position in S&P 500 Total Return Index (25%) and a position in the S&P U.S. Treasury Bond 7-10 Year Index (75%). |
| 4. |
The Barclay Hedge Fund Index, which is generally representative of the market sectors or types of investments in which the Portfolio invests, is a measure of the average return of all hedge funds (excepting Funds of Funds) in the Barclay database. The index is simply the arithmetic average of the net returns of all the funds that have reported that month. |
| 5. |
The NYLIM Hedge Multi-Strategy Index, which is generally representative of the market sectors or types of investments in which the Portfolio invests, seeks to replicate the risk-adjusted return characteristics of the collective hedge funds using various hedge fund investment styles, including long/short equity, global macro, market neutral, event-driven, fixed income arbitrage and emerging markets. |
| 6. |
The Morningstar Multistrategy Category Average is representative of funds that have a majority of their assets exposed to alternative strategies. Funds in this category include both funds with static allocations to alternative strategies and funds tactically allocating among alternative strategies and asset classes. Results are based on average total returns of similar funds with all dividends and capital gain distributions reinvested. |
Key Portfolio Statistics
| Portfolio's net assets | $196,549,192 |
| Total number of portfolio holdings | 117 |
| Portfolio turnover rate | 22% |
Graphical Representation of Holdings
The tables below show the investment makeup of the Portfolio; percentages indicated are based on the Portfolio's net assets.
Top Ten Holdings and/or Issuers*
| iShares Floating Rate Bond ETF | 16.6% |
| Vanguard FTSE Developed Markets ETF | 8.2% |
| Franklin Senior Loan ETF | 8.0% |
| Vanguard Short-Term Treasury ETF | 7.3% |
| iShares Core S&P Small-Cap ETF | 6.0% |
| iShares MSCI USA Momentum Factor ETF | 5.1% |
| SPDR Bloomberg Investment Grade Floating Rate ETF | 5.0% |
| iShares MSCI Emerging Markets ex China ETF | 4.8% |
| iShares Convertible Bond ETF | 3.8% |
| iShares National Muni Bond ETF | 3.7% |
| * Excluding short-term investments |
Portfolio Composition
| Floating Rate—Investment Grade Funds | 21.6% |
| International Equity Core Fund | 8.2% |
| Bank Loan Fund | 8.0% |
| Short Duration Fund | 7.3% |
| Municipal Bond Funds | 7.3% |
| Convertible Bond Funds | 7.1% |
| U.S. Small Cap Core Funds | 6.0% |
| Emerging Equity Funds | 5.7% |
| U.S. Momentum Fund | 5.1% |
| U.S. Large Cap Core Funds | 4.6% |
| Other | 19.1% |
Top Ten Holdings and/or Issuers*
| iShares Floating Rate Bond ETF | 16.6% |
| Vanguard FTSE Developed Markets ETF | 8.2% |
| Franklin Senior Loan ETF | 8.0% |
| Vanguard Short-Term Treasury ETF | 7.3% |
| iShares Core S&P Small-Cap ETF | 6.0% |
| iShares MSCI USA Momentum Factor ETF | 5.1% |
| SPDR Bloomberg Investment Grade Floating Rate ETF | 5.0% |
| iShares MSCI Emerging Markets ex China ETF | 4.8% |
| iShares Convertible Bond ETF | 3.8% |
| iShares National Muni Bond ETF | 3.7% |
| * Excluding short-term investments |
What were the Portfolio costs for the last six months?1
(Based on a hypothetical $10,000 investment)
| Share Class Name | Costs of a $10,000 investment | Costs paid as a percentage of a $10,000 investment2,3 |
| Service Class | $49 | 0.95% |
| 1. | Does not include any separate account or policy fees or charges imposed under the variable annuity policies and variable universal life insurance policies for which the Portfolio is an investment option. If they were included, your costs would be higher. |
| 2. | Reflects fee waivers and/or expense reimbursements, without which expenses would have been higher. |
| 3. | Annualized. |
Portfolio Performance
The following graph compares the initial and subsequent account values at the end of each of the most recently completed 10 semiannual reporting periods of the Portfolio (or for the life of the Portfolio, if shorter). It assumes a $10,000 initial investment at the beginning of the first fiscal period in an appropriate, broad-based securities market index and other indexes, if applicable, for the same period. The Portfolio commenced operations on September 10, 2018. Effective November 30, 2018, the Portfolio entered into a reorganization with MainStay VP Absolute Return Multi-Strategy Portfolio (the "Reorganization"). As part of the Reorganization, the Portfolio assumed the performance history of MainStay VP Absolute Return Multi-Strategy Portfolio. Therefore, performance information for periods prior to November 30, 2018, reflects the performance of MainStay VP Absolute Return Multi-Strategy Portfolio.
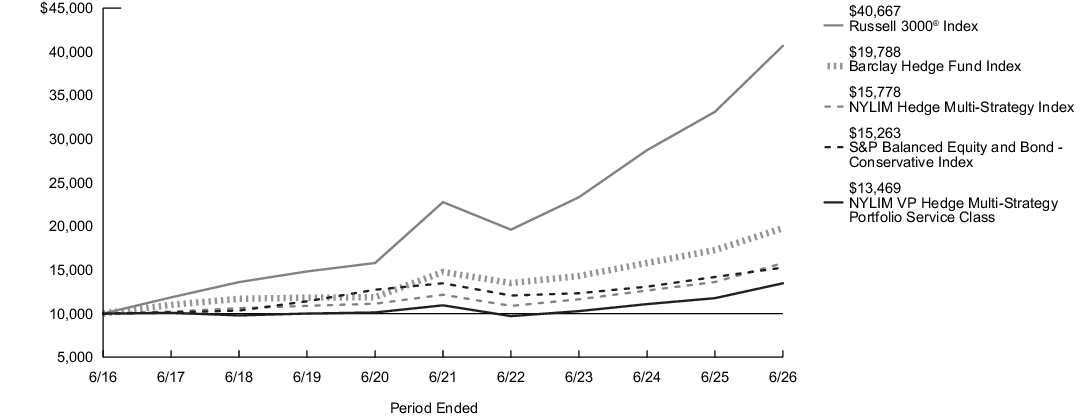
| Average Annual Total Returns for the Period Ended June 30, 2026 | Inception Date |
Six Months1 |
One Year |
Five Years |
Ten Years |
| Service Class Shares | 5/1/2013 | 9.05% | 14.48% | 4.24% | 3.02% |
| Russell 3000®Index2 | 10.86% | 22.81% | 12.30% | 15.06% | |
| S&P Balanced Equity and Bond - Conservative Index3 | 2.56% | 7.54% | 2.53% | 4.32% | |
| Barclay Hedge Fund Index4 | 6.92% | 14.56% | 6.04% | 7.06% | |
| NYLIM Hedge Multi-Strategy Index5 | 9.71% | 15.86% | 5.35% | 4.67% | |
| Morningstar Multistrategy Category Average6 | 3.74% | 9.22% | 5.36% | 3.72% |
| 1. |
Not annualized. |
| 2. |
The Portfolio has selected the Russell 3000® Index to represent a broad measure of market performance. The Russell 3000® Index measures the performance of the largest 3,000 U.S. companies representing approximately 98% of the investable U.S. equity market. |
| 3. |
The S&P Balanced Equity and Bond - Conservative Index, which is generally representative of the market sectors or types of investments in which the Portfolio invests, consists of a position in S&P 500 Total Return Index (25%) and a position in the S&P U.S. Treasury Bond 7-10 Year Index (75%). |
| 4. |
The Barclay Hedge Fund Index, which is generally representative of the market sectors or types of investments in which the Portfolio invests, is a measure of the average return of all hedge funds (excepting Funds of Funds) in the Barclay database. The index is simply the arithmetic average of the net returns of all the funds that have reported that month. |
| 5. |
The NYLIM Hedge Multi-Strategy Index, which is generally representative of the market sectors or types of investments in which the Portfolio invests, seeks to replicate the risk-adjusted return characteristics of the collective hedge funds using various hedge fund investment styles, including long/short equity, global macro, market neutral, event-driven, fixed income arbitrage and emerging markets. |
| 6. |
The Morningstar Multistrategy Category Average is representative of funds that have a majority of their assets exposed to alternative strategies. Funds in this category include both funds with static allocations to alternative strategies and funds tactically allocating among alternative strategies and asset classes. Results are based on average total returns of similar funds with all dividends and capital gain distributions reinvested. |
Key Portfolio Statistics
| Portfolio's net assets | $196,549,192 |
| Total number of portfolio holdings | 117 |
| Portfolio turnover rate | 22% |
Graphical Representation of Holdings
The tables below show the investment makeup of the Portfolio; percentages indicated are based on the Portfolio's net assets.
Top Ten Holdings and/or Issuers*
| iShares Floating Rate Bond ETF | 16.6% |
| Vanguard FTSE Developed Markets ETF | 8.2% |
| Franklin Senior Loan ETF | 8.0% |
| Vanguard Short-Term Treasury ETF | 7.3% |
| iShares Core S&P Small-Cap ETF | 6.0% |
| iShares MSCI USA Momentum Factor ETF | 5.1% |
| SPDR Bloomberg Investment Grade Floating Rate ETF | 5.0% |
| iShares MSCI Emerging Markets ex China ETF | 4.8% |
| iShares Convertible Bond ETF | 3.8% |
| iShares National Muni Bond ETF | 3.7% |
| * Excluding short-term investments |
Portfolio Composition
| Floating Rate—Investment Grade Funds | 21.6% |
| International Equity Core Fund | 8.2% |
| Bank Loan Fund | 8.0% |
| Short Duration Fund | 7.3% |
| Municipal Bond Funds | 7.3% |
| Convertible Bond Funds | 7.1% |
| U.S. Small Cap Core Funds | 6.0% |
| Emerging Equity Funds | 5.7% |
| U.S. Momentum Fund | 5.1% |
| U.S. Large Cap Core Funds | 4.6% |
| Other | 19.1% |
Top Ten Holdings and/or Issuers*
| iShares Floating Rate Bond ETF | 16.6% |
| Vanguard FTSE Developed Markets ETF | 8.2% |
| Franklin Senior Loan ETF | 8.0% |
| Vanguard Short-Term Treasury ETF | 7.3% |
| iShares Core S&P Small-Cap ETF | 6.0% |
| iShares MSCI USA Momentum Factor ETF | 5.1% |
| SPDR Bloomberg Investment Grade Floating Rate ETF | 5.0% |
| iShares MSCI Emerging Markets ex China ETF | 4.8% |
| iShares Convertible Bond ETF | 3.8% |
| iShares National Muni Bond ETF | 3.7% |
| * Excluding short-term investments |
What were the Portfolio costs for the last six months?1
(Based on a hypothetical $10,000 investment)
| Share Class Name | Costs of a $10,000 investment | Costs paid as a percentage of a $10,000 investment2 |
| Service Class | $51 | 0.99% |
| 1. | Does not include any separate account or policy fees or charges imposed under the variable annuity policies and variable universal life insurance policies for which the Portfolio is an investment option. If they were included, your costs would be higher. |
| 2. | Annualized. |
Portfolio Performance
The following graph compares the initial and subsequent account values at the end of each of the most recently completed 10 semiannual reporting periods of the Portfolio (or for the life of the Portfolio, if shorter). It assumes a $10,000 initial investment at the beginning of the first fiscal period in an appropriate, broad-based securities market index and other indexes, if applicable, for the same period.
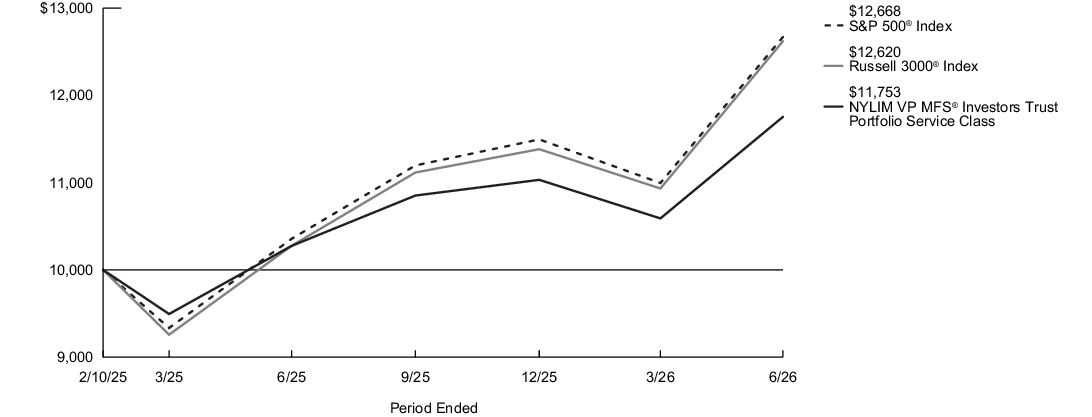
| Average Annual Total Returns for the Period Ended June 30, 2026 | Inception Date |
Six Months1 |
One Year |
Since Inception |
| Service Class Shares | 2/10/2025 | 6.53% | 14.38% | 12.25% |
| Russell 3000®Index2 | 10.86% | 22.81% | 18.14% | |
| S&P 500®Index3 | 10.21% | 22.33% | 18.46% | |
| Morningstar Large Blend Category Average4 | 9.74% | 20.23% | 15.92% |
| 1. |
Not annualized. |
| 2. |
The Portfolio has selected the Russell 3000® Index to represent a broad measure of market performance. The Russell 3000® Index measures the performance of the largest 3,000 U.S. companies representing approximately 98% of the investable U.S. equity market. |
| 3. |
The S&P 500® Index, which represents a broad measure of market performance, is generally representative of the market sectors or types of investments in which the Portfolio invests. S&P® and S&P 500® are registered trademarks of Standard & Poor’s Financial Services LLC. The S&P 500® Index is widely regarded as the standard index for measuring large-cap U.S. stock market performance. |
| 4. |
The Morningstar Large Blend Category Average is representative of funds that represent the overall U.S. stock market in size, growth rates and price. Stocks in the top 70% of the capitalization of the U.S. equity market are defined as large cap. The blend style is assigned to funds where neither growth nor value characteristics predominate. These funds tend to invest across the spectrum of U.S. industries, and owing to their broad exposure, the funds' returns are often similar to those of the S&P 500® Index. Results are based on average total returns of similar funds with all dividends and capital gain distributions reinvested. |
Key Portfolio Statistics
| Portfolio's net assets | $443,909,538 |
| Total number of portfolio holdings | 69 |
| Portfolio turnover rate | 18% |
Graphical Representation of Holdings
The tables below show the investment makeup of the Portfolio; percentages indicated are based on the Portfolio's net assets.
Top Ten Holdings and/or Issuers*
| NVIDIA Corp. | 7.8% |
| Apple, Inc. | 6.3% |
| Alphabet, Inc., Class A | 6.2% |
| Microsoft Corp. | 4.7% |
| Amazon.com, Inc. | 4.7% |
| Broadcom, Inc. | 3.6% |
| JPMorgan Chase & Co. | 2.7% |
| Meta Platforms, Inc., Class A | 2.4% |
| KLA Corp. | 2.1% |
| Seagate Technology Holdings plc | 1.9% |
| * Excluding short-term investments |
Top Industries
| Semiconductors & Semiconductor Equipment | 18.9% |
| Interactive Media & Services | 8.6% |
| Technology Hardware, Storage & Peripherals | 8.2% |
| Software | 6.0% |
| Broadline Retail | 4.7% |
| Electrical Equipment | 4.5% |
| Capital Markets | 4.1% |
| Banks | 3.7% |
| Financial Services | 3.4% |
| Electric Utilities | 3.3% |
| Other | 34.6% |
Top Ten Holdings and/or Issuers*
| NVIDIA Corp. | 7.8% |
| Apple, Inc. | 6.3% |
| Alphabet, Inc., Class A | 6.2% |
| Microsoft Corp. | 4.7% |
| Amazon.com, Inc. | 4.7% |
| Broadcom, Inc. | 3.6% |
| JPMorgan Chase & Co. | 2.7% |
| Meta Platforms, Inc., Class A | 2.4% |
| KLA Corp. | 2.1% |
| Seagate Technology Holdings plc | 1.9% |
| * Excluding short-term investments |
What were the Portfolio costs for the last six months?1
(Based on a hypothetical $10,000 investment)
| Share Class Name | Costs of a $10,000 investment | Costs paid as a percentage of a $10,000 investment2 |
| Initial Class | $38 | 0.74% |
| 1. | Does not include any separate account or policy fees or charges imposed under the variable annuity policies and variable universal life insurance policies for which the Portfolio is an investment option. If they were included, your costs would be higher. |
| 2. | Annualized. |
Portfolio Performance
The following graph compares the initial and subsequent account values at the end of each of the most recently completed 10 semiannual reporting periods of the Portfolio (or for the life of the Portfolio, if shorter). It assumes a $10,000 initial investment at the beginning of the first fiscal period in an appropriate, broad-based securities market index and other indexes, if applicable, for the same period.
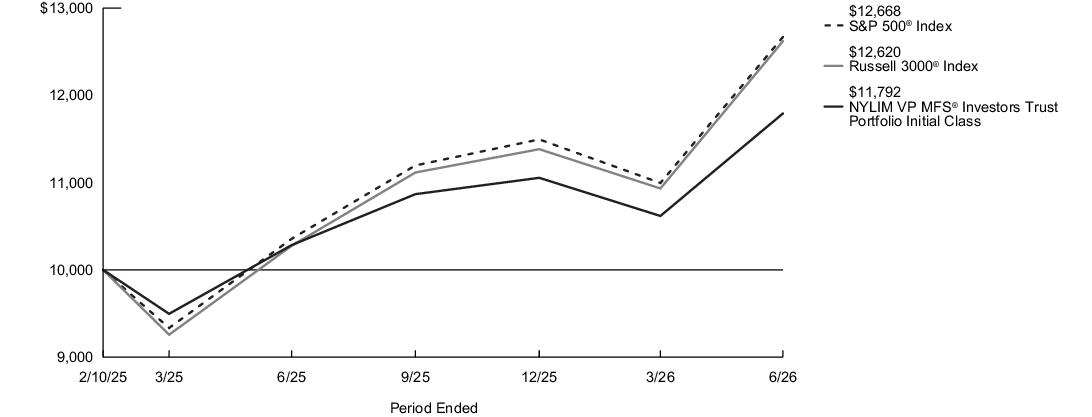
| Average Annual Total Returns for the Period Ended June 30, 2026 | Inception Date |
Six Months1 |
One Year |
Since Inception |
| Initial Class Shares | 2/10/2025 | 6.66% | 14.67% | 12.53% |
| Russell 3000®Index2 | 10.86% | 22.81% | 18.14% | |
| S&P 500®Index3 | 10.21% | 22.33% | 18.46% | |
| Morningstar Large Blend Category Average4 | 9.74% | 20.23% | 15.92% |
| 1. |
Not annualized. |
| 2. |
The Portfolio has selected the Russell 3000® Index to represent a broad measure of market performance. The Russell 3000® Index measures the performance of the largest 3,000 U.S. companies representing approximately 98% of the investable U.S. equity market. |
| 3. |
The S&P 500® Index, which represents a broad measure of market performance, is generally representative of the market sectors or types of investments in which the Portfolio invests. S&P® and S&P 500® are registered trademarks of Standard & Poor’s Financial Services LLC. The S&P 500® Index is widely regarded as the standard index for measuring large-cap U.S. stock market performance. |
| 4. |
The Morningstar Large Blend Category Average is representative of funds that represent the overall U.S. stock market in size, growth rates and price. Stocks in the top 70% of the capitalization of the U.S. equity market are defined as large cap. The blend style is assigned to funds where neither growth nor value characteristics predominate. These funds tend to invest across the spectrum of U.S. industries, and owing to their broad exposure, the funds' returns are often similar to those of the S&P 500® Index. Results are based on average total returns of similar funds with all dividends and capital gain distributions reinvested. |
Key Portfolio Statistics
| Portfolio's net assets | $443,909,538 |
| Total number of portfolio holdings | 69 |
| Portfolio turnover rate | 18% |
Graphical Representation of Holdings
The tables below show the investment makeup of the Portfolio; percentages indicated are based on the Portfolio's net assets.
Top Ten Holdings and/or Issuers*
| NVIDIA Corp. | 7.8% |
| Apple, Inc. | 6.3% |
| Alphabet, Inc., Class A | 6.2% |
| Microsoft Corp. | 4.7% |
| Amazon.com, Inc. | 4.7% |
| Broadcom, Inc. | 3.6% |
| JPMorgan Chase & Co. | 2.7% |
| Meta Platforms, Inc., Class A | 2.4% |
| KLA Corp. | 2.1% |
| Seagate Technology Holdings plc | 1.9% |
| * Excluding short-term investments |
Top Industries
| Semiconductors & Semiconductor Equipment | 18.9% |
| Interactive Media & Services | 8.6% |
| Technology Hardware, Storage & Peripherals | 8.2% |
| Software | 6.0% |
| Broadline Retail | 4.7% |
| Electrical Equipment | 4.5% |
| Capital Markets | 4.1% |
| Banks | 3.7% |
| Financial Services | 3.4% |
| Electric Utilities | 3.3% |
| Other | 34.6% |
Top Ten Holdings and/or Issuers*
| NVIDIA Corp. | 7.8% |
| Apple, Inc. | 6.3% |
| Alphabet, Inc., Class A | 6.2% |
| Microsoft Corp. | 4.7% |
| Amazon.com, Inc. | 4.7% |
| Broadcom, Inc. | 3.6% |
| JPMorgan Chase & Co. | 2.7% |
| Meta Platforms, Inc., Class A | 2.4% |
| KLA Corp. | 2.1% |
| Seagate Technology Holdings plc | 1.9% |
| * Excluding short-term investments |
What were the Portfolio costs for the last six months?1
(Based on a hypothetical $10,000 investment)
| Share Class Name | Costs of a $10,000 investment | Costs paid as a percentage of a $10,000 investment2 |
| Initial Class | $38 | 0.75% |
| 1. | Does not include any separate account or policy fees or charges imposed under the variable annuity policies and variable universal life insurance policies for which the Portfolio is an investment option. If they were included, your costs would be higher. |
| 2. | Annualized. |
Portfolio Performance
The following graph compares the initial and subsequent account values at the end of each of the most recently completed 10 semiannual reporting periods of the Portfolio (or for the life of the Portfolio, if shorter). It assumes a $10,000 initial investment at the beginning of the first fiscal period in an appropriate, broad-based securities market index and other indexes, if applicable, for the same period.
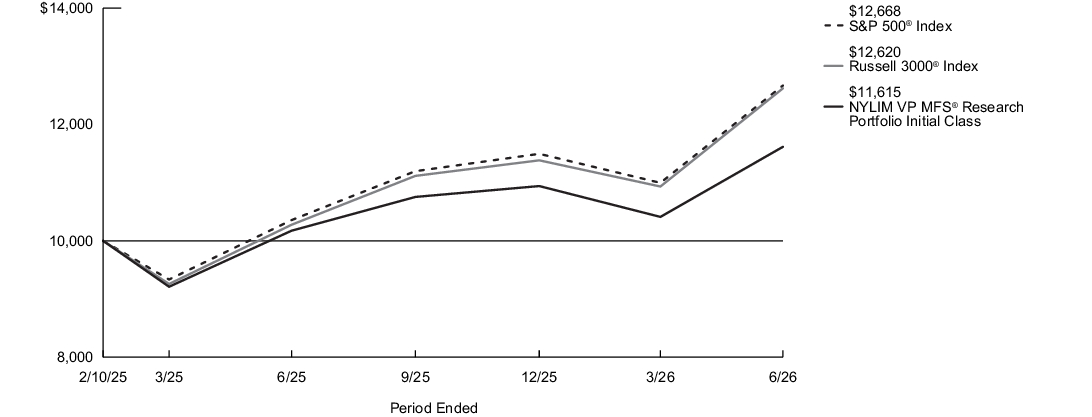
| Average Annual Total Returns for the Period Ended June 30, 2026 | Inception Date |
Six Months1 |
One Year |
Since Inception |
| Initial Class Shares | 2/10/2025 | 6.16% | 14.16% | 11.32% |
| Russell 3000®Index2 | 10.86% | 22.81% | 18.14% | |
| S&P 500®Index3 | 10.21% | 22.33% | 18.46% | |
| Morningstar Large Blend Category Average4 | 9.74% | 20.23% | 15.92% |
| 1. |
Not annualized. |
| 2. |
The Portfolio has selected the Russell 3000® Index to represent a broad measure of market performance. The Russell 3000® Index measures the performance of the largest 3,000 U.S. companies representing approximately 98% of the investable U.S. equity market. |
| 3. |
The S&P 500® Index, which represents a broad measure of market performance, is generally representative of the market sectors or types of investments in which the Portfolio invests. S&P® and S&P 500® are registered trademarks of Standard & Poor’s Financial Services LLC. The S&P 500® Index is widely regarded as the standard index for measuring large-cap U.S. stock market performance. |
| 4. |
The Morningstar Large Blend Category Average is representative of funds that represent the overall U.S. stock market in size, growth rates and price. Stocks in the top 70% of the capitalization of the U.S. equity market are defined as large cap. The blend style is assigned to funds where neither growth nor value characteristics predominate. These funds tend to invest across the spectrum of U.S. industries, and owing to their broad exposure, the funds' returns are often similar to those of the S&P 500® Index. Results are based on average total returns of similar funds with all dividends and capital gain distributions reinvested. |
Key Portfolio Statistics
| Portfolio's net assets | $340,213,134 |
| Total number of portfolio holdings | 98 |
| Portfolio turnover rate | 28% |
Graphical Representation of Holdings
The tables below show the investment makeup of the Portfolio; percentages indicated are based on the Portfolio's net assets.
Top Ten Holdings and/or Issuers*
| NVIDIA Corp. | 8.4% |
| Apple, Inc. | 6.9% |
| Alphabet, Inc., Class A | 5.0% |
| Microsoft Corp. | 4.8% |
| Amazon.com, Inc. | 4.4% |
| Broadcom, Inc. | 3.5% |
| JPMorgan Chase & Co. | 2.3% |
| KLA Corp. | 2.3% |
| Mastercard, Inc., Class A | 2.3% |
| Meta Platforms, Inc., Class A | 2.1% |
| * Excluding short-term investments |
Top Industries
| Semiconductors & Semiconductor Equipment | 19.5% |
| Technology Hardware, Storage & Peripherals | 8.9% |
| Interactive Media & Services | 7.1% |
| Software | 5.5% |
| Banks | 4.5% |
| Broadline Retail | 4.4% |
| Aerospace & Defense | 3.3% |
| Capital Markets | 2.9% |
| Oil, Gas & Consumable Fuels | 2.5% |
| Insurance | 2.4% |
| Other | 39.0% |
Top Ten Holdings and/or Issuers*
| NVIDIA Corp. | 8.4% |
| Apple, Inc. | 6.9% |
| Alphabet, Inc., Class A | 5.0% |
| Microsoft Corp. | 4.8% |
| Amazon.com, Inc. | 4.4% |
| Broadcom, Inc. | 3.5% |
| JPMorgan Chase & Co. | 2.3% |
| KLA Corp. | 2.3% |
| Mastercard, Inc., Class A | 2.3% |
| Meta Platforms, Inc., Class A | 2.1% |
| * Excluding short-term investments |
What were the Portfolio costs for the last six months?1
(Based on a hypothetical $10,000 investment)
| Share Class Name | Costs of a $10,000 investment | Costs paid as a percentage of a $10,000 investment2 |
| Service Class | $51 | 1.00% |
| 1. | Does not include any separate account or policy fees or charges imposed under the variable annuity policies and variable universal life insurance policies for which the Portfolio is an investment option. If they were included, your costs would be higher. |
| 2. | Annualized. |
Portfolio Performance
The following graph compares the initial and subsequent account values at the end of each of the most recently completed 10 semiannual reporting periods of the Portfolio (or for the life of the Portfolio, if shorter). It assumes a $10,000 initial investment at the beginning of the first fiscal period in an appropriate, broad-based securities market index and other indexes, if applicable, for the same period.
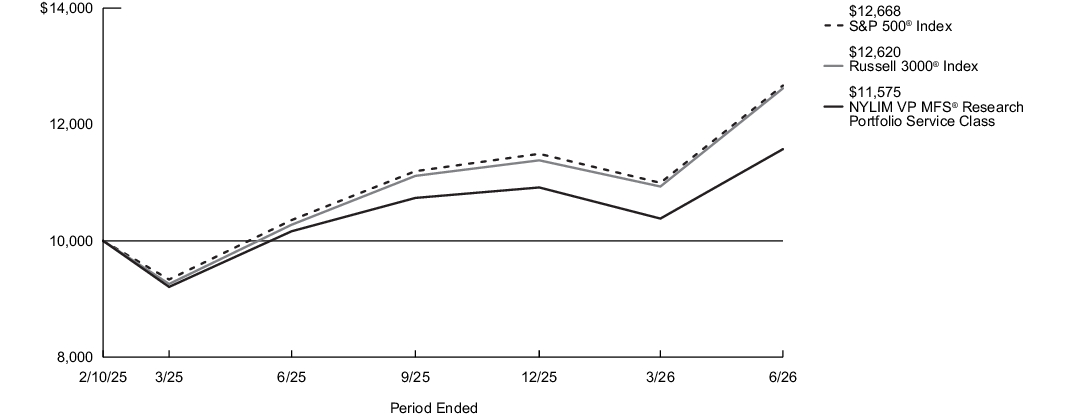
| Average Annual Total Returns for the Period Ended June 30, 2026 | Inception Date |
Six Months1 |
One Year |
Since Inception |
| Service Class Shares | 2/10/2025 | 6.03% | 13.88% | 11.05% |
| Russell 3000®Index2 | 10.86% | 22.81% | 18.14% | |
| S&P 500®Index3 | 10.21% | 22.33% | 18.46% | |
| Morningstar Large Blend Category Average4 | 9.74% | 20.23% | 15.92% |
| 1. |
Not annualized. |
| 2. |
The Portfolio has selected the Russell 3000® Index to represent a broad measure of market performance. The Russell 3000® Index measures the performance of the largest 3,000 U.S. companies representing approximately 98% of the investable U.S. equity market. |
| 3. |
The S&P 500® Index, which represents a broad measure of market performance, is generally representative of the market sectors or types of investments in which the Portfolio invests. S&P® and S&P 500® are registered trademarks of Standard & Poor’s Financial Services LLC. The S&P 500® Index is widely regarded as the standard index for measuring large-cap U.S. stock market performance. |
| 4. |
The Morningstar Large Blend Category Average is representative of funds that represent the overall U.S. stock market in size, growth rates and price. Stocks in the top 70% of the capitalization of the U.S. equity market are defined as large cap. The blend style is assigned to funds where neither growth nor value characteristics predominate. These funds tend to invest across the spectrum of U.S. industries, and owing to their broad exposure, the funds' returns are often similar to those of the S&P 500® Index. Results are based on average total returns of similar funds with all dividends and capital gain distributions reinvested. |
Key Portfolio Statistics
| Portfolio's net assets | $340,213,134 |
| Total number of portfolio holdings | 98 |
| Portfolio turnover rate | 28% |
Graphical Representation of Holdings
The tables below show the investment makeup of the Portfolio; percentages indicated are based on the Portfolio's net assets.
Top Ten Holdings and/or Issuers*
| NVIDIA Corp. | 8.4% |
| Apple, Inc. | 6.9% |
| Alphabet, Inc., Class A | 5.0% |
| Microsoft Corp. | 4.8% |
| Amazon.com, Inc. | 4.4% |
| Broadcom, Inc. | 3.5% |
| JPMorgan Chase & Co. | 2.3% |
| KLA Corp. | 2.3% |
| Mastercard, Inc., Class A | 2.3% |
| Meta Platforms, Inc., Class A | 2.1% |
| * Excluding short-term investments |
Top Industries
| Semiconductors & Semiconductor Equipment | 19.5% |
| Technology Hardware, Storage & Peripherals | 8.9% |
| Interactive Media & Services | 7.1% |
| Software | 5.5% |
| Banks | 4.5% |
| Broadline Retail | 4.4% |
| Aerospace & Defense | 3.3% |
| Capital Markets | 2.9% |
| Oil, Gas & Consumable Fuels | 2.5% |
| Insurance | 2.4% |
| Other | 39.0% |
Top Ten Holdings and/or Issuers*
| NVIDIA Corp. | 8.4% |
| Apple, Inc. | 6.9% |
| Alphabet, Inc., Class A | 5.0% |
| Microsoft Corp. | 4.8% |
| Amazon.com, Inc. | 4.4% |
| Broadcom, Inc. | 3.5% |
| JPMorgan Chase & Co. | 2.3% |
| KLA Corp. | 2.3% |
| Mastercard, Inc., Class A | 2.3% |
| Meta Platforms, Inc., Class A | 2.1% |
| * Excluding short-term investments |
What were the Portfolio costs for the last six months?1
(Based on a hypothetical $10,000 investment)
| Share Class Name | Costs of a $10,000 investment | Costs paid as a percentage of a $10,000 investment2 |
| Service Class | $60 | 1.03% |
| 1. | Does not include any separate account or policy fees or charges imposed under the variable annuity policies and variable universal life insurance policies for which the Portfolio is an investment option. If they were included, your costs would be higher. |
| 2. | Annualized. |
Portfolio Performance
The following graph compares the initial and subsequent account values at the end of each of the most recently completed 10 semiannual reporting periods of the Portfolio (or for the life of the Portfolio, if shorter). It assumes a $10,000 initial investment at the beginning of the first fiscal period in an appropriate, broad-based securities market index and other indexes, if applicable, for the same period.
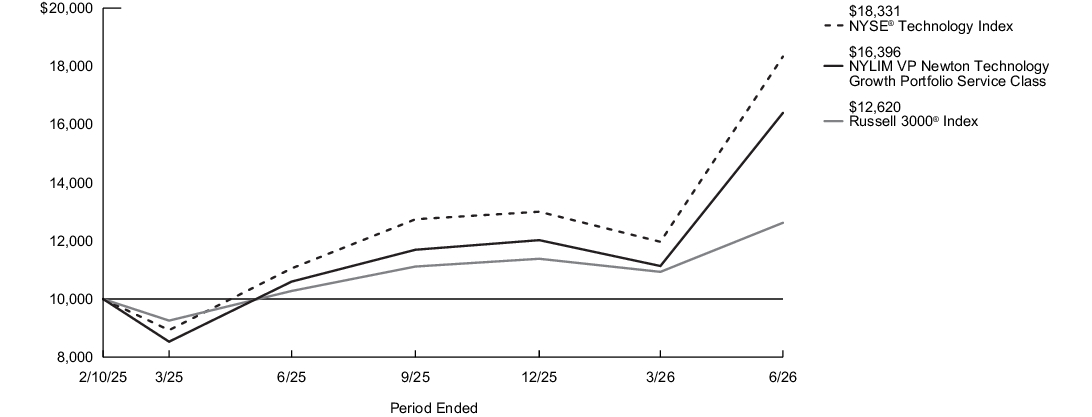
| Average Annual Total Returns for the Period Ended June 30, 2026 | Inception Date |
Six Months1 |
One Year |
Since Inception |
| Service Class Shares | 2/10/2025 | 36.37% | 54.71% | 42.51% |
| Russell 3000®Index2 | 10.86% | 22.81% | 18.14% | |
| NYSE® Technology Index3 | 41.00% | 65.87% | 54.37% | |
| Morningstar Technology Category Average4 | 34.17% | 51.42% | 37.56% |
| 1. |
Not annualized. |
| 2. |
The Portfolio has selected the Russell 3000® Index to represent a broad measure of market performance. The Russell 3000® Index measures the performance of the largest 3,000 U.S. companies representing approximately 98% of the investable U.S. equity market. |
| 3. |
The NYSE® Technology Index, which is generally representative of the market sectors or types of investments in which the Portfolio invests, is an equal-dollar weighted Index designed to objectively represent the technology sector by holding 35 of the leading U.S. technology-related companies. |
| 4. |
The Morningstar Technology Category Average is representative of funds that buy high-tech businesses in the U.S. or outside of the U.S. Most concentrate on computer, semiconductor, software, networking, and Internet stocks. A few also buy medical-device and biotechnology stocks, and some concentrate on a single technology industry. Results are based on average total returns of similar funds with all dividends and capital gain distributions reinvested. |
Key Portfolio Statistics
| Portfolio's net assets | $1,696,770,545 |
| Total number of portfolio holdings | 37 |
| Portfolio turnover rate | 24% |
Graphical Representation of Holdings
The tables below show the investment makeup of the Portfolio; percentages indicated are based on the Portfolio's net assets.
Top Ten Holdings and/or Issuers*
| Micron Technology, Inc. | 8.5% |
| Taiwan Semiconductor Manufacturing Co. Ltd., Sponsored ADR | 7.0% |
| Marvell Technology, Inc. | 7.0% |
| Intel Corp. | 6.6% |
| Applied Materials, Inc. | 6.4% |
| Lam Research Corp. | 6.4% |
| Advanced Micro Devices, Inc. | 4.6% |
| NVIDIA Corp. | 4.0% |
| Texas Instruments, Inc. | 3.8% |
| Amazon.com, Inc. | 3.5% |
| * Excluding short-term investments |
Top Industries
| Semiconductors & Semiconductor Equipment | 58.5% |
| Software | 12.8% |
| Interactive Media & Services | 6.7% |
| Technology Hardware, Storage & Peripherals | 5.2% |
| Broadline Retail | 4.8% |
| Entertainment | 3.6% |
| Electronic Equipment, Instruments & Components | 2.9% |
| IT Services | 2.7% |
| Aerospace & Defense | 2.5% |
| Financial Services | 1.4% |
| Other | (1.1)% |
Top Ten Holdings and/or Issuers*
| Micron Technology, Inc. | 8.5% |
| Taiwan Semiconductor Manufacturing Co. Ltd., Sponsored ADR | 7.0% |
| Marvell Technology, Inc. | 7.0% |
| Intel Corp. | 6.6% |
| Applied Materials, Inc. | 6.4% |
| Lam Research Corp. | 6.4% |
| Advanced Micro Devices, Inc. | 4.6% |
| NVIDIA Corp. | 4.0% |
| Texas Instruments, Inc. | 3.8% |
| Amazon.com, Inc. | 3.5% |
| * Excluding short-term investments |
What were the Portfolio costs for the last six months?1
(Based on a hypothetical $10,000 investment)
| Share Class Name | Costs of a $10,000 investment | Costs paid as a percentage of a $10,000 investment2 |
| Initial Class | $46 | 0.78% |
| 1. | Does not include any separate account or policy fees or charges imposed under the variable annuity policies and variable universal life insurance policies for which the Portfolio is an investment option. If they were included, your costs would be higher. |
| 2. | Annualized. |
Portfolio Performance
The following graph compares the initial and subsequent account values at the end of each of the most recently completed 10 semiannual reporting periods of the Portfolio (or for the life of the Portfolio, if shorter). It assumes a $10,000 initial investment at the beginning of the first fiscal period in an appropriate, broad-based securities market index and other indexes, if applicable, for the same period.
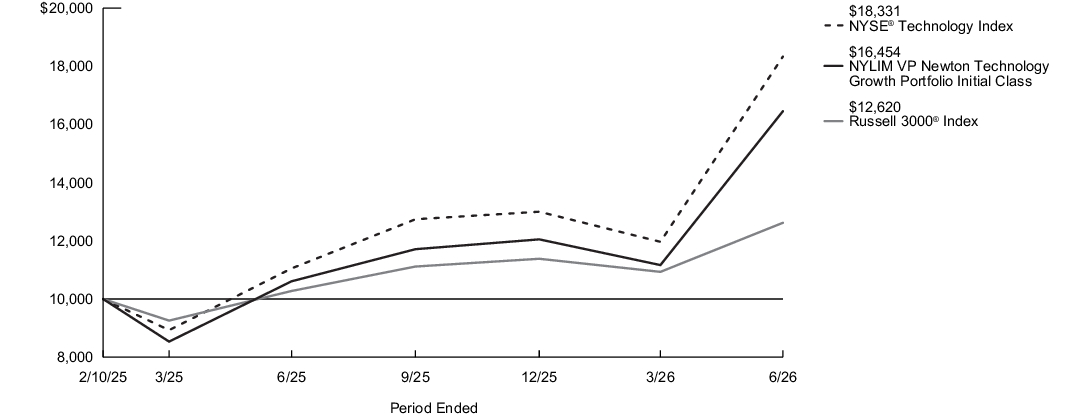
| Average Annual Total Returns for the Period Ended June 30, 2026 | Inception Date |
Six Months1 |
One Year |
Since Inception |
| Initial Class Shares | 2/10/2025 | 36.54% | 55.10% | 42.87% |
| Russell 3000®Index2 | 10.86% | 22.81% | 18.14% | |
| NYSE® Technology Index3 | 41.00% | 65.87% | 54.37% | |
| Morningstar Technology Category Average4 | 34.17% | 51.42% | 37.56% |
| 1. |
Not annualized. |
| 2. |
The Portfolio has selected the Russell 3000® Index to represent a broad measure of market performance. The Russell 3000® Index measures the performance of the largest 3,000 U.S. companies representing approximately 98% of the investable U.S. equity market. |
| 3. |
The NYSE® Technology Index, which is generally representative of the market sectors or types of investments in which the Portfolio invests, is an equal-dollar weighted Index designed to objectively represent the technology sector by holding 35 of the leading U.S. technology-related companies. |
| 4. |
The Morningstar Technology Category Average is representative of funds that buy high-tech businesses in the U.S. or outside of the U.S. Most concentrate on computer, semiconductor, software, networking, and Internet stocks. A few also buy medical-device and biotechnology stocks, and some concentrate on a single technology industry. Results are based on average total returns of similar funds with all dividends and capital gain distributions reinvested. |
Key Portfolio Statistics
| Portfolio's net assets | $1,696,770,545 |
| Total number of portfolio holdings | 37 |
| Portfolio turnover rate | 24% |
Graphical Representation of Holdings
The tables below show the investment makeup of the Portfolio; percentages indicated are based on the Portfolio's net assets.
Top Ten Holdings and/or Issuers*
| Micron Technology, Inc. | 8.5% |
| Taiwan Semiconductor Manufacturing Co. Ltd., Sponsored ADR | 7.0% |
| Marvell Technology, Inc. | 7.0% |
| Intel Corp. | 6.6% |
| Applied Materials, Inc. | 6.4% |
| Lam Research Corp. | 6.4% |
| Advanced Micro Devices, Inc. | 4.6% |
| NVIDIA Corp. | 4.0% |
| Texas Instruments, Inc. | 3.8% |
| Amazon.com, Inc. | 3.5% |
| * Excluding short-term investments |
Top Industries
| Semiconductors & Semiconductor Equipment | 58.5% |
| Software | 12.8% |
| Interactive Media & Services | 6.7% |
| Technology Hardware, Storage & Peripherals | 5.2% |
| Broadline Retail | 4.8% |
| Entertainment | 3.6% |
| Electronic Equipment, Instruments & Components | 2.9% |
| IT Services | 2.7% |
| Aerospace & Defense | 2.5% |
| Financial Services | 1.4% |
| Other | (1.1)% |
Top Ten Holdings and/or Issuers*
| Micron Technology, Inc. | 8.5% |
| Taiwan Semiconductor Manufacturing Co. Ltd., Sponsored ADR | 7.0% |
| Marvell Technology, Inc. | 7.0% |
| Intel Corp. | 6.6% |
| Applied Materials, Inc. | 6.4% |
| Lam Research Corp. | 6.4% |
| Advanced Micro Devices, Inc. | 4.6% |
| NVIDIA Corp. | 4.0% |
| Texas Instruments, Inc. | 3.8% |
| Amazon.com, Inc. | 3.5% |
| * Excluding short-term investments |
| [1] | Does not include any separate account or policy fees or charges imposed under the variable annuity policies and variable universal life insurance policies for which the Portfolio is an investment option. If they were included, your costs would be higher. |
| [2] | Annualized. |
| [3] | Does not include any separate account or policy fees or charges imposed under the variable annuity policies and variable universal life insurance policies for which the Portfolio is an investment option. If they were included, your costs would be higher. |
| [4] | Annualized. |
| [5] | Does not include any separate account or policy fees or charges imposed under the variable annuity policies and variable universal life insurance policies for which the Portfolio is an investment option. If they were included, your costs would be higher. |
| [6] | Annualized. |
| [7] | Does not include any separate account or policy fees or charges imposed under the variable annuity policies and variable universal life insurance policies for which the Portfolio is an investment option. If they were included, your costs would be higher. |
| [8] | Annualized. |
| [9] | Does not include any separate account or policy fees or charges imposed under the variable annuity policies and variable universal life insurance policies for which the Portfolio is an investment option. If they were included, your costs would be higher. |
| [10] | Annualized. |
| [11] | Does not include any separate account or policy fees or charges imposed under the variable annuity policies and variable universal life insurance policies for which the Portfolio is an investment option. If they were included, your costs would be higher. |
| [12] | Annualized. |
| [13] | Reflects fee waivers and/or expense reimbursements, without which expenses would have been higher. |
| [14] | Does not include any separate account or policy fees or charges imposed under the variable annuity policies and variable universal life insurance policies for which the Portfolio is an investment option. If they were included, your costs would be higher. |
| [15] | Annualized. |
| [16] | Reflects fee waivers and/or expense reimbursements, without which expenses would have been higher. |
| [17] | Does not include any separate account or policy fees or charges imposed under the variable annuity policies and variable universal life insurance policies for which the Portfolio is an investment option. If they were included, your costs would be higher. |
| [18] | Annualized. |
| [19] | Reflects fee waivers and/or expense reimbursements, without which expenses would have been higher. |
| [20] | Does not include any separate account or policy fees or charges imposed under the variable annuity policies and variable universal life insurance policies for which the Portfolio is an investment option. If they were included, your costs would be higher. |
| [21] | Annualized. |
| [22] | Reflects fee waivers and/or expense reimbursements, without which expenses would have been higher. |
| [23] | Does not include any separate account or policy fees or charges imposed under the variable annuity policies and variable universal life insurance policies for which the Portfolio is an investment option. If they were included, your costs would be higher. |
| [24] | Annualized. |
| [25] | Reflects fee waivers and/or expense reimbursements, without which expenses would have been higher. |
| [26] | Does not include any separate account or policy fees or charges imposed under the variable annuity policies and variable universal life insurance policies for which the Portfolio is an investment option. If they were included, your costs would be higher. |
| [27] | Annualized. |
| [28] | Reflects fee waivers and/or expense reimbursements, without which expenses would have been higher. |
| [29] | Does not include any separate account or policy fees or charges imposed under the variable annuity policies and variable universal life insurance policies for which the Portfolio is an investment option. If they were included, your costs would be higher. |
| [30] | Annualized. |
| [31] | Does not include any separate account or policy fees or charges imposed under the variable annuity policies and variable universal life insurance policies for which the Portfolio is an investment option. If they were included, your costs would be higher. |
| [32] | Annualized. |
| [33] | Does not include any separate account or policy fees or charges imposed under the variable annuity policies and variable universal life insurance policies for which the Portfolio is an investment option. If they were included, your costs would be higher. |
| [34] | Annualized. |
| [35] | Excludes the fees and expenses of the acquired (underlying) funds in which the Portfolio invested. |
| [36] | Does not include any separate account or policy fees or charges imposed under the variable annuity policies and variable universal life insurance policies for which the Portfolio is an investment option. If they were included, your costs would be higher. |
| [37] | Annualized. |
| [38] | Excludes the fees and expenses of the acquired (underlying) funds in which the Portfolio invested. |
| [39] | Does not include any separate account or policy fees or charges imposed under the variable annuity policies and variable universal life insurance policies for which the Portfolio is an investment option. If they were included, your costs would be higher. |
| [40] | Annualized. |
| [41] | Does not include any separate account or policy fees or charges imposed under the variable annuity policies and variable universal life insurance policies for which the Portfolio is an investment option. If they were included, your costs would be higher. |
| [42] | Annualized. |
| [43] | Does not include any separate account or policy fees or charges imposed under the variable annuity policies and variable universal life insurance policies for which the Portfolio is an investment option. If they were included, your costs would be higher. |
| [44] | Annualized. |
| [45] | Excludes the fees and expenses of the acquired (underlying) funds in which the Portfolio invested. |
| [46] | Does not include any separate account or policy fees or charges imposed under the variable annuity policies and variable universal life insurance policies for which the Portfolio is an investment option. If they were included, your costs would be higher. |
| [47] | Annualized. |
| [48] | Excludes the fees and expenses of the acquired (underlying) funds in which the Portfolio invested. |
| [49] | Does not include any separate account or policy fees or charges imposed under the variable annuity policies and variable universal life insurance policies for which the Portfolio is an investment option. If they were included, your costs would be higher. |
| [50] | Annualized. |
| [51] | Excludes the fees and expenses of the acquired (underlying) funds in which the Portfolio invested. |
| [52] | Does not include any separate account or policy fees or charges imposed under the variable annuity policies and variable universal life insurance policies for which the Portfolio is an investment option. If they were included, your costs would be higher. |
| [53] | Annualized. |
| [54] | Excludes the fees and expenses of the acquired (underlying) funds in which the Portfolio invested. |
| [55] | Does not include any separate account or policy fees or charges imposed under the variable annuity policies and variable universal life insurance policies for which the Portfolio is an investment option. If they were included, your costs would be higher. |
| [56] | Annualized. |
| [57] | Excludes the fees and expenses of the acquired (underlying) funds in which the Portfolio invested. |
| [58] | Does not include any separate account or policy fees or charges imposed under the variable annuity policies and variable universal life insurance policies for which the Portfolio is an investment option. If they were included, your costs would be higher. |
| [59] | Annualized. |
| [60] | Excludes the fees and expenses of the acquired (underlying) funds in which the Portfolio invested. |
| [61] | Does not include any separate account or policy fees or charges imposed under the variable annuity policies and variable universal life insurance policies for which the Portfolio is an investment option. If they were included, your costs would be higher. |
| [62] | Annualized. |
| [63] | Excludes the fees and expenses of the acquired (underlying) funds in which the Portfolio invested. |
| [64] | Does not include any separate account or policy fees or charges imposed under the variable annuity policies and variable universal life insurance policies for which the Portfolio is an investment option. If they were included, your costs would be higher. |
| [65] | Annualized. |
| [66] | Excludes the fees and expenses of the acquired (underlying) funds in which the Portfolio invested. |
| [67] | Does not include any separate account or policy fees or charges imposed under the variable annuity policies and variable universal life insurance policies for which the Portfolio is an investment option. If they were included, your costs would be higher. |
| [68] | Annualized. |
| [69] | Reflects fee waivers and/or expense reimbursements, without which expenses would have been higher. |
| [70] | Less than 0.5%. |
| [71] | Does not include any separate account or policy fees or charges imposed under the variable annuity policies and variable universal life insurance policies for which the Portfolio is an investment option. If they were included, your costs would be higher. |
| [72] | Annualized. |
| [73] | Reflects fee waivers and/or expense reimbursements, without which expenses would have been higher. |
| [74] | Less than 0.5%. |
| [75] | Does not include any separate account or policy fees or charges imposed under the variable annuity policies and variable universal life insurance policies for which the Portfolio is an investment option. If they were included, your costs would be higher. |
| [76] | Annualized. |
| [77] | Reflects fee waivers and/or expense reimbursements, without which expenses would have been higher. |
| [78] | Does not include any separate account or policy fees or charges imposed under the variable annuity policies and variable universal life insurance policies for which the Portfolio is an investment option. If they were included, your costs would be higher. |
| [79] | Annualized. |
| [80] | Reflects fee waivers and/or expense reimbursements, without which expenses would have been higher. |
| [81] | Does not include any separate account or policy fees or charges imposed under the variable annuity policies and variable universal life insurance policies for which the Portfolio is an investment option. If they were included, your costs would be higher. |
| [82] | Annualized. |
| [83] | Does not include any separate account or policy fees or charges imposed under the variable annuity policies and variable universal life insurance policies for which the Portfolio is an investment option. If they were included, your costs would be higher. |
| [84] | Annualized. |
| [85] | Does not include any separate account or policy fees or charges imposed under the variable annuity policies and variable universal life insurance policies for which the Portfolio is an investment option. If they were included, your costs would be higher. |
| [86] | Annualized. |
| [87] | Does not include any separate account or policy fees or charges imposed under the variable annuity policies and variable universal life insurance policies for which the Portfolio is an investment option. If they were included, your costs would be higher. |
| [88] | Annualized. |
| [89] | Does not include any separate account or policy fees or charges imposed under the variable annuity policies and variable universal life insurance policies for which the Portfolio is an investment option. If they were included, your costs would be higher. |
| [90] | Annualized. |
| [91] | Reflects fee waivers and/or expense reimbursements, without which expenses would have been higher. |
| [92] | Does not include any separate account or policy fees or charges imposed under the variable annuity policies and variable universal life insurance policies for which the Portfolio is an investment option. If they were included, your costs would be higher. |
| [93] | Annualized. |
| [94] | Reflects fee waivers and/or expense reimbursements, without which expenses would have been higher. |
| [95] | Does not include any separate account or policy fees or charges imposed under the variable annuity policies and variable universal life insurance policies for which the Portfolio is an investment option. If they were included, your costs would be higher. |
| [96] | Annualized. |
| [97] | Reflects fee waivers and/or expense reimbursements, without which expenses would have been higher. |
| [98] | Does not include any separate account or policy fees or charges imposed under the variable annuity policies and variable universal life insurance policies for which the Portfolio is an investment option. If they were included, your costs would be higher. |
| [99] | Annualized. |
| [100] | Does not include any separate account or policy fees or charges imposed under the variable annuity policies and variable universal life insurance policies for which the Portfolio is an investment option. If they were included, your costs would be higher. |
| [101] | Annualized. |
| [102] | Does not include any separate account or policy fees or charges imposed under the variable annuity policies and variable universal life insurance policies for which the Portfolio is an investment option. If they were included, your costs would be higher. |
| [103] | Annualized. |
| [104] | Does not include any separate account or policy fees or charges imposed under the variable annuity policies and variable universal life insurance policies for which the Portfolio is an investment option. If they were included, your costs would be higher. |
| [105] | Annualized. |
| [106] | Does not include any separate account or policy fees or charges imposed under the variable annuity policies and variable universal life insurance policies for which the Portfolio is an investment option. If they were included, your costs would be higher. |
| [107] | Annualized. |
| [108] | Does not include any separate account or policy fees or charges imposed under the variable annuity policies and variable universal life insurance policies for which the Portfolio is an investment option. If they were included, your costs would be higher. |
| [109] | Annualized. |
| [110] | Does not include any separate account or policy fees or charges imposed under the variable annuity policies and variable universal life insurance policies for which the Portfolio is an investment option. If they were included, your costs would be higher. |
| [111] | Annualized. |
| [112] | Does not include any separate account or policy fees or charges imposed under the variable annuity policies and variable universal life insurance policies for which the Portfolio is an investment option. If they were included, your costs would be higher. |
| [113] | Annualized. |
| [114] | Does not include any separate account or policy fees or charges imposed under the variable annuity policies and variable universal life insurance policies for which the Portfolio is an investment option. If they were included, your costs would be higher. |
| [115] | Annualized. |
| [116] | Does not include any separate account or policy fees or charges imposed under the variable annuity policies and variable universal life insurance policies for which the Portfolio is an investment option. If they were included, your costs would be higher. |
| [117] | Annualized. |
| [118] | Does not include any separate account or policy fees or charges imposed under the variable annuity policies and variable universal life insurance policies for which the Portfolio is an investment option. If they were included, your costs would be higher. |
| [119] | Annualized. |
| [120] | Does not include any separate account or policy fees or charges imposed under the variable annuity policies and variable universal life insurance policies for which the Portfolio is an investment option. If they were included, your costs would be higher. |
| [121] | Annualized. |
| [122] | Does not include any separate account or policy fees or charges imposed under the variable annuity policies and variable universal life insurance policies for which the Portfolio is an investment option. If they were included, your costs would be higher. |
| [123] | Annualized. |
| [124] | Does not include any separate account or policy fees or charges imposed under the variable annuity policies and variable universal life insurance policies for which the Portfolio is an investment option. If they were included, your costs would be higher. |
| [125] | Annualized. |
| [126] | Does not include any separate account or policy fees or charges imposed under the variable annuity policies and variable universal life insurance policies for which the Portfolio is an investment option. If they were included, your costs would be higher. |
| [127] | Annualized. |
| [128] | Does not include any separate account or policy fees or charges imposed under the variable annuity policies and variable universal life insurance policies for which the Portfolio is an investment option. If they were included, your costs would be higher. |
| [129] | Annualized. |
| [130] | Reflects fee waivers and/or expense reimbursements, without which expenses would have been higher. |
| [131] | Does not include any separate account or policy fees or charges imposed under the variable annuity policies and variable universal life insurance policies for which the Portfolio is an investment option. If they were included, your costs would be higher. |
| [132] | Annualized. |
| [133] | Reflects fee waivers and/or expense reimbursements, without which expenses would have been higher. |
| [134] | Does not include any separate account or policy fees or charges imposed under the variable annuity policies and variable universal life insurance policies for which the Portfolio is an investment option. If they were included, your costs would be higher. |
| [135] | Annualized. |
| [136] | Reflects fee waivers and/or expense reimbursements, without which expenses would have been higher. |
| [137] | Does not include any separate account or policy fees or charges imposed under the variable annuity policies and variable universal life insurance policies for which the Portfolio is an investment option. If they were included, your costs would be higher. |
| [138] | Annualized. |
| [139] | Reflects fee waivers and/or expense reimbursements, without which expenses would have been higher. |
| [140] | Does not include any separate account or policy fees or charges imposed under the variable annuity policies and variable universal life insurance policies for which the Portfolio is an investment option. If they were included, your costs would be higher. |
| [141] | Annualized. |
| [142] | Reflects fee waivers and/or expense reimbursements, without which expenses would have been higher. |
| [143] | Does not include any separate account or policy fees or charges imposed under the variable annuity policies and variable universal life insurance policies for which the Portfolio is an investment option. If they were included, your costs would be higher. |
| [144] | Annualized. |
| [145] | Reflects fee waivers and/or expense reimbursements, without which expenses would have been higher. |
| [146] | Does not include any separate account or policy fees or charges imposed under the variable annuity policies and variable universal life insurance policies for which the Portfolio is an investment option. If they were included, your costs would be higher. |
| [147] | Annualized. |
| [148] | Reflects fee waivers and/or expense reimbursements, without which expenses would have been higher. |
| [149] | Does not include any separate account or policy fees or charges imposed under the variable annuity policies and variable universal life insurance policies for which the Portfolio is an investment option. If they were included, your costs would be higher. |
| [150] | Annualized. |
| [151] | Reflects fee waivers and/or expense reimbursements, without which expenses would have been higher. |
| [152] | Does not include any separate account or policy fees or charges imposed under the variable annuity policies and variable universal life insurance policies for which the Portfolio is an investment option. If they were included, your costs would be higher. |
| [153] | Annualized. |
| [154] | Annualized. |
| [155] | Does not include any separate account or policy fees or charges imposed under the variable annuity policies and variable universal life insurance policies for which the Portfolio is an investment option. If they were included, your costs would be higher. |
| [156] | Annualized. |
| [157] | Does not include any separate account or policy fees or charges imposed under the variable annuity policies and variable universal life insurance policies for which the Portfolio is an investment option. If they were included, your costs would be higher. |
| [158] | Annualized. |
| [159] | Does not include any separate account or policy fees or charges imposed under the variable annuity policies and variable universal life insurance policies for which the Portfolio is an investment option. If they were included, your costs would be higher. |
| [160] | Annualized. |
| [161] | Does not include any separate account or policy fees or charges imposed under the variable annuity policies and variable universal life insurance policies for which the Portfolio is an investment option. If they were included, your costs would be higher. |
| [162] | Annualized. |