Shareholder Report
|
6 Months Ended |
|
Jun. 30, 2026
USD ($)
Holding
|
|---|
| Shareholder Report [Line Items] |
|
| Document Type |
N-CSRS
|
| Amendment Flag |
false
|
| Registrant Name |
Rydex Series Funds
|
| Entity Central Index Key |
0000899148
|
| Entity Investment Company Type |
N-1A
|
| Document Period End Date |
Jun. 30, 2026
|
| Shareholder Report Annual or Semi-Annual |
Semi-Annual Shareholder Report
|
| C000010464 |
|
| Shareholder Report [Line Items] |
|
| Fund Name |
Commodities Strategy Fund
|
| Class Name |
Class A
|
| Trading Symbol |
RYMEX
|
| Annual or Semi-Annual Statement [Text Block] |
This semi-annual shareholder report contains important information about the Commodities Strategy Fund for the period from January 1, 2026 to June 30, 2026.
|
| Additional Information [Text Block] |
You can find additional information about the fund at GuggenheimInvestments.com/mutual-funds/literature. You can also request this information by contacting 800 820 0888 or services@guggenheiminvestments.com.
|
| Additional Information Phone Number |
800 820 0888
|
| Additional Information Email |
<span style="box-sizing: border-box; color: rgb(67, 67, 67); display: inline; flex-wrap: nowrap; font-size: 10.6667px; font-weight: 400; grid-area: auto; line-height: 12.8px; margin: 0px; overflow: visible; text-align: left; text-align-last: auto; white-space-collapse: preserve-breaks;">services@guggenheiminvestments.com</span>
|
| Additional Information Website |
<span style="box-sizing: border-box; color: rgb(67, 67, 67); display: inline; flex-wrap: nowrap; font-size: 10.6667px; font-weight: 400; grid-area: auto; line-height: 12.8px; margin: 0px; overflow: visible; text-align: left; text-align-last: auto; white-space-collapse: preserve-breaks;">GuggenheimInvestments.com/mutual-funds/literature</span>
|
| Expenses [Text Block] |
What were the Fund's costs for the last six months? * Based on a hypothetical $10,000 investment Table SummaryClass | Costs of a $10,000 Investment | Costs Paid as a % of a $10,000 Investment** |
|---|
Class A | $86 | 1.55% |
|---|
Table Summary* | Excludes expenses of the underlying funds in which the fund invests, if any. |
|---|
** | Annualized |
|---|
|
| Expenses Paid, Amount |
$ 86
|
| Factors Affecting Performance [Text Block] |
What factors materially affected the Fund's performance over the last six months? The fund obtained exposure to the commodities markets through futures on the S&P Goldman Sachs Commodity Index (the "Index"). Energy and Industrial Metal sectors had some of the best sector performances for the reporting period. 14 of the 24 index components had positive returns for the period. The components with some of the largest positive returns were Gas Oil, Heating Oil and Gasoline. The components with some of the largest negative returns were Cocoa, Silver, and Corn. |
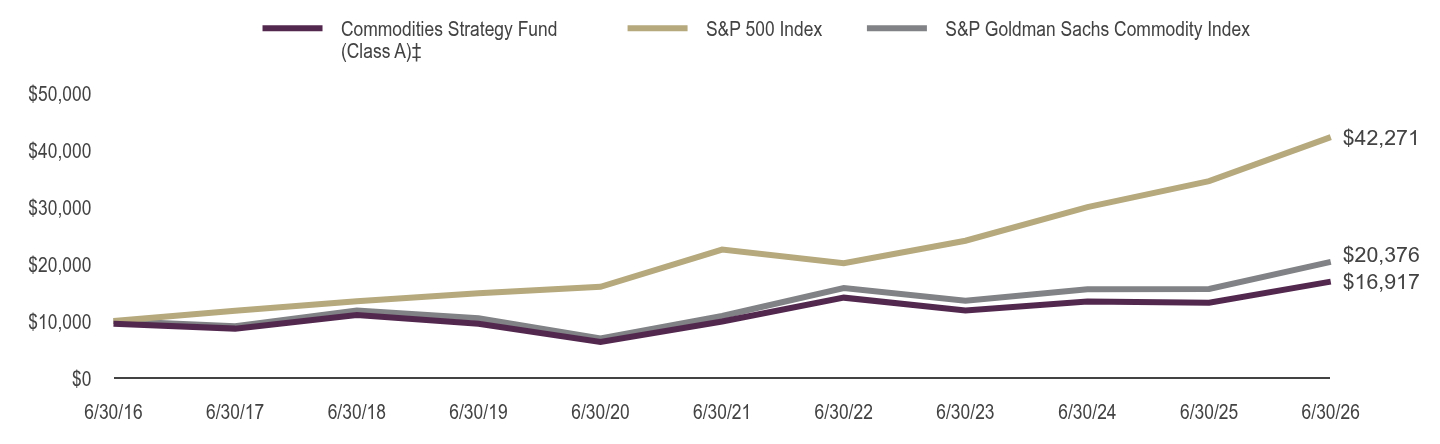
| Line Graph [Table Text Block] |
Table Summary | Commodities Strategy Fund (Class A)‡ | S&P 500 Index | S&P Goldman Sachs Commodity Index |
|---|
6/30/16 | $9,525 | $10,000 | $10,000 |
|---|
6/30/17 | $8,667 | $11,790 | $9,098 |
|---|
6/30/18 | $11,060 | $13,484 | $11,831 |
|---|
6/30/19 | $9,519 | $14,889 | $10,471 |
|---|
6/30/20 | $6,331 | $16,006 | $6,922 |
|---|
6/30/21 | $9,907 | $22,536 | $10,893 |
|---|
6/30/22 | $14,103 | $20,144 | $15,799 |
|---|
6/30/23 | $11,841 | $24,091 | $13,553 |
|---|
6/30/24 | $13,407 | $30,006 | $15,587 |
|---|
6/30/25 | $13,209 | $34,556 | $15,627 |
|---|
6/30/26 | $16,917 | $42,271 | $20,376 |
|---|
|
| AssetsNet |
$ 24,892,203
|
| Holdings Count | Holding |
8
|
| InvestmentCompanyPortfolioTurnover |
0.00%
|
| Additional Fund Statistics [Text Block] |
Fund Statistics as of June 30, 2026 - Net Assets$24,892,203
- Total Number of Portfolio Holdings8
- Portfolio Turnover Rate-%
|
| Holdings [Text Block] |
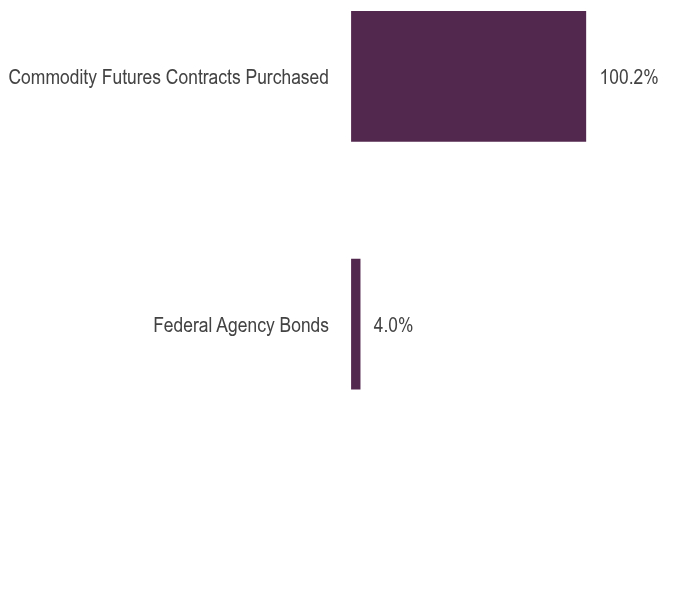
Consolidated Holdings DiversificationFootnote Reference(1) (% of Net Assets) as of June 30, 2026 Table SummaryValue | Value |
|---|
Federal Agency Bonds | 4.0% | Commodity Futures Contracts Purchased | 100.2% | |
| Largest Holdings [Text Block] |
Largest HoldingsFootnote Reference(2) (% of Net Assets) as of June 30, 2026 Table SummaryFederal Farm Credit Bank 3.67% (SOFR + 0.05%) due 10/02/26 | 4.0% |
|---|
Guggenheim Ultra Short Duration Fund — Institutional Class | 3.3% |
|---|
Guggenheim Ultra Short Income ETF | 3.2% |
|---|
Total | 10.5% |
|---|
|
| Material Fund Change [Text Block] |
|
| C000010465 |
|
| Shareholder Report [Line Items] |
|
| Fund Name |
Commodities Strategy Fund
|
| Class Name |
Class C
|
| Trading Symbol |
RYMJX
|
| Annual or Semi-Annual Statement [Text Block] |
This semi-annual shareholder report contains important information about the Commodities Strategy Fund for the period from January 1, 2026 to June 30, 2026.
|
| Additional Information [Text Block] |
You can find additional information about the fund at GuggenheimInvestments.com/mutual-funds/literature. You can also request this information by contacting 800 820 0888 or services@guggenheiminvestments.com.
|
| Additional Information Phone Number |
800 820 0888
|
| Additional Information Email |
<span style="box-sizing: border-box; color: rgb(67, 67, 67); display: inline; flex-wrap: nowrap; font-size: 10.6667px; font-weight: 400; grid-area: auto; line-height: 12.8px; margin: 0px; overflow: visible; text-align: left; text-align-last: auto; white-space-collapse: preserve-breaks;">services@guggenheiminvestments.com</span>
|
| Additional Information Website |
<span style="box-sizing: border-box; color: rgb(67, 67, 67); display: inline; flex-wrap: nowrap; font-size: 10.6667px; font-weight: 400; grid-area: auto; line-height: 12.8px; margin: 0px; overflow: visible; text-align: left; text-align-last: auto; white-space-collapse: preserve-breaks;">GuggenheimInvestments.com/mutual-funds/literature</span>
|
| Expenses [Text Block] |
What were the Fund's costs for the last six months? * Based on a hypothetical $10,000 investment Table SummaryClass | Costs of a $10,000 Investment | Costs Paid as a % of a $10,000 Investment** |
|---|
Class C | $127 | 2.30% |
|---|
Table Summary* | Excludes expenses of the underlying funds in which the fund invests, if any. |
|---|
** | Annualized |
|---|
|
| Expenses Paid, Amount |
$ 127
|
| Factors Affecting Performance [Text Block] |
What factors materially affected the Fund's performance over the last six months? The fund obtained exposure to the commodities markets through futures on the S&P Goldman Sachs Commodity Index (the "Index"). Energy and Industrial Metal sectors had some of the best sector performances for the reporting period. 14 of the 24 index components had positive returns for the period. The components with some of the largest positive returns were Gas Oil, Heating Oil and Gasoline. The components with some of the largest negative returns were Cocoa, Silver, and Corn. |
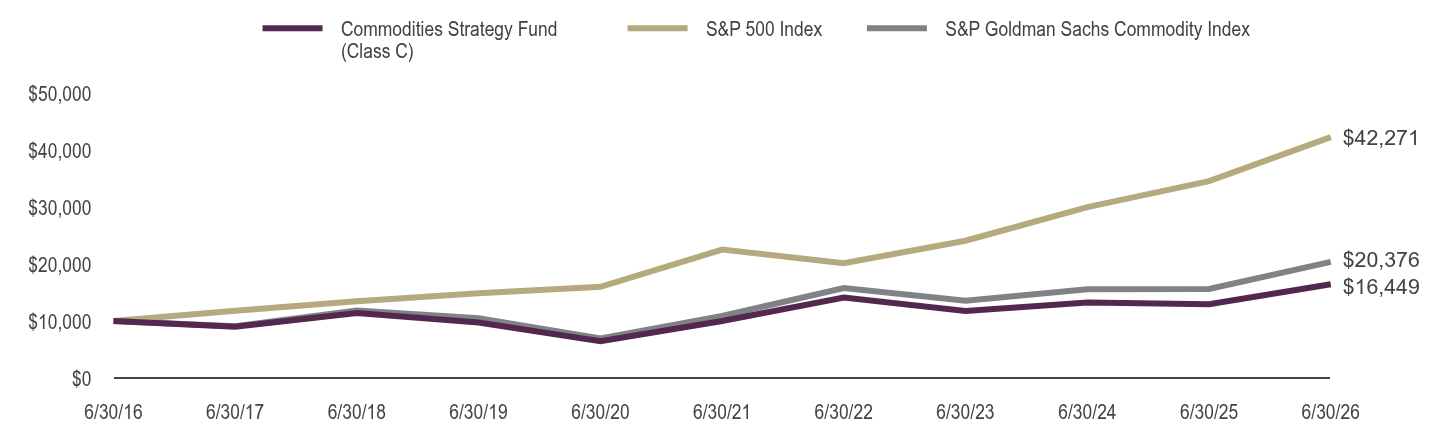
| Line Graph [Table Text Block] |
Table Summary | Commodities Strategy Fund (Class C) | S&P 500 Index | S&P Goldman Sachs Commodity Index |
|---|
6/30/16 | $10,000 | $10,000 | $10,000 |
|---|
6/30/17 | $9,014 | $11,790 | $9,098 |
|---|
6/30/18 | $11,416 | $13,484 | $11,831 |
|---|
6/30/19 | $9,752 | $14,889 | $10,471 |
|---|
6/30/20 | $6,438 | $16,006 | $6,922 |
|---|
6/30/21 | $10,000 | $22,536 | $10,893 |
|---|
6/30/22 | $14,128 | $20,144 | $15,799 |
|---|
6/30/23 | $11,776 | $24,091 | $13,553 |
|---|
6/30/24 | $13,232 | $30,006 | $15,587 |
|---|
6/30/25 | $12,940 | $34,556 | $15,627 |
|---|
6/30/26 | $16,449 | $42,271 | $20,376 |
|---|
|
| AssetsNet |
$ 24,892,203
|
| Holdings Count | Holding |
8
|
| InvestmentCompanyPortfolioTurnover |
0.00%
|
| Additional Fund Statistics [Text Block] |
Fund Statistics as of June 30, 2026 - Net Assets$24,892,203
- Total Number of Portfolio Holdings8
- Portfolio Turnover Rate-%
|
| Holdings [Text Block] |
Consolidated Holdings DiversificationFootnote Reference(1) (% of Net Assets) as of June 30, 2026 Table SummaryValue | Value |
|---|
Federal Agency Bonds | 4.0% | Commodity Futures Contracts Purchased | 100.2% | |
| Largest Holdings [Text Block] |
Largest HoldingsFootnote Reference(2) (% of Net Assets) as of June 30, 2026 Table SummaryFederal Farm Credit Bank 3.67% (SOFR + 0.05%) due 10/02/26 | 4.0% |
|---|
Guggenheim Ultra Short Duration Fund — Institutional Class | 3.3% |
|---|
Guggenheim Ultra Short Income ETF | 3.2% |
|---|
Total | 10.5% |
|---|
|
| Material Fund Change [Text Block] |
|
| C000010463 |
|
| Shareholder Report [Line Items] |
|
| Fund Name |
Commodities Strategy Fund
|
| Class Name |
Class H
|
| Trading Symbol |
RYMBX
|
| Annual or Semi-Annual Statement [Text Block] |
This semi-annual shareholder report contains important information about the Commodities Strategy Fund for the period from January 1, 2026 to June 30, 2026.
|
| Additional Information [Text Block] |
You can find additional information about the fund at GuggenheimInvestments.com/mutual-funds/literature. You can also request this information by contacting 800 820 0888 or services@guggenheiminvestments.com.
|
| Additional Information Phone Number |
800 820 0888
|
| Additional Information Email |
<span style="box-sizing: border-box; color: rgb(67, 67, 67); display: inline; flex-wrap: nowrap; font-size: 10.6667px; font-weight: 400; grid-area: auto; line-height: 12.8px; margin: 0px; overflow: visible; text-align: left; text-align-last: auto; white-space-collapse: preserve-breaks;">services@guggenheiminvestments.com</span>
|
| Additional Information Website |
<span style="box-sizing: border-box; color: rgb(67, 67, 67); display: inline; flex-wrap: nowrap; font-size: 10.6667px; font-weight: 400; grid-area: auto; line-height: 12.8px; margin: 0px; overflow: visible; text-align: left; text-align-last: auto; white-space-collapse: preserve-breaks;">GuggenheimInvestments.com/mutual-funds/literature</span>
|
| Expenses [Text Block] |
What were the Fund's costs for the last six months? * Based on a hypothetical $10,000 investment Table SummaryClass | Costs of a $10,000 Investment | Costs Paid as a % of a $10,000 Investment** |
|---|
Class H | $86 | 1.56% |
|---|
Table Summary* | Excludes expenses of the underlying funds in which the fund invests, if any. |
|---|
** | Annualized |
|---|
|
| Expenses Paid, Amount |
$ 86
|
| Factors Affecting Performance [Text Block] |
What factors materially affected the Fund's performance over the last six months? The fund obtained exposure to the commodities markets through futures on the S&P Goldman Sachs Commodity Index (the "Index"). Energy and Industrial Metal sectors had some of the best sector performances for the reporting period. 14 of the 24 index components had positive returns for the period. The components with some of the largest positive returns were Gas Oil, Heating Oil and Gasoline. The components with some of the largest negative returns were Cocoa, Silver, and Corn. |
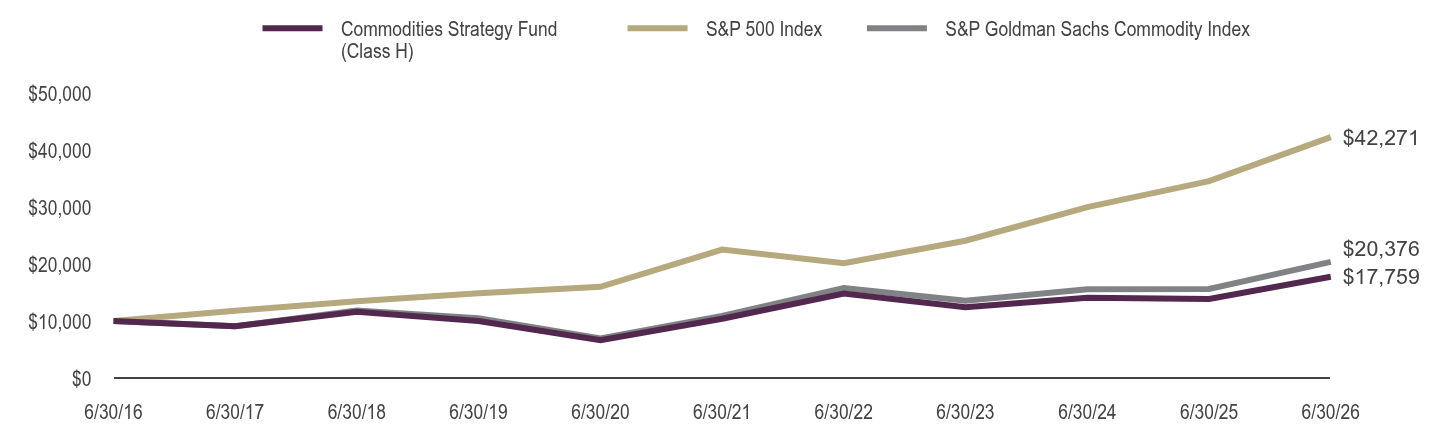
| Line Graph [Table Text Block] |
Table Summary | Commodities Strategy Fund (Class H) | S&P 500 Index | S&P Goldman Sachs Commodity Index |
|---|
6/30/16 | $10,000 | $10,000 | $10,000 |
|---|
6/30/17 | $9,103 | $11,790 | $9,098 |
|---|
6/30/18 | $11,617 | $13,484 | $11,831 |
|---|
6/30/19 | $9,995 | $14,889 | $10,471 |
|---|
6/30/20 | $6,650 | $16,006 | $6,922 |
|---|
6/30/21 | $10,400 | $22,536 | $10,893 |
|---|
6/30/22 | $14,808 | $20,144 | $15,799 |
|---|
6/30/23 | $12,437 | $24,091 | $13,553 |
|---|
6/30/24 | $14,079 | $30,006 | $15,587 |
|---|
6/30/25 | $13,866 | $34,556 | $15,627 |
|---|
6/30/26 | $17,759 | $42,271 | $20,376 |
|---|
|
| AssetsNet |
$ 24,892,203
|
| Holdings Count | Holding |
8
|
| InvestmentCompanyPortfolioTurnover |
0.00%
|
| Additional Fund Statistics [Text Block] |
Fund Statistics as of June 30, 2026 - Net Assets$24,892,203
- Total Number of Portfolio Holdings8
- Portfolio Turnover Rate-%
|
| Holdings [Text Block] |
Consolidated Holdings DiversificationFootnote Reference(1) (% of Net Assets) as of June 30, 2026 Table SummaryValue | Value |
|---|
Federal Agency Bonds | 4.0% | Commodity Futures Contracts Purchased | 100.2% | |
| Largest Holdings [Text Block] |
Largest HoldingsFootnote Reference(2) (% of Net Assets) as of June 30, 2026 Table SummaryFederal Farm Credit Bank 3.67% (SOFR + 0.05%) due 10/02/26 | 4.0% |
|---|
Guggenheim Ultra Short Duration Fund — Institutional Class | 3.3% |
|---|
Guggenheim Ultra Short Income ETF | 3.2% |
|---|
Total | 10.5% |
|---|
|
| Material Fund Change [Text Block] |
|
| C000039064 |
|
| Shareholder Report [Line Items] |
|
| Fund Name |
Managed Futures Strategy Fund
|
| Class Name |
Class A
|
| Trading Symbol |
RYMTX
|
| Annual or Semi-Annual Statement [Text Block] |
This semi-annual shareholder report contains important information about the Managed Futures Strategy Fund for the period from January 1, 2026 to June 30, 2026.
|
| Additional Information [Text Block] |
You can find additional information about the fund at GuggenheimInvestments.com/mutual-funds/literature. You can also request this information by contacting 800 820 0888 or services@guggenheiminvestments.com.
|
| Additional Information Phone Number |
800 820 0888
|
| Additional Information Email |
<span style="box-sizing: border-box; color: rgb(67, 67, 67); display: inline; flex-wrap: nowrap; font-size: 10.6667px; font-weight: 400; grid-area: auto; line-height: 12.8px; margin: 0px; overflow: visible; text-align: left; text-align-last: auto; white-space-collapse: preserve-breaks;">services@guggenheiminvestments.com</span>
|
| Additional Information Website |
<span style="box-sizing: border-box; color: rgb(67, 67, 67); display: inline; flex-wrap: nowrap; font-size: 10.6667px; font-weight: 400; grid-area: auto; line-height: 12.8px; margin: 0px; overflow: visible; text-align: left; text-align-last: auto; white-space-collapse: preserve-breaks;">GuggenheimInvestments.com/mutual-funds/literature</span>
|
| Expenses [Text Block] |
What were the Fund's costs for the last six months? * Based on a hypothetical $10,000 investment Table SummaryClass | Costs of a $10,000 Investment | Costs Paid as a % of a $10,000 Investment** |
|---|
Class A | $91 | 1.77% |
|---|
Table Summary* | Excludes expenses of the underlying funds in which the fund invests, if any. |
|---|
** | Annualized |
|---|
|
| Expenses Paid, Amount |
$ 91
|
| Factors Affecting Performance [Text Block] |
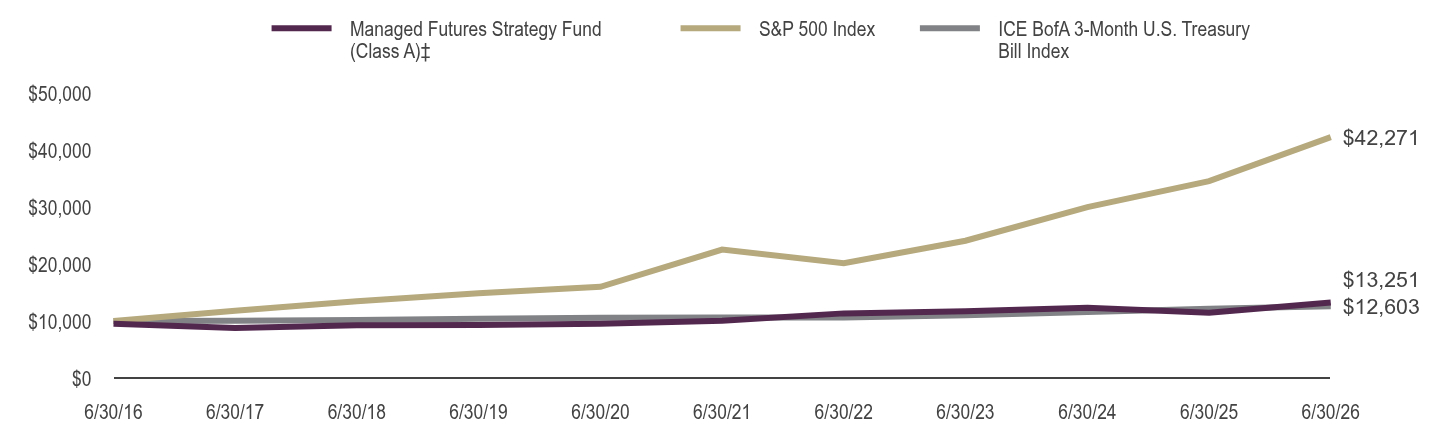
What factors materially affected the Fund's performance over the last six months? The fund's trend-following strategy captures directional moves and gives back gains as trends reverse — H1 2026 showed this, driven by energy. Q1 Commodities dominated as Mideast conflict and closure of a key Gulf route sent crude sharply higher, and the model captured strong trends. These reversed in Q2 as a ceasefire and reopened routes triggered a rapid oil unwind, flipping Energy from top winner to top detractor. Precious Metals compounded this as easing risk, a stronger dollar, and rate shifts drove gold to its worst decline in a decade. Grains/Softs added drag. Equities were steadier, led by Asia/Europe. Overall, the fund posted strong H1 gains, partly reversed in Q2. |
| Line Graph [Table Text Block] |
Table Summary | Managed Futures Strategy Fund (Class A)‡ | S&P 500 Index | ICE BofA 3-Month U.S. Treasury Bill Index |
|---|
6/30/16 | $9,525 | $10,000 | $10,000 |
|---|
6/30/17 | $8,788 | $11,790 | $10,049 |
|---|
6/30/18 | $9,272 | $13,484 | $10,186 |
|---|
6/30/19 | $9,302 | $14,889 | $10,421 |
|---|
6/30/20 | $9,526 | $16,006 | $10,591 |
|---|
6/30/21 | $10,061 | $22,536 | $10,601 |
|---|
6/30/22 | $11,342 | $20,144 | $10,619 |
|---|
6/30/23 | $11,736 | $24,091 | $11,000 |
|---|
6/30/24 | $12,339 | $30,006 | $11,594 |
|---|
6/30/25 | $11,447 | $34,556 | $12,137 |
|---|
6/30/26 | $13,251 | $42,271 | $12,603 |
|---|
|
| AssetsNet |
$ 24,107,027
|
| Holdings Count | Holding |
86
|
| InvestmentCompanyPortfolioTurnover |
0.00%
|
| Additional Fund Statistics [Text Block] |
Fund Statistics as of June 30, 2026 - Net Assets$24,107,027
- Total Number of Portfolio Holdings86
- Portfolio Turnover Rate-%
|
| Holdings [Text Block] |
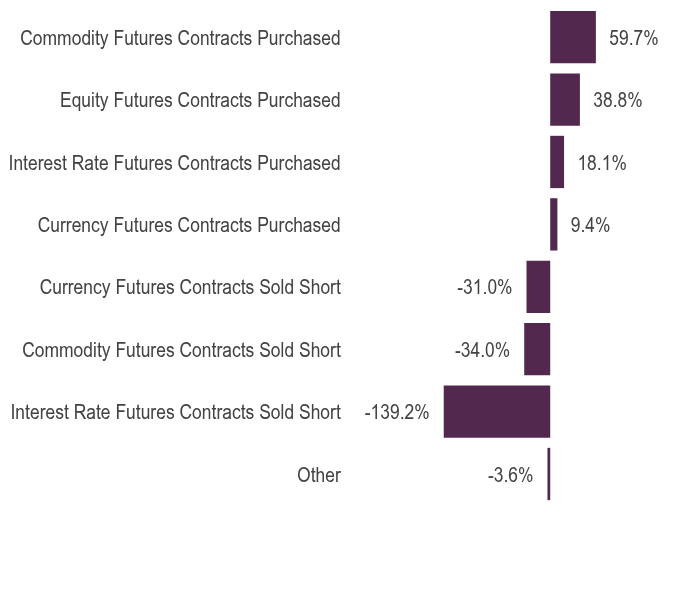
Consolidated Holdings DiversificationFootnote Reference(1) (% of Net Assets) as of June 30, 2026 Table SummaryValue | Value |
|---|
Other | -3.6% | Interest Rate Futures Contracts Sold Short | -139.2% | Commodity Futures Contracts Sold Short | -34.0% | Currency Futures Contracts Sold Short | -31.0% | Currency Futures Contracts Purchased | 9.4% | Interest Rate Futures Contracts Purchased | 18.1% | Equity Futures Contracts Purchased | 38.8% | Commodity Futures Contracts Purchased | 59.7% | |
| Largest Holdings [Text Block] |
Largest HoldingsFootnote Reference(2) (% of Net Assets) as of June 30, 2026 Table SummaryGuggenheim Strategy Fund III | 19.9% |
|---|
Guggenheim Ultra Short Duration Fund — Institutional Class | 10.6% |
|---|
Guggenheim Ultra Short Income ETF | 5.1% |
|---|
Total | 35.6% |
|---|
|
| Material Fund Change [Text Block] |
|
| C000039065 |
|
| Shareholder Report [Line Items] |
|
| Fund Name |
Managed Futures Strategy Fund
|
| Class Name |
Class C
|
| Trading Symbol |
RYMZX
|
| Annual or Semi-Annual Statement [Text Block] |
This semi-annual shareholder report contains important information about the Managed Futures Strategy Fund for the period from January 1, 2026 to June 30, 2026.
|
| Additional Information [Text Block] |
You can find additional information about the fund at GuggenheimInvestments.com/mutual-funds/literature. You can also request this information by contacting 800 820 0888 or services@guggenheiminvestments.com.
|
| Additional Information Phone Number |
800 820 0888
|
| Additional Information Email |
<span style="box-sizing: border-box; color: rgb(67, 67, 67); display: inline; flex-wrap: nowrap; font-size: 10.6667px; font-weight: 400; grid-area: auto; line-height: 12.8px; margin: 0px; overflow: visible; text-align: left; text-align-last: auto; white-space-collapse: preserve-breaks;">services@guggenheiminvestments.com</span>
|
| Additional Information Website |
<span style="box-sizing: border-box; color: rgb(67, 67, 67); display: inline; flex-wrap: nowrap; font-size: 10.6667px; font-weight: 400; grid-area: auto; line-height: 12.8px; margin: 0px; overflow: visible; text-align: left; text-align-last: auto; white-space-collapse: preserve-breaks;">GuggenheimInvestments.com/mutual-funds/literature</span>
|
| Expenses [Text Block] |
What were the Fund's costs for the last six months? * Based on a hypothetical $10,000 investment Table SummaryClass | Costs of a $10,000 Investment | Costs Paid as a % of a $10,000 Investment** |
|---|
Class C | $129 | 2.52% |
|---|
Table Summary* | Excludes expenses of the underlying funds in which the fund invests, if any. |
|---|
** | Annualized |
|---|
|
| Expenses Paid, Amount |
$ 129
|
| Factors Affecting Performance [Text Block] |
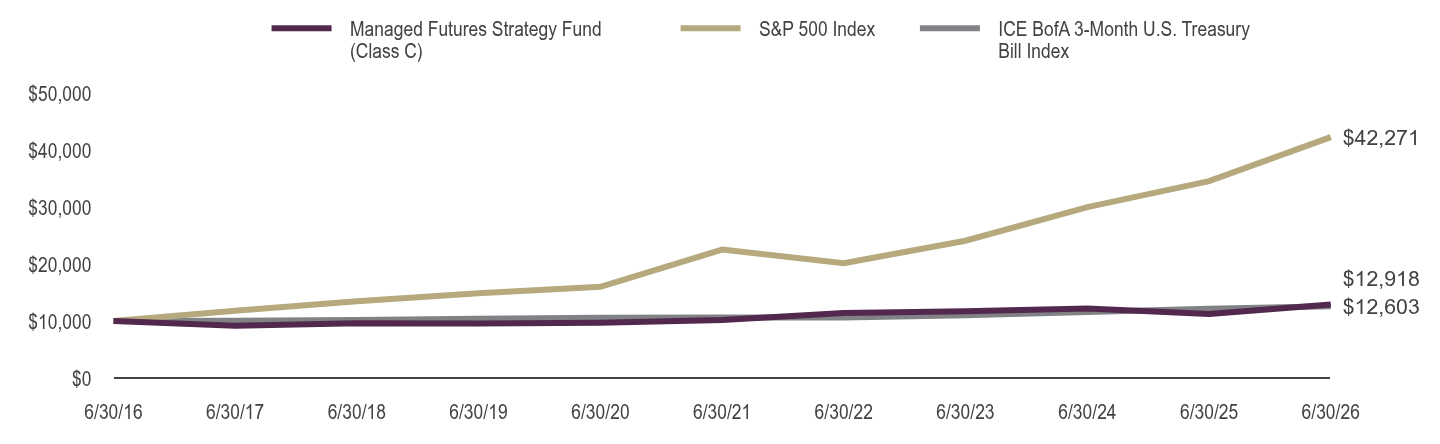
What factors materially affected the Fund's performance over the last six months? The fund's trend-following strategy captures directional moves and gives back gains as trends reverse — H1 2026 showed this, driven by energy. Q1 Commodities dominated as Mideast conflict and closure of a key Gulf route sent crude sharply higher, and the model captured strong trends. These reversed in Q2 as a ceasefire and reopened routes triggered a rapid oil unwind, flipping Energy from top winner to top detractor. Precious Metals compounded this as easing risk, a stronger dollar, and rate shifts drove gold to its worst decline in a decade. Grains/Softs added drag. Equities were steadier, led by Asia/Europe. Overall, the fund posted strong H1 gains, partly reversed in Q2. |
| Line Graph [Table Text Block] |
Table Summary | Managed Futures Strategy Fund (Class C) | S&P 500 Index | ICE BofA 3-Month U.S. Treasury Bill Index |
|---|
6/30/16 | $10,000 | $10,000 | $10,000 |
|---|
6/30/17 | $9,159 | $11,790 | $10,049 |
|---|
6/30/18 | $9,594 | $13,484 | $10,186 |
|---|
6/30/19 | $9,554 | $14,889 | $10,421 |
|---|
6/30/20 | $9,707 | $16,006 | $10,591 |
|---|
6/30/21 | $10,180 | $22,536 | $10,601 |
|---|
6/30/22 | $11,390 | $20,144 | $10,619 |
|---|
6/30/23 | $11,698 | $24,091 | $11,000 |
|---|
6/30/24 | $12,214 | $30,006 | $11,594 |
|---|
6/30/25 | $11,247 | $34,556 | $12,137 |
|---|
6/30/26 | $12,918 | $42,271 | $12,603 |
|---|
|
| AssetsNet |
$ 24,107,027
|
| Holdings Count | Holding |
86
|
| InvestmentCompanyPortfolioTurnover |
0.00%
|
| Additional Fund Statistics [Text Block] |
Fund Statistics as of June 30, 2026 - Net Assets$24,107,027
- Total Number of Portfolio Holdings86
- Portfolio Turnover Rate-%
|
| Holdings [Text Block] |
Consolidated Holdings DiversificationFootnote Reference(1) (% of Net Assets) as of June 30, 2026 Table SummaryValue | Value |
|---|
Other | -3.6% | Interest Rate Futures Contracts Sold Short | -139.2% | Commodity Futures Contracts Sold Short | -34.0% | Currency Futures Contracts Sold Short | -31.0% | Currency Futures Contracts Purchased | 9.4% | Interest Rate Futures Contracts Purchased | 18.1% | Equity Futures Contracts Purchased | 38.8% | Commodity Futures Contracts Purchased | 59.7% | |
| Largest Holdings [Text Block] |
Largest HoldingsFootnote Reference(2) (% of Net Assets) as of June 30, 2026 Table SummaryGuggenheim Strategy Fund III | 19.9% |
|---|
Guggenheim Ultra Short Duration Fund — Institutional Class | 10.6% |
|---|
Guggenheim Ultra Short Income ETF | 5.1% |
|---|
Total | 35.6% |
|---|
|
| Material Fund Change [Text Block] |
|
| C000038557 |
|
| Shareholder Report [Line Items] |
|
| Fund Name |
Managed Futures Strategy Fund
|
| Class Name |
Class P
|
| Trading Symbol |
RYMFX
|
| Annual or Semi-Annual Statement [Text Block] |
This semi-annual shareholder report contains important information about the Managed Futures Strategy Fund for the period from January 1, 2026 to June 30, 2026.
|
| Additional Information [Text Block] |
You can find additional information about the fund at GuggenheimInvestments.com/mutual-funds/literature. You can also request this information by contacting 800 820 0888 or services@guggenheiminvestments.com.
|
| Additional Information Phone Number |
800 820 0888
|
| Additional Information Email |
<span style="box-sizing: border-box; color: rgb(67, 67, 67); display: inline; flex-wrap: nowrap; font-size: 10.6667px; font-weight: 400; grid-area: auto; line-height: 12.8px; margin: 0px; overflow: visible; text-align: left; text-align-last: auto; white-space-collapse: preserve-breaks;">services@guggenheiminvestments.com</span>
|
| Additional Information Website |
<span style="box-sizing: border-box; color: rgb(67, 67, 67); display: inline; flex-wrap: nowrap; font-size: 10.6667px; font-weight: 400; grid-area: auto; line-height: 12.8px; margin: 0px; overflow: visible; text-align: left; text-align-last: auto; white-space-collapse: preserve-breaks;">GuggenheimInvestments.com/mutual-funds/literature</span>
|
| Expenses [Text Block] |
What were the Fund's costs for the last six months? * Based on a hypothetical $10,000 investment Table SummaryClass | Costs of a $10,000 Investment | Costs Paid as a % of a $10,000 Investment** |
|---|
Class P | $91 | 1.77% |
|---|
Table Summary* | Excludes expenses of the underlying funds in which the fund invests, if any. |
|---|
** | Annualized |
|---|
|
| Expenses Paid, Amount |
$ 91
|
| Factors Affecting Performance [Text Block] |
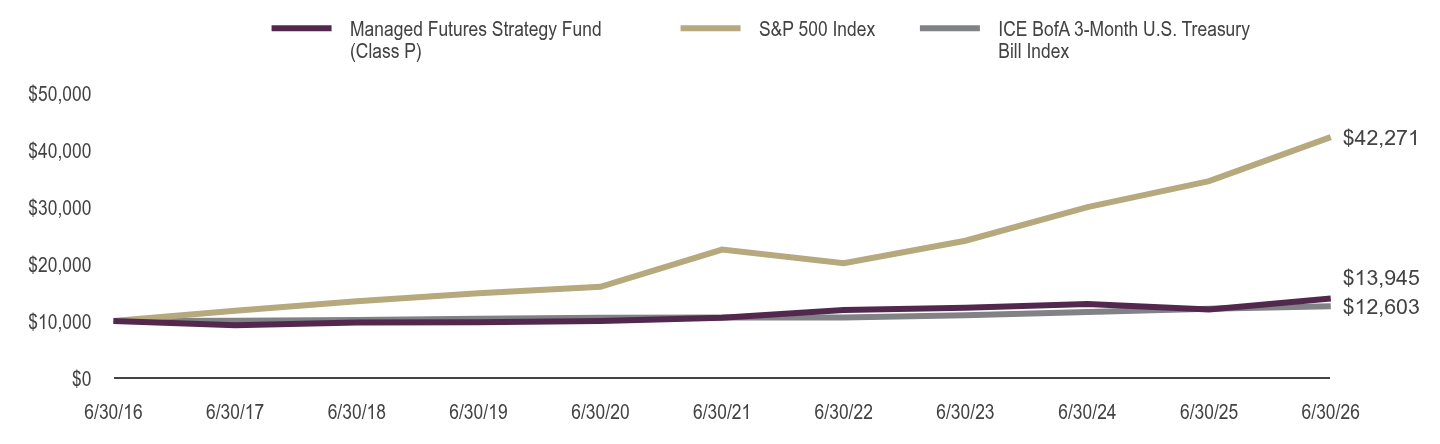
What factors materially affected the Fund's performance over the last six months? The fund's trend-following strategy captures directional moves and gives back gains as trends reverse — H1 2026 showed this, driven by energy. Q1 Commodities dominated as Mideast conflict and closure of a key Gulf route sent crude sharply higher, and the model captured strong trends. These reversed in Q2 as a ceasefire and reopened routes triggered a rapid oil unwind, flipping Energy from top winner to top detractor. Precious Metals compounded this as easing risk, a stronger dollar, and rate shifts drove gold to its worst decline in a decade. Grains/Softs added drag. Equities were steadier, led by Asia/Europe. Overall, the fund posted strong H1 gains, partly reversed in Q2. |
| Line Graph [Table Text Block] |
Table Summary | Managed Futures Strategy Fund (Class P) | S&P 500 Index | ICE BofA 3-Month U.S. Treasury Bill Index |
|---|
6/30/16 | $10,000 | $10,000 | $10,000 |
|---|
6/30/17 | $9,245 | $11,790 | $10,049 |
|---|
6/30/18 | $9,759 | $13,484 | $10,186 |
|---|
6/30/19 | $9,785 | $14,889 | $10,421 |
|---|
6/30/20 | $10,026 | $16,006 | $10,591 |
|---|
6/30/21 | $10,590 | $22,536 | $10,601 |
|---|
6/30/22 | $11,939 | $20,144 | $10,619 |
|---|
6/30/23 | $12,343 | $24,091 | $11,000 |
|---|
6/30/24 | $12,979 | $30,006 | $11,594 |
|---|
6/30/25 | $12,041 | $34,556 | $12,137 |
|---|
6/30/26 | $13,945 | $42,271 | $12,603 |
|---|
|
| AssetsNet |
$ 24,107,027
|
| Holdings Count | Holding |
86
|
| InvestmentCompanyPortfolioTurnover |
0.00%
|
| Additional Fund Statistics [Text Block] |
Fund Statistics as of June 30, 2026 - Net Assets$24,107,027
- Total Number of Portfolio Holdings86
- Portfolio Turnover Rate-%
|
| Holdings [Text Block] |
Consolidated Holdings DiversificationFootnote Reference(1) (% of Net Assets) as of June 30, 2026 Table SummaryValue | Value |
|---|
Other | -3.6% | Interest Rate Futures Contracts Sold Short | -139.2% | Commodity Futures Contracts Sold Short | -34.0% | Currency Futures Contracts Sold Short | -31.0% | Currency Futures Contracts Purchased | 9.4% | Interest Rate Futures Contracts Purchased | 18.1% | Equity Futures Contracts Purchased | 38.8% | Commodity Futures Contracts Purchased | 59.7% | |
| Largest Holdings [Text Block] |
Largest HoldingsFootnote Reference(2) (% of Net Assets) as of June 30, 2026 Table SummaryGuggenheim Strategy Fund III | 19.9% |
|---|
Guggenheim Ultra Short Duration Fund — Institutional Class | 10.6% |
|---|
Guggenheim Ultra Short Income ETF | 5.1% |
|---|
Total | 35.6% |
|---|
|
| Material Fund Change [Text Block] |
|
| C000088408 |
|
| Shareholder Report [Line Items] |
|
| Fund Name |
Managed Futures Strategy Fund
|
| Class Name |
Institutional Class
|
| Trading Symbol |
RYIFX
|
| Annual or Semi-Annual Statement [Text Block] |
This semi-annual shareholder report contains important information about the Managed Futures Strategy Fund for the period from January 1, 2026 to June 30, 2026.
|
| Additional Information [Text Block] |
You can find additional information about the fund at GuggenheimInvestments.com/mutual-funds/literature. You can also request this information by contacting 800 820 0888 or services@guggenheiminvestments.com.
|
| Additional Information Phone Number |
800 820 0888
|
| Additional Information Email |
<span style="box-sizing: border-box; color: rgb(67, 67, 67); display: inline; flex-wrap: nowrap; font-size: 10.6667px; font-weight: 400; grid-area: auto; line-height: 12.8px; margin: 0px; overflow: visible; text-align: left; text-align-last: auto; white-space-collapse: preserve-breaks;">services@guggenheiminvestments.com</span>
|
| Additional Information Website |
<span style="box-sizing: border-box; color: rgb(67, 67, 67); display: inline; flex-wrap: nowrap; font-size: 10.6667px; font-weight: 400; grid-area: auto; line-height: 12.8px; margin: 0px; overflow: visible; text-align: left; text-align-last: auto; white-space-collapse: preserve-breaks;">GuggenheimInvestments.com/mutual-funds/literature</span>
|
| Expenses [Text Block] |
What were the Fund's costs for the last six months? * Based on a hypothetical $10,000 investment Table SummaryClass | Costs of a $10,000 Investment | Costs Paid as a % of a $10,000 Investment** |
|---|
Institutional Class | $78 | 1.52% |
|---|
Table Summary* | Excludes expenses of the underlying funds in which the fund invests, if any. |
|---|
** | Annualized |
|---|
|
| Expenses Paid, Amount |
$ 78
|
| Factors Affecting Performance [Text Block] |
What factors materially affected the Fund's performance over the last six months? The fund's trend-following strategy captures directional moves and gives back gains as trends reverse — H1 2026 showed this, driven by energy. Q1 Commodities dominated as Mideast conflict and closure of a key Gulf route sent crude sharply higher, and the model captured strong trends. These reversed in Q2 as a ceasefire and reopened routes triggered a rapid oil unwind, flipping Energy from top winner to top detractor. Precious Metals compounded this as easing risk, a stronger dollar, and rate shifts drove gold to its worst decline in a decade. Grains/Softs added drag. Equities were steadier, led by Asia/Europe. Overall, the fund posted strong H1 gains, partly reversed in Q2. |
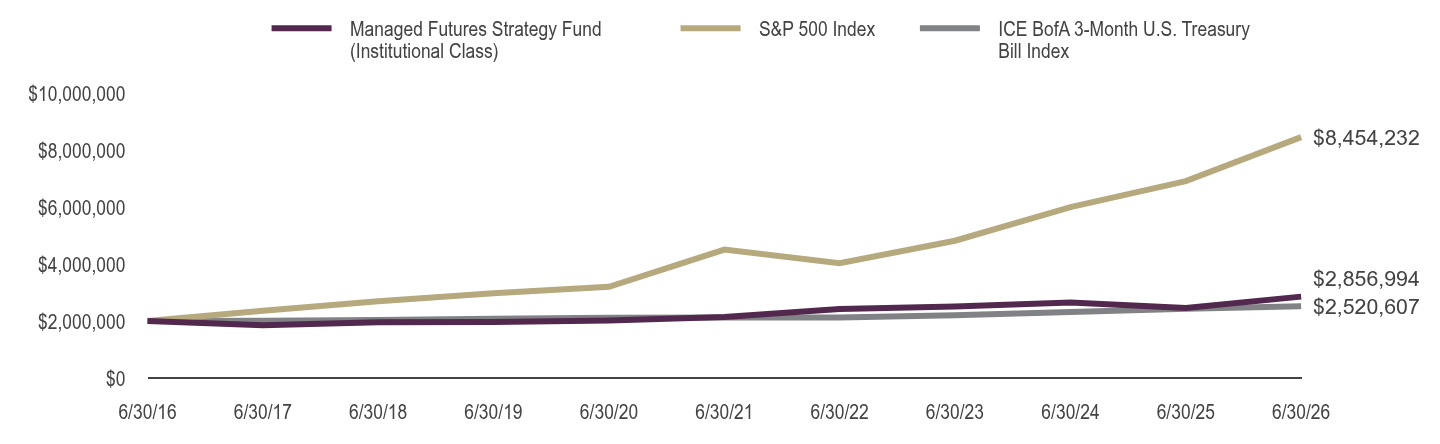
| Line Graph [Table Text Block] |
Table Summary | Managed Futures Strategy Fund (Institutional Class) | S&P 500 Index | ICE BofA 3-Month U.S. Treasury Bill Index |
|---|
6/30/16 | $2,000,000 | $2,000,000 | $2,000,000 |
|---|
6/30/17 | $1,849,450 | $2,357,922 | $2,009,724 |
|---|
6/30/18 | $1,957,440 | $2,696,851 | $2,037,104 |
|---|
6/30/19 | $1,968,731 | $2,977,793 | $2,084,221 |
|---|
6/30/20 | $2,021,080 | $3,201,279 | $2,118,170 |
|---|
6/30/21 | $2,139,475 | $4,507,213 | $2,120,167 |
|---|
6/30/22 | $2,418,104 | $4,028,737 | $2,123,727 |
|---|
6/30/23 | $2,509,715 | $4,818,129 | $2,200,046 |
|---|
6/30/24 | $2,646,891 | $6,001,274 | $2,318,882 |
|---|
6/30/25 | $2,461,741 | $6,911,288 | $2,427,414 |
|---|
6/30/26 | $2,856,994 | $8,454,232 | $2,520,607 |
|---|
|
| AssetsNet |
$ 24,107,027
|
| Holdings Count | Holding |
86
|
| InvestmentCompanyPortfolioTurnover |
0.00%
|
| Additional Fund Statistics [Text Block] |
Fund Statistics as of June 30, 2026 - Net Assets$24,107,027
- Total Number of Portfolio Holdings86
- Portfolio Turnover Rate-%
|
| Holdings [Text Block] |
Consolidated Holdings DiversificationFootnote Reference(1) (% of Net Assets) as of June 30, 2026 Table SummaryValue | Value |
|---|
Other | -3.6% | Interest Rate Futures Contracts Sold Short | -139.2% | Commodity Futures Contracts Sold Short | -34.0% | Currency Futures Contracts Sold Short | -31.0% | Currency Futures Contracts Purchased | 9.4% | Interest Rate Futures Contracts Purchased | 18.1% | Equity Futures Contracts Purchased | 38.8% | Commodity Futures Contracts Purchased | 59.7% | |
| Largest Holdings [Text Block] |
Largest HoldingsFootnote Reference(2) (% of Net Assets) as of June 30, 2026 Table SummaryGuggenheim Strategy Fund III | 19.9% |
|---|
Guggenheim Ultra Short Duration Fund — Institutional Class | 10.6% |
|---|
Guggenheim Ultra Short Income ETF | 5.1% |
|---|
Total | 35.6% |
|---|
|
| Material Fund Change [Text Block] |
|
| C000010439 |
|
| Shareholder Report [Line Items] |
|
| Fund Name |
Multi-Hedge Strategies Fund
|
| Class Name |
Class A
|
| Trading Symbol |
RYMQX
|
| Annual or Semi-Annual Statement [Text Block] |
This semi-annual shareholder report contains important information about the Multi-Hedge Strategies Fund for the period from January 1, 2026 to June 30, 2026.
|
| Additional Information [Text Block] |
You can find additional information about the fund at GuggenheimInvestments.com/mutual-funds/literature. You can also request this information by contacting 800 820 0888 or services@guggenheiminvestments.com.
|
| Additional Information Phone Number |
800 820 0888
|
| Additional Information Email |
<span style="box-sizing: border-box; color: rgb(67, 67, 67); display: inline; flex-wrap: nowrap; font-size: 10.6667px; font-weight: 400; grid-area: auto; line-height: 12.8px; margin: 0px; overflow: visible; text-align: left; text-align-last: auto; white-space-collapse: preserve-breaks;">services@guggenheiminvestments.com</span>
|
| Additional Information Website |
<span style="box-sizing: border-box; color: rgb(67, 67, 67); display: inline; flex-wrap: nowrap; font-size: 10.6667px; font-weight: 400; grid-area: auto; line-height: 12.8px; margin: 0px; overflow: visible; text-align: left; text-align-last: auto; white-space-collapse: preserve-breaks;">GuggenheimInvestments.com/mutual-funds/literature</span>
|
| Expenses [Text Block] |
What were the Fund's costs for the last six months? * Based on a hypothetical $10,000 investment Table SummaryClass | Costs of a $10,000 Investment | Costs Paid as a % of a $10,000 Investment** |
|---|
Class A | $81 | 1.59% |
|---|
Table Summary* | Excludes expenses of the underlying funds in which the fund invests, if any. |
|---|
** | Annualized |
|---|
|
| Expenses Paid, Amount |
$ 81
|
| Factors Affecting Performance [Text Block] |
What factors materially affected the Fund's performance over the last six months? The fund's global macro strategies were the largest contributor during the period, with Trend (managed futures beta), Premia (Carry, Flow, and Value), and Core (multi-strategy beta) all posting positive contributions. Long/short equity was the second largest contributor and top performer in the first half, driven by fundamental (momentum, value) and industry (IT) tilts. Closed-end fund arbitrage also had modest positive contributions as none of the strategies in the fund detracted from performance over this period. |
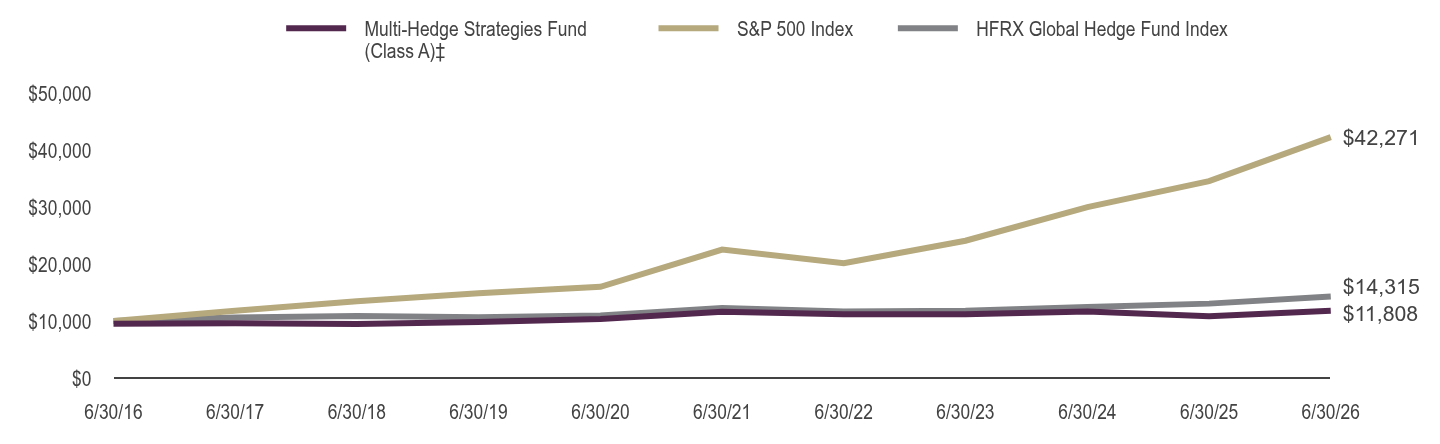
| Line Graph [Table Text Block] |
Table Summary | Multi-Hedge Strategies Fund (Class A)‡ | S&P 500 Index | HFRX Global Hedge Fund Index |
|---|
6/30/16 | $9,525 | $10,000 | $10,000 |
|---|
6/30/17 | $9,589 | $11,790 | $10,600 |
|---|
6/30/18 | $9,482 | $13,484 | $10,862 |
|---|
6/30/19 | $9,816 | $14,889 | $10,650 |
|---|
6/30/20 | $10,358 | $16,006 | $10,979 |
|---|
6/30/21 | $11,641 | $22,536 | $12,298 |
|---|
6/30/22 | $11,198 | $20,144 | $11,669 |
|---|
6/30/23 | $11,195 | $24,091 | $11,822 |
|---|
6/30/24 | $11,670 | $30,006 | $12,462 |
|---|
6/30/25 | $10,850 | $34,556 | $13,054 |
|---|
6/30/26 | $11,808 | $42,271 | $14,315 |
|---|
|
| AssetsNet |
$ 9,200,795
|
| Holdings Count | Holding |
325
|
| InvestmentCompanyPortfolioTurnover |
65.00%
|
| Additional Fund Statistics [Text Block] |
Fund Statistics as of June 30, 2026 - Net Assets$9,200,795
- Total Number of Portfolio Holdings325
- Portfolio Turnover Rate65%
|
| Holdings [Text Block] |
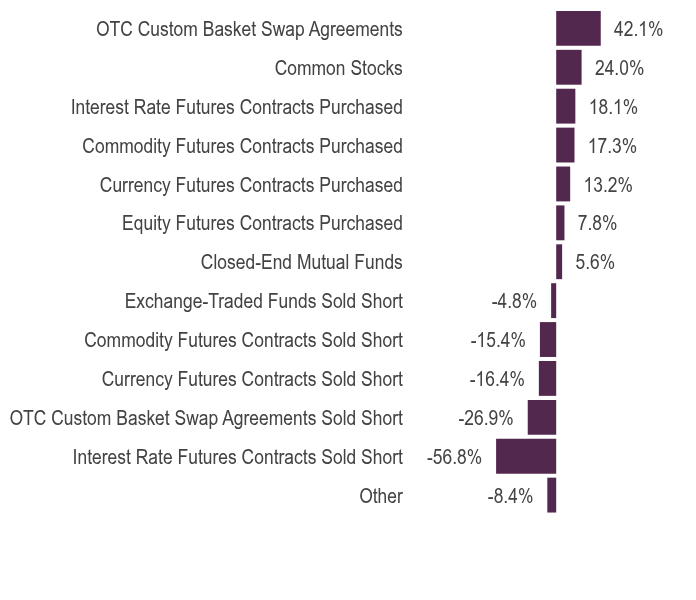
Consolidated Holdings DiversificationFootnote Reference(1) (% of Net Assets) as of June 30, 2026 Table SummaryValue | Value |
|---|
Other | -8.4% | Interest Rate Futures Contracts Sold Short | -56.8% | OTC Custom Basket Swap Agreements Sold Short | -26.9% | Currency Futures Contracts Sold Short | -16.4% | Commodity Futures Contracts Sold Short | -15.4% | Exchange-Traded Funds Sold Short | -4.8% | Closed-End Mutual Funds | 5.6% | Equity Futures Contracts Purchased | 7.8% | Currency Futures Contracts Purchased | 13.2% | Commodity Futures Contracts Purchased | 17.3% | Interest Rate Futures Contracts Purchased | 18.1% | Common Stocks | 24.0% | OTC Custom Basket Swap Agreements | 42.1% | |
| Largest Holdings [Text Block] |
10 Largest HoldingsFootnote Reference(2) (% of Net Assets) as of June 30, 2026 Table SummaryGuggenheim Ultra Short Duration Fund — Institutional Class | 12.5% |
|---|
Guggenheim Strategy Fund III | 7.0% |
|---|
Guggenheim Ultra Short Income ETF | 5.0% |
|---|
Chart Industries, Inc. | 2.4% |
|---|
Norfolk Southern Corp. | 1.3% |
|---|
Electronic Arts, Inc. | 1.3% |
|---|
International Money Express, Inc. | 1.3% |
|---|
Janus Henderson Group plc | 1.2% |
|---|
TXNM Energy, Inc. | 1.1% |
|---|
DigitalBridge Group, Inc. | 1.1% |
|---|
Total | 34.2% |
|---|
|
| Material Fund Change [Text Block] |
|
| C000010440 |
|
| Shareholder Report [Line Items] |
|
| Fund Name |
Multi-Hedge Strategies Fund
|
| Class Name |
Class C
|
| Trading Symbol |
RYMRX
|
| Annual or Semi-Annual Statement [Text Block] |
This semi-annual shareholder report contains important information about the Multi-Hedge Strategies Fund for the period from January 1, 2026 to June 30, 2026.
|
| Additional Information [Text Block] |
You can find additional information about the fund at GuggenheimInvestments.com/mutual-funds/literature. You can also request this information by contacting 800 820 0888 or services@guggenheiminvestments.com.
|
| Additional Information Phone Number |
800 820 0888
|
| Additional Information Email |
<span style="box-sizing: border-box; color: rgb(67, 67, 67); display: inline; flex-wrap: nowrap; font-size: 10.6667px; font-weight: 400; grid-area: auto; line-height: 12.8px; margin: 0px; overflow: visible; text-align: left; text-align-last: auto; white-space-collapse: preserve-breaks;">services@guggenheiminvestments.com</span>
|
| Additional Information Website |
<span style="box-sizing: border-box; color: rgb(67, 67, 67); display: inline; flex-wrap: nowrap; font-size: 10.6667px; font-weight: 400; grid-area: auto; line-height: 12.8px; margin: 0px; overflow: visible; text-align: left; text-align-last: auto; white-space-collapse: preserve-breaks;">GuggenheimInvestments.com/mutual-funds/literature</span>
|
| Expenses [Text Block] |
What were the Fund's costs for the last six months? * Based on a hypothetical $10,000 investment Table SummaryClass | Costs of a $10,000 Investment | Costs Paid as a % of a $10,000 Investment** |
|---|
Class C | $119 | 2.35% |
|---|
Table Summary* | Excludes expenses of the underlying funds in which the fund invests, if any. |
|---|
** | Annualized |
|---|
|
| Expenses Paid, Amount |
$ 119
|
| Factors Affecting Performance [Text Block] |
What factors materially affected the Fund's performance over the last six months? The fund's global macro strategies were the largest contributor during the period, with Trend (managed futures beta), Premia (Carry, Flow, and Value), and Core (multi-strategy beta) all posting positive contributions. Long/short equity was the second largest contributor and top performer in the first half, driven by fundamental (momentum, value) and industry (IT) tilts. Closed-end fund arbitrage also had modest positive contributions as none of the strategies in the fund detracted from performance over this period. |
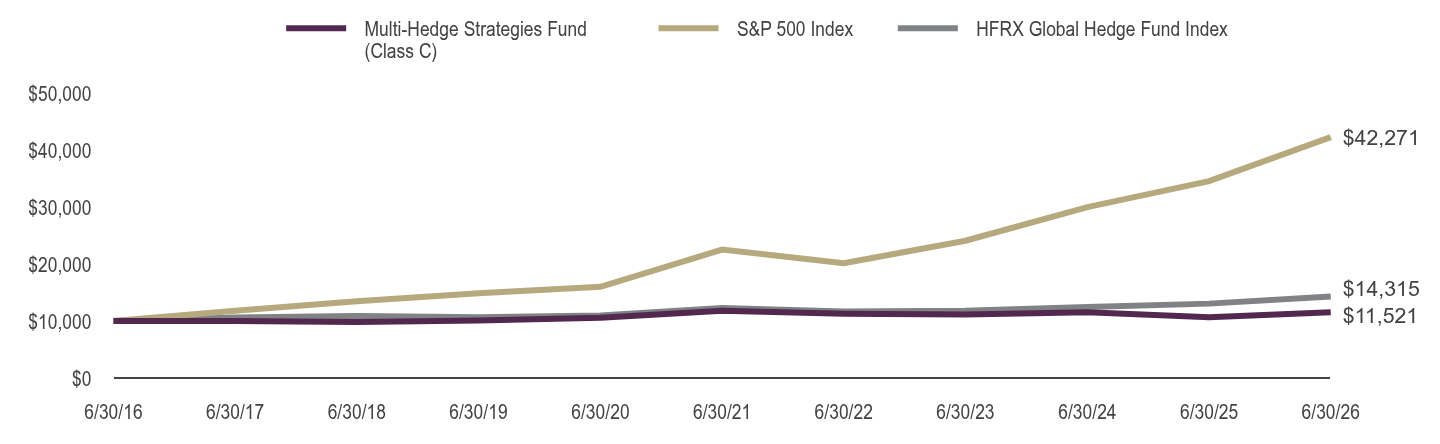
| Line Graph [Table Text Block] |
Table Summary | Multi-Hedge Strategies Fund (Class C) | S&P 500 Index | HFRX Global Hedge Fund Index |
|---|
6/30/16 | $10,000 | $10,000 | $10,000 |
|---|
6/30/17 | $9,994 | $11,790 | $10,600 |
|---|
6/30/18 | $9,808 | $13,484 | $10,862 |
|---|
6/30/19 | $10,089 | $14,889 | $10,650 |
|---|
6/30/20 | $10,565 | $16,006 | $10,979 |
|---|
6/30/21 | $11,784 | $22,536 | $12,298 |
|---|
6/30/22 | $11,256 | $20,144 | $11,669 |
|---|
6/30/23 | $11,166 | $24,091 | $11,822 |
|---|
6/30/24 | $11,557 | $30,006 | $12,462 |
|---|
6/30/25 | $10,663 | $34,556 | $13,054 |
|---|
6/30/26 | $11,521 | $42,271 | $14,315 |
|---|
|
| AssetsNet |
$ 9,200,795
|
| Holdings Count | Holding |
325
|
| InvestmentCompanyPortfolioTurnover |
65.00%
|
| Additional Fund Statistics [Text Block] |
Fund Statistics as of June 30, 2026 - Net Assets$9,200,795
- Total Number of Portfolio Holdings325
- Portfolio Turnover Rate65%
|
| Holdings [Text Block] |
Consolidated Holdings DiversificationFootnote Reference(1) (% of Net Assets) as of June 30, 2026 Table SummaryValue | Value |
|---|
Other | -8.4% | Interest Rate Futures Contracts Sold Short | -56.8% | OTC Custom Basket Swap Agreements Sold Short | -26.9% | Currency Futures Contracts Sold Short | -16.4% | Commodity Futures Contracts Sold Short | -15.4% | Exchange-Traded Funds Sold Short | -4.8% | Closed-End Mutual Funds | 5.6% | Equity Futures Contracts Purchased | 7.8% | Currency Futures Contracts Purchased | 13.2% | Commodity Futures Contracts Purchased | 17.3% | Interest Rate Futures Contracts Purchased | 18.1% | Common Stocks | 24.0% | OTC Custom Basket Swap Agreements | 42.1% | |
| Largest Holdings [Text Block] |
10 Largest HoldingsFootnote Reference(2) (% of Net Assets) as of June 30, 2026 Table SummaryGuggenheim Ultra Short Duration Fund — Institutional Class | 12.5% |
|---|
Guggenheim Strategy Fund III | 7.0% |
|---|
Guggenheim Ultra Short Income ETF | 5.0% |
|---|
Chart Industries, Inc. | 2.4% |
|---|
Norfolk Southern Corp. | 1.3% |
|---|
Electronic Arts, Inc. | 1.3% |
|---|
International Money Express, Inc. | 1.3% |
|---|
Janus Henderson Group plc | 1.2% |
|---|
TXNM Energy, Inc. | 1.1% |
|---|
DigitalBridge Group, Inc. | 1.1% |
|---|
Total | 34.2% |
|---|
|
| Material Fund Change [Text Block] |
|
| C000010438 |
|
| Shareholder Report [Line Items] |
|
| Fund Name |
Multi-Hedge Strategies Fund
|
| Class Name |
Class P
|
| Trading Symbol |
RYMSX
|
| Annual or Semi-Annual Statement [Text Block] |
This semi-annual shareholder report contains important information about the Multi-Hedge Strategies Fund for the period from January 1, 2026 to June 30, 2026.
|
| Additional Information [Text Block] |
You can find additional information about the fund at GuggenheimInvestments.com/mutual-funds/literature. You can also request this information by contacting 800 820 0888 or services@guggenheiminvestments.com.
|
| Additional Information Phone Number |
800 820 0888
|
| Additional Information Email |
<span style="box-sizing: border-box; color: rgb(67, 67, 67); display: inline; flex-wrap: nowrap; font-size: 10.6667px; font-weight: 400; grid-area: auto; line-height: 12.8px; margin: 0px; overflow: visible; text-align: left; text-align-last: auto; white-space-collapse: preserve-breaks;">services@guggenheiminvestments.com</span>
|
| Additional Information Website |
<span style="box-sizing: border-box; color: rgb(67, 67, 67); display: inline; flex-wrap: nowrap; font-size: 10.6667px; font-weight: 400; grid-area: auto; line-height: 12.8px; margin: 0px; overflow: visible; text-align: left; text-align-last: auto; white-space-collapse: preserve-breaks;">GuggenheimInvestments.com/mutual-funds/literature</span>
|
| Expenses [Text Block] |
What were the Fund's costs for the last six months? * Based on a hypothetical $10,000 investment Table SummaryClass | Costs of a $10,000 Investment | Costs Paid as a % of a $10,000 Investment** |
|---|
Class P | $81 | 1.60% |
|---|
Table Summary* | Excludes expenses of the underlying funds in which the fund invests, if any. |
|---|
** | Annualized |
|---|
|
| Expenses Paid, Amount |
$ 81
|
| Factors Affecting Performance [Text Block] |
What factors materially affected the Fund's performance over the last six months? The fund's global macro strategies were the largest contributor during the period, with Trend (managed futures beta), Premia (Carry, Flow, and Value), and Core (multi-strategy beta) all posting positive contributions. Long/short equity was the second largest contributor and top performer in the first half, driven by fundamental (momentum, value) and industry (IT) tilts. Closed-end fund arbitrage also had modest positive contributions as none of the strategies in the fund detracted from performance over this period. |
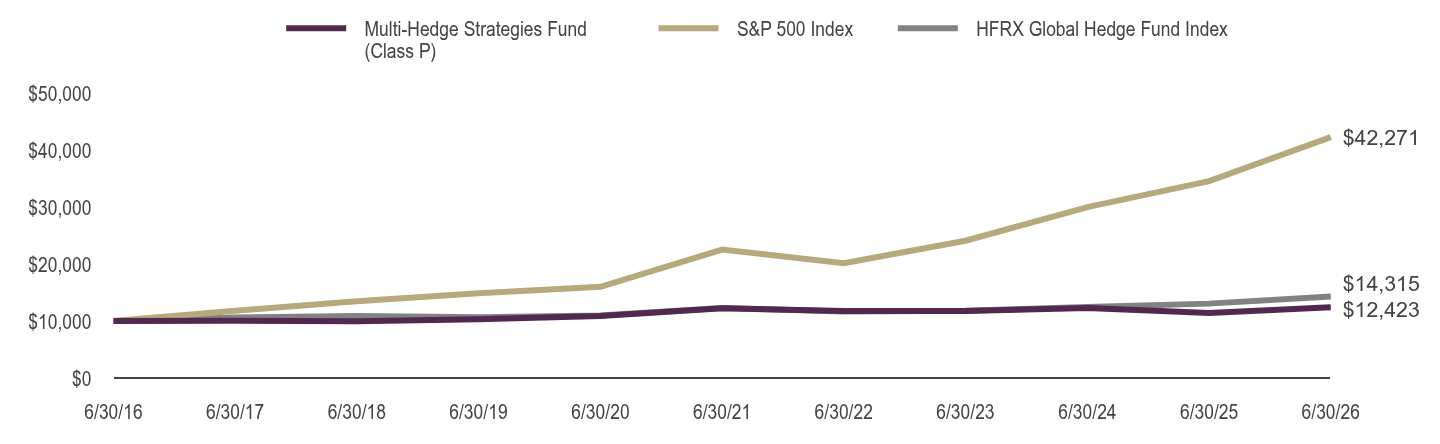
| Line Graph [Table Text Block] |
Table Summary | Multi-Hedge Strategies Fund (Class P) | S&P 500 Index | HFRX Global Hedge Fund Index |
|---|
6/30/16 | $10,000 | $10,000 | $10,000 |
|---|
6/30/17 | $10,069 | $11,790 | $10,600 |
|---|
6/30/18 | $9,969 | $13,484 | $10,862 |
|---|
6/30/19 | $10,329 | $14,889 | $10,650 |
|---|
6/30/20 | $10,898 | $16,006 | $10,979 |
|---|
6/30/21 | $12,242 | $22,536 | $12,298 |
|---|
6/30/22 | $11,779 | $20,144 | $11,669 |
|---|
6/30/23 | $11,778 | $24,091 | $11,822 |
|---|
6/30/24 | $12,276 | $30,006 | $12,462 |
|---|
6/30/25 | $11,417 | $34,556 | $13,054 |
|---|
6/30/26 | $12,423 | $42,271 | $14,315 |
|---|
|
| AssetsNet |
$ 9,200,795
|
| Holdings Count | Holding |
325
|
| InvestmentCompanyPortfolioTurnover |
65.00%
|
| Additional Fund Statistics [Text Block] |
Fund Statistics as of June 30, 2026 - Net Assets$9,200,795
- Total Number of Portfolio Holdings325
- Portfolio Turnover Rate65%
|
| Holdings [Text Block] |
Consolidated Holdings DiversificationFootnote Reference(1) (% of Net Assets) as of June 30, 2026 Table SummaryValue | Value |
|---|
Other | -8.4% | Interest Rate Futures Contracts Sold Short | -56.8% | OTC Custom Basket Swap Agreements Sold Short | -26.9% | Currency Futures Contracts Sold Short | -16.4% | Commodity Futures Contracts Sold Short | -15.4% | Exchange-Traded Funds Sold Short | -4.8% | Closed-End Mutual Funds | 5.6% | Equity Futures Contracts Purchased | 7.8% | Currency Futures Contracts Purchased | 13.2% | Commodity Futures Contracts Purchased | 17.3% | Interest Rate Futures Contracts Purchased | 18.1% | Common Stocks | 24.0% | OTC Custom Basket Swap Agreements | 42.1% | |
| Largest Holdings [Text Block] |
10 Largest HoldingsFootnote Reference(2) (% of Net Assets) as of June 30, 2026 Table SummaryGuggenheim Ultra Short Duration Fund — Institutional Class | 12.5% |
|---|
Guggenheim Strategy Fund III | 7.0% |
|---|
Guggenheim Ultra Short Income ETF | 5.0% |
|---|
Chart Industries, Inc. | 2.4% |
|---|
Norfolk Southern Corp. | 1.3% |
|---|
Electronic Arts, Inc. | 1.3% |
|---|
International Money Express, Inc. | 1.3% |
|---|
Janus Henderson Group plc | 1.2% |
|---|
TXNM Energy, Inc. | 1.1% |
|---|
DigitalBridge Group, Inc. | 1.1% |
|---|
Total | 34.2% |
|---|
|
| Material Fund Change [Text Block] |
|
| C000088407 |
|
| Shareholder Report [Line Items] |
|
| Fund Name |
Multi-Hedge Strategies Fund
|
| Class Name |
Institutional Class
|
| Trading Symbol |
RYIMX
|
| Annual or Semi-Annual Statement [Text Block] |
This semi-annual shareholder report contains important information about the Multi-Hedge Strategies Fund for the period from January 1, 2026 to June 30, 2026.
|
| Additional Information [Text Block] |
You can find additional information about the fund at GuggenheimInvestments.com/mutual-funds/literature. You can also request this information by contacting 800 820 0888 or services@guggenheiminvestments.com.
|
| Additional Information Phone Number |
800 820 0888
|
| Additional Information Email |
<span style="box-sizing: border-box; color: rgb(67, 67, 67); display: inline; flex-wrap: nowrap; font-size: 10.6667px; font-weight: 400; grid-area: auto; line-height: 12.8px; margin: 0px; overflow: visible; text-align: left; text-align-last: auto; white-space-collapse: preserve-breaks;">services@guggenheiminvestments.com</span>
|
| Additional Information Website |
<span style="box-sizing: border-box; color: rgb(67, 67, 67); display: inline; flex-wrap: nowrap; font-size: 10.6667px; font-weight: 400; grid-area: auto; line-height: 12.8px; margin: 0px; overflow: visible; text-align: left; text-align-last: auto; white-space-collapse: preserve-breaks;">GuggenheimInvestments.com/mutual-funds/literature</span>
|
| Expenses [Text Block] |
What were the Fund's costs for the last six months? * Based on a hypothetical $10,000 investment Table SummaryClass | Costs of a $10,000 Investment | Costs Paid as a % of a $10,000 Investment** |
|---|
Institutional Class | $68 | 1.34% |
|---|
Table Summary* | Excludes expenses of the underlying funds in which the fund invests, if any. |
|---|
** | Annualized |
|---|
|
| Expenses Paid, Amount |
$ 68
|
| Factors Affecting Performance [Text Block] |
What factors materially affected the Fund's performance over the last six months? The fund's global macro strategies were the largest contributor during the period, with Trend (managed futures beta), Premia (Carry, Flow, and Value), and Core (multi-strategy beta) all posting positive contributions. Long/short equity was the second largest contributor and top performer in the first half, driven by fundamental (momentum, value) and industry (IT) tilts. Closed-end fund arbitrage also had modest positive contributions as none of the strategies in the fund detracted from performance over this period. |
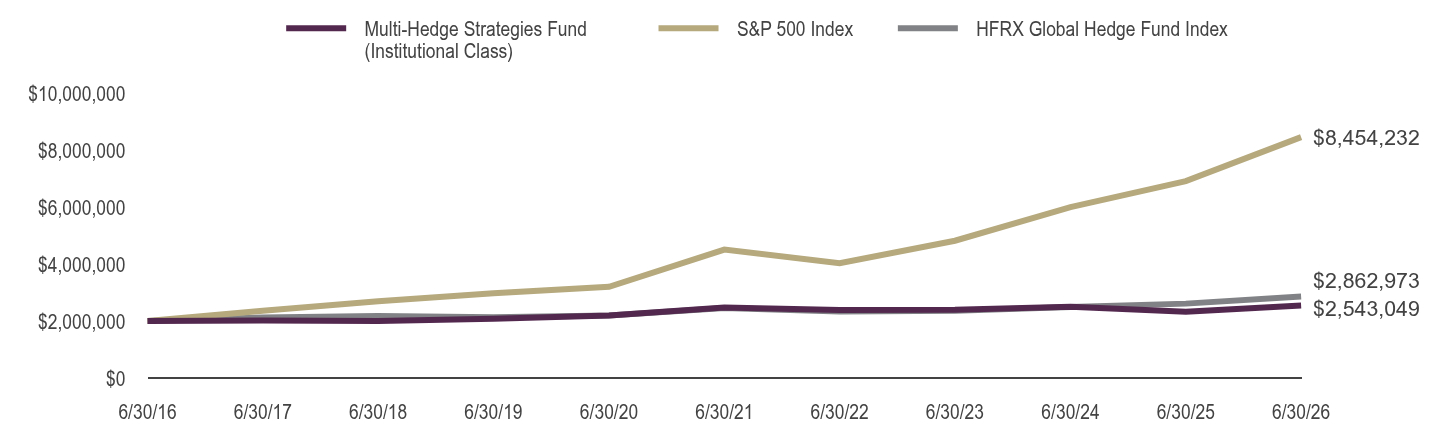
| Line Graph [Table Text Block] |
Table Summary | Multi-Hedge Strategies Fund (Institutional Class) | S&P 500 Index | HFRX Global Hedge Fund Index |
|---|
6/30/16 | $2,000,000 | $2,000,000 | $2,000,000 |
|---|
6/30/17 | $2,018,536 | $2,357,922 | $2,120,031 |
|---|
6/30/18 | $1,999,633 | $2,696,851 | $2,172,471 |
|---|
6/30/19 | $2,076,638 | $2,977,793 | $2,130,079 |
|---|
6/30/20 | $2,196,968 | $3,201,279 | $2,195,866 |
|---|
6/30/21 | $2,474,269 | $4,507,213 | $2,459,613 |
|---|
6/30/22 | $2,386,753 | $4,028,737 | $2,333,708 |
|---|
6/30/23 | $2,392,381 | $4,818,129 | $2,364,317 |
|---|
6/30/24 | $2,499,636 | $6,001,274 | $2,492,455 |
|---|
6/30/25 | $2,329,692 | $6,911,288 | $2,610,802 |
|---|
6/30/26 | $2,543,049 | $8,454,232 | $2,862,973 |
|---|
|
| AssetsNet |
$ 9,200,795
|
| Holdings Count | Holding |
325
|
| InvestmentCompanyPortfolioTurnover |
65.00%
|
| Additional Fund Statistics [Text Block] |
Fund Statistics as of June 30, 2026 - Net Assets$9,200,795
- Total Number of Portfolio Holdings325
- Portfolio Turnover Rate65%
|
| Holdings [Text Block] |
Consolidated Holdings DiversificationFootnote Reference(1) (% of Net Assets) as of June 30, 2026 Table SummaryValue | Value |
|---|
Other | -8.4% | Interest Rate Futures Contracts Sold Short | -56.8% | OTC Custom Basket Swap Agreements Sold Short | -26.9% | Currency Futures Contracts Sold Short | -16.4% | Commodity Futures Contracts Sold Short | -15.4% | Exchange-Traded Funds Sold Short | -4.8% | Closed-End Mutual Funds | 5.6% | Equity Futures Contracts Purchased | 7.8% | Currency Futures Contracts Purchased | 13.2% | Commodity Futures Contracts Purchased | 17.3% | Interest Rate Futures Contracts Purchased | 18.1% | Common Stocks | 24.0% | OTC Custom Basket Swap Agreements | 42.1% | |
| Largest Holdings [Text Block] |
10 Largest HoldingsFootnote Reference(2) (% of Net Assets) as of June 30, 2026 Table SummaryGuggenheim Ultra Short Duration Fund — Institutional Class | 12.5% |
|---|
Guggenheim Strategy Fund III | 7.0% |
|---|
Guggenheim Ultra Short Income ETF | 5.0% |
|---|
Chart Industries, Inc. | 2.4% |
|---|
Norfolk Southern Corp. | 1.3% |
|---|
Electronic Arts, Inc. | 1.3% |
|---|
International Money Express, Inc. | 1.3% |
|---|
Janus Henderson Group plc | 1.2% |
|---|
TXNM Energy, Inc. | 1.1% |
|---|
DigitalBridge Group, Inc. | 1.1% |
|---|
Total | 34.2% |
|---|
|
| Material Fund Change [Text Block] |
|