Certain statements included in this presentation and the accompanying Helly Hansen Investor Day presentation materials, and certain oral statements made at the Helly Hansen Investor Day, are “forward-looking statements” within the meaning of the federal securities laws. Forward-looking statements are made based on our expectations and beliefs concerning future events impacting the Company and therefore involve several risks and uncertainties. You can identify these statements by the fact that they use words such as “will,” “anticipate,” “estimate,” “expect,” “should,” “may” and other words and terms of similar meaning or use of future dates. We caution that forward-looking statements are not guarantees and that actual results could differ materially from those expressed or implied in the forward-looking statements. We do not intend to update any of these forward-looking statements or publicly announce the results of any revisions to these forward- looking statements, other than as required under the U.S. federal securities laws. Potential risks and uncertainties that could cause the actual results of operations or financial condition of the Company to differ materially from those expressed or implied by forward-looking statements in this presentation include, but are not limited to: macroeconomic conditions, including uneven or weakening consumer demand, fluctuating foreign currency exchange rates, inflation and global supply chain issues, as well as the ongoing impact of tariffs and uncertainty regarding the outcome of trade negotiations, import/export regulations and tariff policies, continue to adversely impact global economic conditions and have had, and may continue to have, a negative impact on the Company’s business, results of operations, financial condition and cash flows (including future uncertain impacts); the level of consumer demand for apparel; reliance on a small number of large customers; potential difficulty in integrating Helly Hansen and/or in achieving the expected growth, cost savings and/or synergies from the acquisition; potential risks and uncertainties in completing the sale of the Lee business, if at all, and potential risks in segregating and disposing of the Lee business and the Company’s ability to mitigate any stranded costs from the potential disposition; supply chain and shipping disruptions, which could continue to result in shipping delays, an increase in transportation costs and increased product costs or lost sales; intense industry competition; the ability to accurately forecast demand for products; the Company’s ability to gauge consumer preferences and product trends, and to respond to constantly changing markets; the Company’s ability to maintain the images of its brands; disruption and volatility in the global capital and credit markets and its impact on the Company’s ability to obtain short-term or long-term financing on favorable terms; the Company maintaining satisfactory credit ratings; restrictions on the Company’s business relating to its debt obligations; increasing pressure on margins; e- commerce operations through the Company’s direct-to-consumer business; the financial difficulty experienced by the retail industry; possible goodwill and other asset impairment; the ability to implement the Company’s business strategy; the stability of manufacturing facilities and foreign suppliers; fluctuations in wage rates and the price, availability and quality of raw materials and contracted products, including as a result of tariffs and reciprocal tariffs; the reliance on a limited number of suppliers for raw material sourcing and the ability to obtain raw materials on a timely basis or in sufficient quantity or quality; disruption to distribution systems; seasonality; unseasonal or severe weather conditions; potential challenges with the Company’s implementation of Project Jeanius; the Company’s and its vendors’ ability to maintain the strength and security of information technology systems; the risk that facilities and systems and those of third-party service providers may be vulnerable to and unable to anticipate or detect data security breaches and data or financial loss or maintain operational performance; ability to properly collect, use, manage and secure consumer and employee data; legal, regulatory, political and economic risks; the impact of climate change and related legislative and regulatory responses; stakeholder response to sustainability issues, including those related to climate change; compliance with anti-bribery, anti-corruption and anti-money laundering laws by the Company and third-party suppliers and manufacturers; changes in tax laws and liabilities; the costs of compliance with or the violation of national, state and local laws and regulations for environmental, consumer protection, employment, privacy, safety and other matters; continuity of members of management; labor relations; the ability to protect trademarks and other intellectual property rights; the ability of the Company’s licensees to generate expected sales and maintain the value of the Company’s brands; volatility in the price and trading volume of the Company’s common stock; anti-takeover provisions in the Company’s organizational documents; market conditions, timing and ability to institute an appropriate Accelerated Share Repurchase program; and general fluctuations in the amount and frequency of our share repurchases. Many of the foregoing risks and uncertainties will be exacerbated by any worsening of the global business and economic environment. More information on potential factors that could affect the Company’s financial results are described in detail in the Company’s most recent Annual Report on Form 10-K, subsequent Quarterly Reports on Form 10-Q and in other reports and statements that the Company files with the SEC.












































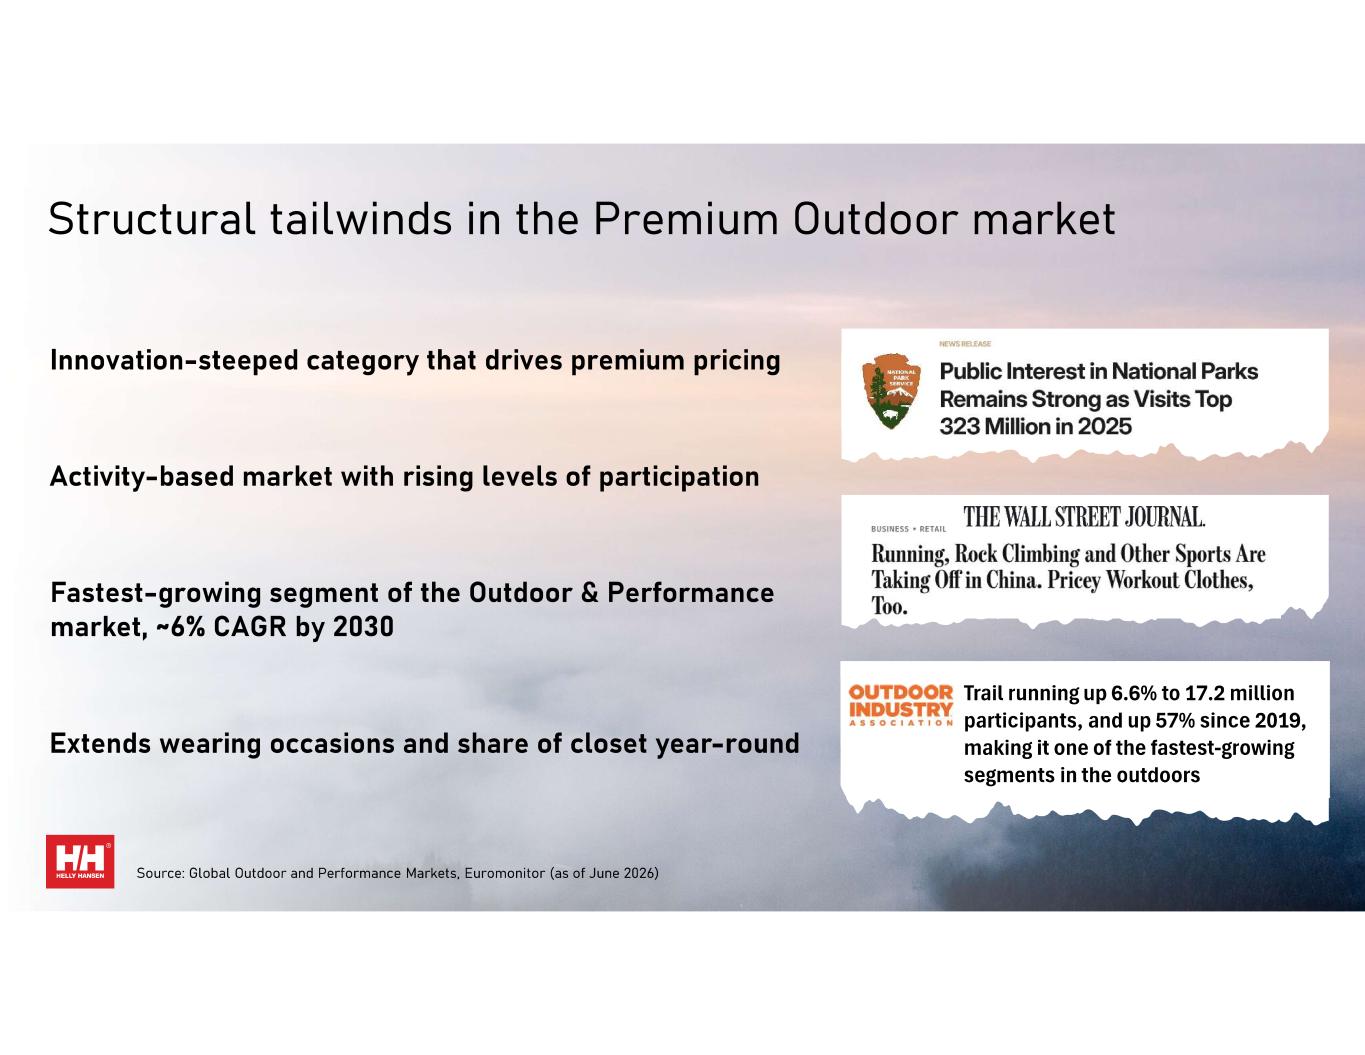
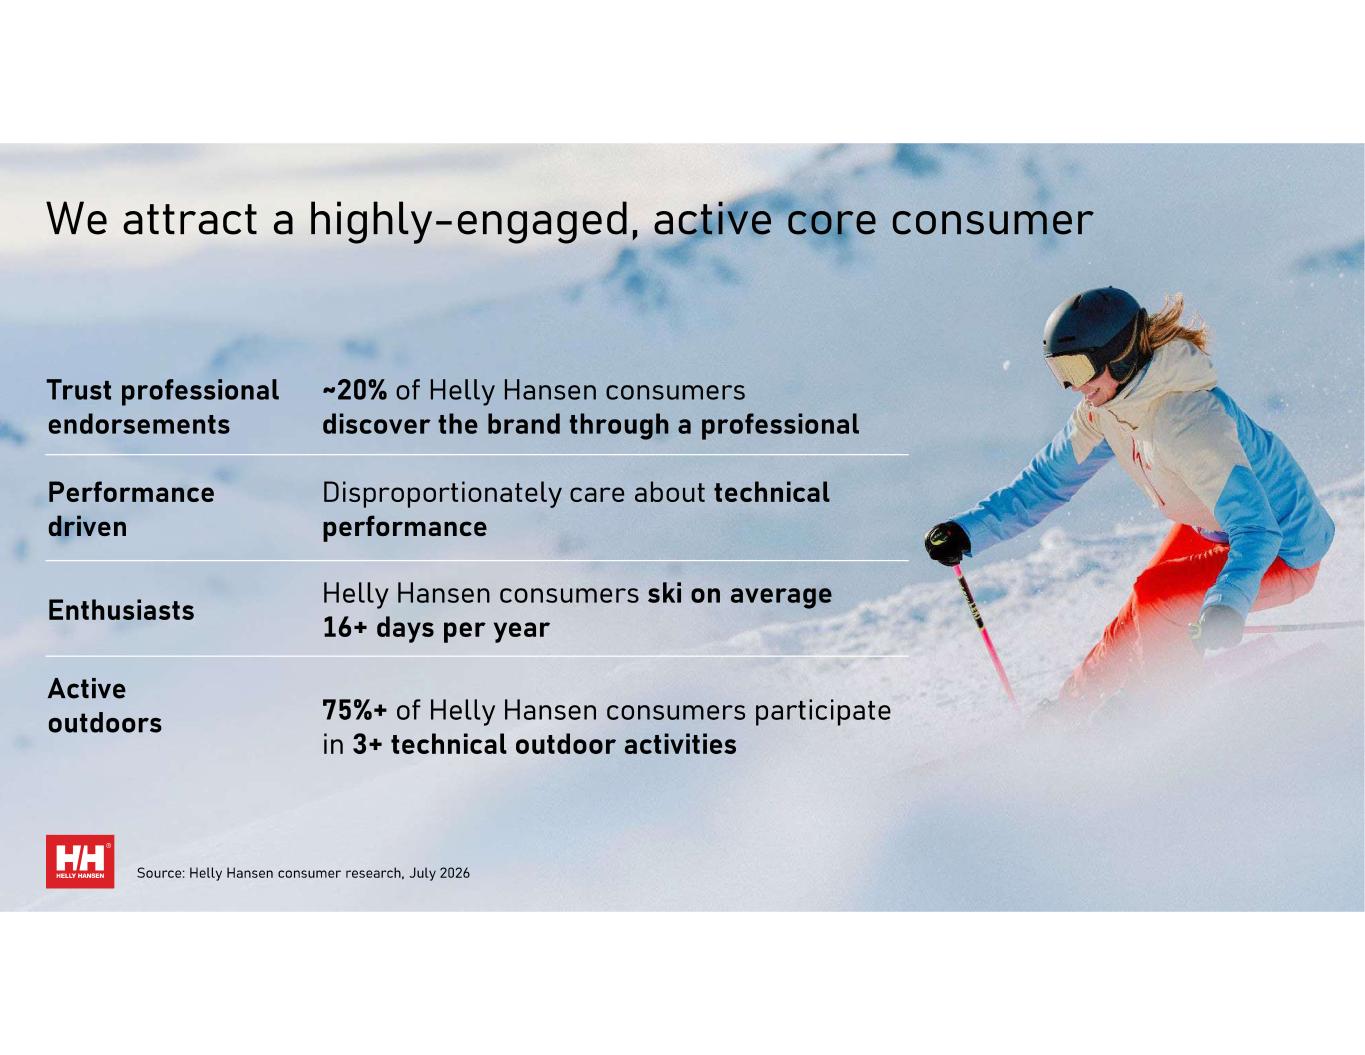
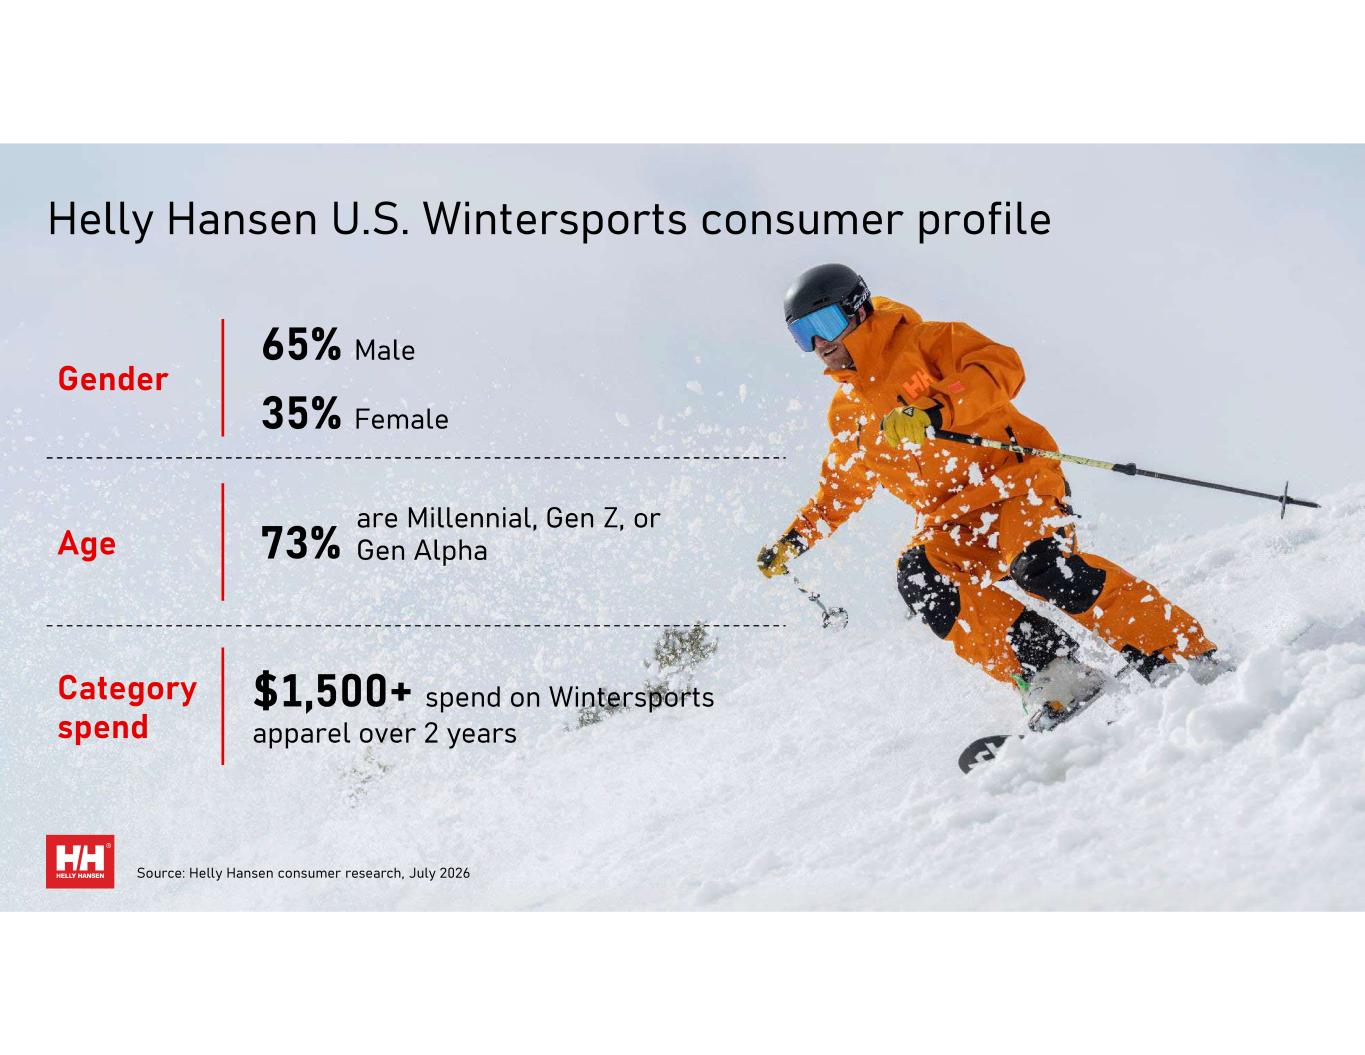
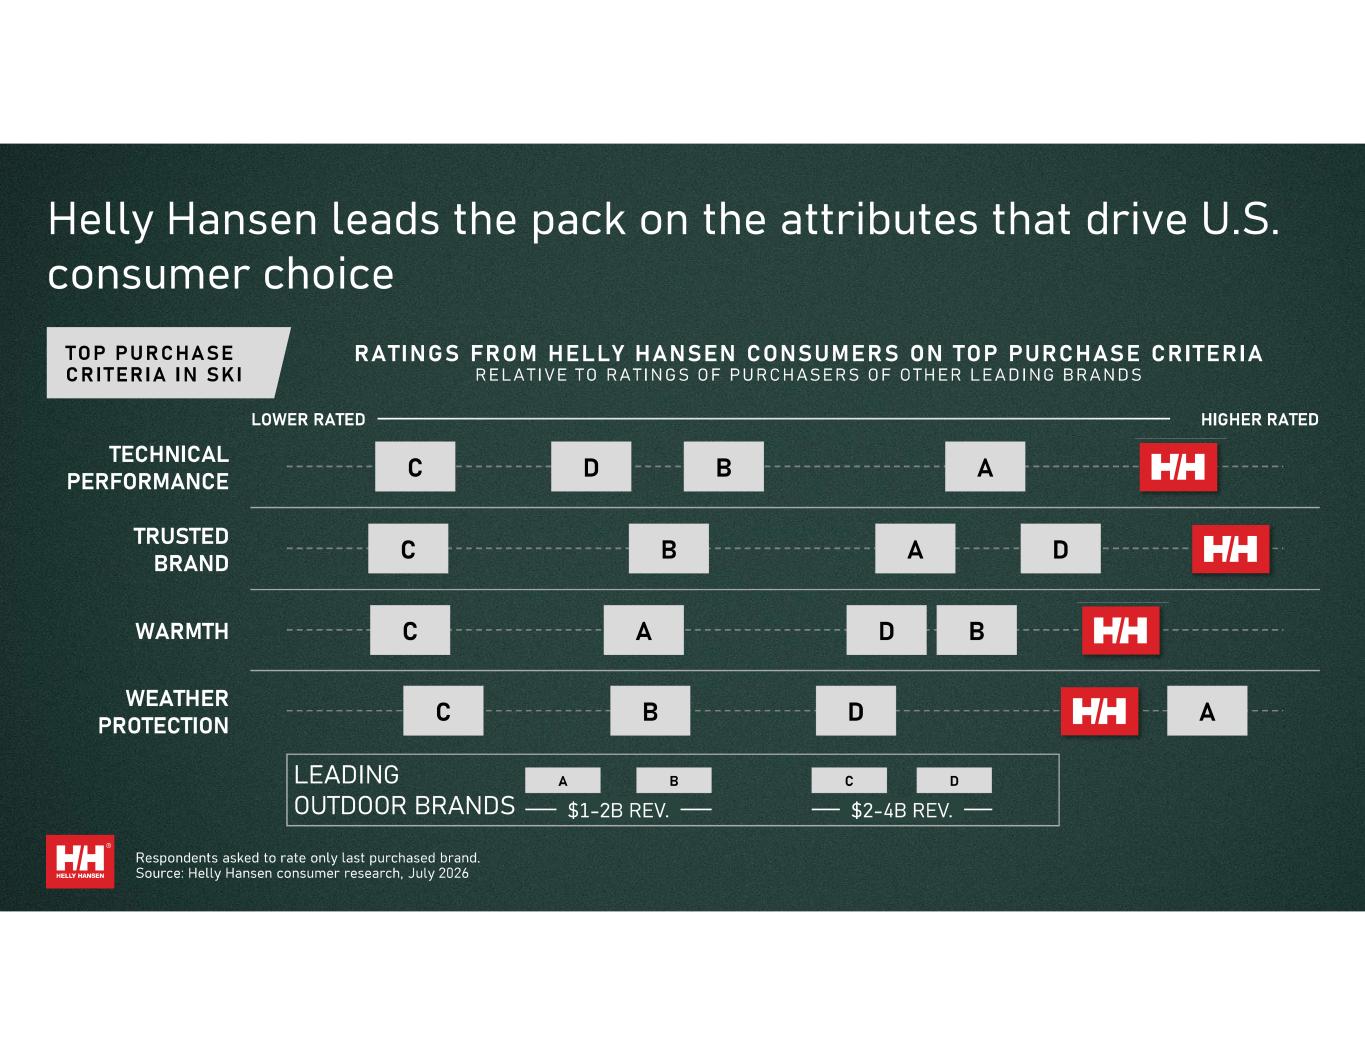
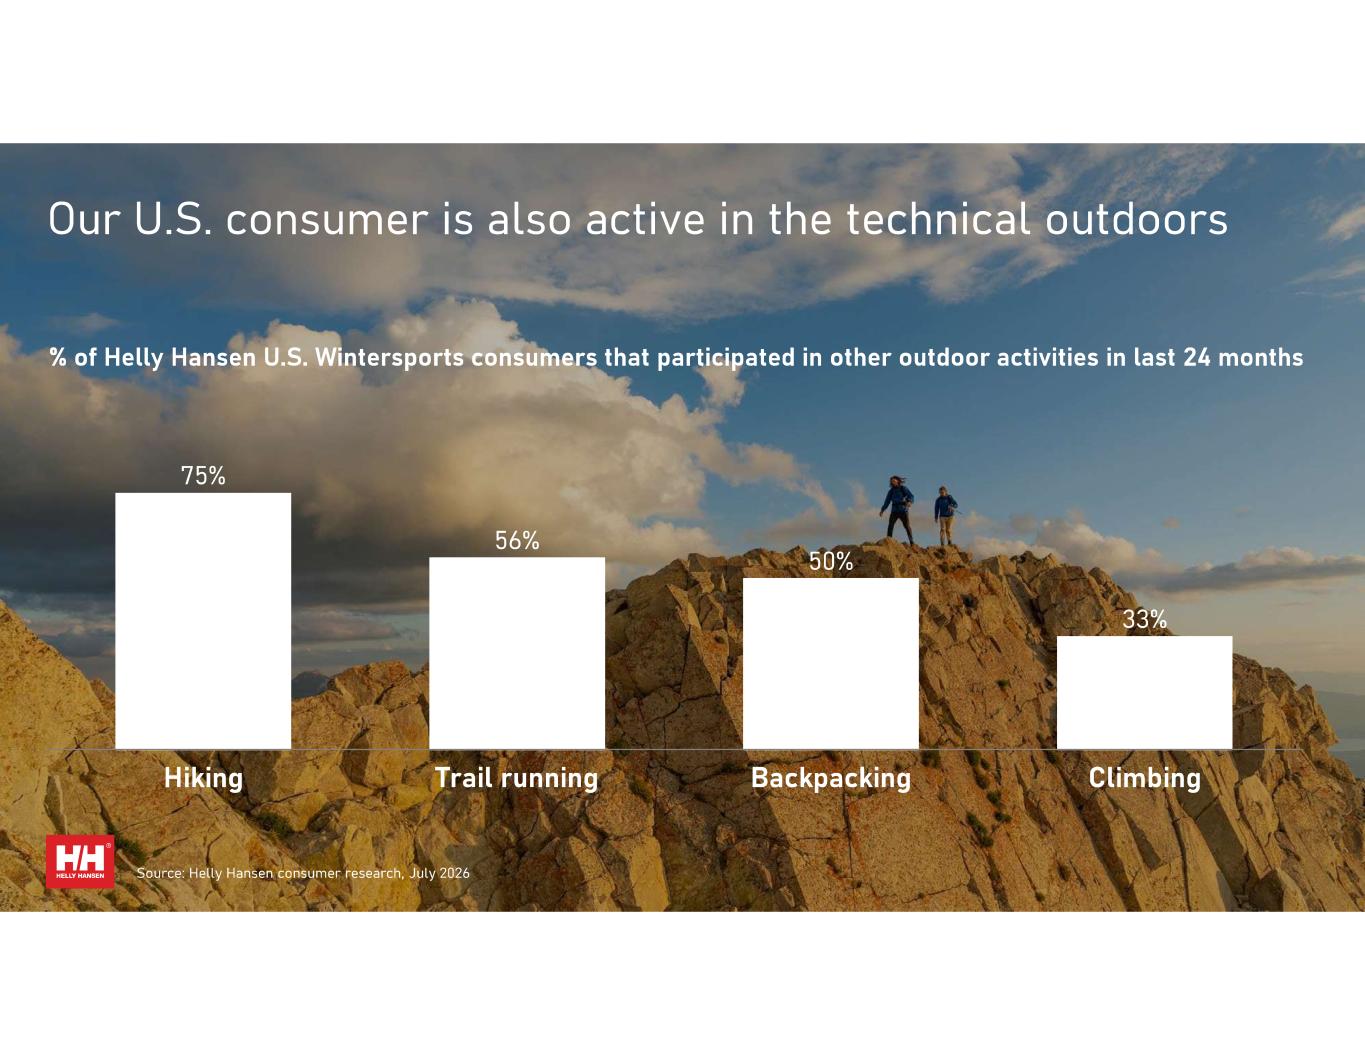
Source: Helly Hansen consumer research, July 2026
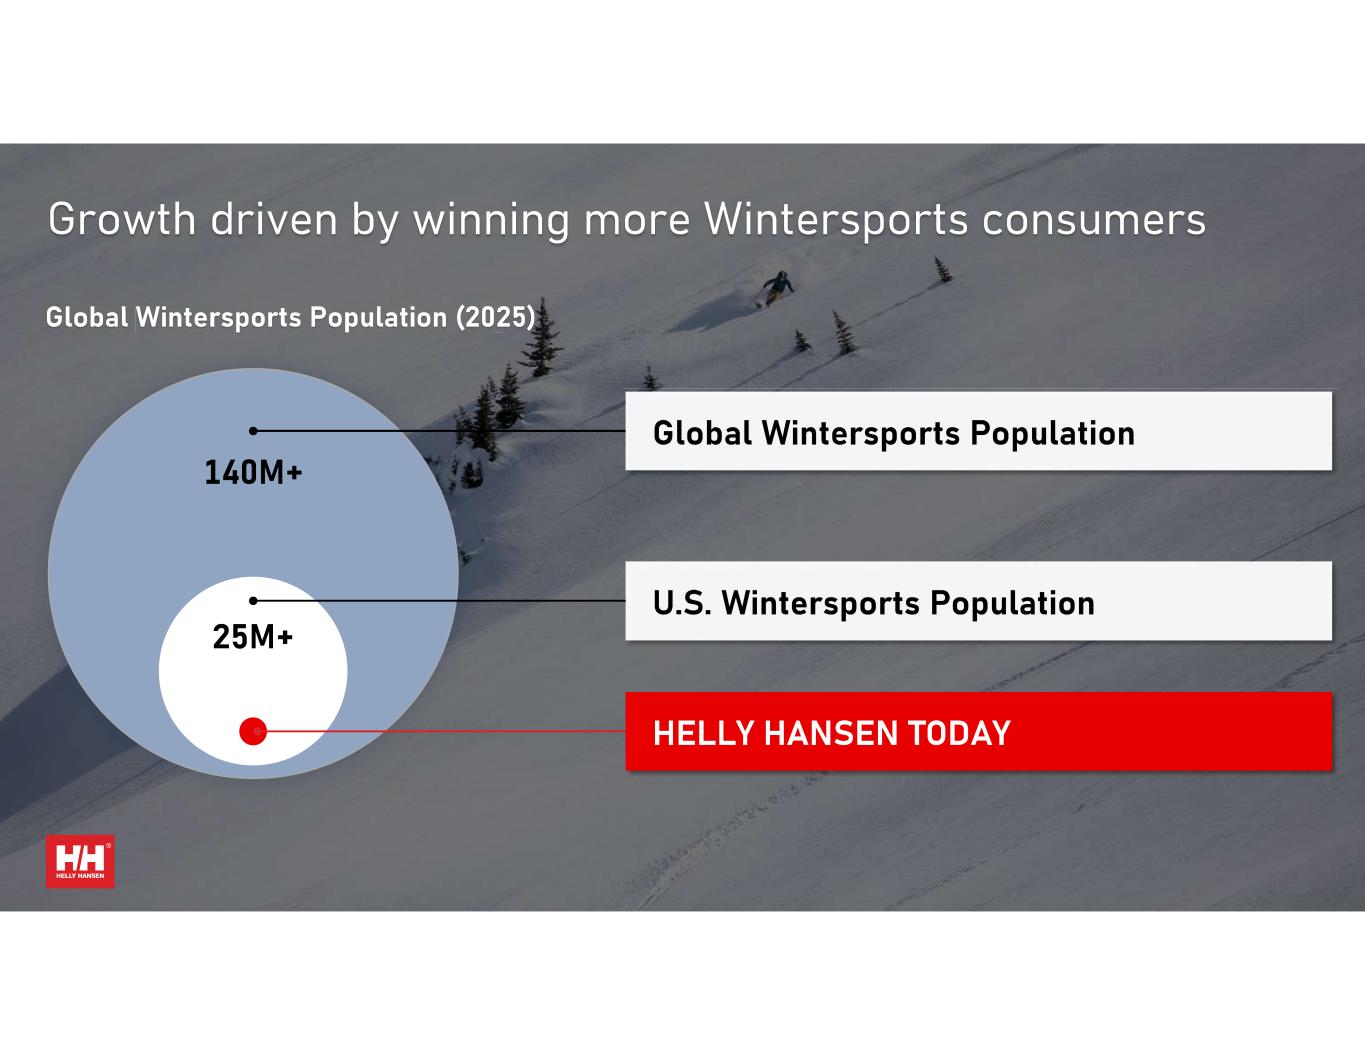

Source: Outdoor Industry Association






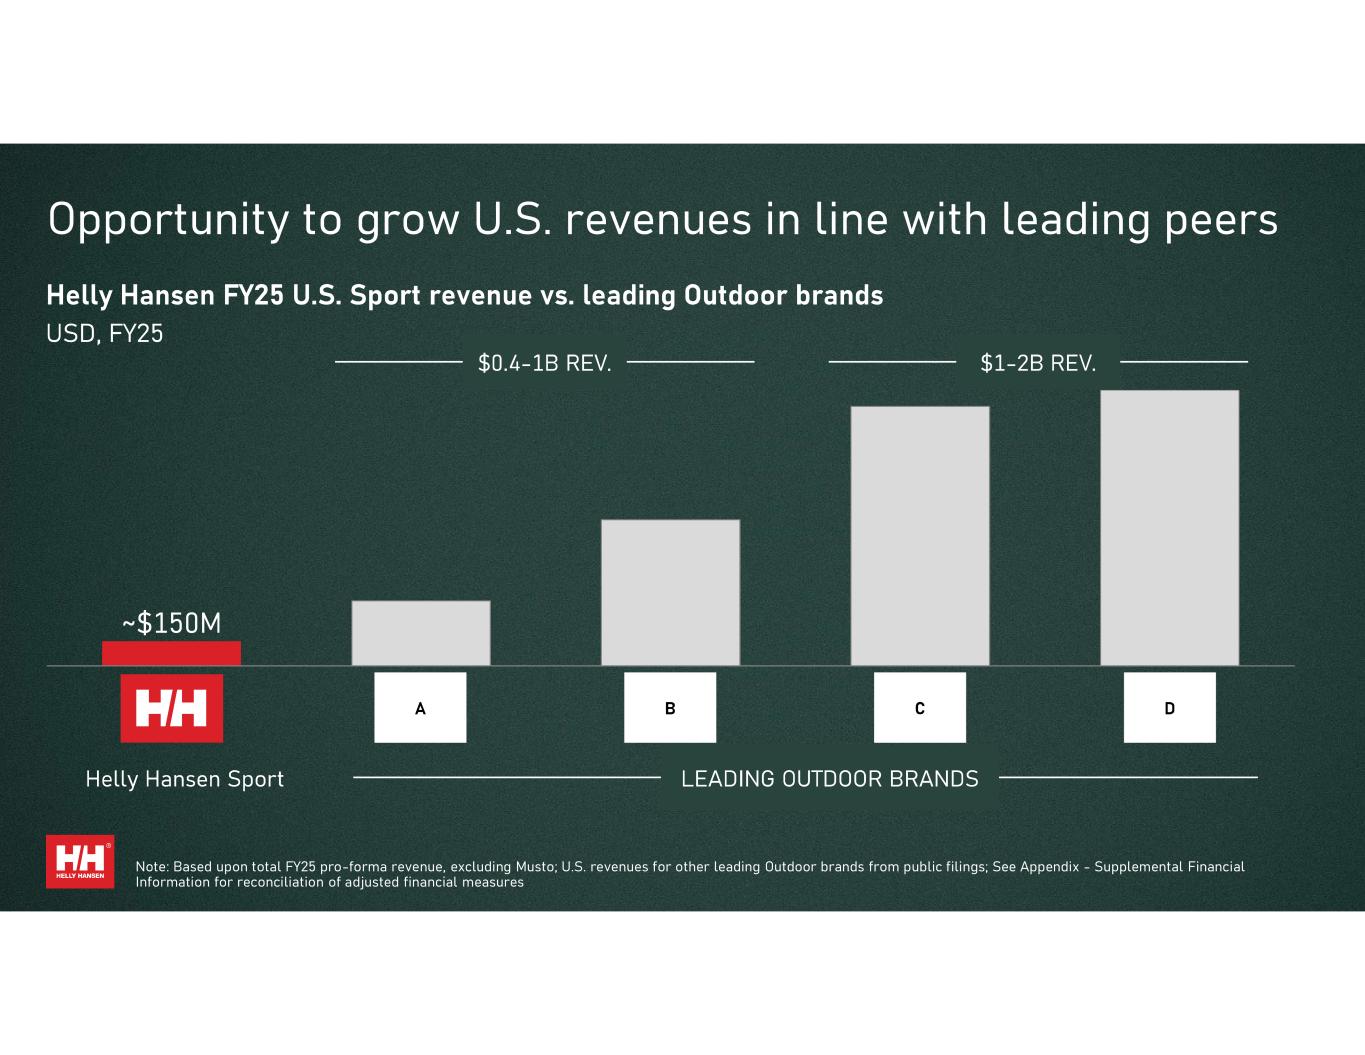
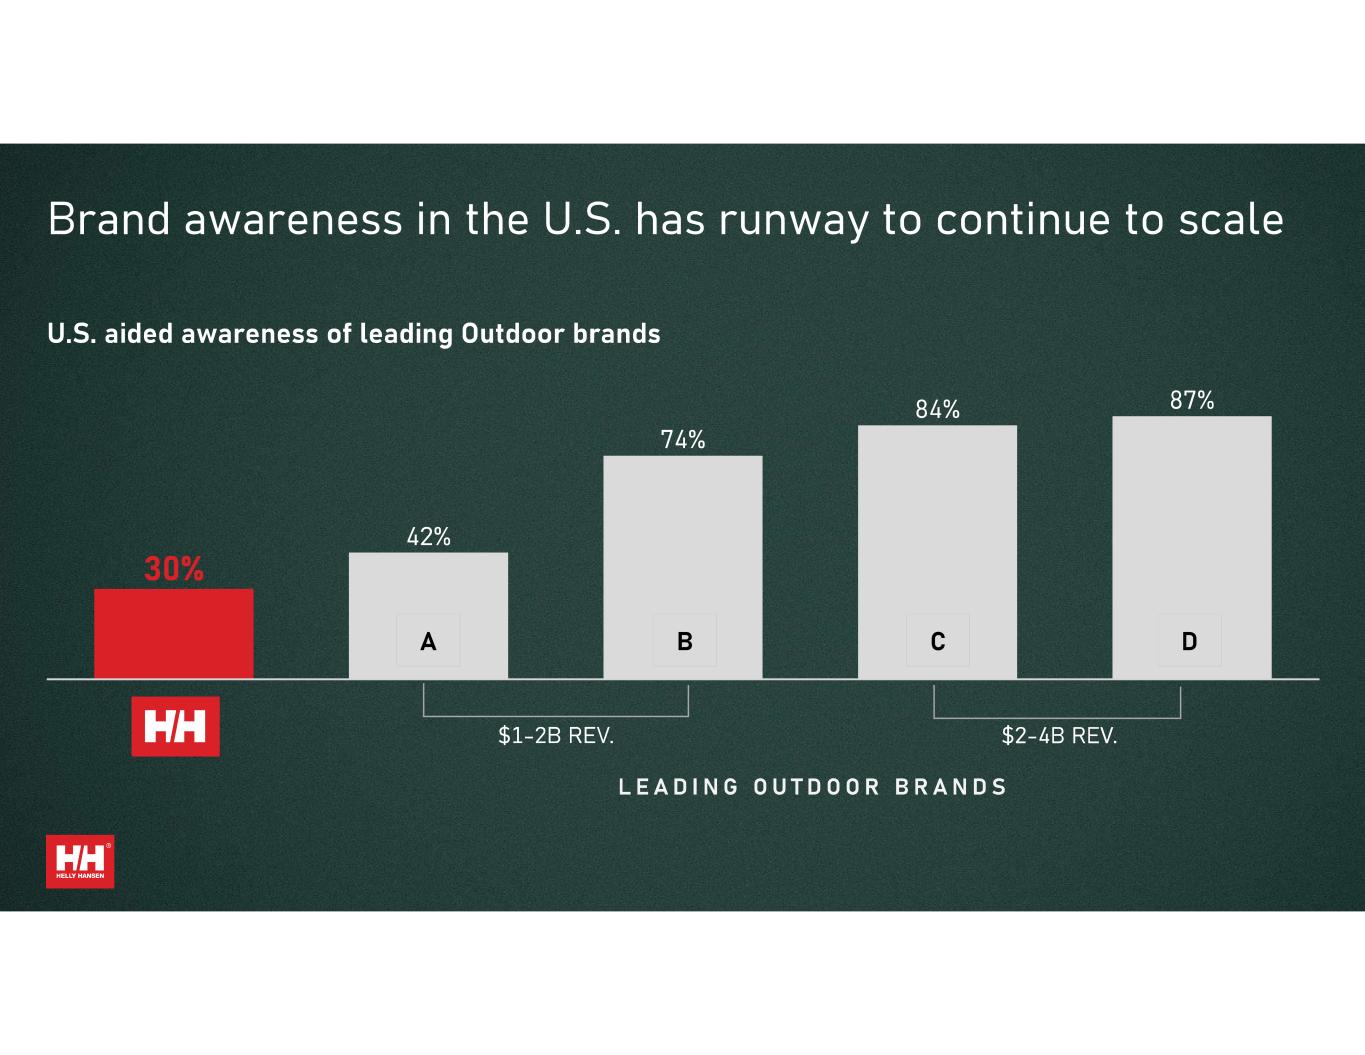
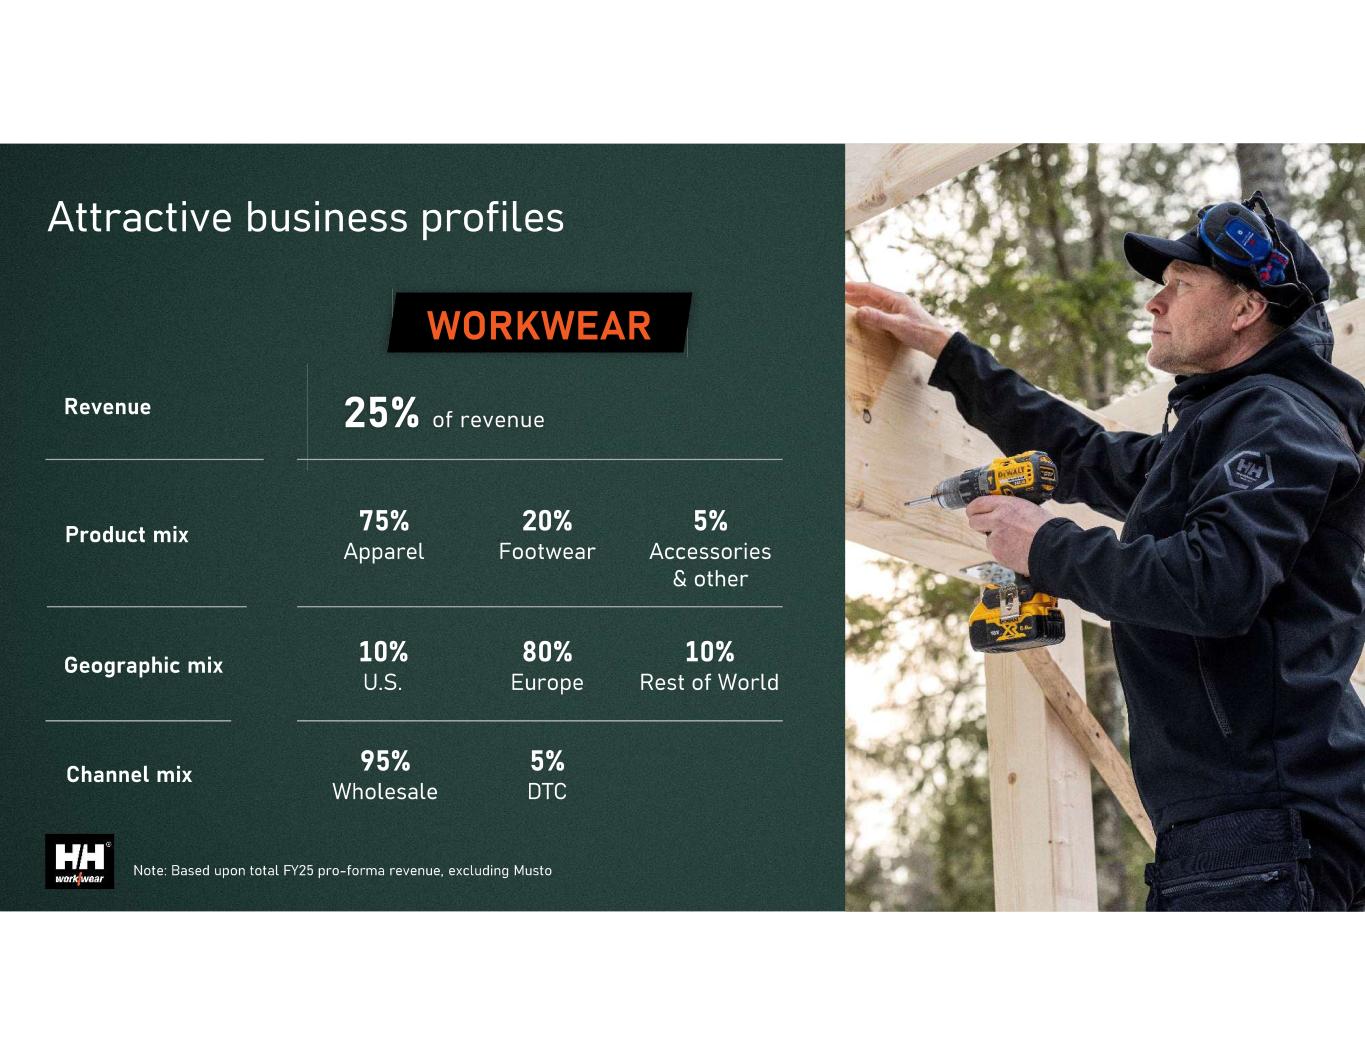
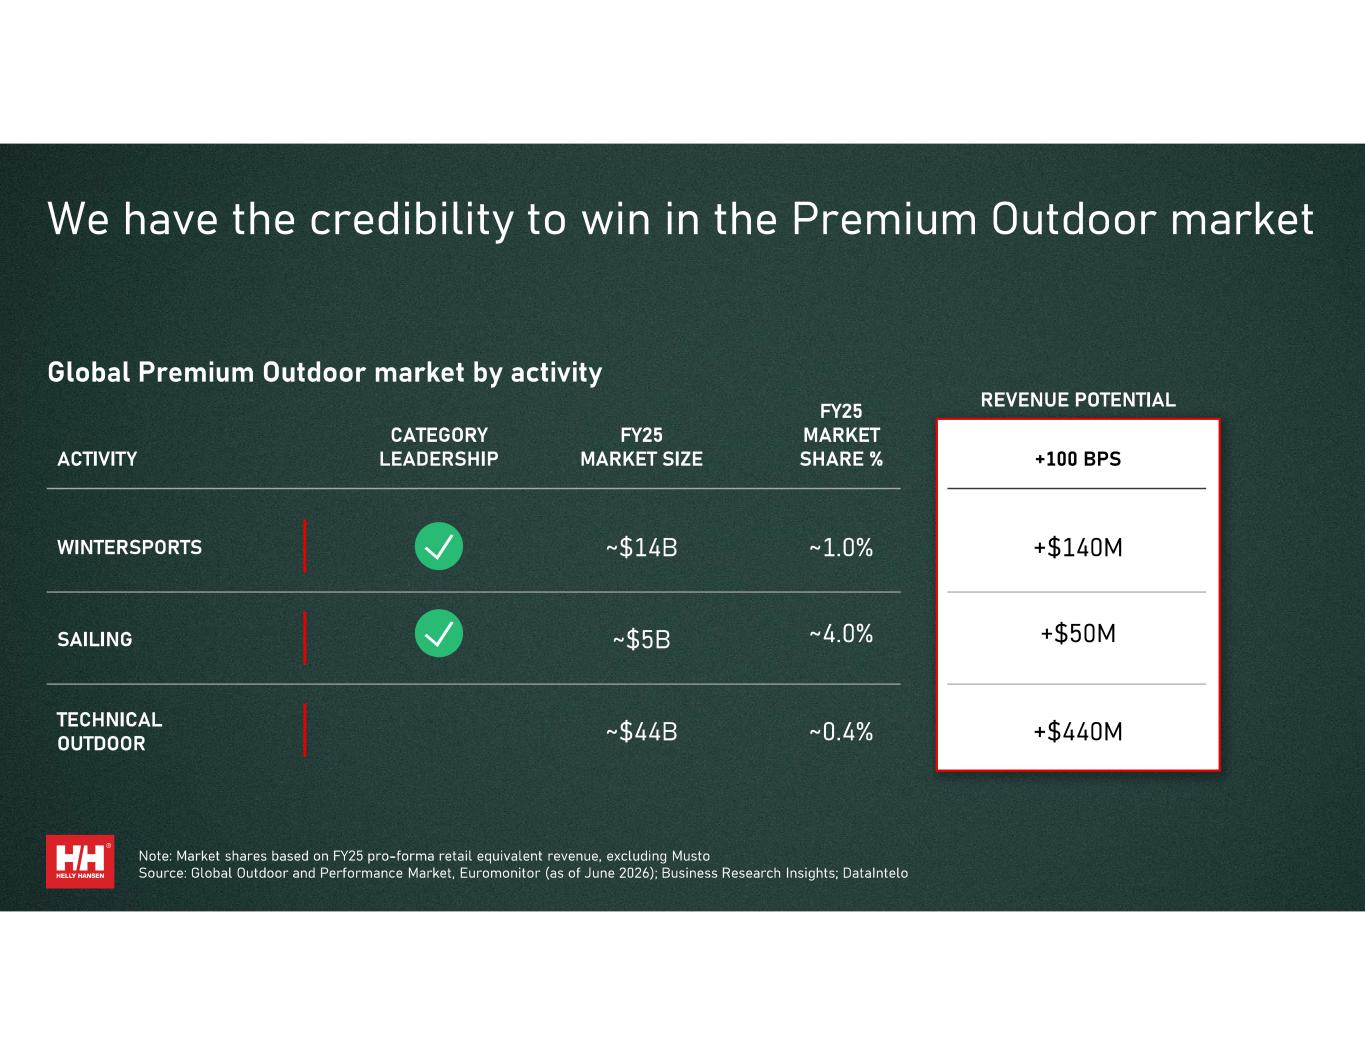
Note: Based upon total FY25 pro-forma revenue, excluding Musto; U.S. revenues for other leading Outdoor brands from public filings; See Appendix - Supplemental Financial Information for reconciliation of adjusted financial measures
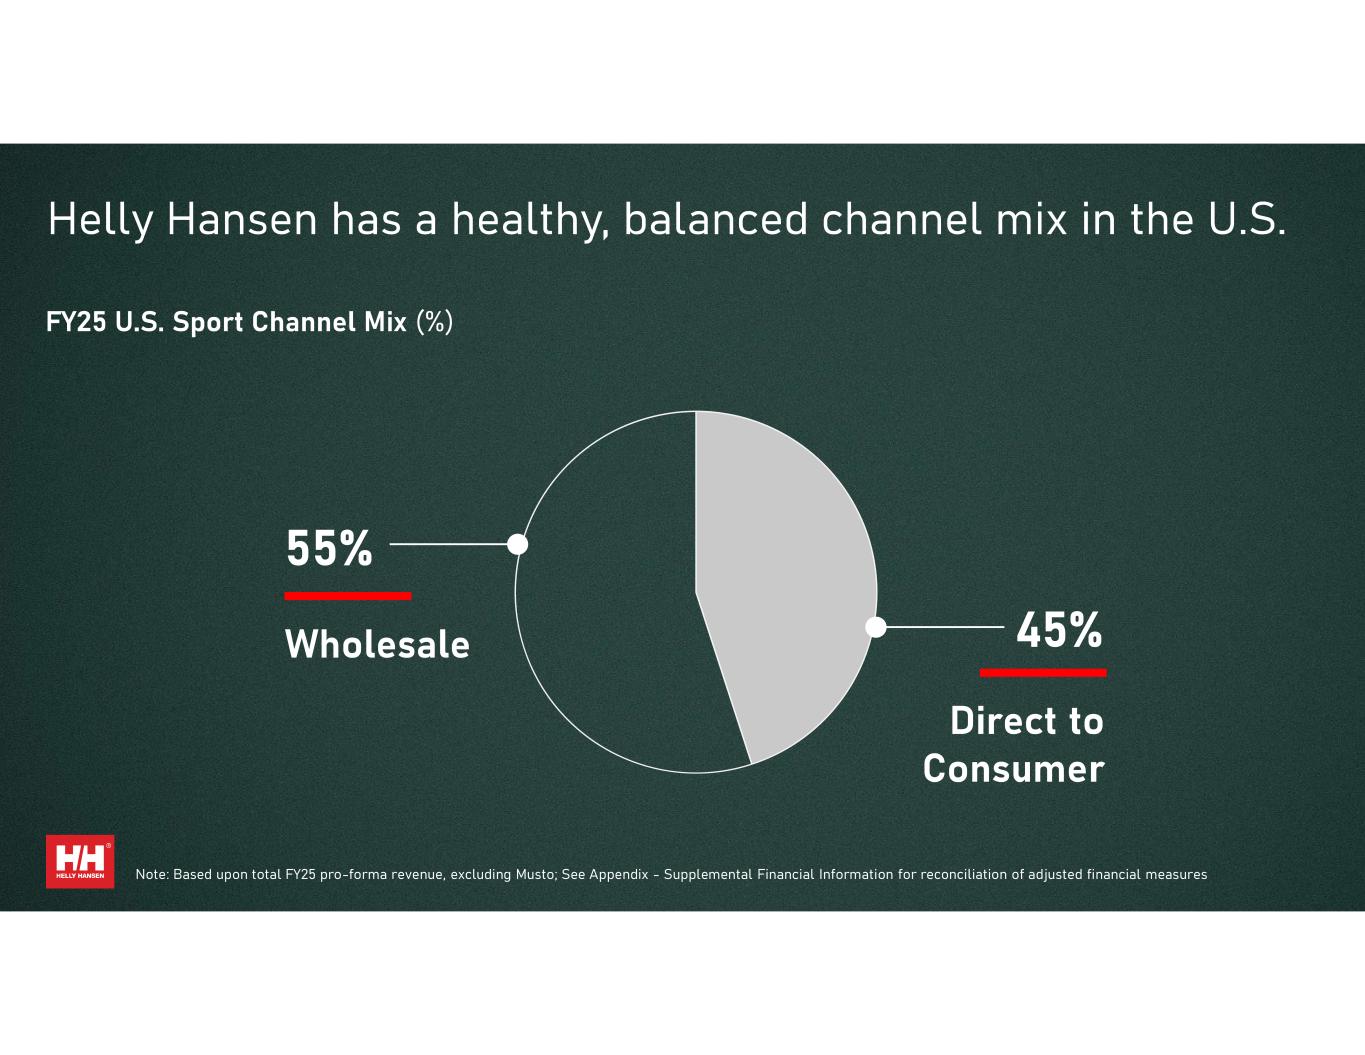
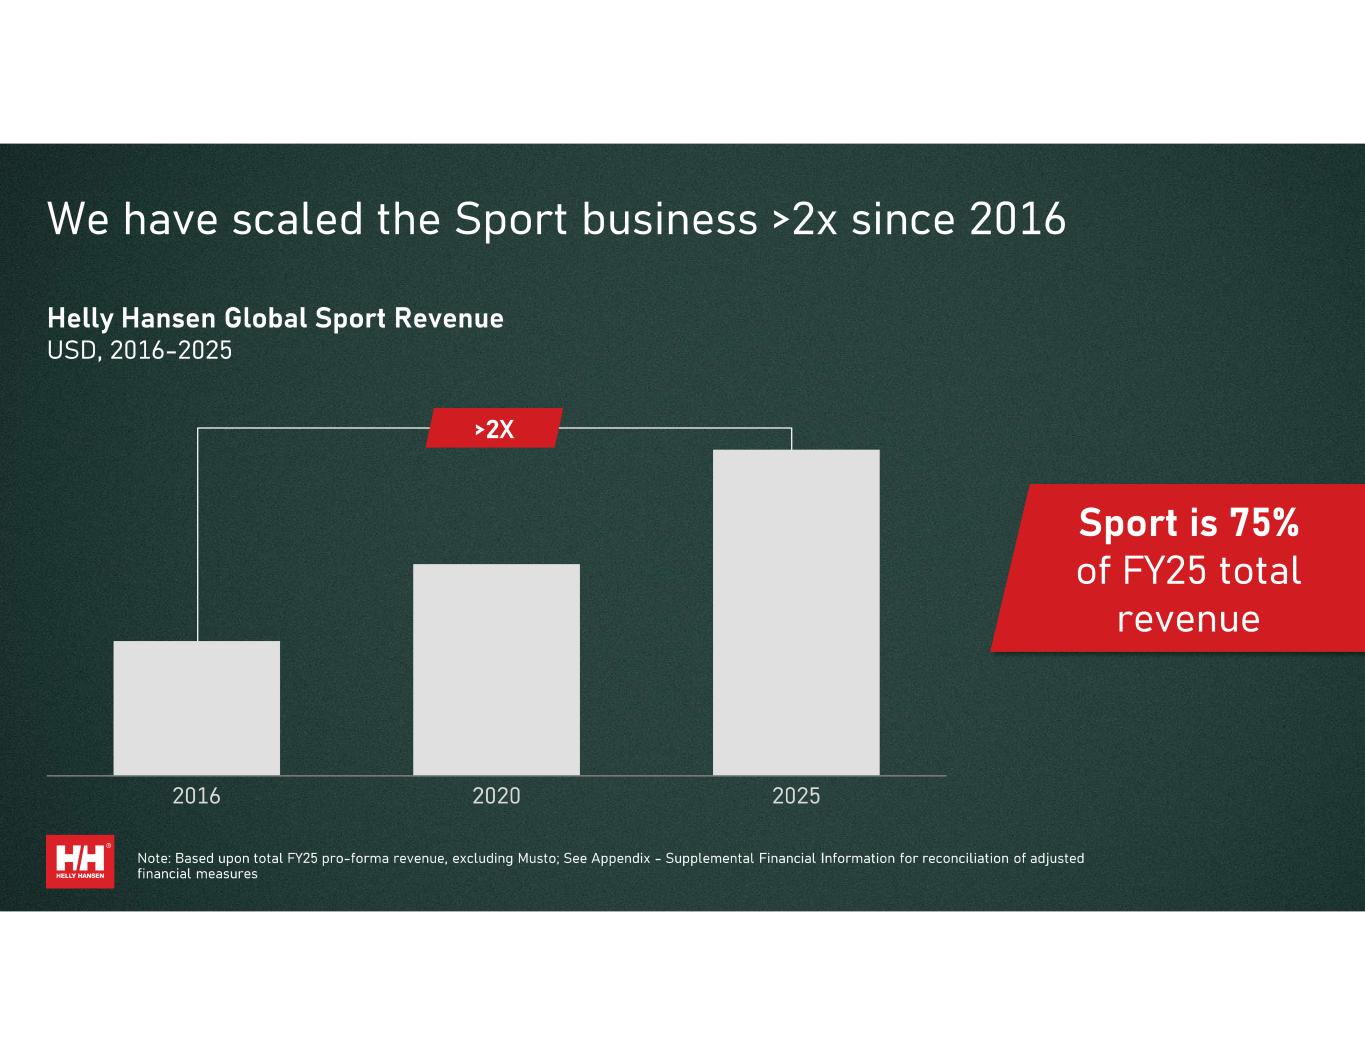
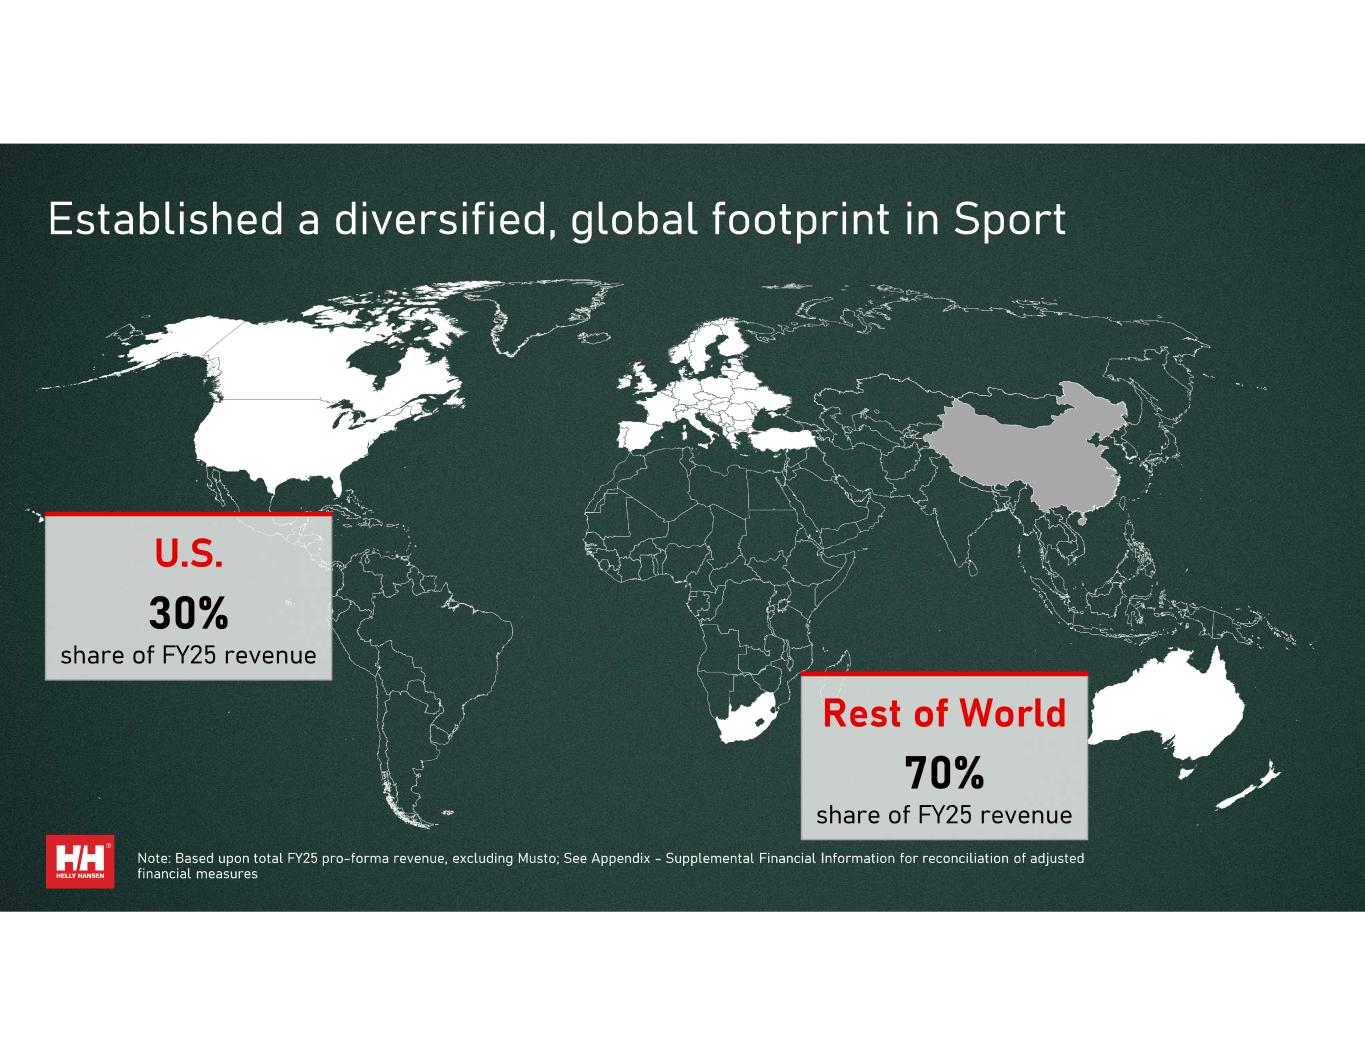
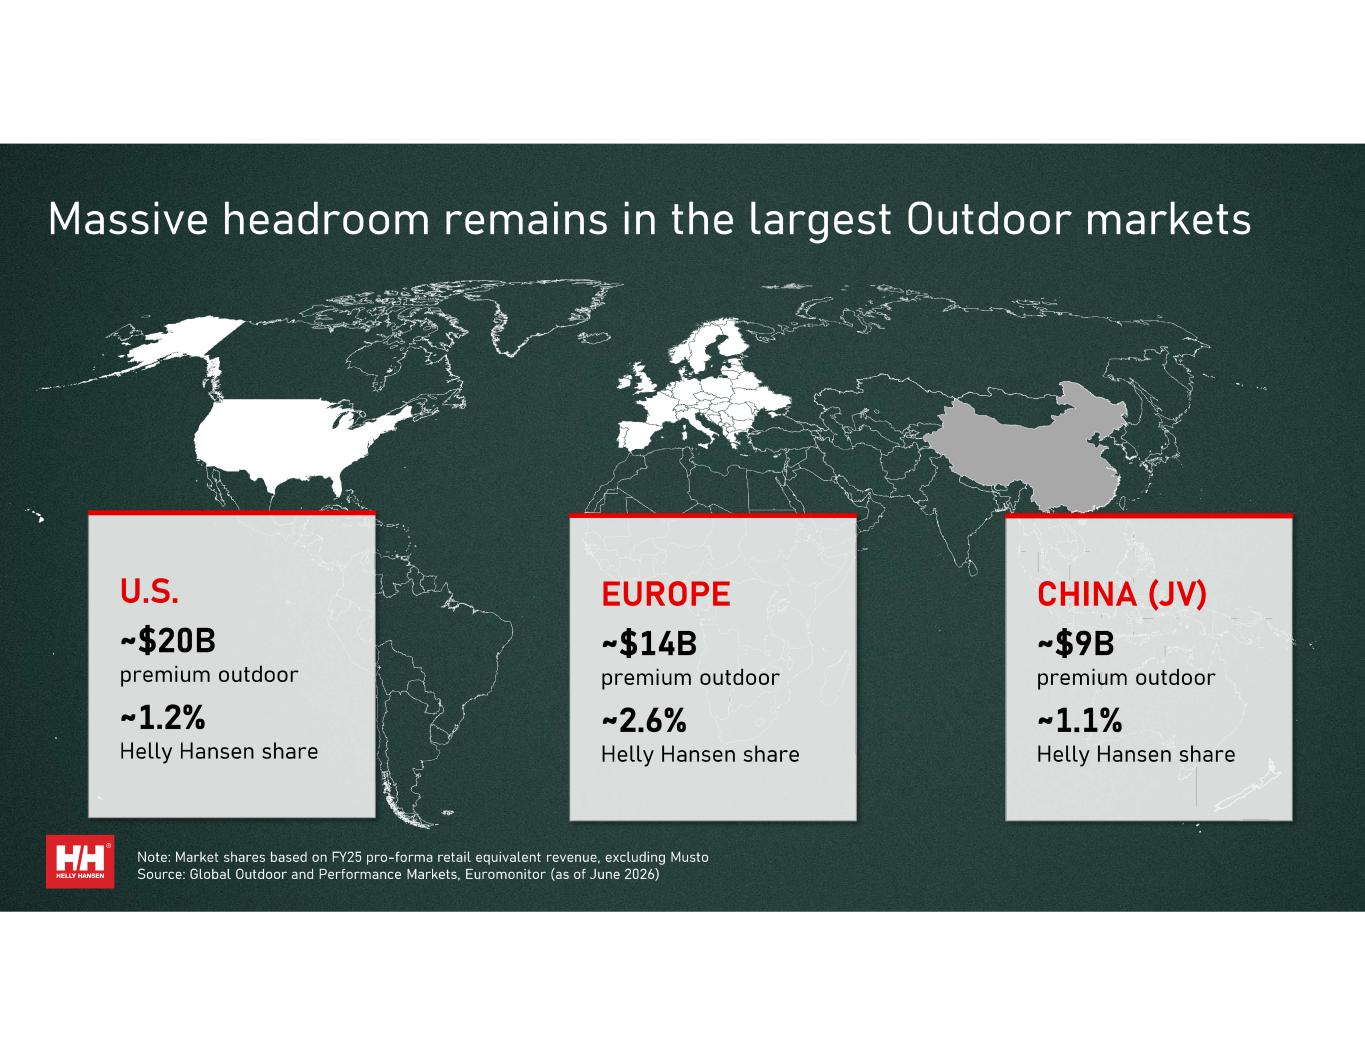
Note: Based upon total FY25 pro-forma revenue, excluding Musto; See Appendix - Supplemental Financial Information for reconciliation of adjusted financial measures

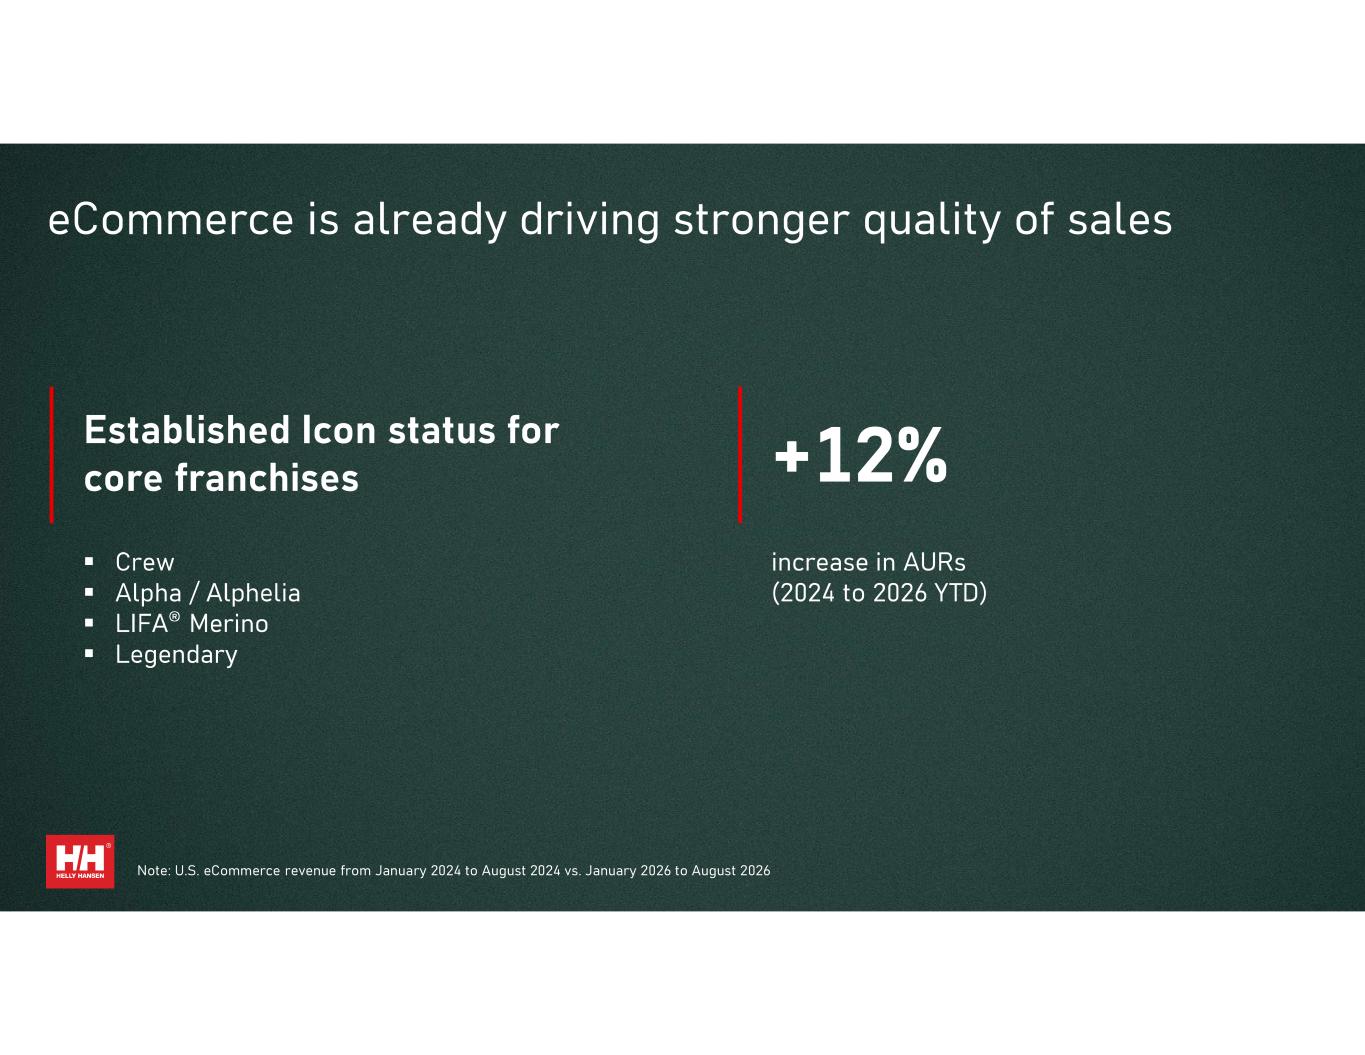
Note: U.S. eCommerce revenue from January 2024 to August 2024 vs. January 2026 to August 2026






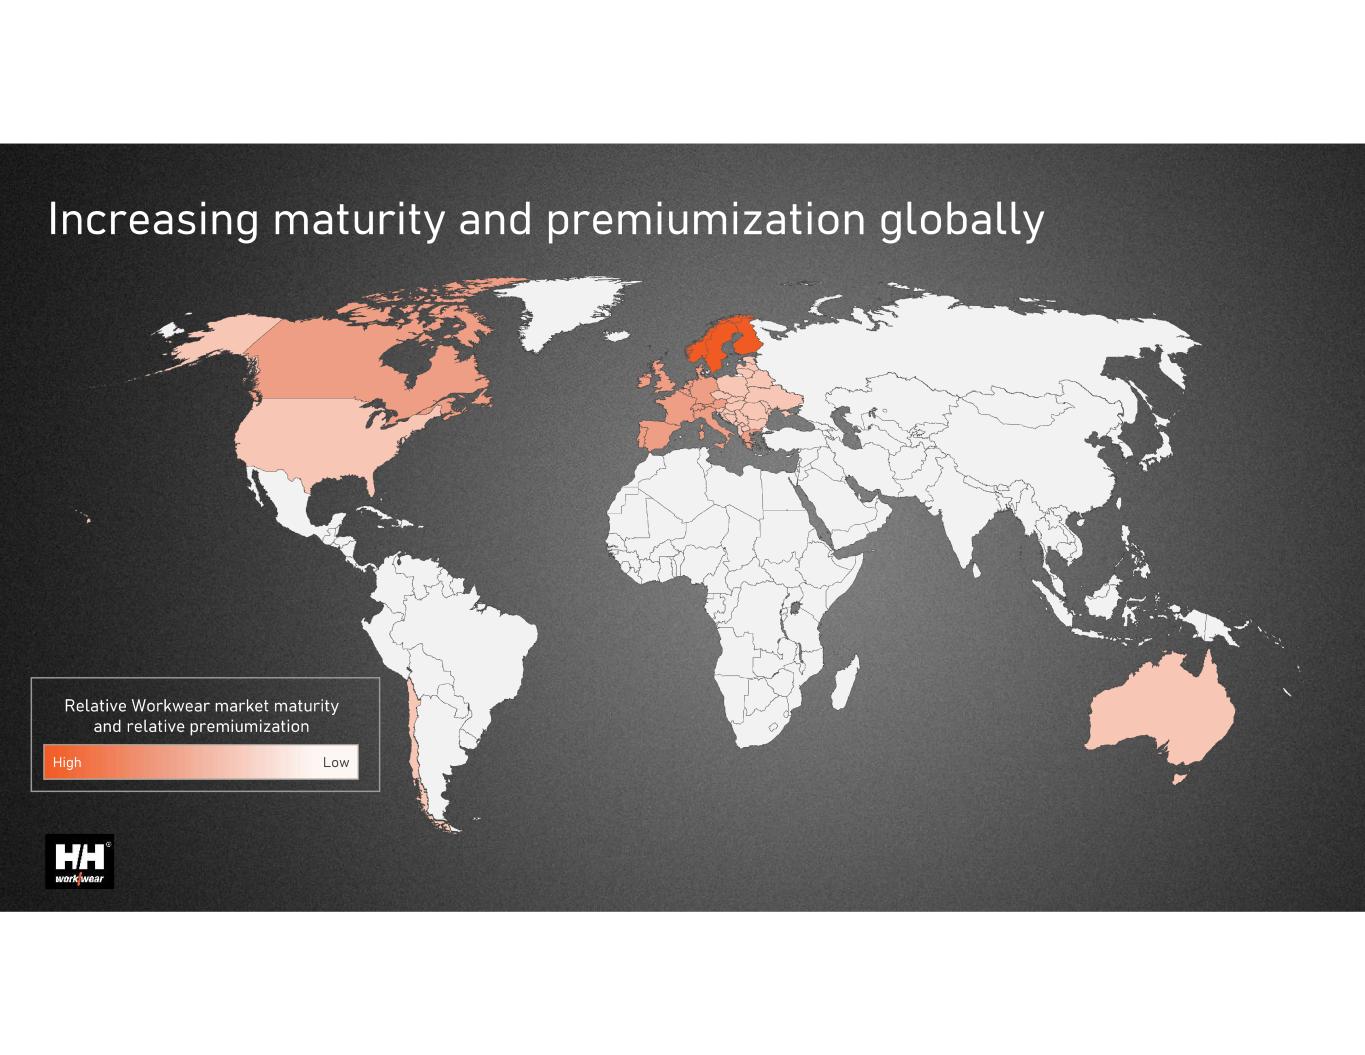
High Low
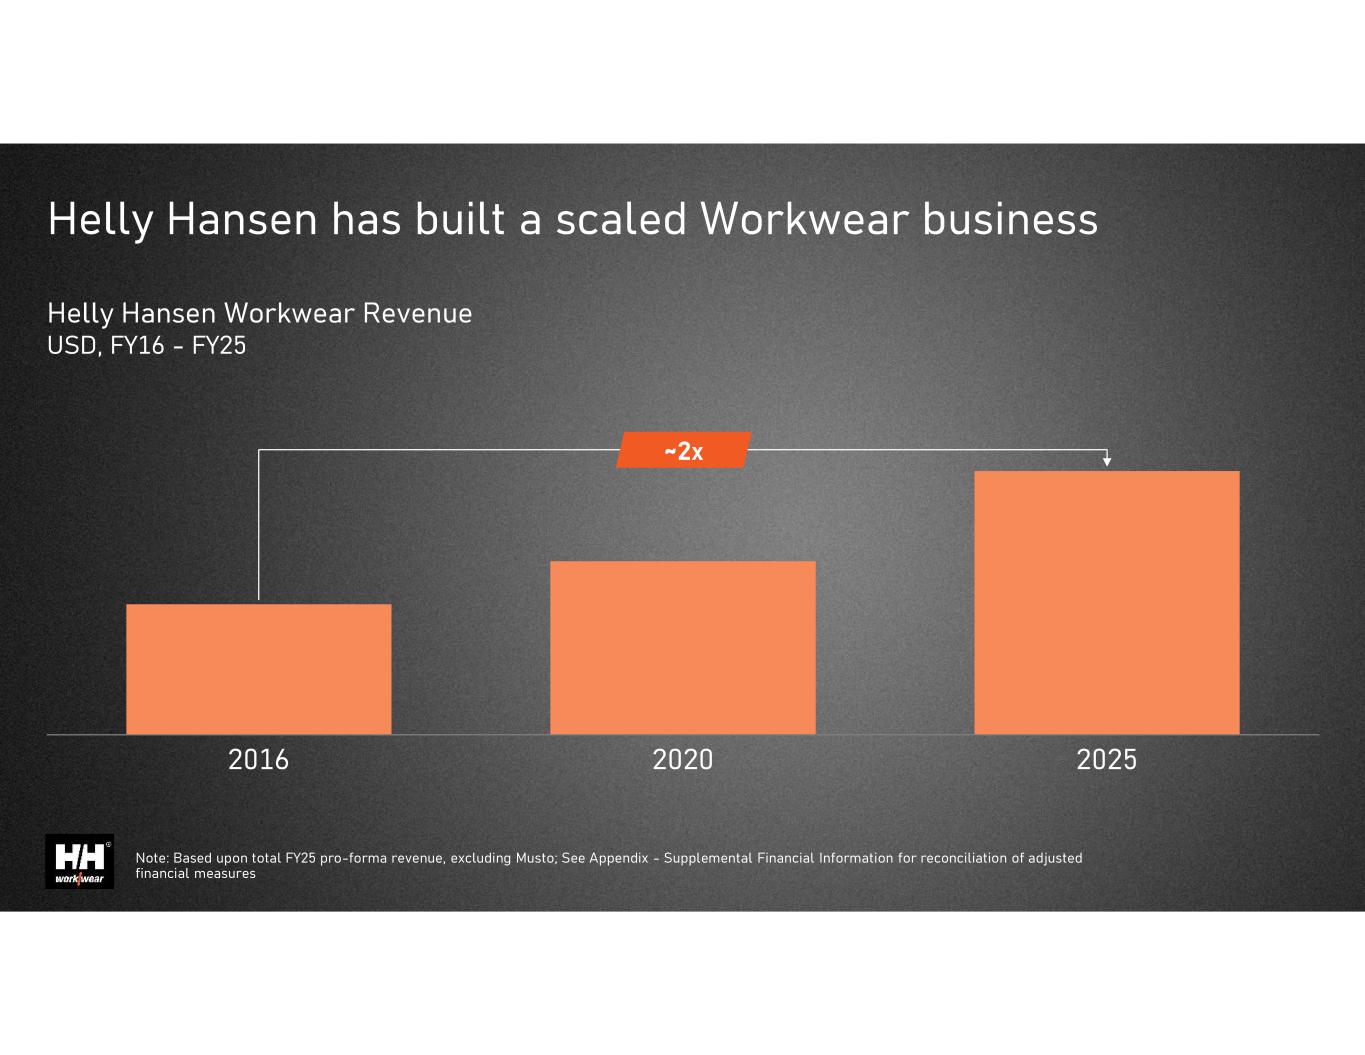
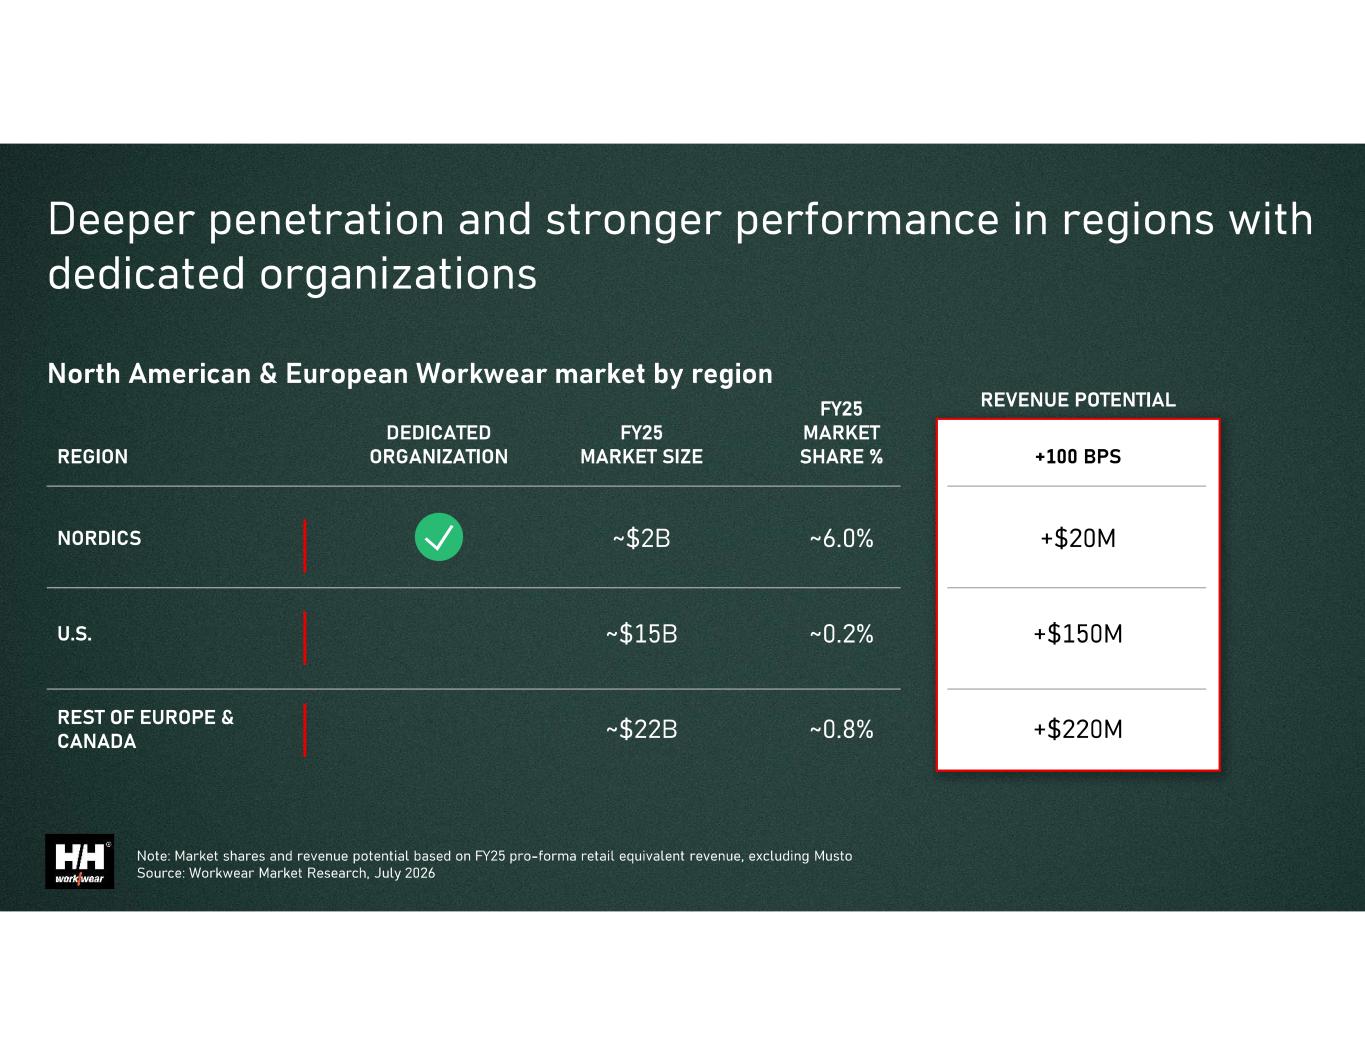
Note: Based upon total FY25 pro-forma revenue, excluding Musto; See Appendix - Supplemental Financial Information for reconciliation of adjusted financial measures
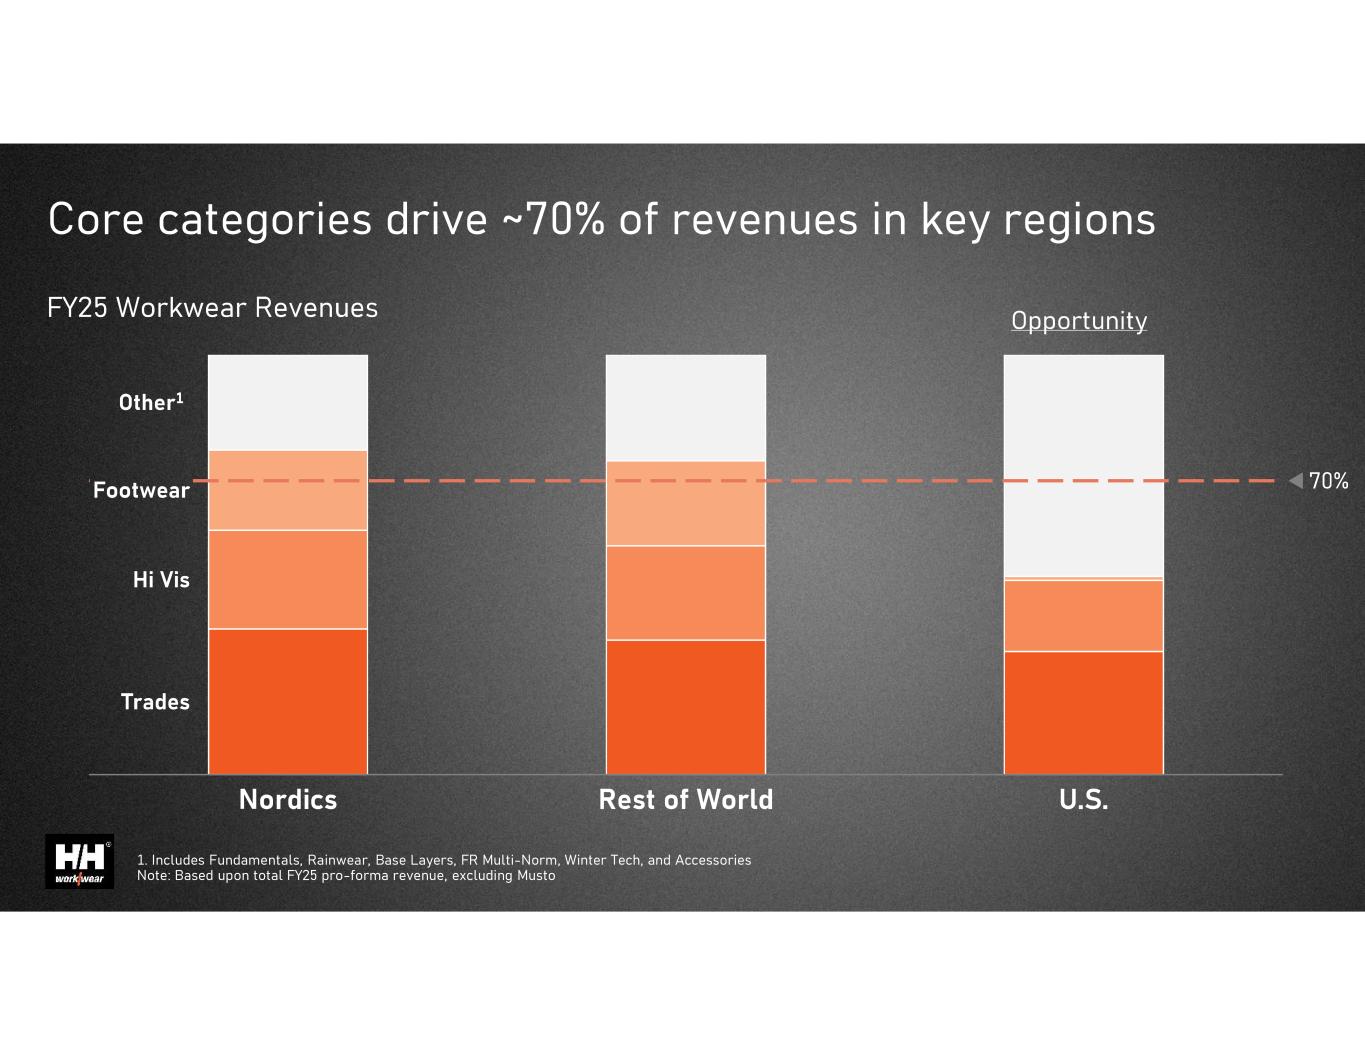
1. Includes Fundamentals, Rainwear, Base Layers, FR Multi-Norm, Winter Tech, and Accessories Note: Based upon total FY25 pro-forma revenue, excluding Musto

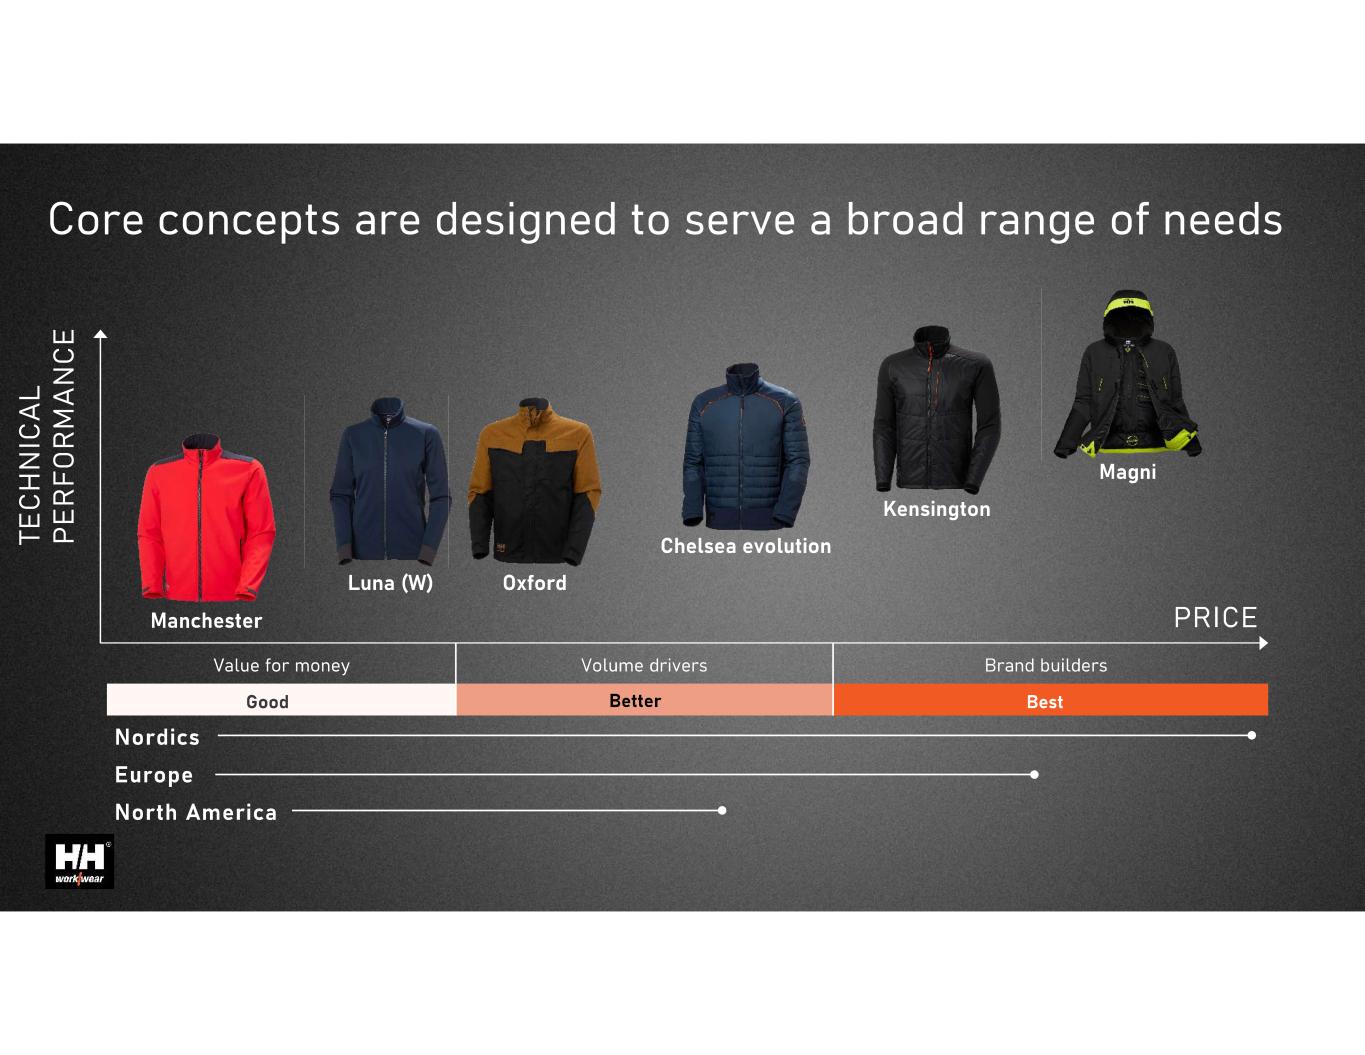
T E C H N IC A L P E R F O R M A N C E











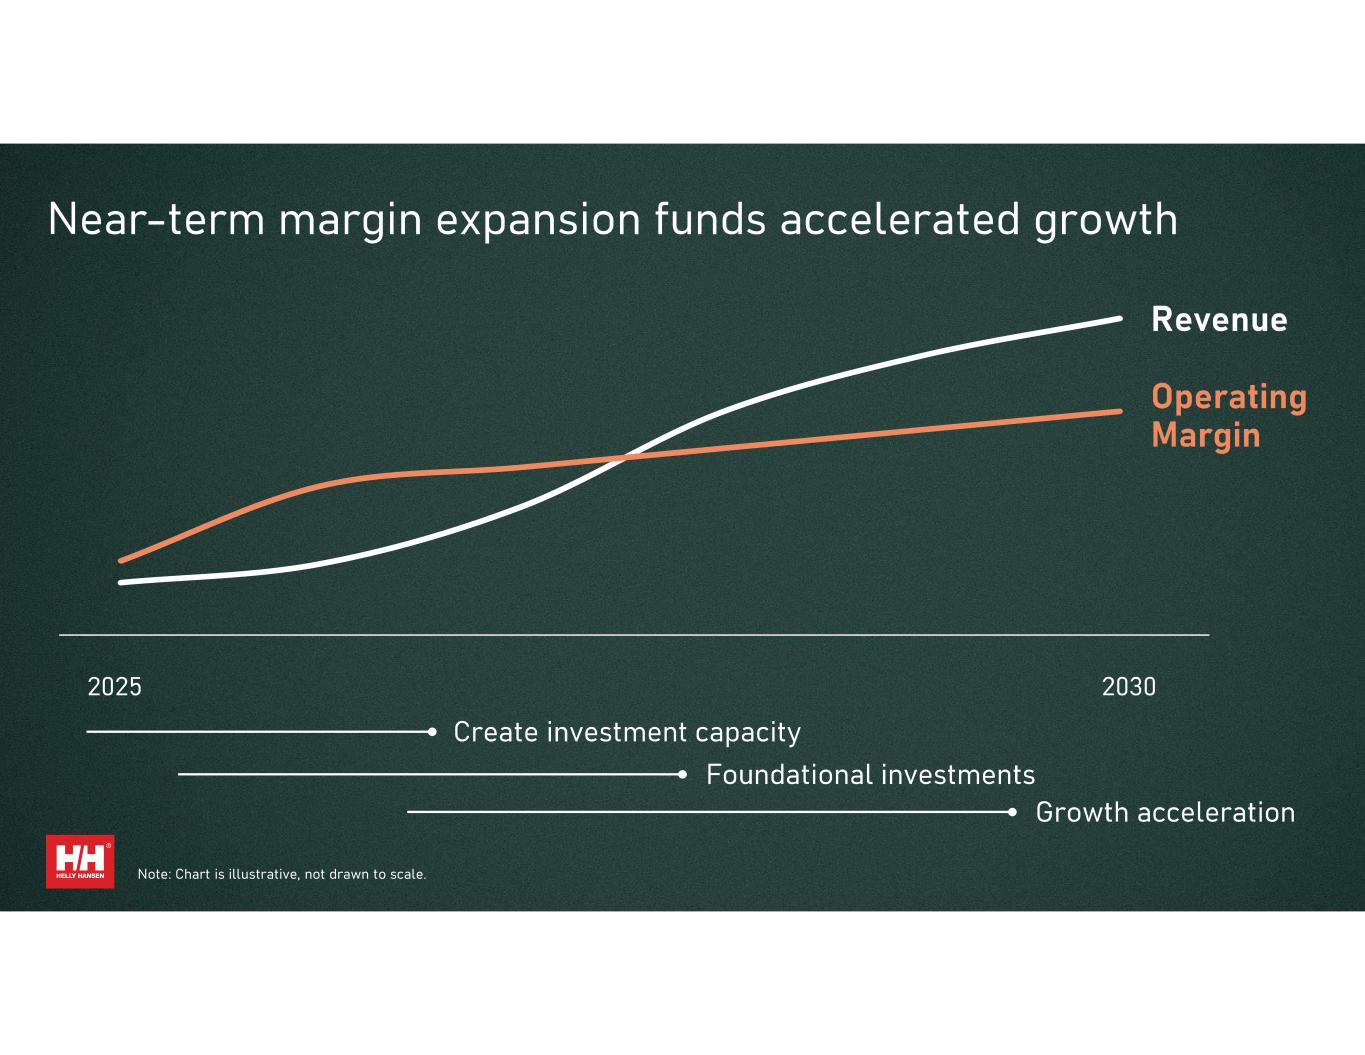
Note: Chart is illustrative, not drawn to scale.
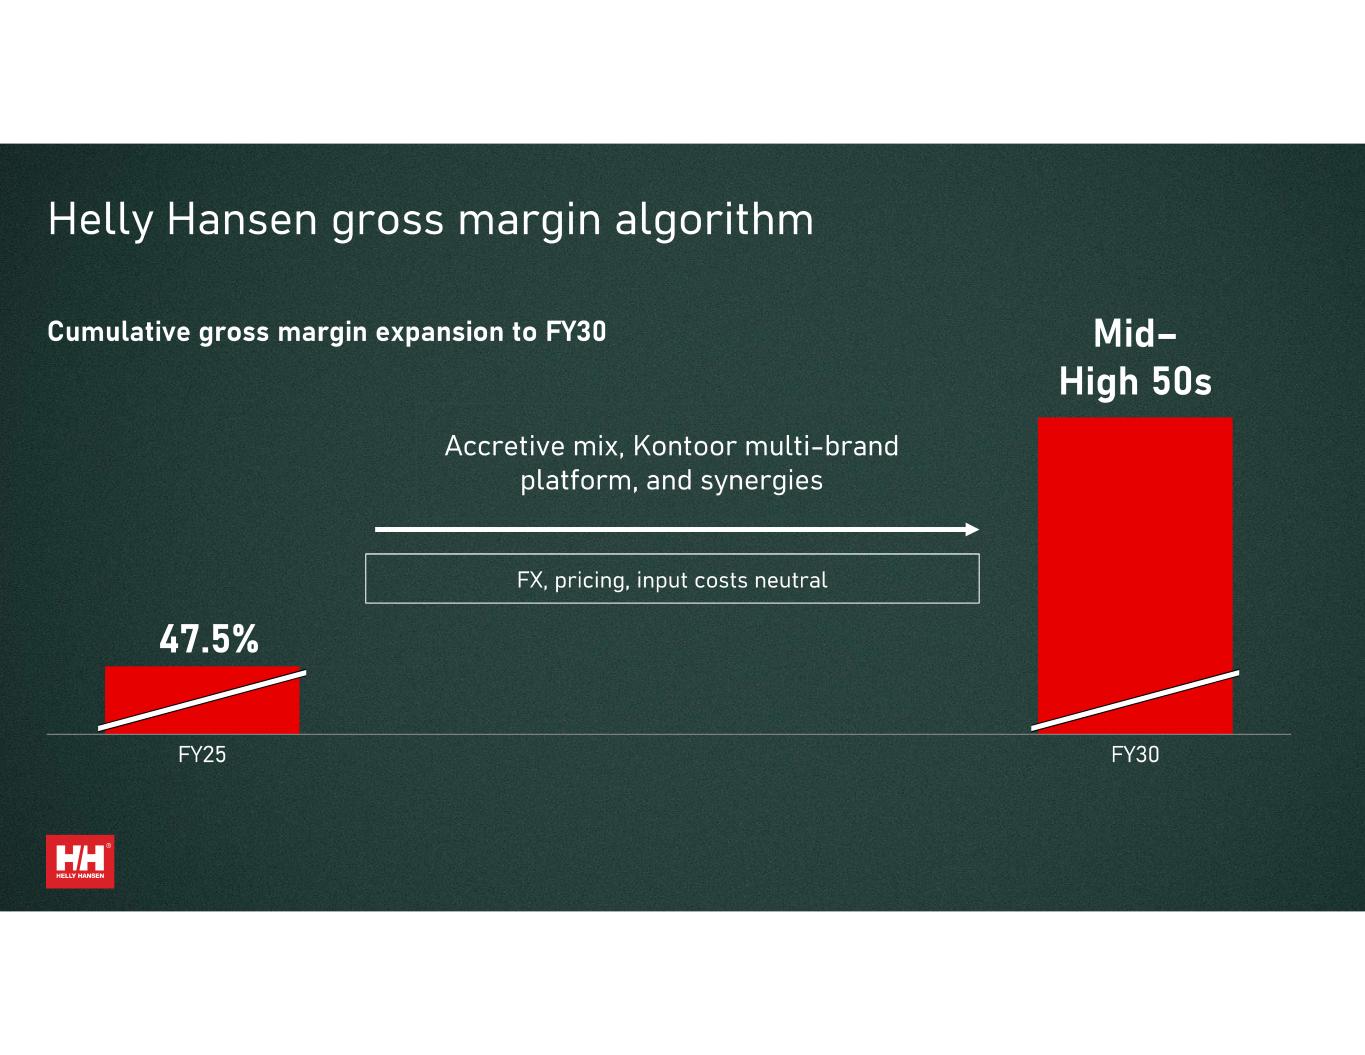
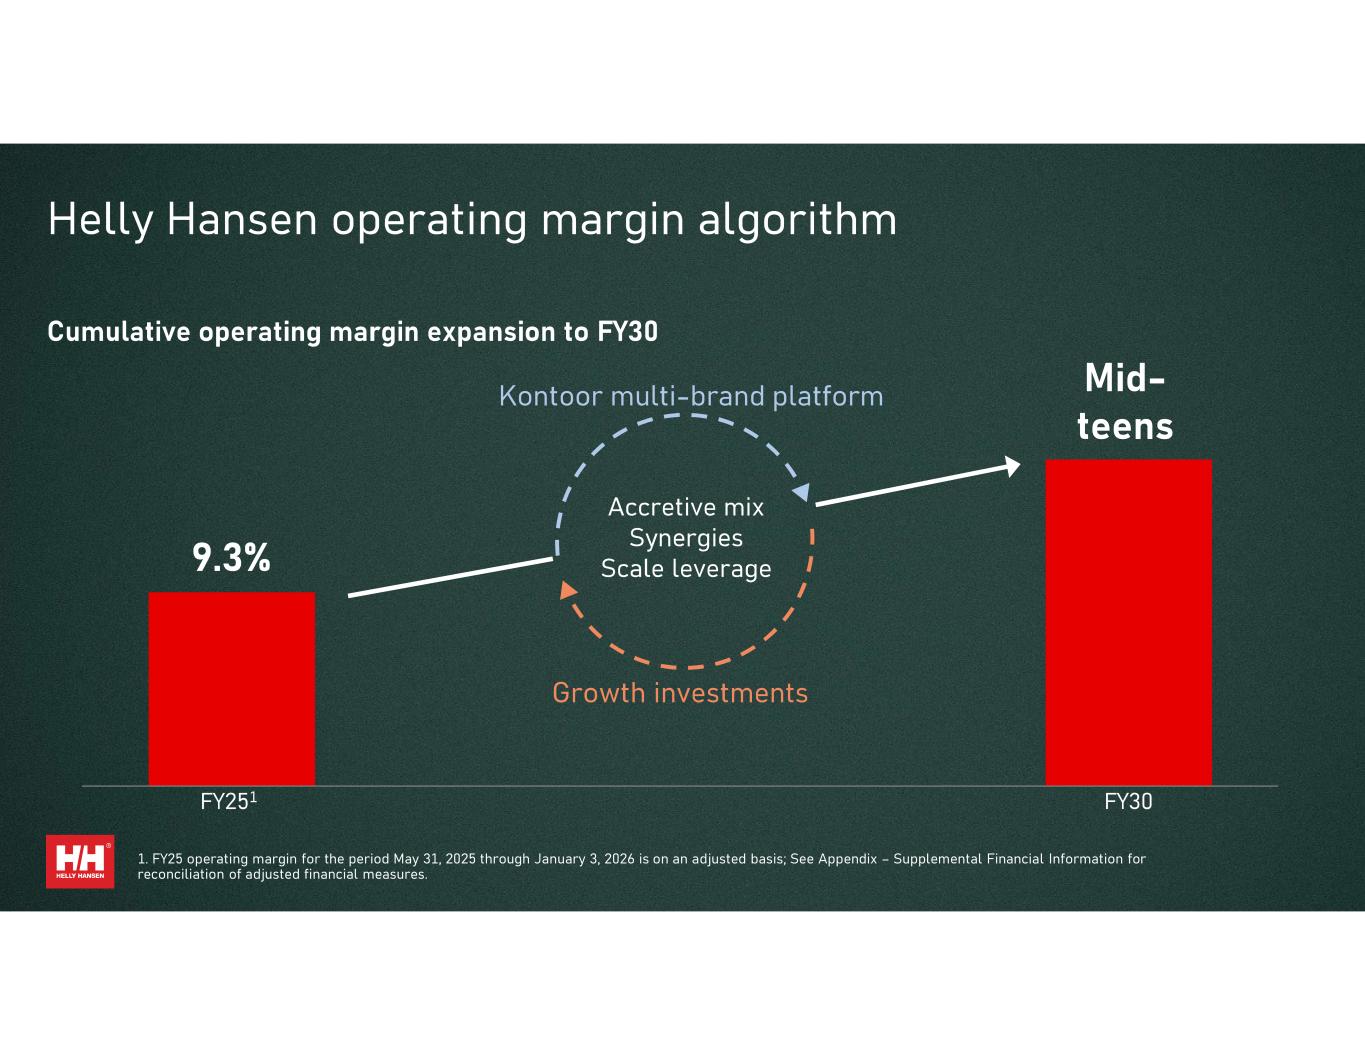
1. FY25 operating margin for the period May 31, 2025 through January 3, 2026 is on an adjusted basis; See Appendix – Supplemental Financial Information for reconciliation of adjusted financial measures.


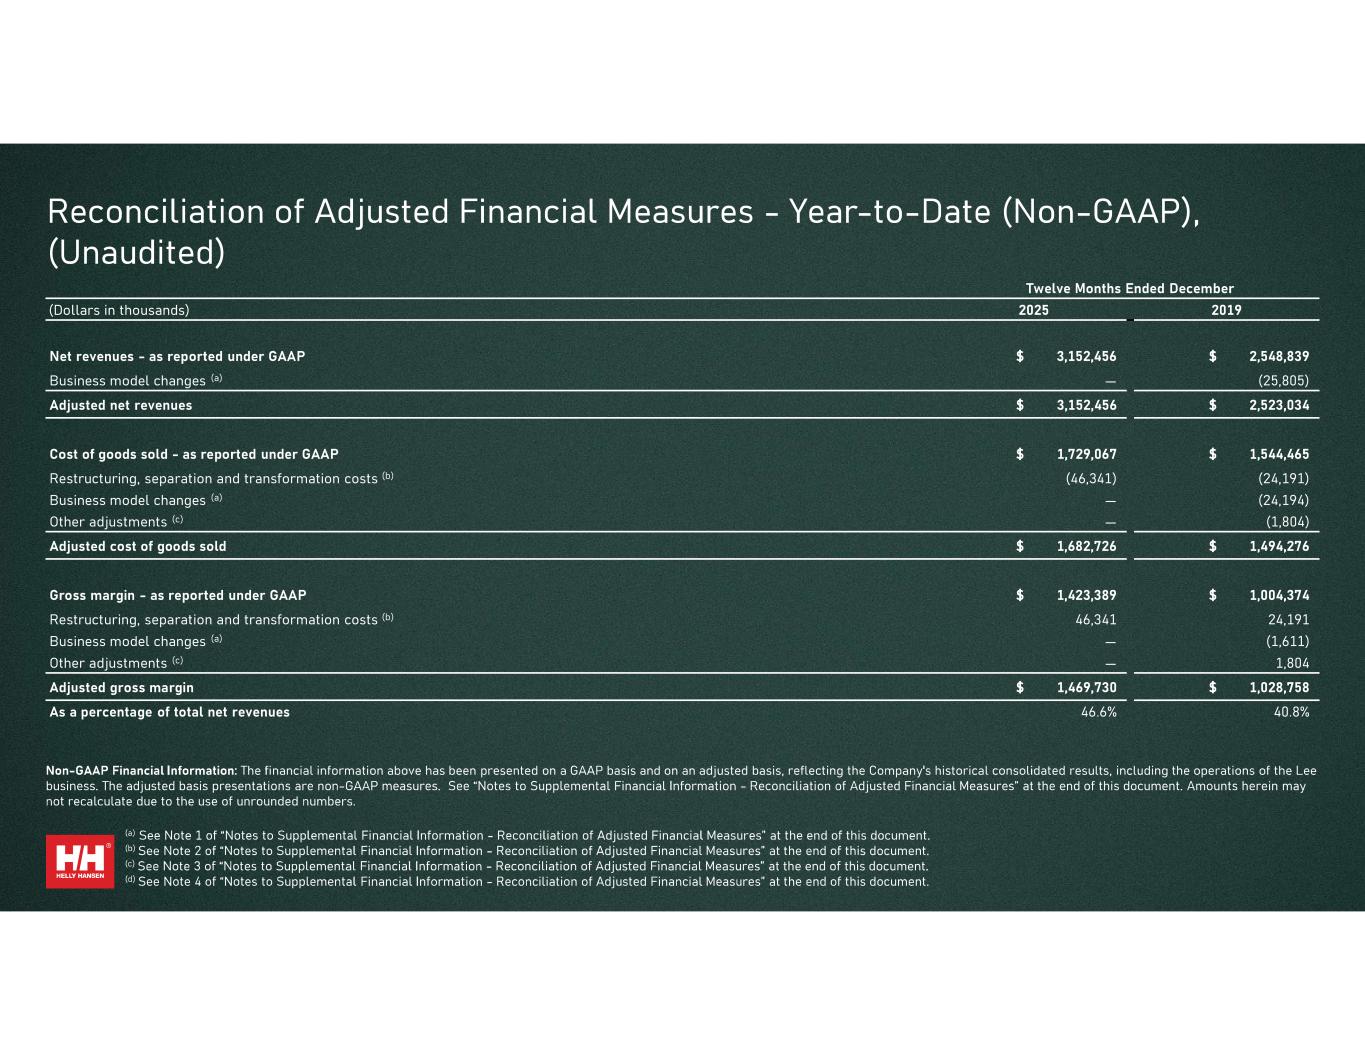
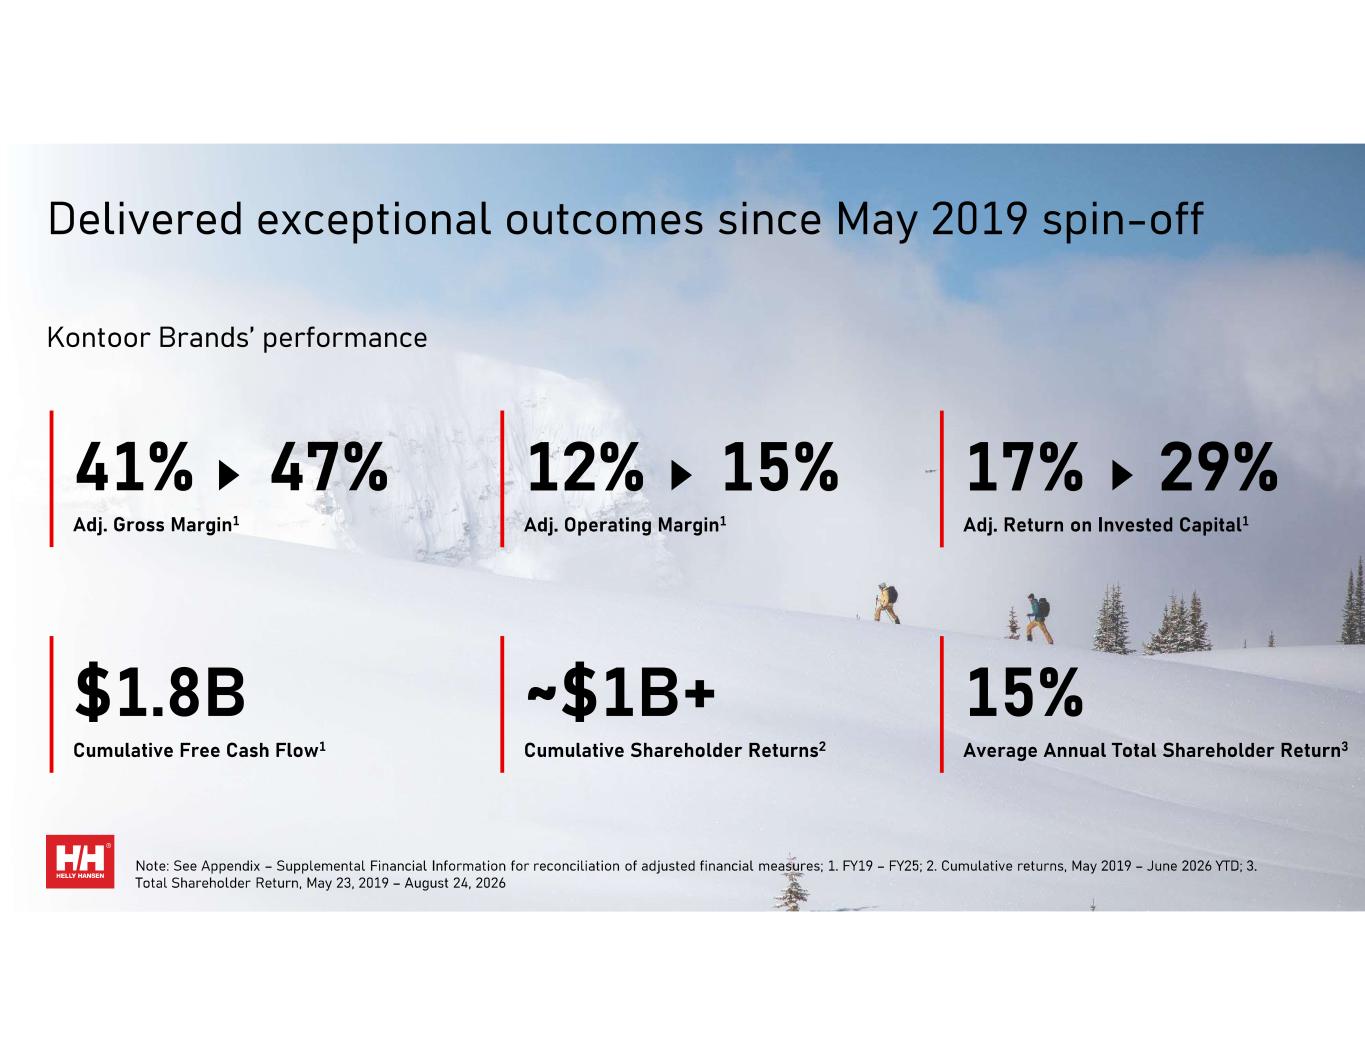
Twelve Months Ended December (Dollars in thousands) 2025 2019 Net revenues - as reported under GAAP $ 3,152,456 $ 2,548,839 Business model changes (a) — (25,805) Adjusted net revenues $ 3,152,456 $ 2,523,034 Cost of goods sold - as reported under GAAP $ 1,729,067 $ 1,544,465 Restructuring, separation and transformation costs (b) (46,341) (24,191) Business model changes (a) — (24,194) Other adjustments (c) — (1,804) Adjusted cost of goods sold $ 1,682,726 $ 1,494,276 Gross margin - as reported under GAAP $ 1,423,389 $ 1,004,374 Restructuring, separation and transformation costs (b) 46,341 24,191 Business model changes (a) — (1,611) Other adjustments (c) — 1,804 Adjusted gross margin $ 1,469,730 $ 1,028,758 As a percentage of total net revenues 46.6% 40.8%
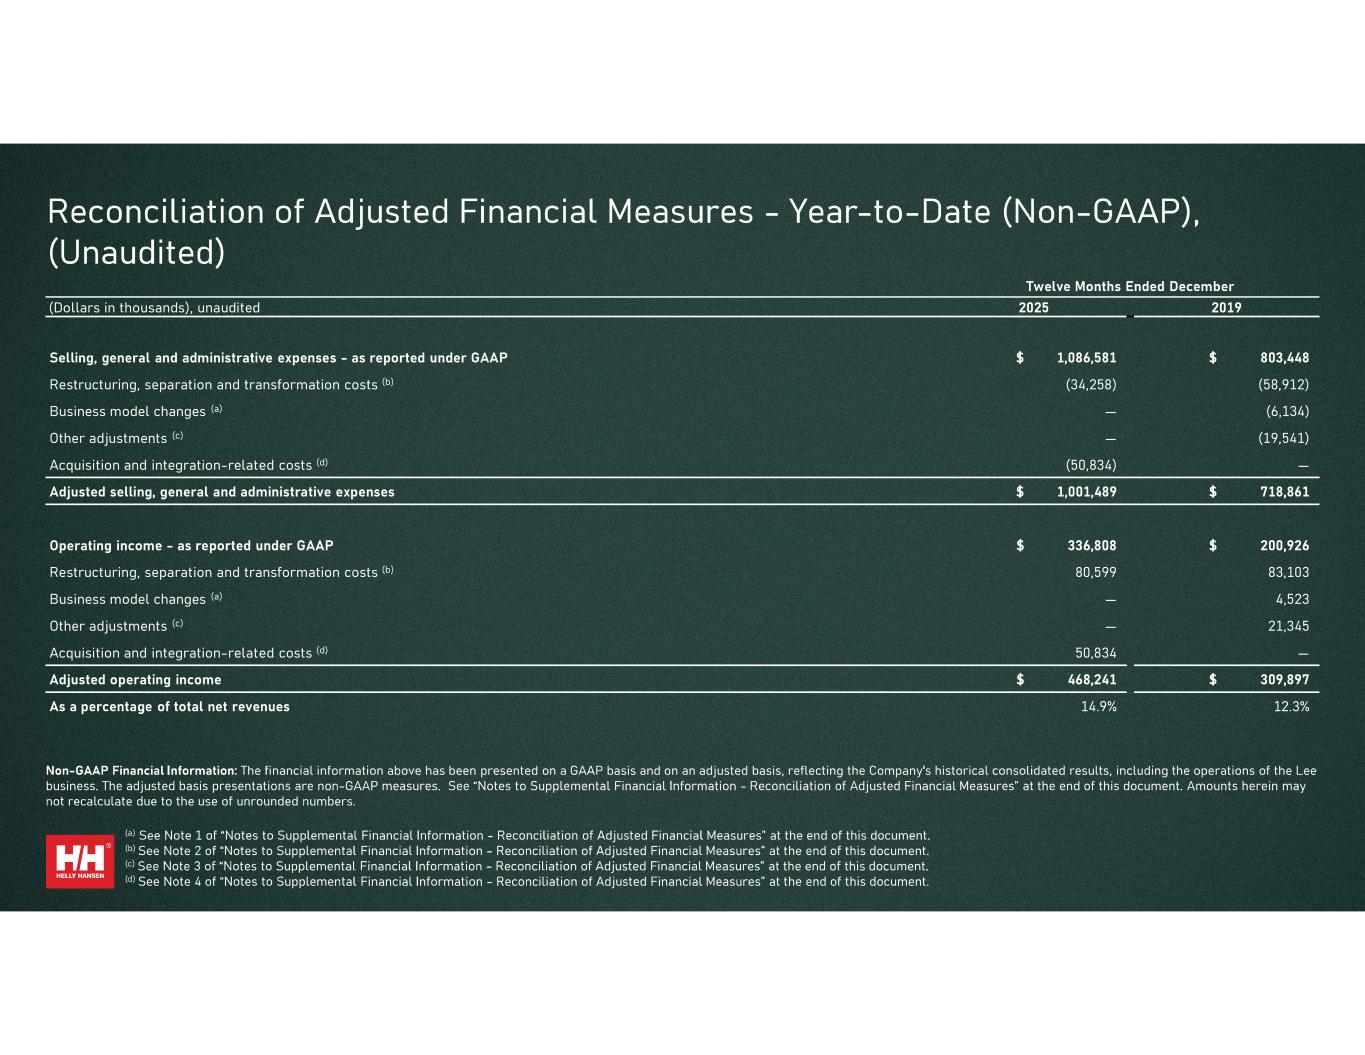
Twelve Months Ended December (Dollars in thousands), unaudited 2025 2019 Selling, general and administrative expenses - as reported under GAAP $ 1,086,581 $ 803,448 Restructuring, separation and transformation costs (b) (34,258) (58,912) Business model changes (a) — (6,134) Other adjustments (c) — (19,541) Acquisition and integration-related costs (d) (50,834) — Adjusted selling, general and administrative expenses $ 1,001,489 $ 718,861 Operating income - as reported under GAAP $ 336,808 $ 200,926 Restructuring, separation and transformation costs (b) 80,599 83,103 Business model changes (a) — 4,523 Other adjustments (c) — 21,345 Acquisition and integration-related costs (d) 50,834 — Adjusted operating income $ 468,241 $ 309,897 As a percentage of total net revenues 14.9% 12.3%
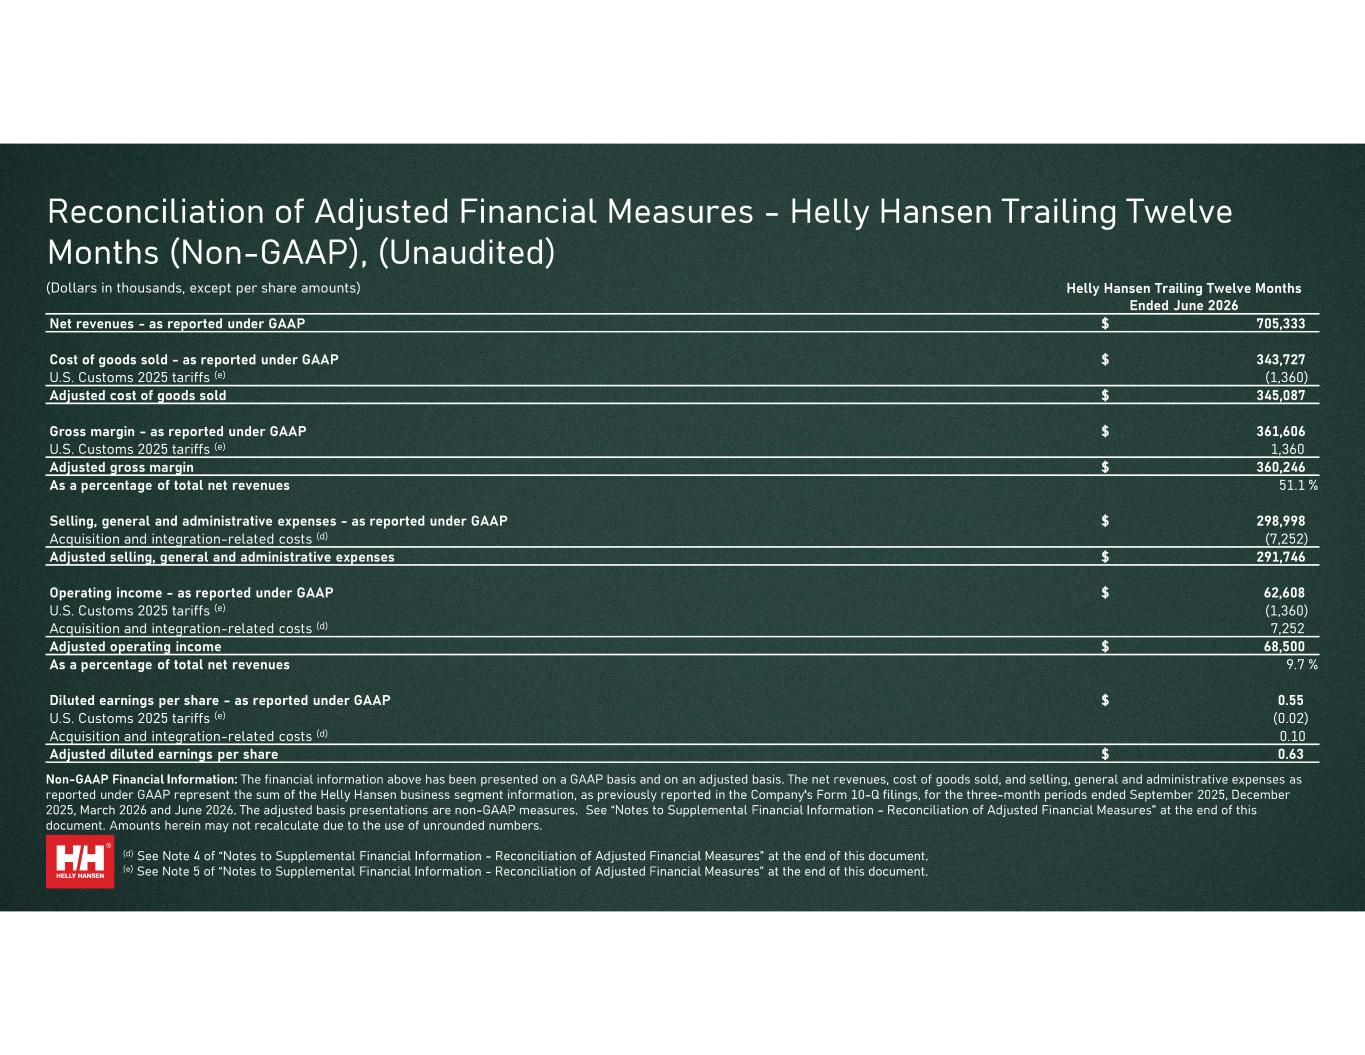
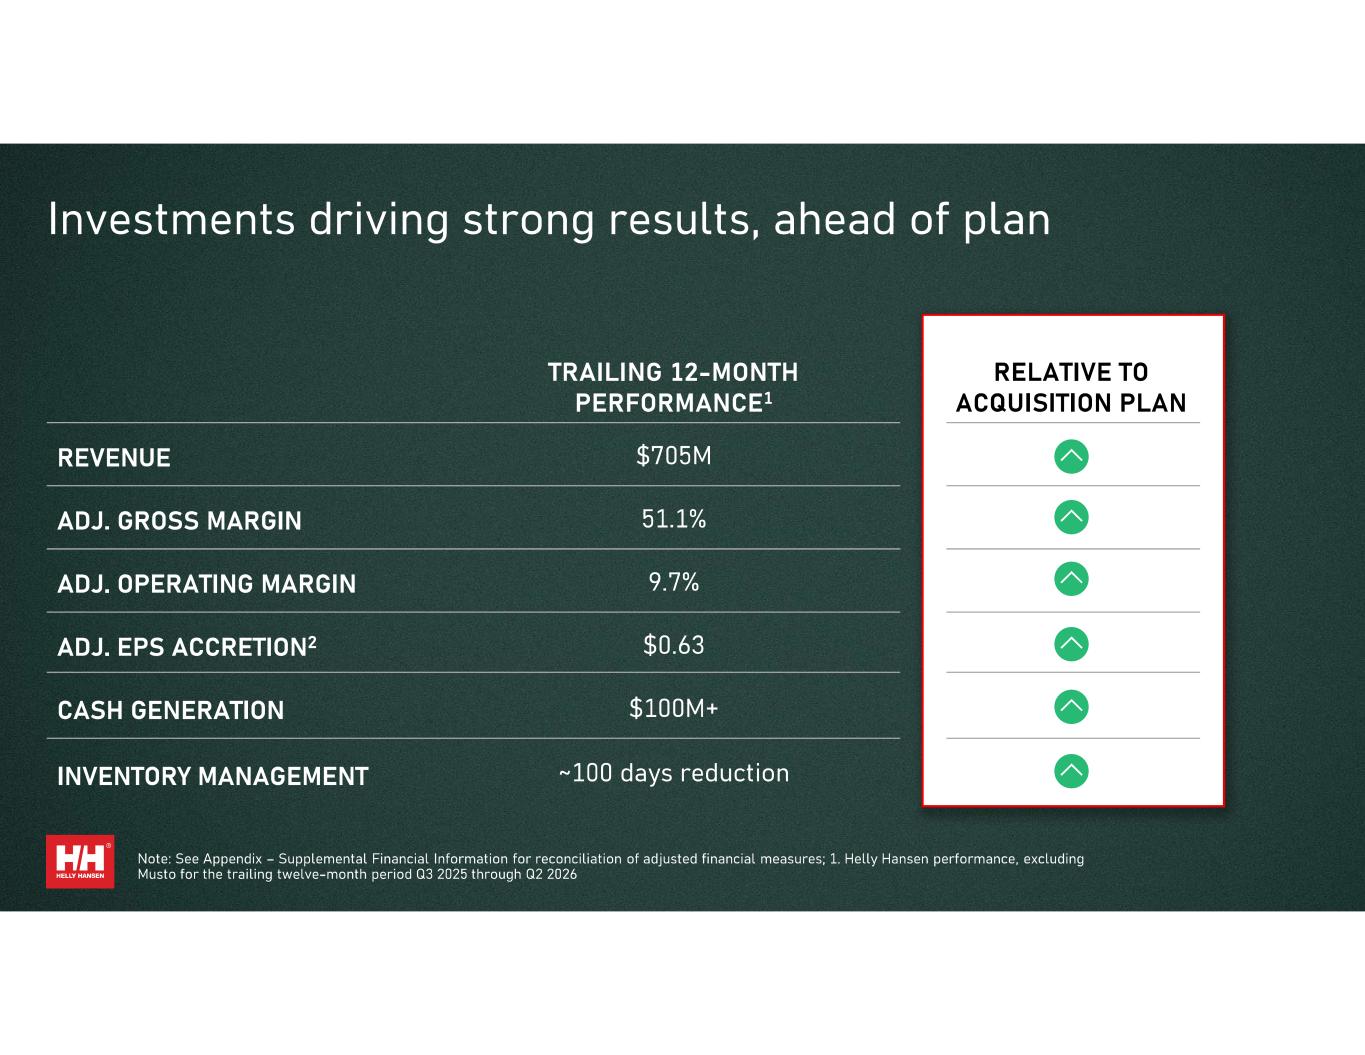
(Dollars in thousands, except per share amounts) Helly Hansen Trailing Twelve Months Ended June 2026 Net revenues - as reported under GAAP $ 705,333 Cost of goods sold - as reported under GAAP $ 343,727 U.S. Customs 2025 tariffs (e) (1,360) Adjusted cost of goods sold $ 345,087 Gross margin - as reported under GAAP $ 361,606 U.S. Customs 2025 tariffs (e) 1,360 Adjusted gross margin $ 360,246 As a percentage of total net revenues 51.1 % Selling, general and administrative expenses - as reported under GAAP $ 298,998 Acquisition and integration-related costs (d) (7,252) Adjusted selling, general and administrative expenses $ 291,746 Operating income - as reported under GAAP $ 62,608 U.S. Customs 2025 tariffs (e) (1,360) Acquisition and integration-related costs (d) 7,252 Adjusted operating income $ 68,500 As a percentage of total net revenues 9.7 % Diluted earnings per share - as reported under GAAP $ 0.55 U.S. Customs 2025 tariffs (e) (0.02) Acquisition and integration-related costs (d) 0.10 Adjusted diluted earnings per share $ 0.63
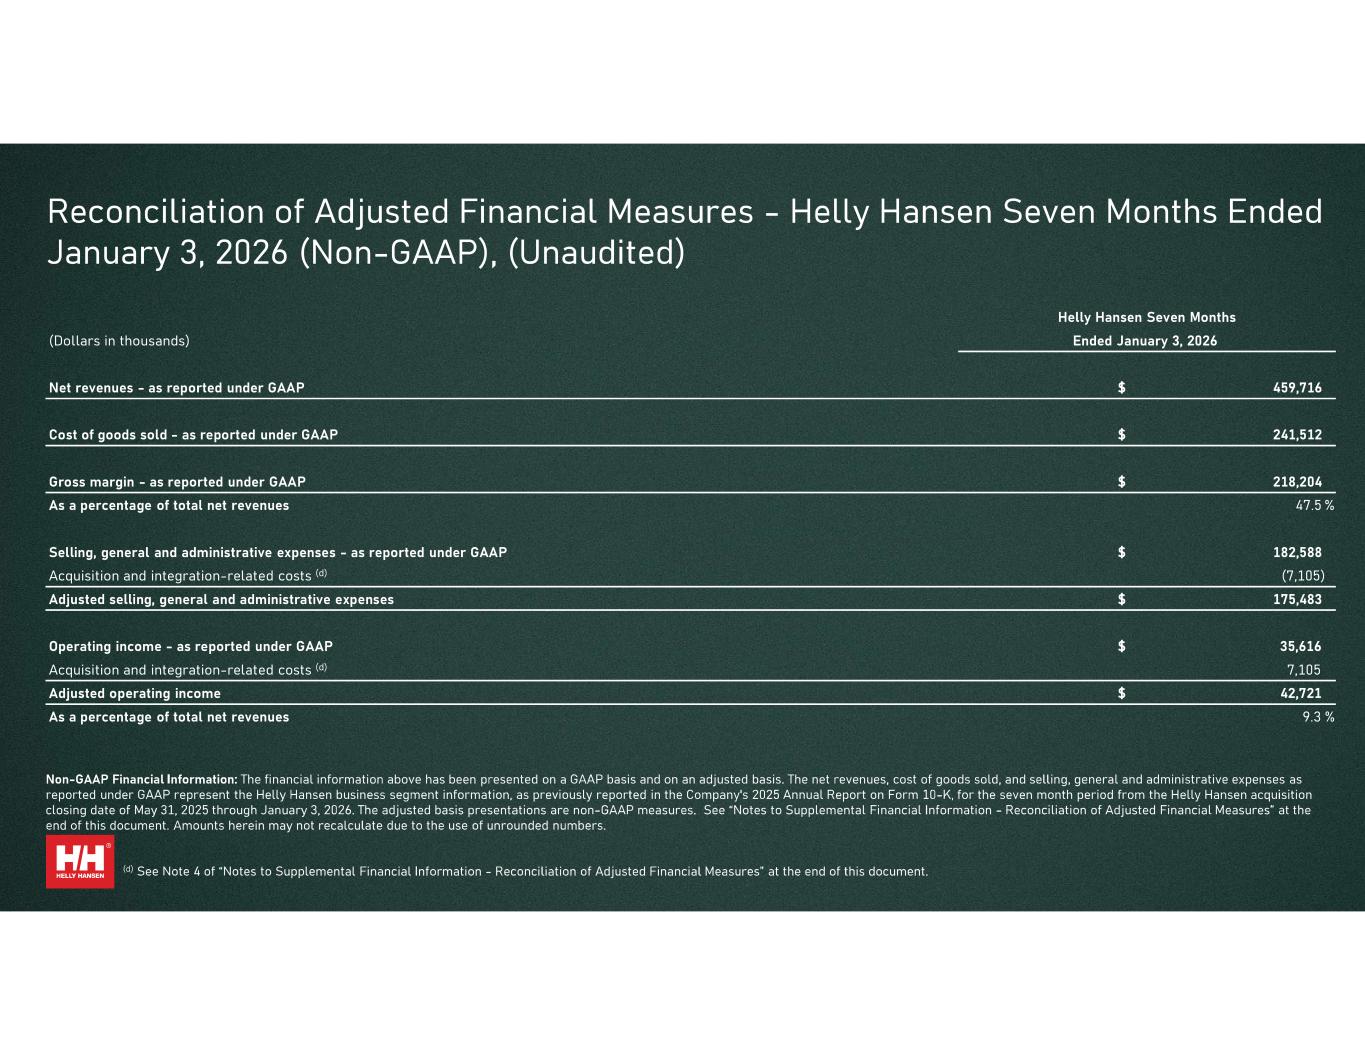
Helly Hansen Seven Months (Dollars in thousands) Ended January 3, 2026 Net revenues - as reported under GAAP $ 459,716 Cost of goods sold - as reported under GAAP $ 241,512 Gross margin - as reported under GAAP $ 218,204 As a percentage of total net revenues 47.5 % Selling, general and administrative expenses - as reported under GAAP $ 182,588 Acquisition and integration-related costs (d) (7,105) Adjusted selling, general and administrative expenses $ 175,483 Operating income - as reported under GAAP $ 35,616 Acquisition and integration-related costs (d) 7,105 Adjusted operating income $ 42,721 As a percentage of total net revenues 9.3 %
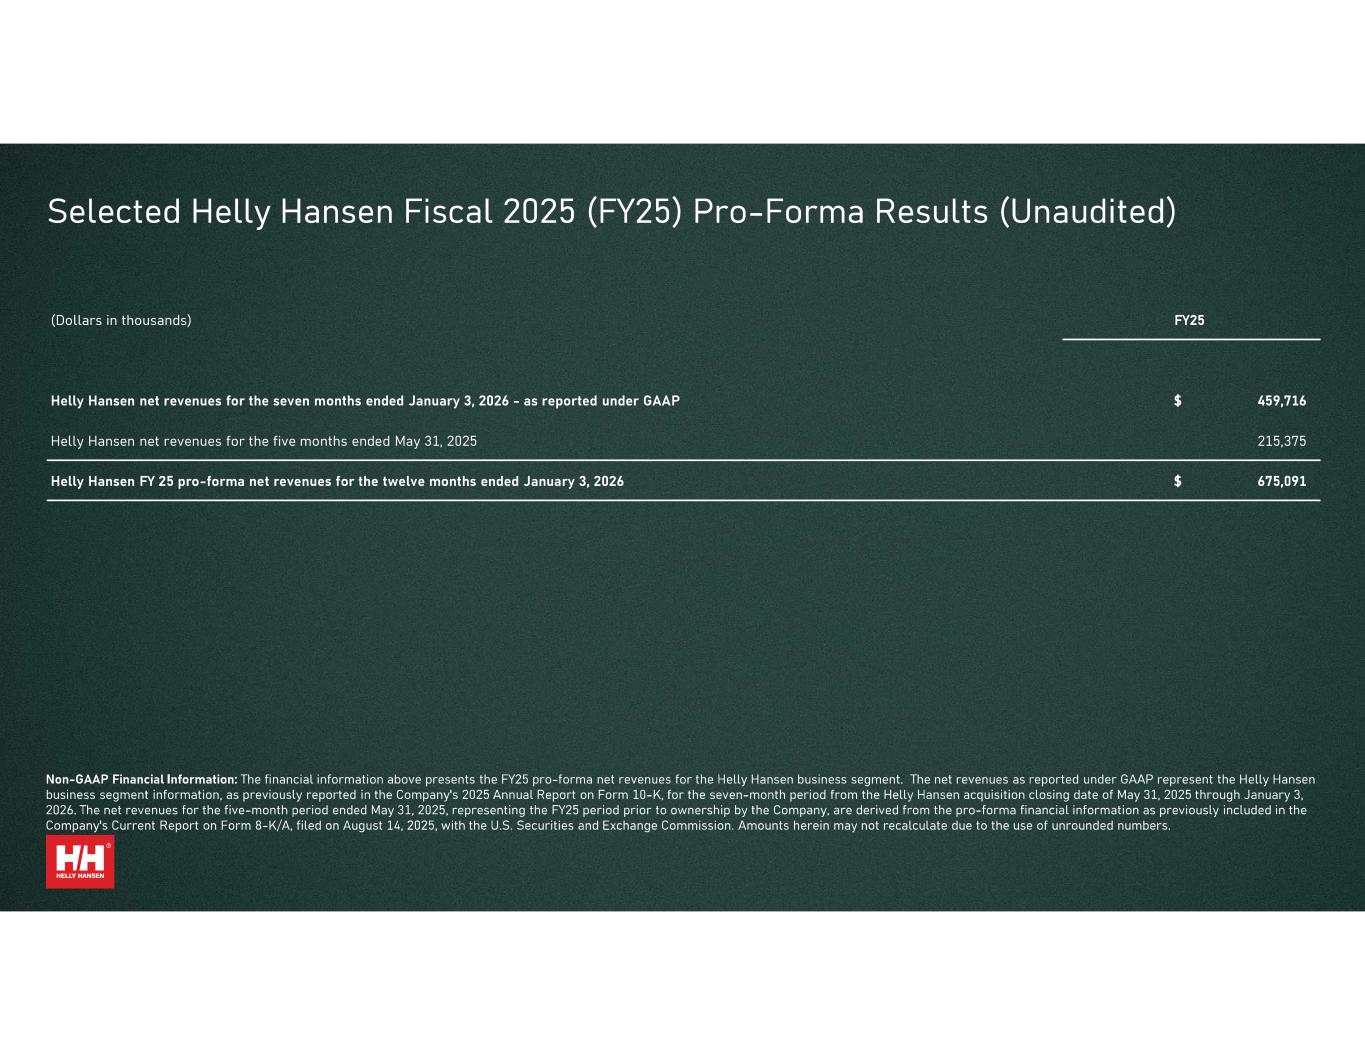
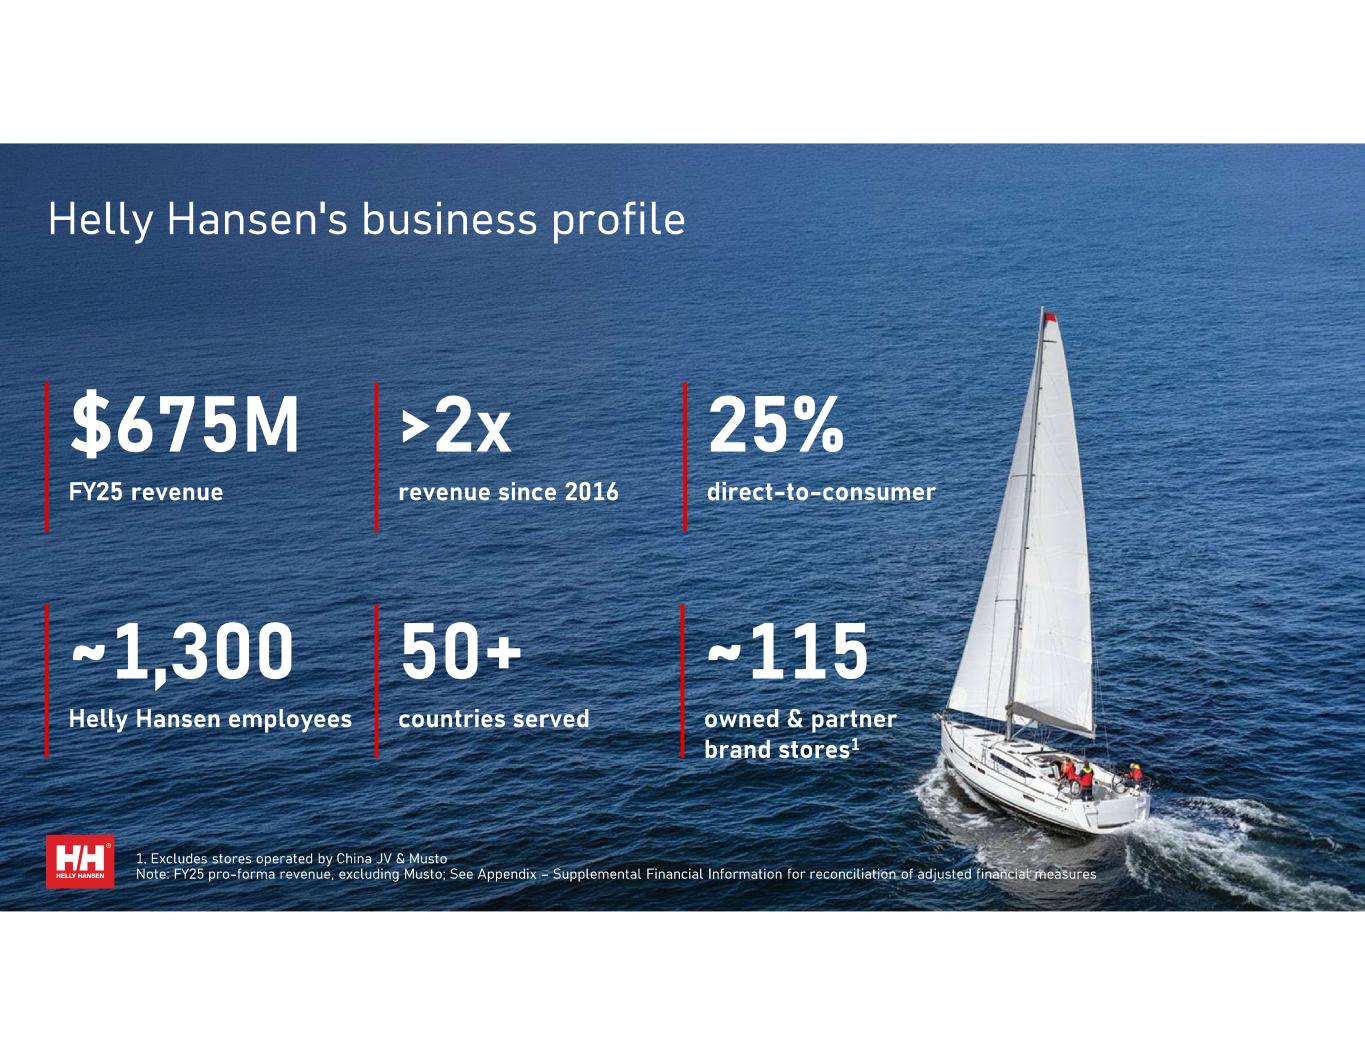
(Dollars in thousands) FY25 Helly Hansen net revenues for the seven months ended January 3, 2026 - as reported under GAAP $ 459,716 Helly Hansen net revenues for the five months ended May 31, 2025 215,375 Helly Hansen FY 25 pro-forma net revenues for the twelve months ended January 3, 2026 $ 675,091
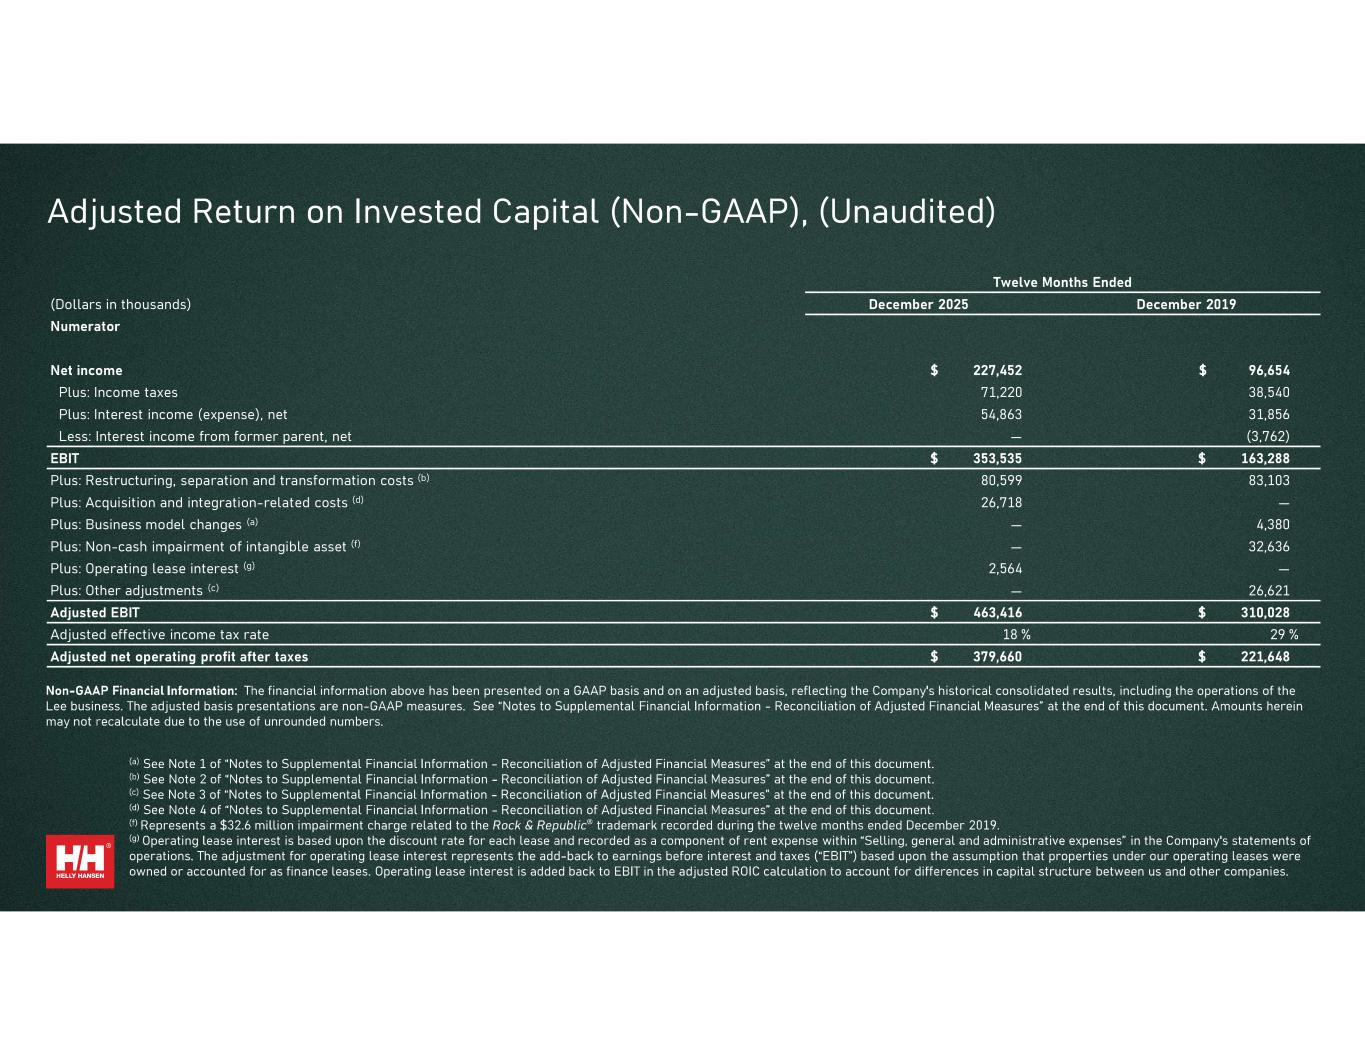
Twelve Months Ended (Dollars in thousands) December 2025 December 2019 Numerator Net income $ 227,452 $ 96,654 Plus: Income taxes 71,220 38,540 Plus: Interest income (expense), net 54,863 31,856 Less: Interest income from former parent, net — (3,762) EBIT $ 353,535 $ 163,288 Plus: Restructuring, separation and transformation costs (b) 80,599 83,103 Plus: Acquisition and integration-related costs (d) 26,718 — Plus: Business model changes (a) — 4,380 Plus: Non-cash impairment of intangible asset (f) — 32,636 Plus: Operating lease interest (g) 2,564 — Plus: Other adjustments (c) — 26,621 Adjusted EBIT $ 463,416 $ 310,028 Adjusted effective income tax rate 18 % 29 % Adjusted net operating profit after taxes $ 379,660 $ 221,648
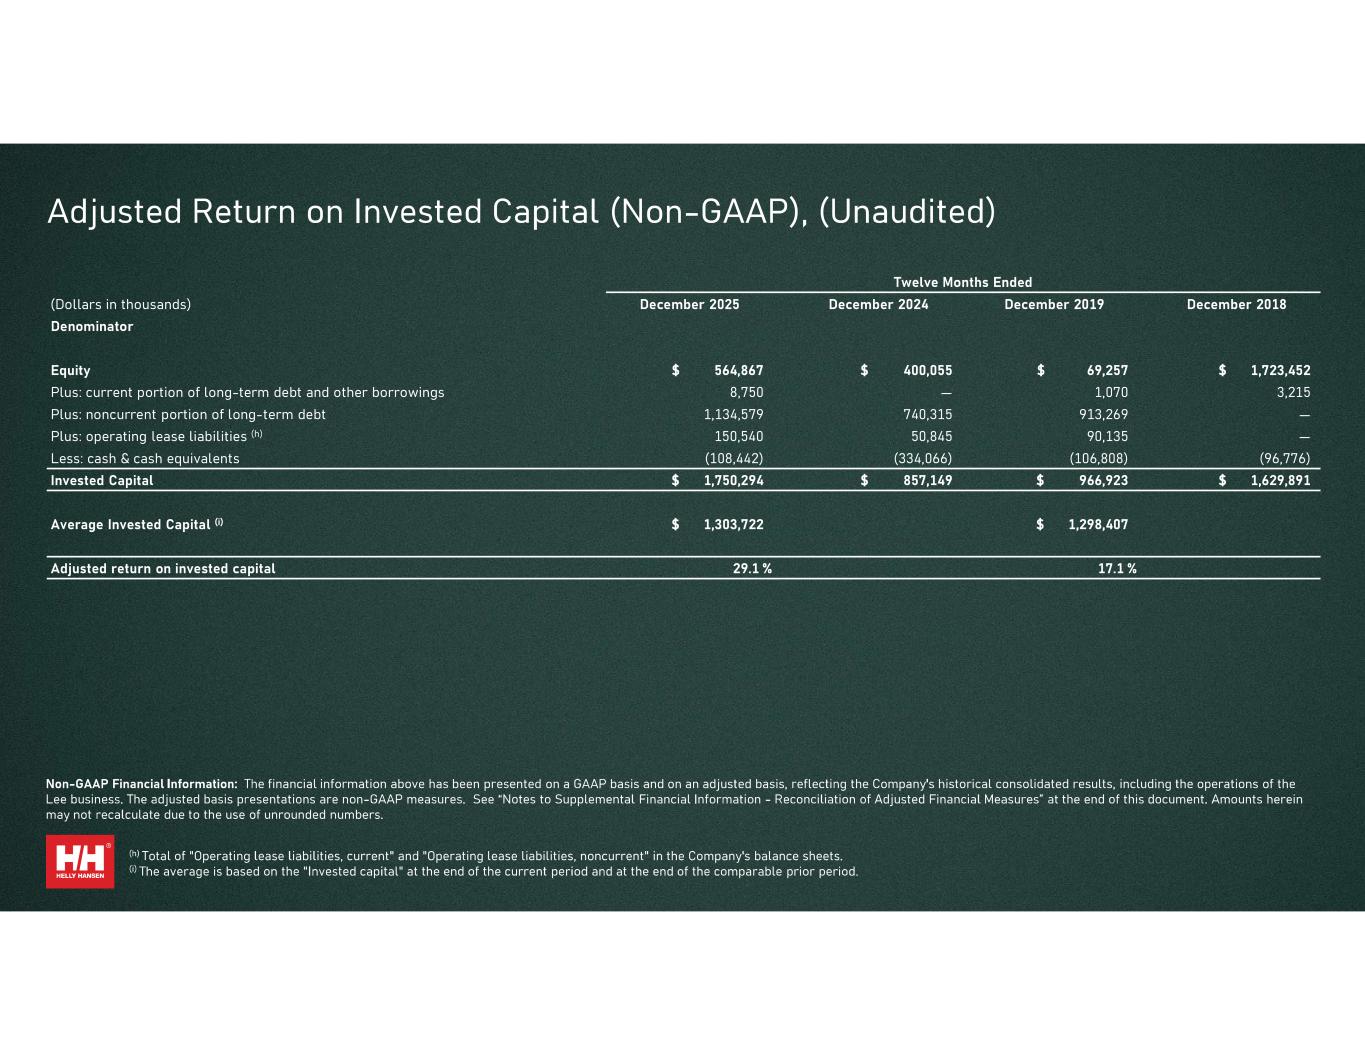
Twelve Months Ended (Dollars in thousands) December 2025 December 2024 December 2019 December 2018 Denominator Equity $ 564,867 $ 400,055 $ 69,257 $ 1,723,452 Plus: current portion of long-term debt and other borrowings 8,750 — 1,070 3,215 Plus: noncurrent portion of long-term debt 1,134,579 740,315 913,269 — Plus: operating lease liabilities (h) 150,540 50,845 90,135 — Less: cash & cash equivalents (108,442) (334,066) (106,808) (96,776) Invested Capital $ 1,750,294 $ 857,149 $ 966,923 $ 1,629,891 Average Invested Capital (i) $ 1,303,722 $ 1,298,407 Adjusted return on invested capital 29.1 % 17.1 %
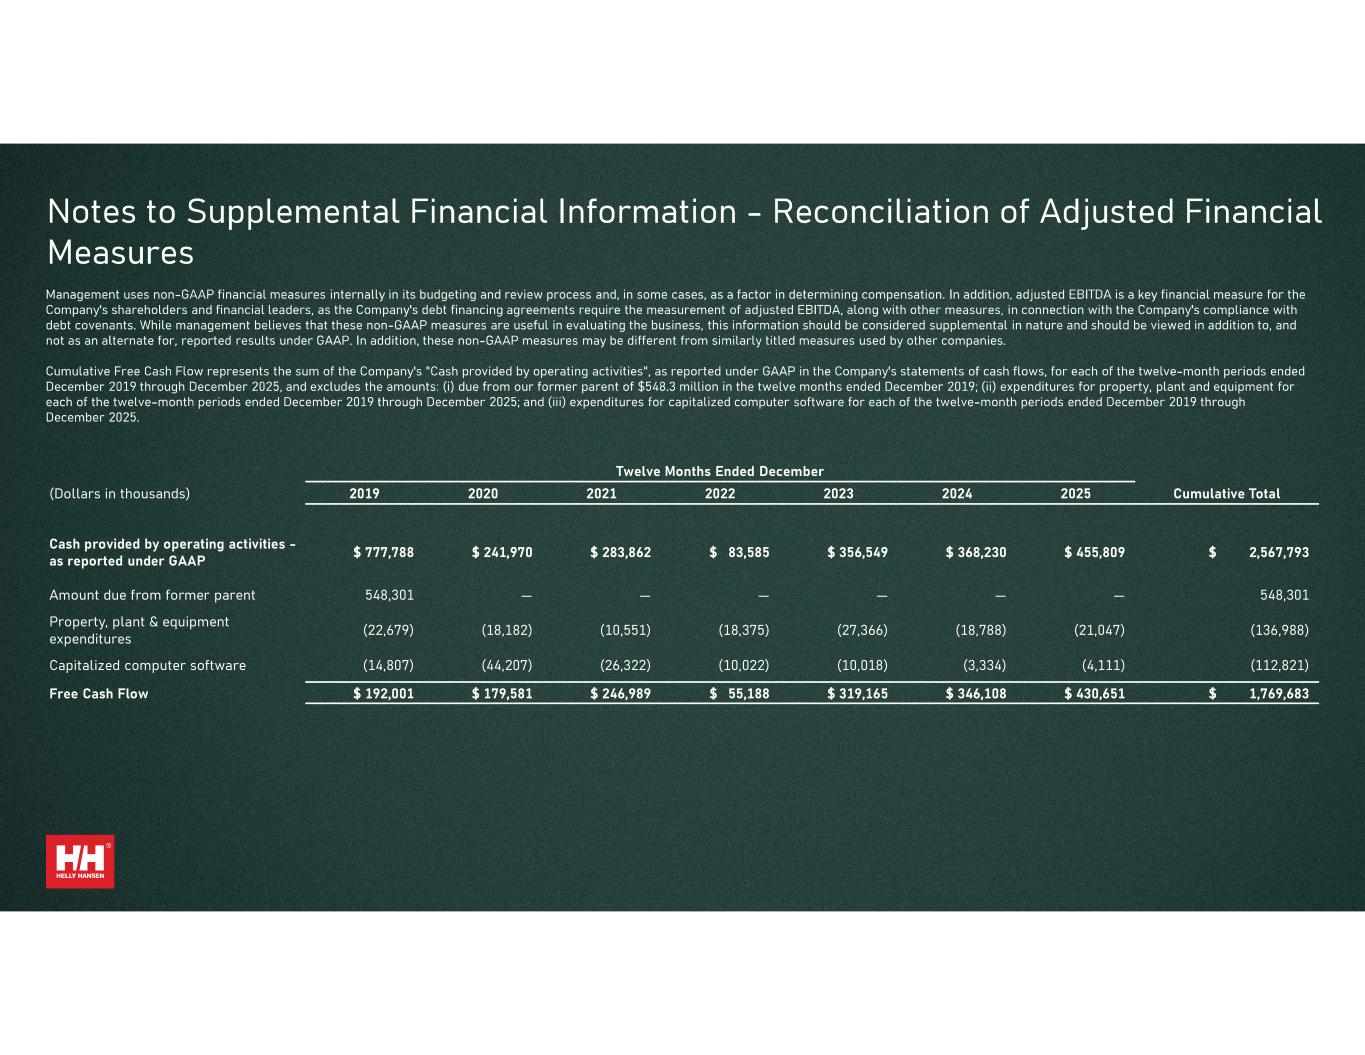
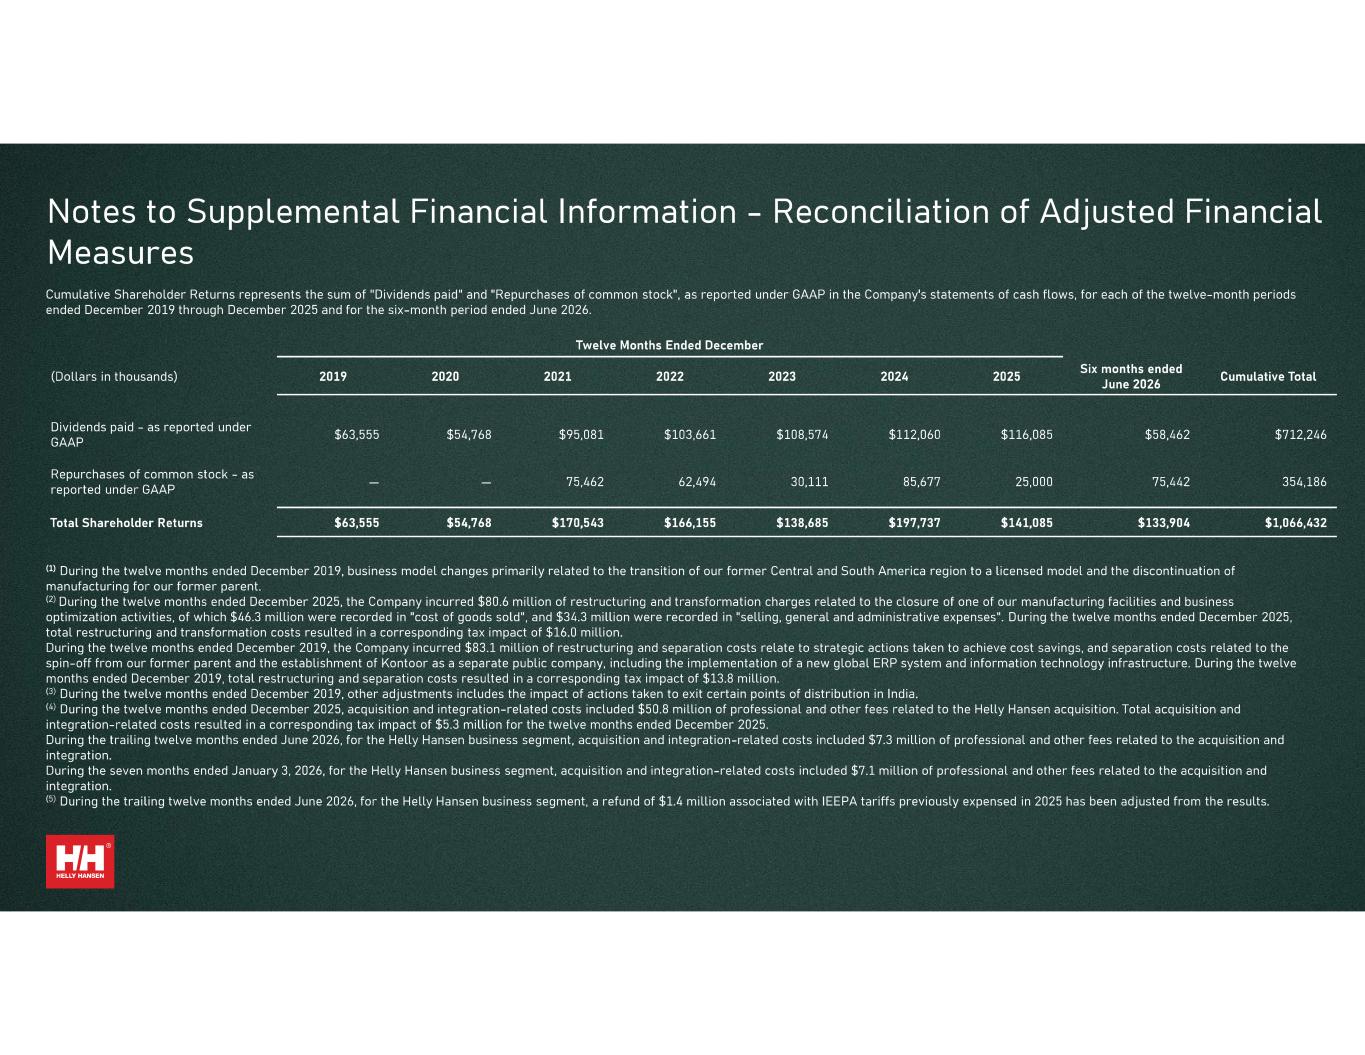
Twelve Months Ended December (Dollars in thousands) 2019 2020 2021 2022 2023 2024 2025 Cumulative Total Cash provided by operating activities - as reported under GAAP $ 777,788 $ 241,970 $ 283,862 $ 83,585 $ 356,549 $ 368,230 $ 455,809 $ 2,567,793 Amount due from former parent 548,301 — — — — — — 548,301 Property, plant & equipment expenditures (22,679) (18,182) (10,551) (18,375) (27,366) (18,788) (21,047) (136,988) Capitalized computer software (14,807) (44,207) (26,322) (10,022) (10,018) (3,334) (4,111) (112,821) Free Cash Flow $ 192,001 $ 179,581 $ 246,989 $ 55,188 $ 319,165 $ 346,108 $ 430,651 $ 1,769,683