Shareholder Report
Jun. 30, 2026
USD ($)
$ / shares
WHAT WERE THE FUND COSTS FOR THE LAST SIX MONTHS? (based on a hypothetical $10,000 investment)
|
Fund Name
|
Costs of a $10,000 investment
|
Costs paid as a percentage of a $10,000 investment*
|
|
Mairs & Power Fund
|
$33
|
0.63%
|
KEY FUND STATISTICS (as of June 30, 2026)
|
Net Assets
|
$5,556,286,173
|
|
Number of Holdings
|
48
|
|
Net Advisory Fee
|
$14,640,733
|
|
Portfolio Turnover
|
9%
|
|
30-Day SEC Yield
|
0.47%
|
WHAT DID THE FUND INVEST IN? (% of net assets as of June 30, 2026)
|
Top Holdings
|
(%)
|
|
|
NVIDIA Corp.
|
9.4
|
%
|
|
Microsoft Corp.
|
7.9
|
%
|
|
Amazon.com, Inc.
|
6.8
|
%
|
|
Alphabet, Inc. - Class C
|
4.9
|
%
|
|
Apple, Inc.
|
3.7
|
%
|
|
nVent Electric PLC
|
3.5
|
%
|
|
JPMorgan Chase & Co.
|
3.2
|
%
|
|
Taiwan Semiconductor Manufacturing Co. Ltd.
|
3.1
|
%
|
|
Roche Holding AG
|
3.0
|
%
|
|
Eli Lilly & Co.
|
3.0
|
%
|
|
Security Type
|
(%)
|
|
|
Common Stocks
|
99.9
|
%
|
|
Money Market Funds
|
0.2
|
%
|
|
Cash & Other
|
-0.1
|
%
|
Sector Breakdown*
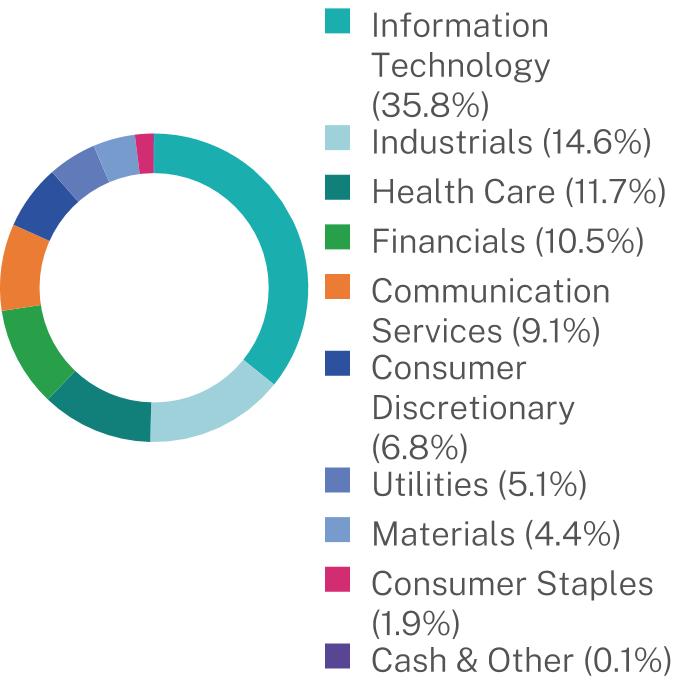
HOW HAS THE FUND CHANGED?
This is a summary of certain changes to the Fund since January 1, 2026. For more complete information, you may review the Fund’s prospectus at https://www.mairsandpower.com/funds/mpgfx or upon request at 1-800-304-7404.
Fund Name Change:
Effective April 30, 2026, the Mairs & Power Growth Fund was renamed the Mairs & Power Fund due to the Names Rule.
Changes to the Fund’s Portfolio Manager or Portfolio Management Team:
Effective at the close of business on June 30, 2026, Peter J. Johnson was named Lead Manager of the Mairs & Power Fund. Andrew R. Adams was named Co-Manager and Christopher D. Strom was named Co-Manager.
For additional information about the Fund, including its prospectus, financial information, holdings and proxy voting information, scan the QR code above or visit mairsandpower.com/funddocuments.
WHAT WERE THE FUND COSTS FOR THE LAST SIX MONTHS? (based on a hypothetical $10,000 investment)
|
Fund Name
|
Costs of a $10,000 investment
|
Costs paid as a percentage of a $10,000 investment*
|
|
Mairs & Power Balanced Fund
|
$37
|
0.73%
|
KEY FUND STATISTICS (as of June 30, 2026)
|
Net Assets
|
$661,873,813
|
|
Number of Holdings
|
243
|
|
Net Advisory Fee
|
$1,971,420
|
|
Portfolio Turnover
|
8%
|
|
Weighted Average Maturity
|
8.07 years
|
|
Effective Duration
|
5.73 years
|
|
30-Day SEC Yield
|
2.15%
|
|
Average Credit Quality
|
BBB
|
WHAT DID THE FUND INVEST IN? (% of net assets as of June 30, 2026)
|
Top 10 Issuers
|
(%)
|
|
|
Alphabet, Inc.
|
3.4
|
%
|
|
Microsoft Corp.
|
3.3
|
%
|
|
Amazon.com, Inc.
|
3.0
|
%
|
|
Texas Instruments, Inc.
|
2.9
|
%
|
|
Ecolab, Inc.
|
2.6
|
%
|
|
Visa, Inc.
|
2.5
|
%
|
|
Entegris, Inc.
|
2.4
|
%
|
|
United States Treasury Note/Bond
|
2.3
|
%
|
|
Xcel Energy, Inc.
|
2.2
|
%
|
|
Motorola Solutions, Inc.
|
2.1
|
%
|
|
Security Type
|
(%)
|
|
|
Common Stocks
|
63.0
|
%
|
|
Corporate Bonds
|
32.0
|
%
|
|
U.S. Treasury Securities
|
2.3
|
%
|
|
Municipal Bonds
|
2.1
|
%
|
|
Money Market Funds
|
0.1
|
%
|
|
Cash & Other
|
0.5
|
%
|
Sector Breakdown*
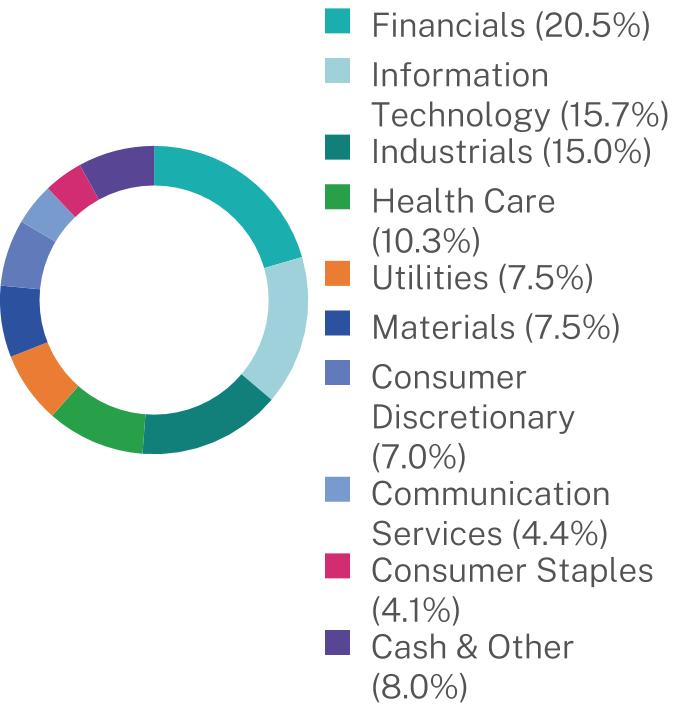
WHAT WERE THE FUND COSTS FOR THE LAST SIX MONTHS? (based on a hypothetical $10,000 investment)
|
Fund Name
|
Costs of a $10,000 investment
|
Costs paid as a percentage of a $10,000 investment*
|
|
Mairs & Power Small Cap Fund
|
$54
|
0.96%
|
KEY FUND STATISTICS (as of June 30, 2026)
|
Net Assets
|
$269,602,965
|
|
Number of Holdings
|
42
|
|
Net Advisory Fee
|
$979,373
|
|
Portfolio Turnover
|
19%
|
|
30-Day SEC Yield
|
0.00%
|
WHAT DID THE FUND INVEST IN? (% of net assets as of June 30, 2026)
|
Top Holdings
|
(%)
|
|
|
AAR Corp.
|
4.4
|
%
|
|
Plexus Corp.
|
4.4
|
%
|
|
Ambarella, Inc.
|
4.0
|
%
|
|
Cognex Corp.
|
4.0
|
%
|
|
Bio-Techne Corp.
|
3.9
|
%
|
|
Knife River Corp.
|
3.9
|
%
|
|
Entegris, Inc.
|
3.8
|
%
|
|
JBT Marel Corp.
|
3.6
|
%
|
|
Bentley Systems, Inc. - Class B
|
3.3
|
%
|
|
nVent Electric PLC
|
3.2
|
%
|
|
Security Type
|
(%)
|
|
|
Common Stocks
|
99.7
|
%
|
|
Money Market Funds
|
0.4
|
%
|
|
Cash & Other
|
-0.1
|
%
|
Sector Breakdown*
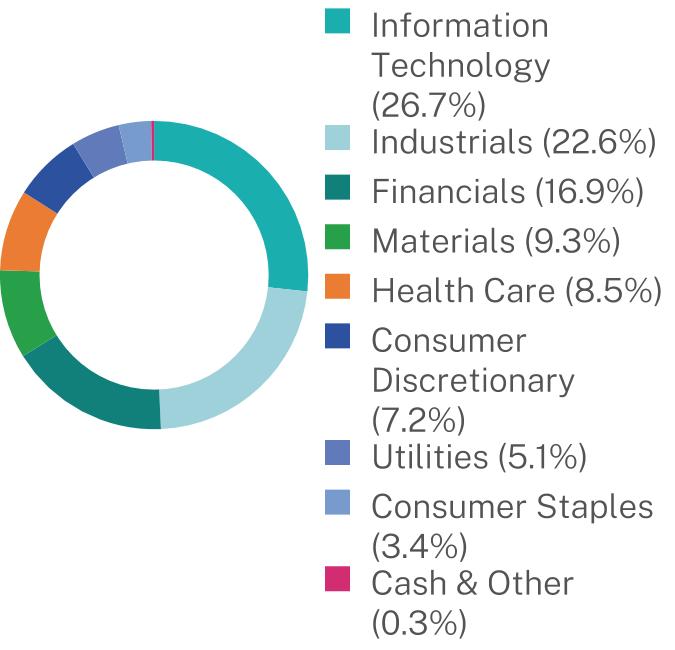
WHAT WERE THE FUND COSTS FOR THE LAST SIX MONTHS? (based on a hypothetical $10,000 investment)
|
Fund Name
|
Costs of a $10,000 investment
|
Costs paid as a percentage of a $10,000 investment*
|
|
Mairs & Power Minnesota Municipal Bond ETF
|
$12
|
0.25%
|
KEY FUND STATISTICS (as of June 30, 2026)
|
Net Assets
|
$46,803,395
|
|
Number of Holdings
|
127
|
|
Net Advisory Fee
|
$52,570
|
|
Portfolio Turnover
|
8%
|
|
Weighted Average Maturity
|
10.50 years
|
|
Effective Duration
|
6.18 years
|
|
30-Day SEC Yield
|
3.15%
|
|
Average Credit Quality
|
AA
|
WHAT DID THE FUND INVEST IN? (% of net assets as of June 30, 2026)
|
Top 10 Issuers
|
(%)
|
|
|
State of Minnesota
|
10.6
|
%
|
|
Stillwater Independent School District No 834
|
3.4
|
%
|
|
County of Ramsey MN
|
3.3
|
%
|
|
City of Bloomington MN
|
3.2
|
%
|
|
Metropolitan Council
|
3.0
|
%
|
|
North Mankato Port Authority
|
2.9
|
%
|
|
County of Hennepin MN
|
2.9
|
%
|
|
University of Minnesota
|
2.9
|
%
|
|
South Washington County Independent School District No 833
|
2.8
|
%
|
|
St Paul Independent School District No 625
|
2.4
|
%
|
|
Security Type
|
(%)
|
|
|
Municipal Bonds
|
98.4
|
%
|
|
Money Market Funds
|
0.1
|
%
|
|
Cash & Other
|
1.5
|
%
|
|
*Credit Breakdown
|
(%)
|
|
|
AAA
|
34.3
|
%
|
|
AA
|
49.5
|
%
|
|
A
|
10.9
|
%
|
|
BBB and Lower
|
2.8
|
%
|
|
Unrated
|
1.0
|
%
|
|
Cash & Cash Equivalent
|
1.5
|
%
|
| [1] |
|
||
| [2] |
|
||
| [3] |
|
||
| [4] |
|
||
| [5] |
|
||
| [6] |
|
||
| [7] |
|
||
| [8] |
|