What were the Fund’s costs for the last year?
(based on a hypothetical $10,000 investment)
| Fund Ticker | Costs of a $10,000 investment* | Costs paid as a percentage of a $10,000 investment* |
| BTAL | $103 | 1.25% |
| * | This includes short expenses |
|
How did the Fund perform last year?
The objective of the AGF U.S. Market Neutral Anti-Beta Fund (“BTAL”) is to provide a consistent negative beta exposure to the U.S. equity market. BTAL strives to achieve its objective by investing primarily in long positions in low beta U.S. equities and short positions in high beta U.S. equities. BTAL finished the reporting period (July 1, 2025 to June 30, 2026) down - 35.40%. The Fund had a negative return over the 12- month period but outperformed its benchmark index the Dow Jones U.S. Thematic Market Neutral Low Beta Index, which returned -37.18% during that period. The broad U.S. equity market, as represented by the Standard and Poor’s (S&P) 500 Index, finished the reporting period with a return of 22.33%. During the reporting period, the broad U.S. equity market generally trended upwards; primarily driven by better underlying fundamentals, AI capital expenditure (CapEx), and the strength of corporate earnings growth despite global uncertainty. Naturally, given the general upward trend in the U.S. equity market, BTAL underperformed the S&P 500 for the overall reporting period due to its inherent anti-beta bias. |
How did the Fund perform over the past 10 years?
The chart below shows the Fund’s performance over the last 10 years and is based on the Fund’s net asset value (“NAV”).
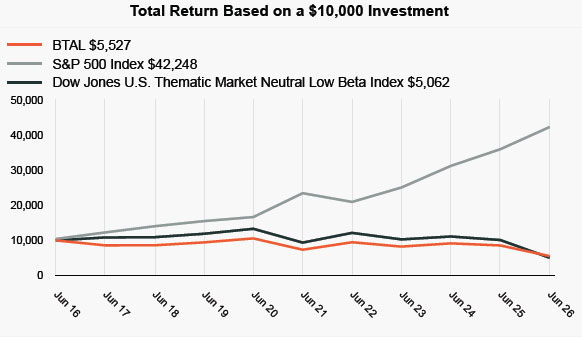
The above chart represents historical performance of a hypothetical $10,000 investment in the Fund over the past 10 years. The Fund’s past performance is not a good predictor of how the Fund will perform in the future. The chart and Average Annual Total Return table below do not reflect the deduction of taxes that a shareholder would pay on fund distributions or redemption of fund shares.
| Average Annual Total Returns | |||
| 1 Year | 5 years | 10 Years | |
| BTAL NAV Return | -35.40% | -5.50% | -5.75% |
| S&P 500 Index | 22.33% | 13.41% | 15.50% |
| Dow Jones U.S. Thematic Market Neutral Low Beta Index | -37.18% | -7.49% | -6.58% |
| Key Fund Statistics | |
| Net Assets | $280,066,543 |
| Number of Portfolio Holdings | 405 |
| Portfolio Turnover Rate | 68% |
| Net Investment Advisory Fees | $592,172 |
| Fund Sector Weights (Based on Net Assets) | ||||
| % of Long Weight | % of Short Weight | |||
| Communication Services | 2.6% | -2.5% | ||
| Consumer Discretionary | 9.8% | -9.6% | ||
| Consumer Staples | 4.7% | -5.0% | ||
| Energy | 2.7% | -2.3% | ||
| Financials | 13.8% | -12.4% | ||
| Health Care | 9.3% | -9.2% | ||
| Industrials | 15.3% | -14.8% | ||
| Information Technology | 11.8% | -12.6% | ||
| Materials | 3.9% | -3.5% | ||
| Real Estate | 4.9% | -4.7% | ||
| Utilities | 4.3% | -3.7% | ||
| Top Ten Holdings (Based on Net Assets) | ||||||
| Long | Short | |||||
| Okta, Inc. | 0.6% | Micron Technology, Inc. | -0.6% | |||
| Molina Healthcare, Inc. | 0.5% | Astera Labs, Inc. | -0.6% | |||
| Rivian Automotive, Inc. | 0.5% | Marvell Technology, Inc. | -0.6% | |||
| Cardinal Health, Inc. | 0.5% | Allegro MicroSystems, Inc. | -0.6% | |||
| AbbVie, Inc. | 0.5% | Fortune Brands Innovations, Inc. | -0.6% | |||
| Simpson Manufacturing Co., Inc. | 0.5% | MKS, Inc. | -0.6% | |||
| Cloudflare, Inc. | 0.5% | Moderna, Inc. | -0.6% | |||
| DaVita, Inc. | 0.5% | Lam Research Corp. | -0.5% | |||
| Lucid Group, Inc. | 0.5% | Onto Innovation, Inc. | -0.5% | |||
| Teledyne Technologies, Inc. | 0.5% | Credo Technology Group Holding Ltd. | -0.5% | |||
| [1] | This includes short expenses |