Shareholder Report
|
6 Months Ended |
|
Jun. 30, 2026
USD ($)
Holding
|
|---|
| Shareholder Report [Line Items] |
|
| Document Type |
N-CSRS
|
| Amendment Flag |
false
|
| Registrant Name |
Rydex Variable Trust
|
| Entity Central Index Key |
0001064046
|
| Entity Investment Company Type |
N-1A
|
| Document Period End Date |
Jun. 30, 2026
|
| Shareholder Report Annual or Semi-Annual |
Semi-Annual Shareholder Report
|
| C000010427 |
|
| Shareholder Report [Line Items] |
|
| Fund Name |
Banking Fund
|
| Class Name |
Variable Annuity
|
| No Trading Symbol [Flag] |
true
|
| Annual or Semi-Annual Statement [Text Block] |
This semi-annual shareholder report contains important information about the Banking Fund for the period from January 1, 2026 to June 30, 2026.
|
| Additional Information [Text Block] |
You can find additional information about the fund at GuggenheimInvestments.com/variable-insurance-funds. You can also request this information by contacting 800 820 0888 or services@guggenheiminvestments.com.
|
| Additional Information Phone Number |
800 820 0888
|
| Additional Information Email |
<span style="box-sizing: border-box; color: rgb(67, 67, 67); display: inline; flex-wrap: nowrap; font-size: 10.6667px; font-weight: 400; grid-area: auto; line-height: 12.8px; margin: 0px; overflow: visible; text-align: left; text-align-last: auto; white-space-collapse: preserve-breaks;">services@guggenheiminvestments.com</span>
|
| Additional Information Website |
<span style="box-sizing: border-box; color: rgb(67, 67, 67); display: inline; flex-wrap: nowrap; font-size: 10.6667px; font-weight: 400; grid-area: auto; line-height: 12.8px; margin: 0px; overflow: visible; text-align: left; text-align-last: auto; white-space-collapse: preserve-breaks;">GuggenheimInvestments.com/variable-insurance-funds</span>
|
| Expenses [Text Block] |
What were the Fund's costs for the last six months? * Based on a hypothetical $10,000 investment Table SummaryClass | Costs of a $10,000 Investment | Costs Paid as a % of a $10,000 Investment** |
|---|
Variable Annuity | $89 | 1.70% |
|---|
Table Summary* | Excludes expenses of the underlying funds in which the fund invests, if any. |
|---|
** | Annualized |
|---|
|
| Expenses Paid, Amount |
$ 89
|
| Factors Affecting Performance [Text Block] |
What factors materially affected the Fund's performance over the last six months? The industries that contributed the most to performance were regional banks, diversified banks, and asset management & custody banks. The industry that detracted the most was consumer finance. The holdings that contributed the most to performance were Citigroup, Inc., Bank of New York Mellon Corp., and State Street Corp. Those that detracted the most were Capital One Financial Corp., NU Holdings Limited/Cayman Islands — Class A, and HDFC Bank Ltd. ADR. |
| Line Graph [Table Text Block] |
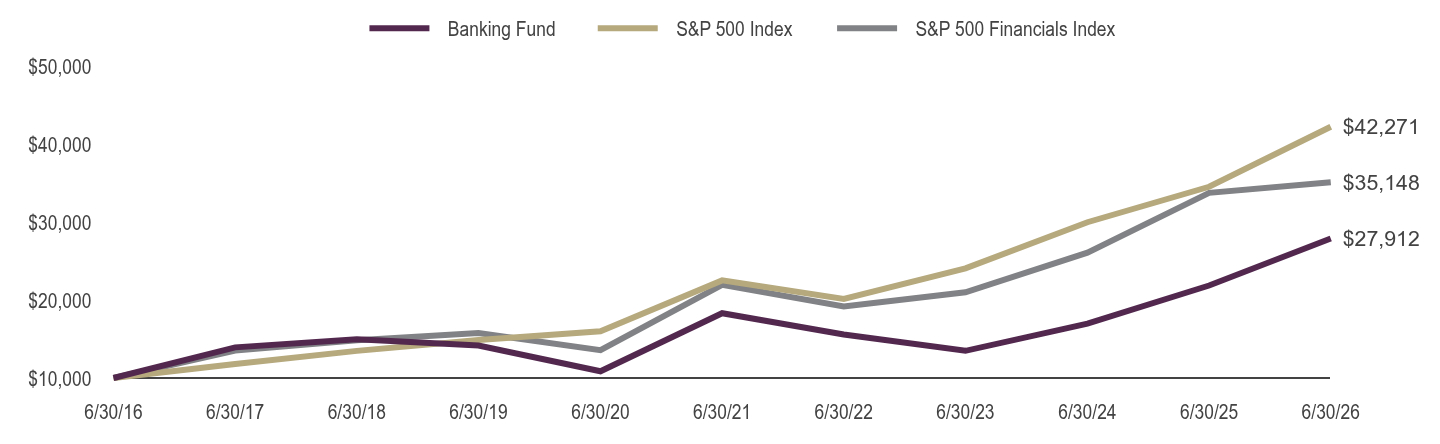
Table Summary | Banking Fund | S&P 500 Index | S&P 500 Financials Index |
|---|
6/30/16 | $10,000 | $10,000 | $10,000 |
|---|
6/30/17 | $13,933 | $11,790 | $13,537 |
|---|
6/30/18 | $14,976 | $13,484 | $14,843 |
|---|
6/30/19 | $14,176 | $14,889 | $15,780 |
|---|
6/30/20 | $10,860 | $16,006 | $13,583 |
|---|
6/30/21 | $18,324 | $22,536 | $21,972 |
|---|
6/30/22 | $15,577 | $20,144 | $19,186 |
|---|
6/30/23 | $13,492 | $24,091 | $21,009 |
|---|
6/30/24 | $16,988 | $30,006 | $26,095 |
|---|
6/30/25 | $21,878 | $34,556 | $33,778 |
|---|
6/30/26 | $27,912 | $42,271 | $35,148 |
|---|
|
| AssetsNet |
$ 6,749,470
|
| Holdings Count | Holding |
79
|
| InvestmentCompanyPortfolioTurnover |
28.00%
|
| Additional Fund Statistics [Text Block] |
Fund Statistics as of June 30, 2026 - Net Assets$6,749,470
- Total Number of Portfolio Holdings79
- Portfolio Turnover Rate28%
|
| Holdings [Text Block] |
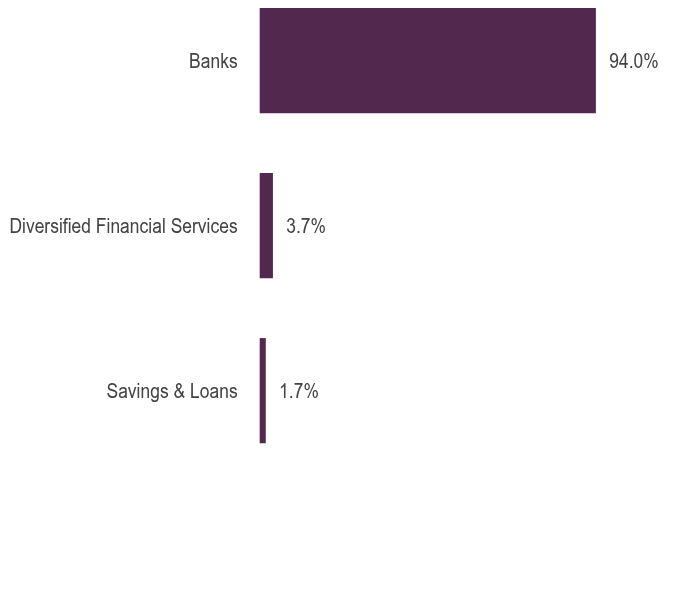
Holdings DiversificationFootnote Reference(1) (% of Net Assets) as of June 30, 2026 Table SummaryValue | Value |
|---|
Savings & Loans | 1.7% | Diversified Financial Services | 3.7% | Banks | 94.0% | |
| Largest Holdings [Text Block] |
10 Largest HoldingsFootnote Reference(2) (% of Net Assets) as of June 30, 2026 Table SummaryJPMorgan Chase & Co. | 4.0% |
|---|
Bank of America Corp. | 3.9% |
|---|
Citigroup, Inc. | 3.9% |
|---|
Wells Fargo & Co. | 3.8% |
|---|
Capital One Financial Corp. | 3.7% |
|---|
PNC Financial Services Group, Inc. | 3.2% |
|---|
U.S. Bancorp | 3.1% |
|---|
Bank of New York Mellon Corp. | 3.1% |
|---|
NU Holdings Limited/Cayman Islands — Class A | 2.8% |
|---|
Truist Financial Corp. | 2.4% |
|---|
Total | 33.9% |
|---|
|
| Material Fund Change [Text Block] |
|
| C000010428 |
|
| Shareholder Report [Line Items] |
|
| Fund Name |
Basic Materials Fund
|
| Class Name |
Variable Annuity
|
| No Trading Symbol [Flag] |
true
|
| Annual or Semi-Annual Statement [Text Block] |
This semi-annual shareholder report contains important information about the Basic Materials Fund for the period from January 1, 2026 to June 30, 2026.
|
| Additional Information [Text Block] |
You can find additional information about the fund at GuggenheimInvestments.com/variable-insurance-funds. You can also request this information by contacting 800 820 0888 or services@guggenheiminvestments.com.
|
| Additional Information Phone Number |
800 820 0888
|
| Additional Information Email |
<span style="box-sizing: border-box; color: rgb(67, 67, 67); display: inline; flex-wrap: nowrap; font-size: 10.6667px; font-weight: 400; grid-area: auto; line-height: 12.8px; margin: 0px; overflow: visible; text-align: left; text-align-last: auto; white-space-collapse: preserve-breaks;">services@guggenheiminvestments.com</span>
|
| Additional Information Website |
<span style="box-sizing: border-box; color: rgb(67, 67, 67); display: inline; flex-wrap: nowrap; font-size: 10.6667px; font-weight: 400; grid-area: auto; line-height: 12.8px; margin: 0px; overflow: visible; text-align: left; text-align-last: auto; white-space-collapse: preserve-breaks;">GuggenheimInvestments.com/variable-insurance-funds</span>
|
| Expenses [Text Block] |
What were the Fund's costs for the last six months? * Based on a hypothetical $10,000 investment Table SummaryClass | Costs of a $10,000 Investment | Costs Paid as a % of a $10,000 Investment** |
|---|
Variable Annuity | $87 | 1.69% |
|---|
Table Summary* | Excludes expenses of the underlying funds in which the fund invests, if any. |
|---|
** | Annualized |
|---|
|
| Expenses Paid, Amount |
$ 87
|
| Factors Affecting Performance [Text Block] |
What factors materially affected the Fund's performance over the last six months? The industries that contributed the most to performance were specialty chemicals, steel, and diversified metals & mining. Those that detracted the most were gold, precious metals & minerals, and silver. The holdings that contributed the most to performance were Linde plc, Nucor Corp. and Freeport-McMoRan, Inc. Those that detracted the most were Sibanye Stillwater Limited Sponsored ADR, Equinox Gold Corp., and TMC the metals co, Inc. |
| Line Graph [Table Text Block] |
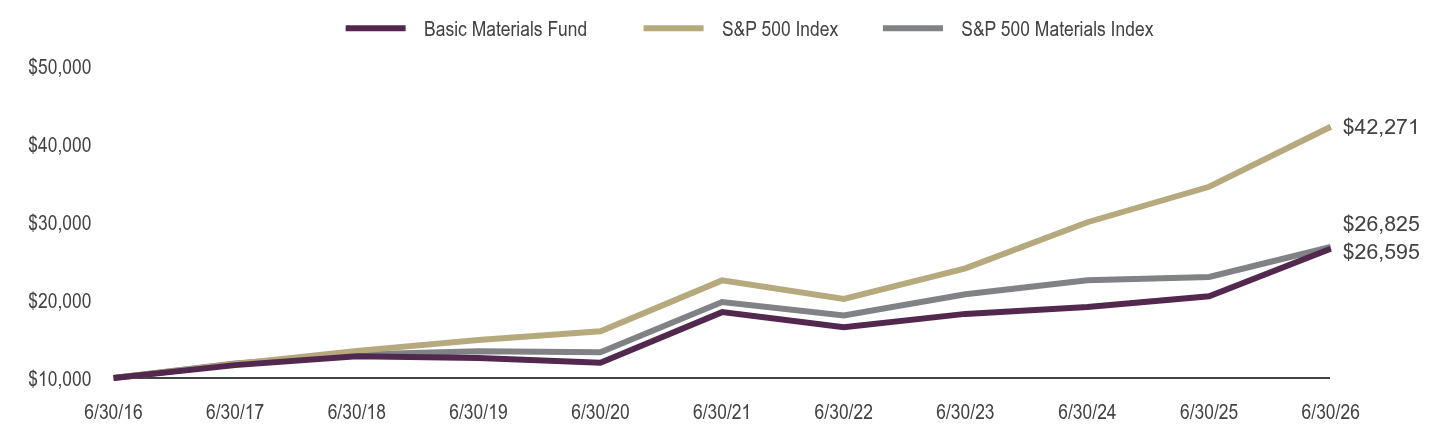
Table Summary | Basic Materials Fund | S&P 500 Index | S&P 500 Materials Index |
|---|
6/30/16 | $10,000 | $10,000 | $10,000 |
|---|
6/30/17 | $11,655 | $11,790 | $11,859 |
|---|
6/30/18 | $12,789 | $13,484 | $13,033 |
|---|
6/30/19 | $12,581 | $14,889 | $13,450 |
|---|
6/30/20 | $11,966 | $16,006 | $13,301 |
|---|
6/30/21 | $18,462 | $22,536 | $19,754 |
|---|
6/30/22 | $16,508 | $20,144 | $18,031 |
|---|
6/30/23 | $18,234 | $24,091 | $20,756 |
|---|
6/30/24 | $19,123 | $30,006 | $22,560 |
|---|
6/30/25 | $20,509 | $34,556 | $22,980 |
|---|
6/30/26 | $26,595 | $42,271 | $26,825 |
|---|
|
| AssetsNet |
$ 9,469,770
|
| Holdings Count | Holding |
105
|
| InvestmentCompanyPortfolioTurnover |
79.00%
|
| Additional Fund Statistics [Text Block] |
Fund Statistics as of June 30, 2026 - Net Assets$9,469,770
- Total Number of Portfolio Holdings105
- Portfolio Turnover Rate79%
|
| Holdings [Text Block] |
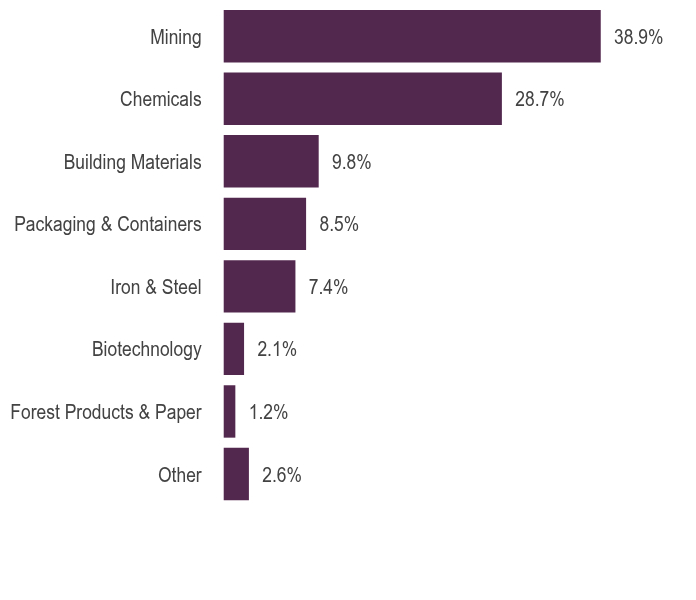
Holdings DiversificationFootnote Reference(1) (% of Net Assets) as of June 30, 2026 Table SummaryValue | Value |
|---|
Other | 2.6% | Forest Products & Paper | 1.2% | Biotechnology | 2.1% | Iron & Steel | 7.4% | Packaging & Containers | 8.5% | Building Materials | 9.8% | Chemicals | 28.7% | Mining | 38.9% | |
| Largest Holdings [Text Block] |
10 Largest HoldingsFootnote Reference(2) (% of Net Assets) as of June 30, 2026 Table SummaryLinde plc | 4.2% |
|---|
Newmont Corp. | 2.6% |
|---|
Sherwin-Williams Co. | 2.5% |
|---|
Freeport-McMoRan, Inc. | 2.4% |
|---|
Ecolab, Inc. | 2.3% |
|---|
Air Products and Chemicals, Inc. | 2.2% |
|---|
Corteva, Inc. | 2.1% |
|---|
Nucor Corp. | 1.7% |
|---|
Vulcan Materials Co. | 1.7% |
|---|
Anglogold Ashanti plc | 1.6% |
|---|
Total | 23.3% |
|---|
|
| Material Fund Change [Text Block] |
|
| C000010380 |
|
| Shareholder Report [Line Items] |
|
| Fund Name |
Biotechnology Fund
|
| Class Name |
Variable Annuity
|
| No Trading Symbol [Flag] |
true
|
| Annual or Semi-Annual Statement [Text Block] |
This semi-annual shareholder report contains important information about the Biotechnology Fund for the period from January 1, 2026 to June 30, 2026.
|
| Additional Information [Text Block] |
You can find additional information about the fund at GuggenheimInvestments.com/variable-insurance-funds. You can also request this information by contacting 800 820 0888 or services@guggenheiminvestments.com.
|
| Additional Information Phone Number |
800 820 0888
|
| Additional Information Email |
<span style="box-sizing: border-box; color: rgb(67, 67, 67); display: inline; flex-wrap: nowrap; font-size: 10.6667px; font-weight: 400; grid-area: auto; line-height: 12.8px; margin: 0px; overflow: visible; text-align: left; text-align-last: auto; white-space-collapse: preserve-breaks;">services@guggenheiminvestments.com</span>
|
| Additional Information Website |
<span style="box-sizing: border-box; color: rgb(67, 67, 67); display: inline; flex-wrap: nowrap; font-size: 10.6667px; font-weight: 400; grid-area: auto; line-height: 12.8px; margin: 0px; overflow: visible; text-align: left; text-align-last: auto; white-space-collapse: preserve-breaks;">GuggenheimInvestments.com/variable-insurance-funds</span>
|
| Expenses [Text Block] |
What were the Fund's costs for the last six months? * Based on a hypothetical $10,000 investment Table SummaryClass | Costs of a $10,000 Investment | Costs Paid as a % of a $10,000 Investment** |
|---|
Variable Annuity | $92 | 1.69% |
|---|
Table Summary* | Excludes expenses of the underlying funds in which the fund invests, if any. |
|---|
** | Annualized |
|---|
|
| Expenses Paid, Amount |
$ 92
|
| Factors Affecting Performance [Text Block] |
What factors materially affected the Fund's performance over the last six months? The industries that contributed the most to performance were biotechnology, pharmaceuticals, and health care services. No industries detracted from performance. The holdings that contributed the most to performance were Revolution Medicines, Inc., Moderna, Inc., and Twist Bioscience Corp. Those that detracted the most were Insmed Inc., Alnylam Pharmaceuticals, Inc, and Regeneron Pharmaceuticals, Inc. |
| Line Graph [Table Text Block] |
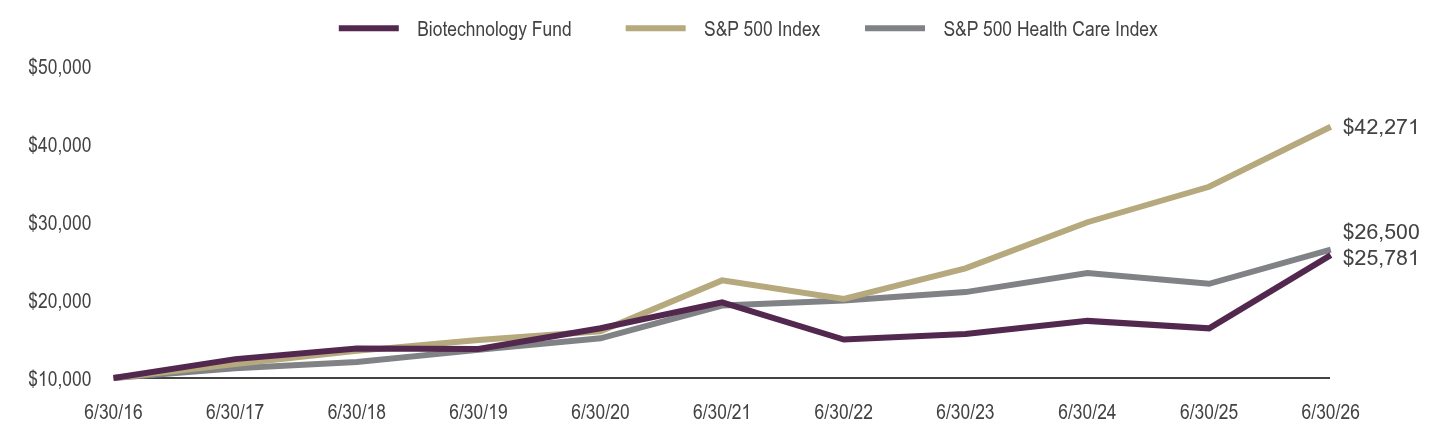
Table Summary | Biotechnology Fund | S&P 500 Index | S&P 500 Health Care Index |
|---|
6/30/16 | $10,000 | $10,000 | $10,000 |
|---|
6/30/17 | $12,425 | $11,790 | $11,247 |
|---|
6/30/18 | $13,786 | $13,484 | $12,046 |
|---|
6/30/19 | $13,736 | $14,889 | $13,611 |
|---|
6/30/20 | $16,388 | $16,006 | $15,094 |
|---|
6/30/21 | $19,708 | $22,536 | $19,309 |
|---|
6/30/22 | $14,932 | $20,144 | $19,959 |
|---|
6/30/23 | $15,648 | $24,091 | $21,032 |
|---|
6/30/24 | $17,336 | $30,006 | $23,488 |
|---|
6/30/25 | $16,379 | $34,556 | $22,102 |
|---|
6/30/26 | $25,781 | $42,271 | $26,500 |
|---|
|
| AssetsNet |
$ 13,437,610
|
| Holdings Count | Holding |
74
|
| InvestmentCompanyPortfolioTurnover |
244.00%
|
| Additional Fund Statistics [Text Block] |
Fund Statistics as of June 30, 2026 - Net Assets$13,437,610
- Total Number of Portfolio Holdings74
- Portfolio Turnover Rate244%
|
| Holdings [Text Block] |
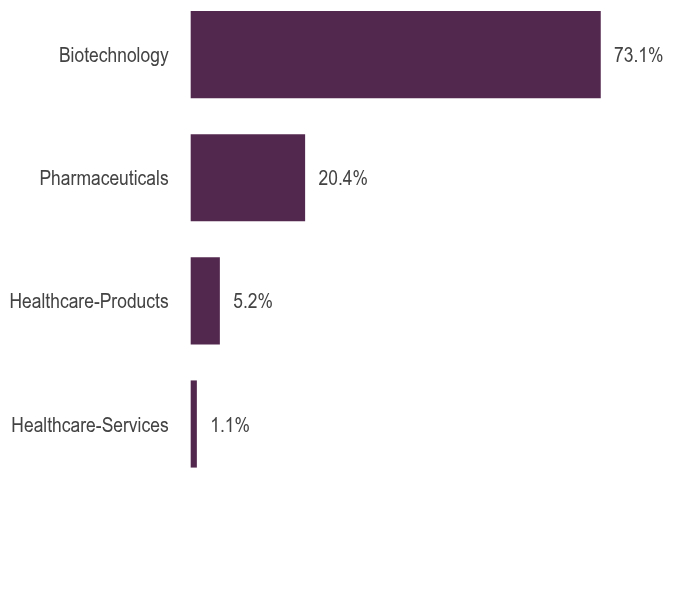
Holdings DiversificationFootnote Reference(1) (% of Net Assets) as of June 30, 2026 Table SummaryValue | Value |
|---|
Healthcare-Services | 1.1% | Healthcare-Products | 5.2% | Pharmaceuticals | 20.4% | Biotechnology | 73.1% | |
| Largest Holdings [Text Block] |
10 Largest HoldingsFootnote Reference(2) (% of Net Assets) as of June 30, 2026 Table SummaryAbbVie, Inc. | 8.2% |
|---|
Amgen, Inc. | 5.1% |
|---|
Gilead Sciences, Inc. | 4.5% |
|---|
Vertex Pharmaceuticals, Inc. | 4.3% |
|---|
Regeneron Pharmaceuticals, Inc. | 2.9% |
|---|
Revolution Medicines, Inc. | 2.5% |
|---|
Alnylam Pharmaceuticals, Inc. | 2.4% |
|---|
BeOne Medicines Ltd. ADR | 2.2% |
|---|
Moderna, Inc. | 2.2% |
|---|
Biogen, Inc. | 2.1% |
|---|
Total | 36.4% |
|---|
|
| Material Fund Change [Text Block] |
|
| C000010381 |
|
| Shareholder Report [Line Items] |
|
| Fund Name |
Consumer Products Fund
|
| Class Name |
Variable Annuity
|
| No Trading Symbol [Flag] |
true
|
| Annual or Semi-Annual Statement [Text Block] |
This semi-annual shareholder report contains important information about the Consumer Products Fund for the period from January 1, 2026 to June 30, 2026.
|
| Additional Information [Text Block] |
You can find additional information about the fund at GuggenheimInvestments.com/variable-insurance-funds. You can also request this information by contacting 800 820 0888 or services@guggenheiminvestments.com.
|
| Additional Information Phone Number |
800 820 0888
|
| Additional Information Email |
<span style="box-sizing: border-box; color: rgb(67, 67, 67); display: inline; flex-wrap: nowrap; font-size: 10.6667px; font-weight: 400; grid-area: auto; line-height: 12.8px; margin: 0px; overflow: visible; text-align: left; text-align-last: auto; white-space-collapse: preserve-breaks;">services@guggenheiminvestments.com</span>
|
| Additional Information Website |
<span style="box-sizing: border-box; color: rgb(67, 67, 67); display: inline; flex-wrap: nowrap; font-size: 10.6667px; font-weight: 400; grid-area: auto; line-height: 12.8px; margin: 0px; overflow: visible; text-align: left; text-align-last: auto; white-space-collapse: preserve-breaks;">GuggenheimInvestments.com/variable-insurance-funds</span>
|
| Expenses [Text Block] |
What were the Fund's costs for the last six months? * Based on a hypothetical $10,000 investment Table SummaryClass | Costs of a $10,000 Investment | Costs Paid as a % of a $10,000 Investment** |
|---|
Variable Annuity | $87 | 1.69% |
|---|
Table Summary* | Excludes expenses of the underlying funds in which the fund invests, if any. |
|---|
** | Annualized |
|---|
|
| Expenses Paid, Amount |
$ 87
|
| Factors Affecting Performance [Text Block] |
What factors materially affected the Fund's performance over the last six months? The industries that contributed the most to performance were soft drinks & non-alcoholic beverages, tobacco, and food distributors. Those that detracted the most were packaged foods & meats and personal care products. The holdings that contributed the most to performance were Altria Group, Inc., Coca-Cola Co., and Phillip Morris International, Inc. Those that detracted the most were Estee Lauder Companies Inc. - Class A, ODDITY Tech Ltd. - Class A, and McCormick & Company, Inc. |
| Line Graph [Table Text Block] |
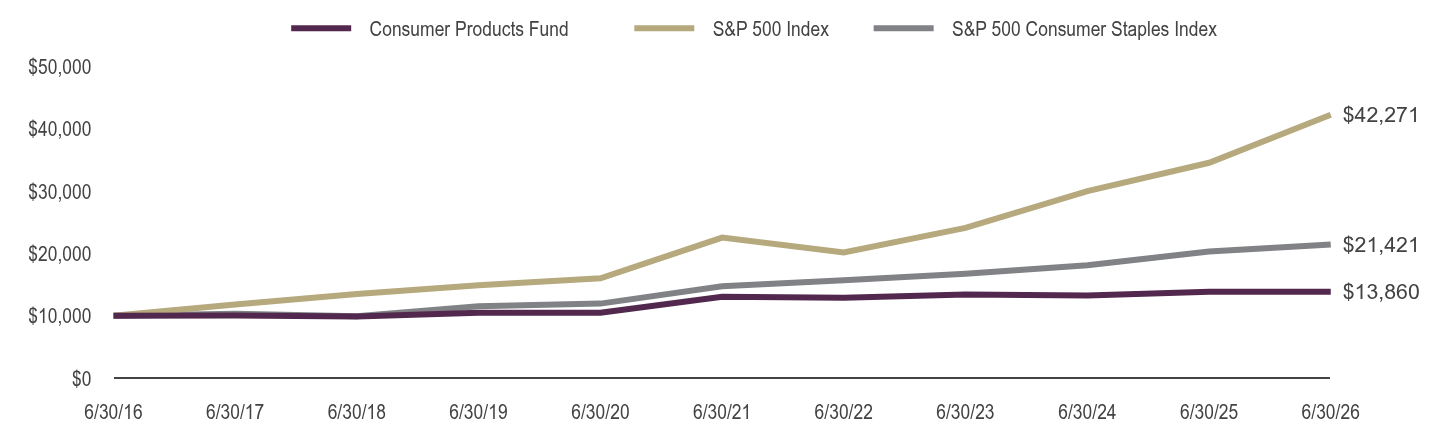
Table Summary | Consumer Products Fund | S&P 500 Index | S&P 500 Consumer Staples Index |
|---|
6/30/16 | $10,000 | $10,000 | $10,000 |
|---|
6/30/17 | $10,022 | $11,790 | $10,306 |
|---|
6/30/18 | $9,883 | $13,484 | $9,901 |
|---|
6/30/19 | $10,466 | $14,889 | $11,524 |
|---|
6/30/20 | $10,489 | $16,006 | $11,942 |
|---|
6/30/21 | $13,044 | $22,536 | $14,723 |
|---|
6/30/22 | $12,869 | $20,144 | $15,702 |
|---|
6/30/23 | $13,409 | $24,091 | $16,739 |
|---|
6/30/24 | $13,238 | $30,006 | $18,104 |
|---|
6/30/25 | $13,850 | $34,556 | $20,306 |
|---|
6/30/26 | $13,860 | $42,271 | $21,421 |
|---|
|
| AssetsNet |
$ 4,652,651
|
| Holdings Count | Holding |
71
|
| InvestmentCompanyPortfolioTurnover |
81.00%
|
| Additional Fund Statistics [Text Block] |
Fund Statistics as of June 30, 2026 - Net Assets$4,652,651
- Total Number of Portfolio Holdings71
- Portfolio Turnover Rate81%
|
| Holdings [Text Block] |
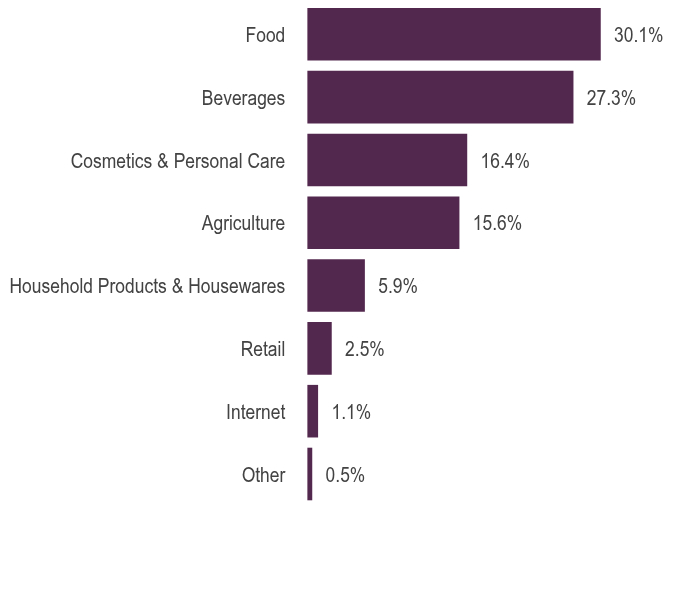
Holdings DiversificationFootnote Reference(1) (% of Net Assets) as of June 30, 2026 Table SummaryValue | Value |
|---|
Other | 0.5% | Internet | 1.1% | Retail | 2.5% | Household Products & Housewares | 5.9% | Agriculture | 15.6% | Cosmetics & Personal Care | 16.4% | Beverages | 27.3% | Food | 30.1% | |
| Largest Holdings [Text Block] |
10 Largest HoldingsFootnote Reference(2) (% of Net Assets) as of June 30, 2026 Table SummaryProcter & Gamble Co. | 5.5% |
|---|
Coca-Cola Co. | 5.5% |
|---|
Philip Morris International, Inc. | 5.1% |
|---|
PepsiCo, Inc. | 3.9% |
|---|
Altria Group, Inc. | 3.9% |
|---|
Colgate-Palmolive Co. | 3.1% |
|---|
Monster Beverage Corp. | 3.0% |
|---|
Mondelez International, Inc. — Class A | 2.9% |
|---|
Keurig Dr Pepper, Inc. | 2.4% |
|---|
Sysco Corp. | 2.3% |
|---|
Total | 37.6% |
|---|
|
| Material Fund Change [Text Block] |
|
| C000010382 |
|
| Shareholder Report [Line Items] |
|
| Fund Name |
Electronics Fund
|
| Class Name |
Variable Annuity
|
| No Trading Symbol [Flag] |
true
|
| Annual or Semi-Annual Statement [Text Block] |
This semi-annual shareholder report contains important information about the Electronics Fund for the period from January 1, 2026 to June 30, 2026.
|
| Additional Information [Text Block] |
You can find additional information about the fund at GuggenheimInvestments.com/variable-insurance-funds. You can also request this information by contacting 800 820 0888 or services@guggenheiminvestments.com.
|
| Additional Information Phone Number |
800 820 0888
|
| Additional Information Email |
<span style="box-sizing: border-box; color: rgb(67, 67, 67); display: inline; flex-wrap: nowrap; font-size: 10.6667px; font-weight: 400; grid-area: auto; line-height: 12.8px; margin: 0px; overflow: visible; text-align: left; text-align-last: auto; white-space-collapse: preserve-breaks;">services@guggenheiminvestments.com</span>
|
| Additional Information Website |
<span style="box-sizing: border-box; color: rgb(67, 67, 67); display: inline; flex-wrap: nowrap; font-size: 10.6667px; font-weight: 400; grid-area: auto; line-height: 12.8px; margin: 0px; overflow: visible; text-align: left; text-align-last: auto; white-space-collapse: preserve-breaks;">GuggenheimInvestments.com/variable-insurance-funds</span>
|
| Expenses [Text Block] |
What were the Fund's costs for the last six months? * Based on a hypothetical $10,000 investment Table SummaryClass | Costs of a $10,000 Investment | Costs Paid as a % of a $10,000 Investment** |
|---|
Variable Annuity | $123 | 1.69% |
|---|
Table Summary* | Excludes expenses of the underlying funds in which the fund invests, if any. |
|---|
** | Annualized |
|---|
|
| Expenses Paid, Amount |
$ 123
|
| Factors Affecting Performance [Text Block] |
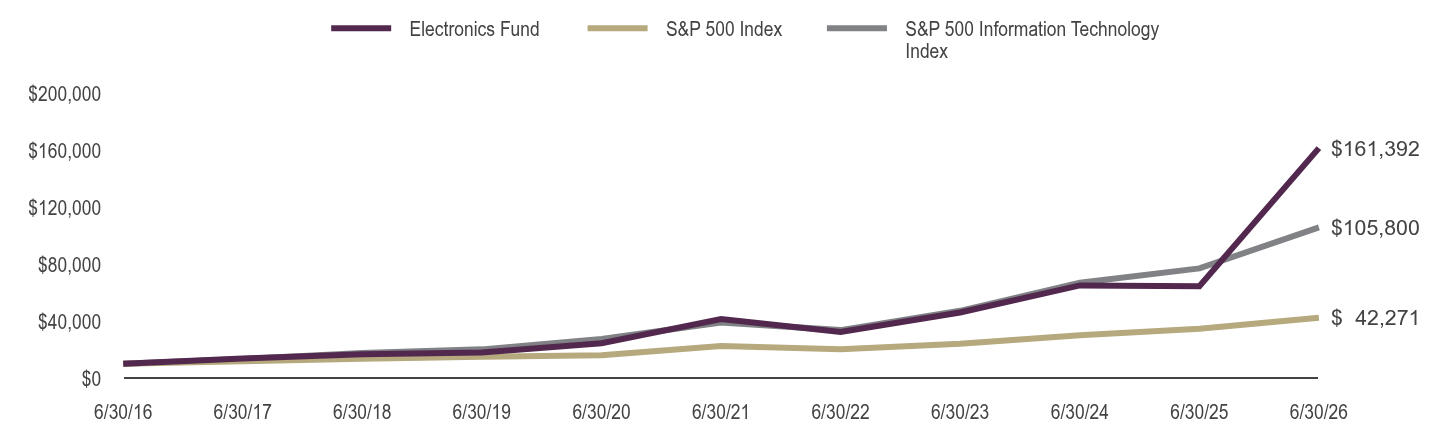
What factors materially affected the Fund's performance over the last six months? The industries that contributed the most to performance were semiconductors and semiconductor materials & equipment. No industries detracted from performance. The holdings that contributed the most to performance were Micron Technology, Inc., Intel Corp., and Advanced Micro Devices, Inc. Those that detracted the most were Canadian Solar, Inc., First Solar, Inc., and AXT, Inc. |
| Line Graph [Table Text Block] |
Table Summary | Electronics Fund | S&P 500 Index | S&P 500 Information Technology Index |
|---|
6/30/16 | $10,000 | $10,000 | $10,000 |
|---|
6/30/17 | $13,747 | $11,790 | $13,389 |
|---|
6/30/18 | $16,689 | $13,484 | $17,580 |
|---|
6/30/19 | $17,944 | $14,889 | $20,100 |
|---|
6/30/20 | $24,458 | $16,006 | $27,315 |
|---|
6/30/21 | $41,354 | $22,536 | $38,897 |
|---|
6/30/22 | $32,264 | $20,144 | $33,621 |
|---|
6/30/23 | $45,991 | $24,091 | $47,158 |
|---|
6/30/24 | $65,020 | $30,006 | $66,859 |
|---|
6/30/25 | $64,489 | $34,556 | $76,955 |
|---|
6/30/26 | $161,392 | $42,271 | $105,800 |
|---|
|
| AssetsNet |
$ 50,298,737
|
| Holdings Count | Holding |
69
|
| InvestmentCompanyPortfolioTurnover |
46.00%
|
| Additional Fund Statistics [Text Block] |
Fund Statistics as of June 30, 2026 - Net Assets$50,298,737
- Total Number of Portfolio Holdings69
- Portfolio Turnover Rate46%
|
| Holdings [Text Block] |
Holdings DiversificationFootnote Reference(1) (% of Net Assets) as of June 30, 2026 Table SummaryValue | Value |
|---|
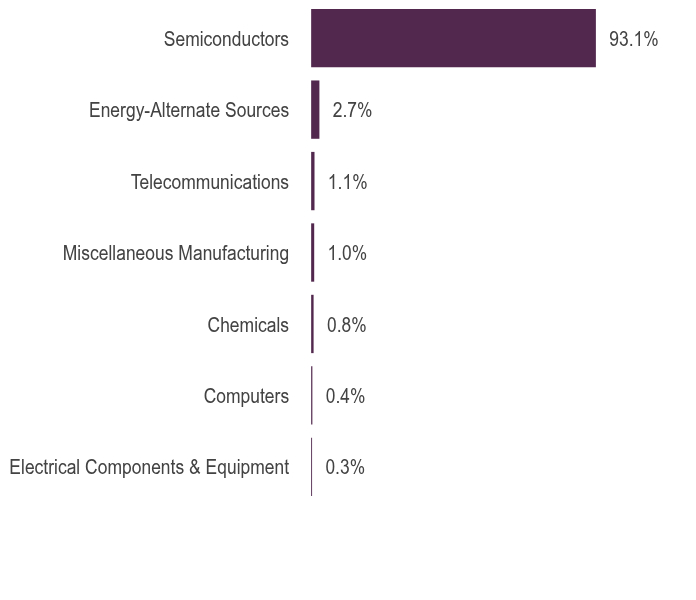
Electrical Components & Equipment | 0.3% | Computers | 0.4% | Chemicals | 0.8% | Miscellaneous Manufacturing | 1.0% | Telecommunications | 1.1% | Energy-Alternate Sources | 2.7% | Semiconductors | 93.1% | |
| Largest Holdings [Text Block] |
10 Largest HoldingsFootnote Reference(2) (% of Net Assets) as of June 30, 2026 Table SummaryNVIDIA Corp. | 11.8% |
|---|
Broadcom, Inc. | 7.1% |
|---|
Micron Technology, Inc. | 6.7% |
|---|
Advanced Micro Devices, Inc. | 5.7% |
|---|
Applied Materials, Inc. | 4.6% |
|---|
Intel Corp. | 4.4% |
|---|
Lam Research Corp. | 4.2% |
|---|
KLA Corp. | 3.7% |
|---|
Texas Instruments, Inc. | 2.8% |
|---|
Marvell Technology, Inc. | 2.8% |
|---|
Total | 53.8% |
|---|
|
| Material Fund Change [Text Block] |
|
| C000010383 |
|
| Shareholder Report [Line Items] |
|
| Fund Name |
Energy Fund
|
| Class Name |
Variable Annuity
|
| No Trading Symbol [Flag] |
true
|
| Annual or Semi-Annual Statement [Text Block] |
This semi-annual shareholder report contains important information about the Energy Fund for the period from January 1, 2026 to June 30, 2026.
|
| Additional Information [Text Block] |
You can find additional information about the fund at GuggenheimInvestments.com/variable-insurance-funds. You can also request this information by contacting 800 820 0888 or services@guggenheiminvestments.com.
|
| Additional Information Phone Number |
800 820 0888
|
| Additional Information Email |
<span style="box-sizing: border-box; color: rgb(67, 67, 67); display: inline; flex-wrap: nowrap; font-size: 10.6667px; font-weight: 400; grid-area: auto; line-height: 12.8px; margin: 0px; overflow: visible; text-align: left; text-align-last: auto; white-space-collapse: preserve-breaks;">services@guggenheiminvestments.com</span>
|
| Additional Information Website |
<span style="box-sizing: border-box; color: rgb(67, 67, 67); display: inline; flex-wrap: nowrap; font-size: 10.6667px; font-weight: 400; grid-area: auto; line-height: 12.8px; margin: 0px; overflow: visible; text-align: left; text-align-last: auto; white-space-collapse: preserve-breaks;">GuggenheimInvestments.com/variable-insurance-funds</span>
|
| Expenses [Text Block] |
What were the Fund's costs for the last six months? * Based on a hypothetical $10,000 investment Table SummaryClass | Costs of a $10,000 Investment | Costs Paid as a % of a $10,000 Investment** |
|---|
Variable Annuity | $93 | 1.69% |
|---|
Table Summary* | Excludes expenses of the underlying funds in which the fund invests, if any. |
|---|
** | Annualized |
|---|
|
| Expenses Paid, Amount |
$ 93
|
| Factors Affecting Performance [Text Block] |
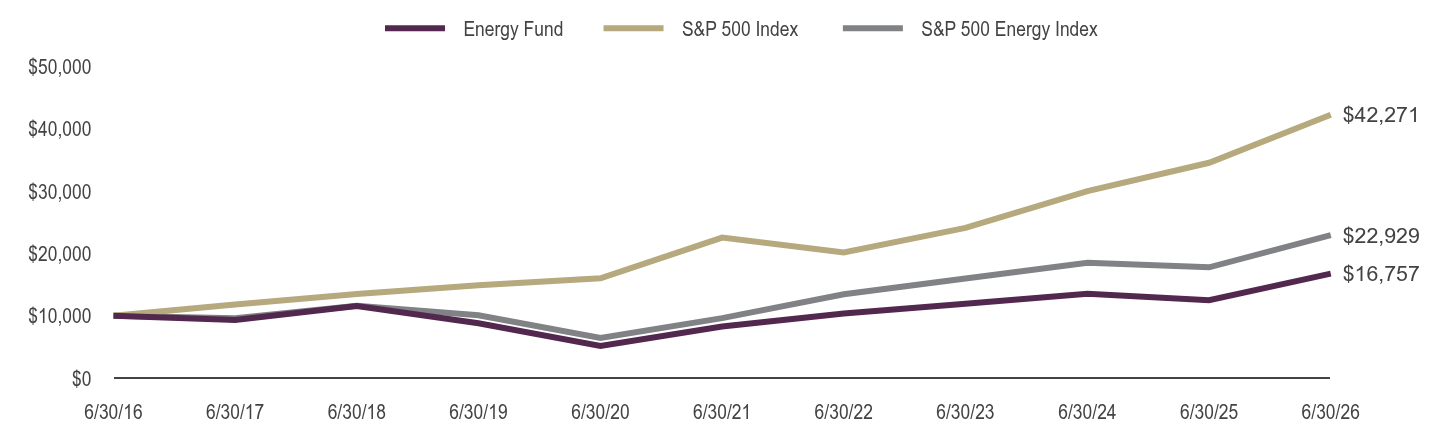
What factors materially affected the Fund's performance over the last six months? The industries that contributed the most to performance were oil & gas storage and transportation, oil & gas exploration & production, and integrated oil & gas. Those that detracted the most were semiconductors and electrical components & equipment. The holdings that contributed the most to performance were Exxon Mobil Corp., Valero Energy Corp., and Marathon Petroleum Corp. Those that detracted the most were Expand Energy Corp., First Solar, Inc., and Sunrun, Inc. |
| Line Graph [Table Text Block] |
Table Summary | Energy Fund | S&P 500 Index | S&P 500 Energy Index |
|---|
6/30/16 | $10,000 | $10,000 | $10,000 |
|---|
6/30/17 | $9,323 | $11,790 | $9,586 |
|---|
6/30/18 | $11,539 | $13,484 | $11,598 |
|---|
6/30/19 | $8,792 | $14,889 | $10,062 |
|---|
6/30/20 | $5,135 | $16,006 | $6,431 |
|---|
6/30/21 | $8,271 | $22,536 | $9,606 |
|---|
6/30/22 | $10,356 | $20,144 | $13,447 |
|---|
6/30/23 | $11,936 | $24,091 | $15,970 |
|---|
6/30/24 | $13,520 | $30,006 | $18,501 |
|---|
6/30/25 | $12,498 | $34,556 | $17,769 |
|---|
6/30/26 | $16,757 | $42,271 | $22,929 |
|---|
|
| AssetsNet |
$ 9,072,871
|
| Holdings Count | Holding |
87
|
| InvestmentCompanyPortfolioTurnover |
223.00%
|
| Additional Fund Statistics [Text Block] |
Fund Statistics as of June 30, 2026 - Net Assets$9,072,871
- Total Number of Portfolio Holdings87
- Portfolio Turnover Rate223%
|
| Holdings [Text Block] |
Holdings DiversificationFootnote Reference(1) (% of Net Assets) as of June 30, 2026 Table SummaryValue | Value |
|---|
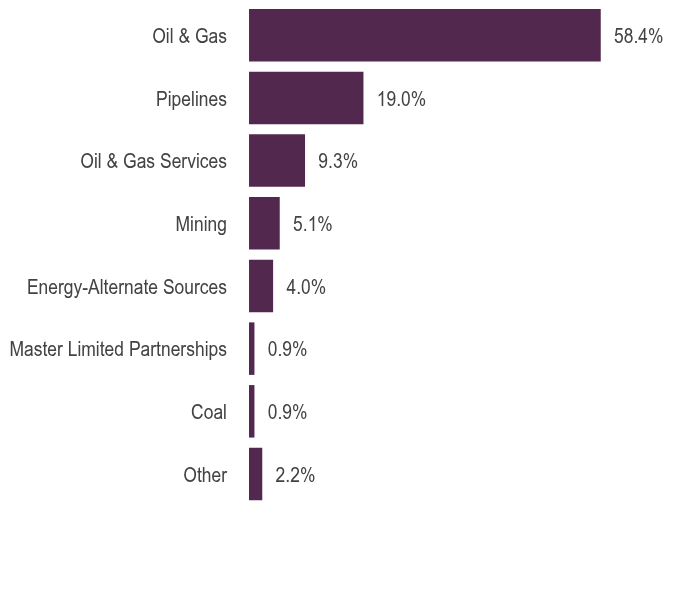
Other | 2.2% | Coal | 0.9% | Master Limited Partnerships | 0.9% | Energy-Alternate Sources | 4.0% | Mining | 5.1% | Oil & Gas Services | 9.3% | Pipelines | 19.0% | Oil & Gas | 58.4% | |
| Largest Holdings [Text Block] |
10 Largest HoldingsFootnote Reference(2) (% of Net Assets) as of June 30, 2026 Table SummaryExxon Mobil Corp. | 6.4% |
|---|
Chevron Corp. | 4.8% |
|---|
ConocoPhillips | 3.0% |
|---|
Williams Companies, Inc. | 2.7% |
|---|
Valero Energy Corp. | 2.5% |
|---|
Marathon Petroleum Corp. | 2.4% |
|---|
EOG Resources, Inc. | 2.3% |
|---|
Phillips 66 | 2.3% |
|---|
Kinder Morgan, Inc. | 2.3% |
|---|
SLB Ltd. | 2.2% |
|---|
Total | 30.9% |
|---|
|
| Material Fund Change [Text Block] |
|
| C000010384 |
|
| Shareholder Report [Line Items] |
|
| Fund Name |
Energy Services Fund
|
| Class Name |
Variable Annuity
|
| No Trading Symbol [Flag] |
true
|
| Annual or Semi-Annual Statement [Text Block] |
This semi-annual shareholder report contains important information about the Energy Services Fund for the period from January 1, 2026 to June 30, 2026.
|
| Additional Information [Text Block] |
You can find additional information about the fund at GuggenheimInvestments.com/variable-insurance-funds. You can also request this information by contacting 800 820 0888 or services@guggenheiminvestments.com.
|
| Additional Information Phone Number |
800 820 0888
|
| Additional Information Email |
<span style="box-sizing: border-box; color: rgb(67, 67, 67); display: inline; flex-wrap: nowrap; font-size: 10.6667px; font-weight: 400; grid-area: auto; line-height: 12.8px; margin: 0px; overflow: visible; text-align: left; text-align-last: auto; white-space-collapse: preserve-breaks;">services@guggenheiminvestments.com</span>
|
| Additional Information Website |
<span style="box-sizing: border-box; color: rgb(67, 67, 67); display: inline; flex-wrap: nowrap; font-size: 10.6667px; font-weight: 400; grid-area: auto; line-height: 12.8px; margin: 0px; overflow: visible; text-align: left; text-align-last: auto; white-space-collapse: preserve-breaks;">GuggenheimInvestments.com/variable-insurance-funds</span>
|
| Expenses [Text Block] |
What were the Fund's costs for the last six months? * Based on a hypothetical $10,000 investment Table SummaryClass | Costs of a $10,000 Investment | Costs Paid as a % of a $10,000 Investment** |
|---|
Variable Annuity | $98 | 1.69% |
|---|
Table Summary* | Excludes expenses of the underlying funds in which the fund invests, if any. |
|---|
** | Annualized |
|---|
|
| Expenses Paid, Amount |
$ 98
|
| Factors Affecting Performance [Text Block] |
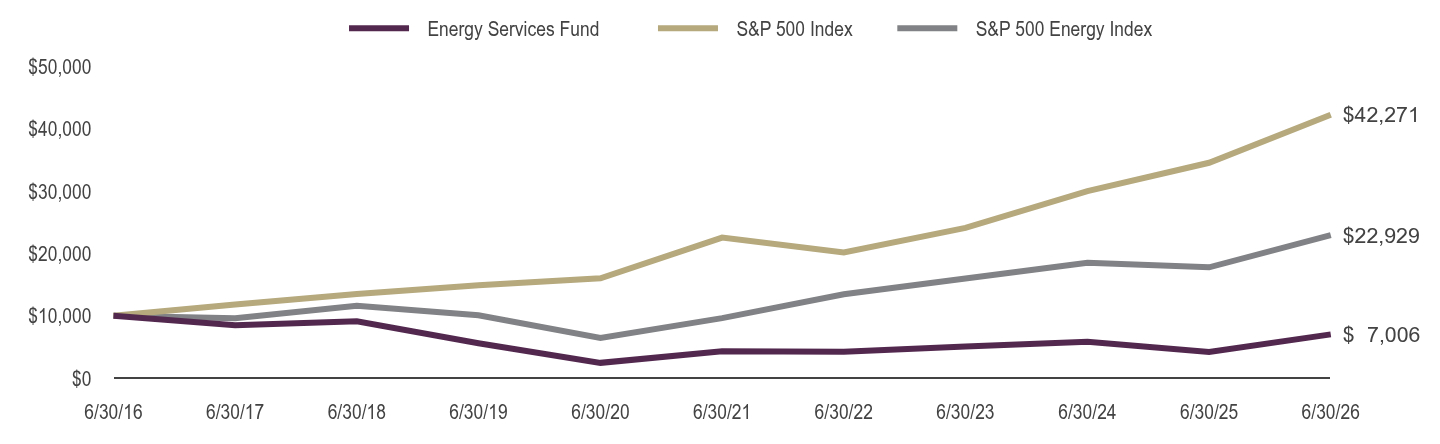
What factors materially affected the Fund's performance over the last six months? The industries that contributed the most to performance were oil & gas equipment services and oil & gas drilling. There were no industries that detracted from performance. The holdings that contributed the most to performance were SLB Ltd, Baker Hughes Co. - Class A, and Kodiak Gas Services, Inc. No industries detracted from performance. |
| Line Graph [Table Text Block] |
Table Summary | Energy Services Fund | S&P 500 Index | S&P 500 Energy Index |
|---|
6/30/16 | $10,000 | $10,000 | $10,000 |
|---|
6/30/17 | $8,457 | $11,790 | $9,586 |
|---|
6/30/18 | $9,116 | $13,484 | $11,598 |
|---|
6/30/19 | $5,568 | $14,889 | $10,062 |
|---|
6/30/20 | $2,431 | $16,006 | $6,431 |
|---|
6/30/21 | $4,290 | $22,536 | $9,606 |
|---|
6/30/22 | $4,219 | $20,144 | $13,447 |
|---|
6/30/23 | $5,052 | $24,091 | $15,970 |
|---|
6/30/24 | $5,836 | $30,006 | $18,501 |
|---|
6/30/25 | $4,188 | $34,556 | $17,769 |
|---|
6/30/26 | $7,006 | $42,271 | $22,929 |
|---|
|
| AssetsNet |
$ 7,819,868
|
| Holdings Count | Holding |
32
|
| InvestmentCompanyPortfolioTurnover |
232.00%
|
| Additional Fund Statistics [Text Block] |
Fund Statistics as of June 30, 2026 - Net Assets$7,819,868
- Total Number of Portfolio Holdings32
- Portfolio Turnover Rate232%
|
| Holdings [Text Block] |
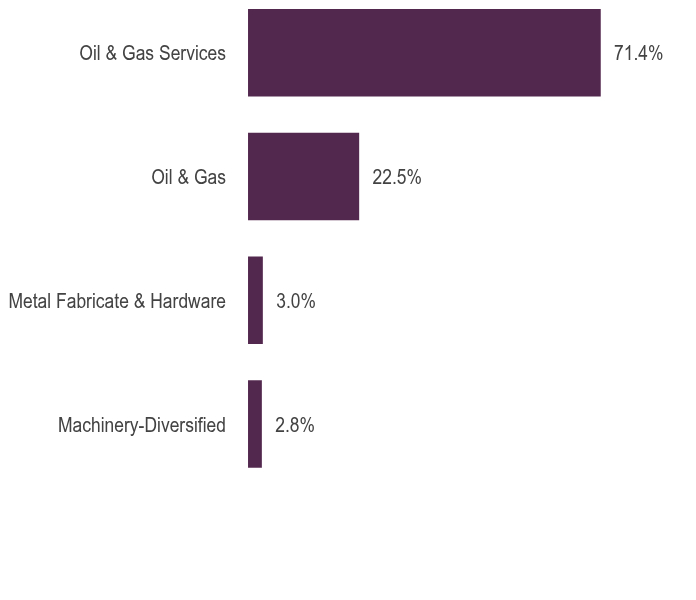
Holdings DiversificationFootnote Reference(1) (% of Net Assets) as of June 30, 2026 Table SummaryValue | Value |
|---|
Machinery-Diversified | 2.8% | Metal Fabricate & Hardware | 3.0% | Oil & Gas | 22.5% | Oil & Gas Services | 71.4% | |
| Largest Holdings [Text Block] |
10 Largest HoldingsFootnote Reference(2) (% of Net Assets) as of June 30, 2026 Table SummarySLB Ltd. | 11.5% |
|---|
Baker Hughes Co. — Class A | 10.4% |
|---|
Halliburton Co. | 7.0% |
|---|
Kodiak Gas Services, Inc. | 4.3% |
|---|
Archrock, Inc. | 4.2% |
|---|
TechnipFMC plc | 4.1% |
|---|
NOV, Inc. | 3.6% |
|---|
Solaris Energy Infrastructure, Inc. — Class A | 3.6% |
|---|
Weatherford International plc | 3.2% |
|---|
Transocean Ltd. | 3.1% |
|---|
Total | 55.0% |
|---|
|
| Material Fund Change [Text Block] |
|
| C000010385 |
|
| Shareholder Report [Line Items] |
|
| Fund Name |
Financial Services Fund
|
| Class Name |
Variable Annuity
|
| No Trading Symbol [Flag] |
true
|
| Annual or Semi-Annual Statement [Text Block] |
This semi-annual shareholder report contains important information about the Financial Services Fund for the period from January 1, 2026 to June 30, 2026.
|
| Additional Information [Text Block] |
You can find additional information about the fund at GuggenheimInvestments.com/variable-insurance-funds. You can also request this information by contacting 800 820 0888 or services@guggenheiminvestments.com.
|
| Additional Information Phone Number |
800 820 0888
|
| Additional Information Email |
<span style="box-sizing: border-box; color: rgb(67, 67, 67); display: inline; flex-wrap: nowrap; font-size: 10.6667px; font-weight: 400; grid-area: auto; line-height: 12.8px; margin: 0px; overflow: visible; text-align: left; text-align-last: auto; white-space-collapse: preserve-breaks;">services@guggenheiminvestments.com</span>
|
| Additional Information Website |
<span style="box-sizing: border-box; color: rgb(67, 67, 67); display: inline; flex-wrap: nowrap; font-size: 10.6667px; font-weight: 400; grid-area: auto; line-height: 12.8px; margin: 0px; overflow: visible; text-align: left; text-align-last: auto; white-space-collapse: preserve-breaks;">GuggenheimInvestments.com/variable-insurance-funds</span>
|
| Expenses [Text Block] |
What were the Fund's costs for the last six months? * Based on a hypothetical $10,000 investment Table SummaryClass | Costs of a $10,000 Investment | Costs Paid as a % of a $10,000 Investment** |
|---|
Variable Annuity | $84 | 1.70% |
|---|
Table Summary* | Excludes expenses of the underlying funds in which the fund invests, if any. |
|---|
** | Annualized |
|---|
|
| Expenses Paid, Amount |
$ 84
|
| Factors Affecting Performance [Text Block] |
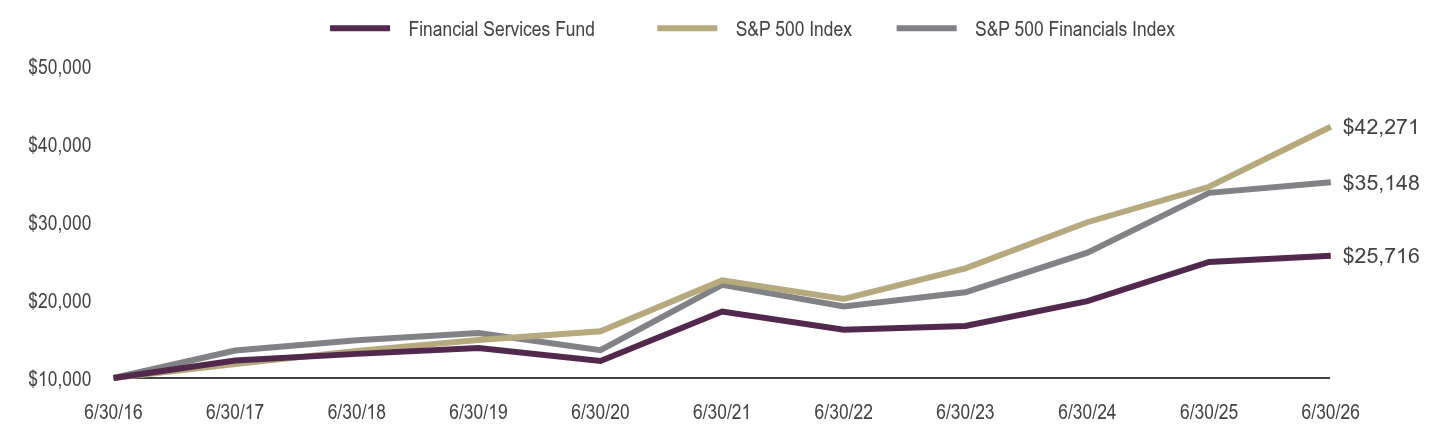
What factors materially affected the Fund's performance over the last six months? The industries that contributed the most to performance were regional banks, diversified banks, and investment banking & brokerage. Those that detracted the most were financial exchanges & data, transaction & payment processing, and asset management & custody banks. The holdings that contributed the most to performance were Interactive Brokers Group, Inc. - Class A, Citigroup, Inc., and Morgan Stanley. Those that detracted the most were Coinbase Global, Inc. - Class A, S&P Global, Inc., and Blackstone, Inc. |
| Line Graph [Table Text Block] |
Table Summary | Financial Services Fund | S&P 500 Index | S&P 500 Financials Index |
|---|
6/30/16 | $10,000 | $10,000 | $10,000 |
|---|
6/30/17 | $12,240 | $11,790 | $13,537 |
|---|
6/30/18 | $13,099 | $13,484 | $14,843 |
|---|
6/30/19 | $13,848 | $14,889 | $15,780 |
|---|
6/30/20 | $12,181 | $16,006 | $13,583 |
|---|
6/30/21 | $18,533 | $22,536 | $21,972 |
|---|
6/30/22 | $16,211 | $20,144 | $19,186 |
|---|
6/30/23 | $16,678 | $24,091 | $21,009 |
|---|
6/30/24 | $19,869 | $30,006 | $26,095 |
|---|
6/30/25 | $24,905 | $34,556 | $33,778 |
|---|
6/30/26 | $25,716 | $42,271 | $35,148 |
|---|
|
| AssetsNet |
$ 9,452,180
|
| Holdings Count | Holding |
159
|
| InvestmentCompanyPortfolioTurnover |
916.00%
|
| Additional Fund Statistics [Text Block] |
Fund Statistics as of June 30, 2026 - Net Assets$9,452,180
- Total Number of Portfolio Holdings159
- Portfolio Turnover Rate916%
|
| Holdings [Text Block] |
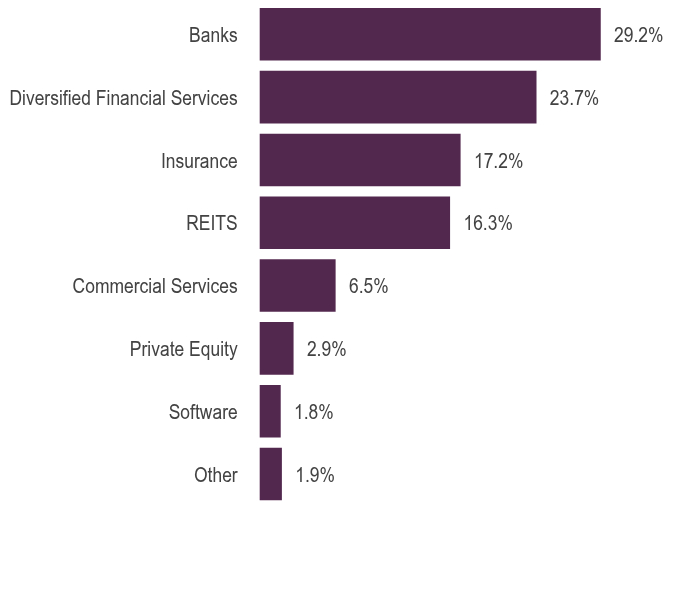
Holdings DiversificationFootnote Reference(1) (% of Net Assets) as of June 30, 2026 Table SummaryValue | Value |
|---|
Other | 1.9% | Software | 1.8% | Private Equity | 2.9% | Commercial Services | 6.5% | REITS | 16.3% | Insurance | 17.2% | Diversified Financial Services | 23.7% | Banks | 29.2% | |
| Largest Holdings [Text Block] |
10 Largest HoldingsFootnote Reference(2) (% of Net Assets) as of June 30, 2026 Table SummaryBerkshire Hathaway, Inc. — Class B | 3.3% |
|---|
JPMorgan Chase & Co. | 3.0% |
|---|
Visa, Inc. — Class A | 2.6% |
|---|
Mastercard, Inc. — Class A | 2.1% |
|---|
Bank of America Corp. | 1.9% |
|---|
Goldman Sachs Group, Inc. | 1.7% |
|---|
Wells Fargo & Co. | 1.6% |
|---|
Morgan Stanley | 1.5% |
|---|
Citigroup, Inc. | 1.5% |
|---|
American Express Co. | 1.3% |
|---|
Total | 20.5% |
|---|
|
| Material Fund Change [Text Block] |
|
| C000010386 |
|
| Shareholder Report [Line Items] |
|
| Fund Name |
Health Care Fund
|
| Class Name |
Variable Annuity
|
| No Trading Symbol [Flag] |
true
|
| Annual or Semi-Annual Statement [Text Block] |
This semi-annual shareholder report contains important information about the Health Care Fund for the period from January 1, 2026 to June 30, 2026.
|
| Additional Information [Text Block] |
You can find additional information about the fund at GuggenheimInvestments.com/variable-insurance-funds. You can also request this information by contacting 800 820 0888 or services@guggenheiminvestments.com.
|
| Additional Information Phone Number |
800 820 0888
|
| Additional Information Email |
<span style="box-sizing: border-box; color: rgb(67, 67, 67); display: inline; flex-wrap: nowrap; font-size: 10.6667px; font-weight: 400; grid-area: auto; line-height: 12.8px; margin: 0px; overflow: visible; text-align: left; text-align-last: auto; white-space-collapse: preserve-breaks;">services@guggenheiminvestments.com</span>
|
| Additional Information Website |
<span style="box-sizing: border-box; color: rgb(67, 67, 67); display: inline; flex-wrap: nowrap; font-size: 10.6667px; font-weight: 400; grid-area: auto; line-height: 12.8px; margin: 0px; overflow: visible; text-align: left; text-align-last: auto; white-space-collapse: preserve-breaks;">GuggenheimInvestments.com/variable-insurance-funds</span>
|
| Expenses [Text Block] |
What were the Fund's costs for the last six months? * Based on a hypothetical $10,000 investment Table SummaryClass | Costs of a $10,000 Investment | Costs Paid as a % of a $10,000 Investment** |
|---|
Variable Annuity | $87 | 1.70% |
|---|
Table Summary* | Excludes expenses of the underlying funds in which the fund invests, if any. |
|---|
** | Annualized |
|---|
|
| Expenses Paid, Amount |
$ 87
|
| Factors Affecting Performance [Text Block] |
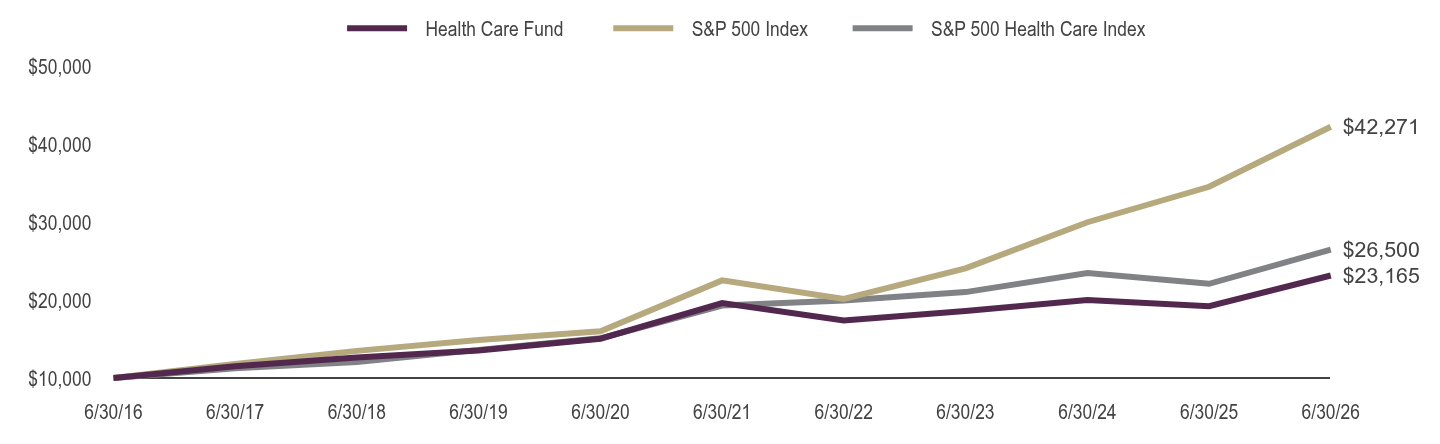
What factors materially affected the Fund's performance over the last six months? The industries that contributed the most to performance were biotechnology, pharmaceuticals, and managed health care. Those that detracted the most were health care equipment, health care technology, and health care facilities. The holdings that contributed the most to performance were UnitedHealth Group, Inc., Johnson & Johnson, and Revolution Medicines, Inc. Those that detracted the most were Boston Scientific Corp., Intuitive Surgical, Inc., and Abbott Laboratories. |
| Line Graph [Table Text Block] |
Table Summary | Health Care Fund | S&P 500 Index | S&P 500 Health Care Index |
|---|
6/30/16 | $10,000 | $10,000 | $10,000 |
|---|
6/30/17 | $11,508 | $11,790 | $11,247 |
|---|
6/30/18 | $12,639 | $13,484 | $12,046 |
|---|
6/30/19 | $13,545 | $14,889 | $13,611 |
|---|
6/30/20 | $15,044 | $16,006 | $15,094 |
|---|
6/30/21 | $19,627 | $22,536 | $19,309 |
|---|
6/30/22 | $17,384 | $20,144 | $19,959 |
|---|
6/30/23 | $18,604 | $24,091 | $21,032 |
|---|
6/30/24 | $20,012 | $30,006 | $23,488 |
|---|
6/30/25 | $19,226 | $34,556 | $22,102 |
|---|
6/30/26 | $23,165 | $42,271 | $26,500 |
|---|
|
| AssetsNet |
$ 10,533,341
|
| Holdings Count | Holding |
134
|
| InvestmentCompanyPortfolioTurnover |
411.00%
|
| Additional Fund Statistics [Text Block] |
Fund Statistics as of June 30, 2026 - Net Assets$10,533,341
- Total Number of Portfolio Holdings134
- Portfolio Turnover Rate411%
|
| Holdings [Text Block] |
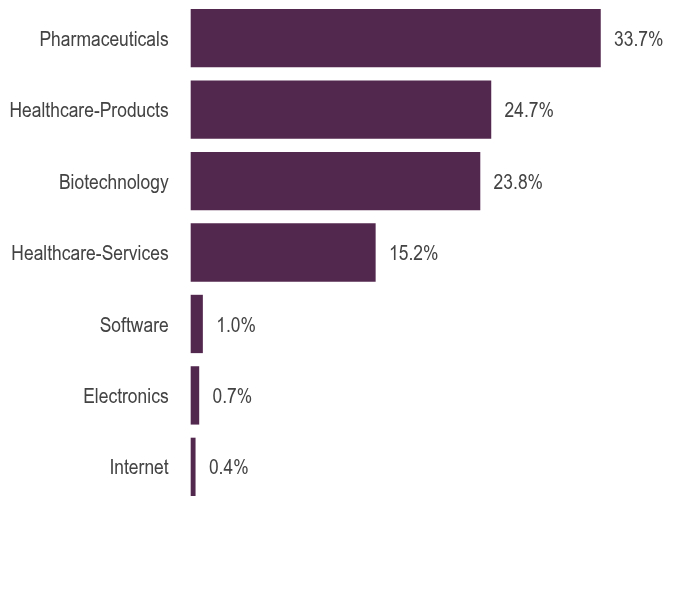
Holdings DiversificationFootnote Reference(1) (% of Net Assets) as of June 30, 2026 Table SummaryValue | Value |
|---|
Internet | 0.4% | Electronics | 0.7% | Software | 1.0% | Healthcare-Services | 15.2% | Biotechnology | 23.8% | Healthcare-Products | 24.7% | Pharmaceuticals | 33.7% | |
| Largest Holdings [Text Block] |
10 Largest HoldingsFootnote Reference(2) (% of Net Assets) as of June 30, 2026 Table SummaryEli Lilly & Co. | 4.3% |
|---|
Johnson & Johnson | 3.4% |
|---|
AbbVie, Inc. | 3.0% |
|---|
UnitedHealth Group, Inc. | 2.7% |
|---|
Merck & Company, Inc. | 2.4% |
|---|
Thermo Fisher Scientific, Inc. | 1.9% |
|---|
Amgen, Inc. | 1.9% |
|---|
Abbott Laboratories | 1.7% |
|---|
Gilead Sciences, Inc. | 1.7% |
|---|
Vertex Pharmaceuticals, Inc. | 1.6% |
|---|
Total | 24.6% |
|---|
|
| Material Fund Change [Text Block] |
|
| C000010387 |
|
| Shareholder Report [Line Items] |
|
| Fund Name |
Internet Fund
|
| Class Name |
Variable Annuity
|
| No Trading Symbol [Flag] |
true
|
| Annual or Semi-Annual Statement [Text Block] |
This semi-annual shareholder report contains important information about the Internet Fund for the period from January 1, 2026 to June 30, 2026.
|
| Additional Information [Text Block] |
You can find additional information about the fund at GuggenheimInvestments.com/variable-insurance-funds. You can also request this information by contacting 800 820 0888 or services@guggenheiminvestments.com.
|
| Additional Information Phone Number |
800 820 0888
|
| Additional Information Email |
<span style="box-sizing: border-box; color: rgb(67, 67, 67); display: inline; flex-wrap: nowrap; font-size: 10.6667px; font-weight: 400; grid-area: auto; line-height: 12.8px; margin: 0px; overflow: visible; text-align: left; text-align-last: auto; white-space-collapse: preserve-breaks;">services@guggenheiminvestments.com</span>
|
| Additional Information Website |
<span style="box-sizing: border-box; color: rgb(67, 67, 67); display: inline; flex-wrap: nowrap; font-size: 10.6667px; font-weight: 400; grid-area: auto; line-height: 12.8px; margin: 0px; overflow: visible; text-align: left; text-align-last: auto; white-space-collapse: preserve-breaks;">GuggenheimInvestments.com/variable-insurance-funds</span>
|
| Expenses [Text Block] |
What were the Fund's costs for the last six months? * Based on a hypothetical $10,000 investment Table SummaryClass | Costs of a $10,000 Investment | Costs Paid as a % of a $10,000 Investment** |
|---|
Variable Annuity | $84 | 1.69% |
|---|
Table Summary* | Excludes expenses of the underlying funds in which the fund invests, if any. |
|---|
** | Annualized |
|---|
|
| Expenses Paid, Amount |
$ 84
|
| Factors Affecting Performance [Text Block] |
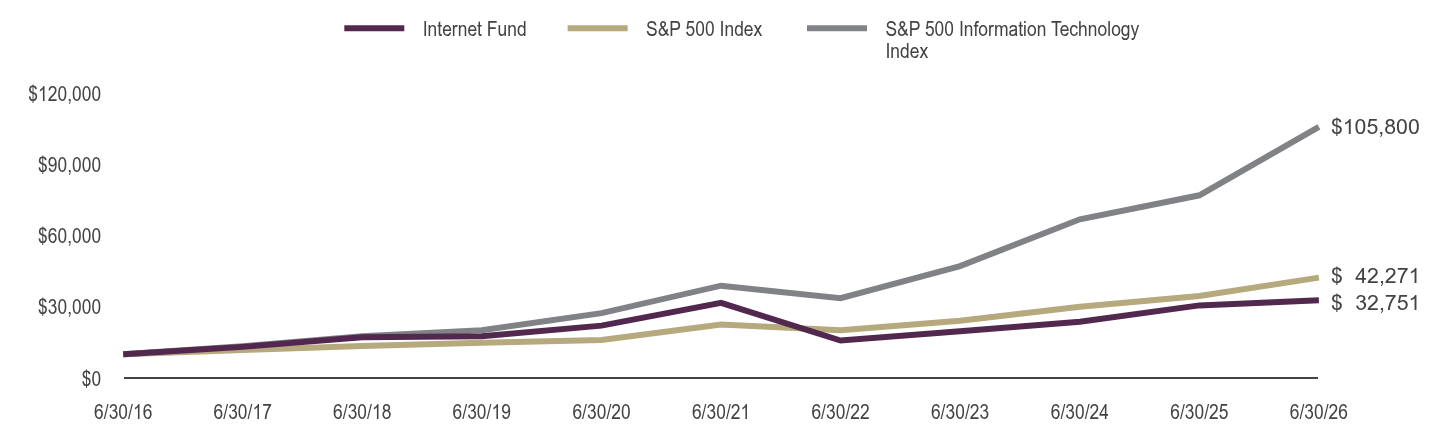
What factors materially affected the Fund's performance over the last six months? The industries that contributed the most to performance were communications equipment and internet services & infrastructure. Those that detracted the most were application software, real estate services, and interactive media & services. The holdings that contributed the most to performance were Cisco Systems, Inc., Lumentum Holdings, Inc., and Ciena Corp. Those that detracted the most were Salesforce, Inc., Adobe, Inc., and Meta Platforms, Inc. - Class A. |
| Line Graph [Table Text Block] |
Table Summary | Internet Fund | S&P 500 Index | S&P 500 Information Technology Index |
|---|
6/30/16 | $10,000 | $10,000 | $10,000 |
|---|
6/30/17 | $13,113 | $11,790 | $13,389 |
|---|
6/30/18 | $17,213 | $13,484 | $17,580 |
|---|
6/30/19 | $17,622 | $14,889 | $20,100 |
|---|
6/30/20 | $22,060 | $16,006 | $27,315 |
|---|
6/30/21 | $31,662 | $22,536 | $38,897 |
|---|
6/30/22 | $15,766 | $20,144 | $33,621 |
|---|
6/30/23 | $19,709 | $24,091 | $47,158 |
|---|
6/30/24 | $23,677 | $30,006 | $66,859 |
|---|
6/30/25 | $30,585 | $34,556 | $76,955 |
|---|
6/30/26 | $32,751 | $42,271 | $105,800 |
|---|
|
| AssetsNet |
$ 5,595,625
|
| Holdings Count | Holding |
86
|
| InvestmentCompanyPortfolioTurnover |
55.00%
|
| Additional Fund Statistics [Text Block] |
Fund Statistics as of June 30, 2026 - Net Assets$5,595,625
- Total Number of Portfolio Holdings86
- Portfolio Turnover Rate55%
|
| Holdings [Text Block] |
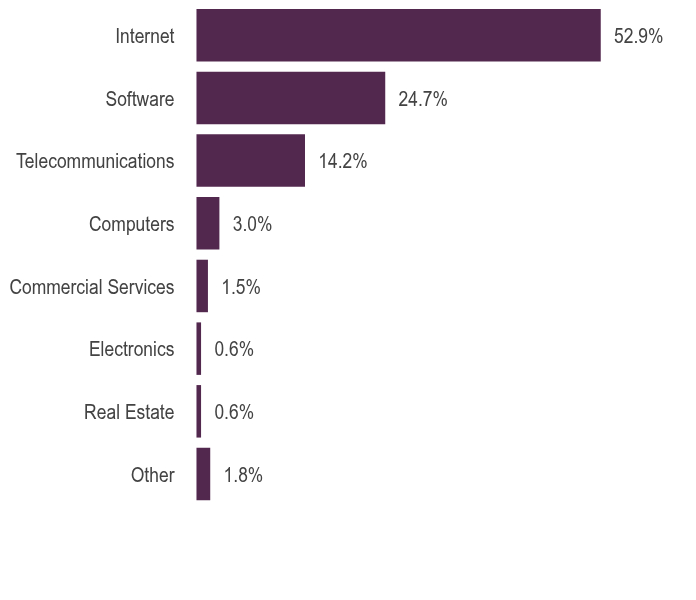
Holdings DiversificationFootnote Reference(1) (% of Net Assets) as of June 30, 2026 Table SummaryValue | Value |
|---|
Other | 1.8% | Real Estate | 0.6% | Electronics | 0.6% | Commercial Services | 1.5% | Computers | 3.0% | Telecommunications | 14.2% | Software | 24.7% | Internet | 52.9% | |
| Largest Holdings [Text Block] |
10 Largest HoldingsFootnote Reference(2) (% of Net Assets) as of June 30, 2026 Table SummaryAlphabet, Inc. — Class A | 7.9% |
|---|
Amazon.com, Inc. | 5.9% |
|---|
Meta Platforms, Inc. — Class A | 4.4% |
|---|
Cisco Systems, Inc. | 4.0% |
|---|
Netflix, Inc. | 3.3% |
|---|
Arista Networks, Inc. | 2.8% |
|---|
Uber Technologies, Inc. | 2.5% |
|---|
Booking Holdings, Inc. | 2.4% |
|---|
Salesforce, Inc. | 2.2% |
|---|
Datadog, Inc. — Class A | 2.0% |
|---|
Total | 37.4% |
|---|
|
| Material Fund Change [Text Block] |
|
| C000010388 |
|
| Shareholder Report [Line Items] |
|
| Fund Name |
Leisure Fund
|
| Class Name |
Variable Annuity
|
| No Trading Symbol [Flag] |
true
|
| Annual or Semi-Annual Statement [Text Block] |
This semi-annual shareholder report contains important information about the Leisure Fund for the period from January 1, 2026 to June 30, 2026.
|
| Additional Information [Text Block] |
You can find additional information about the fund at GuggenheimInvestments.com/variable-insurance-funds. You can also request this information by contacting 800 820 0888 or services@guggenheiminvestments.com.
|
| Additional Information Phone Number |
800 820 0888
|
| Additional Information Email |
<span style="box-sizing: border-box; color: rgb(67, 67, 67); display: inline; flex-wrap: nowrap; font-size: 10.6667px; font-weight: 400; grid-area: auto; line-height: 12.8px; margin: 0px; overflow: visible; text-align: left; text-align-last: auto; white-space-collapse: preserve-breaks;">services@guggenheiminvestments.com</span>
|
| Additional Information Website |
<span style="box-sizing: border-box; color: rgb(67, 67, 67); display: inline; flex-wrap: nowrap; font-size: 10.6667px; font-weight: 400; grid-area: auto; line-height: 12.8px; margin: 0px; overflow: visible; text-align: left; text-align-last: auto; white-space-collapse: preserve-breaks;">GuggenheimInvestments.com/variable-insurance-funds</span>
|
| Expenses [Text Block] |
What were the Fund's costs for the last six months? * Based on a hypothetical $10,000 investment Table SummaryClass | Costs of a $10,000 Investment | Costs Paid as a % of a $10,000 Investment** |
|---|
Variable Annuity | $83 | 1.70% |
|---|
Table Summary* | Excludes expenses of the underlying funds in which the fund invests, if any. |
|---|
** | Annualized |
|---|
|
| Expenses Paid, Amount |
$ 83
|
| Factors Affecting Performance [Text Block] |
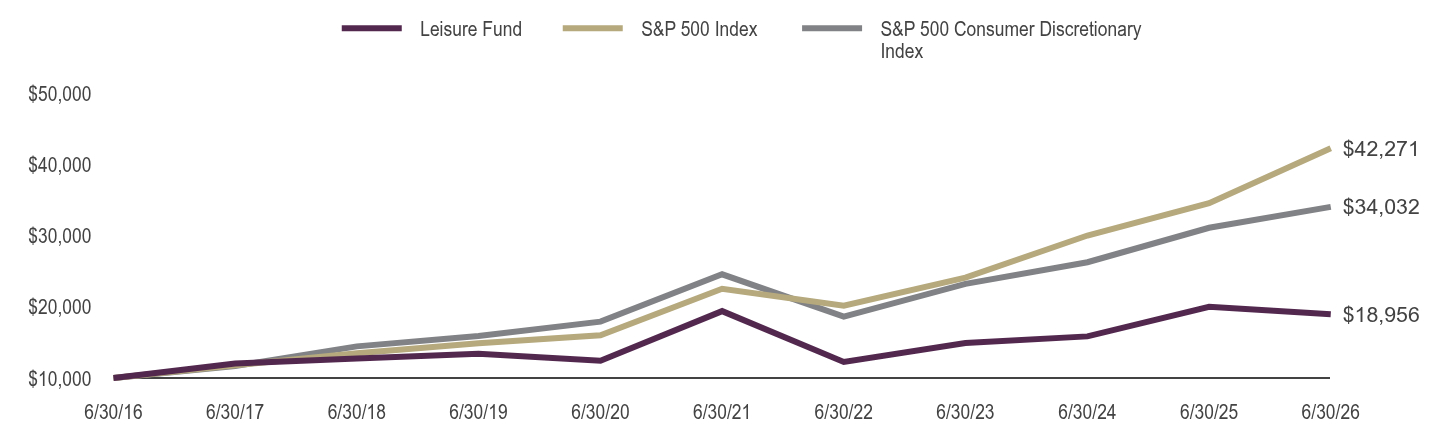
What factors materially affected the Fund's performance over the last six months? The industries that contributed the most to performance were tobacco, restaurants, and hotels resorts & cruise lines. Those that detracted the most were casinos & gaming, movies & entertainment, and cable & satellite. The holdings that contributed the most to performance were Altria Group, Inc., Philip Morris International, Inc., and Starbucks Corp. Those that detracted the most were Netflix, Inc., Flutter Entertainment plc, and Trip.com Group Ltd. ADR. |
| Line Graph [Table Text Block] |
Table Summary | Leisure Fund | S&P 500 Index | S&P 500 Consumer Discretionary Index |
|---|
6/30/16 | $10,000 | $10,000 | $10,000 |
|---|
6/30/17 | $12,023 | $11,790 | $11,690 |
|---|
6/30/18 | $12,735 | $13,484 | $14,443 |
|---|
6/30/19 | $13,411 | $14,889 | $15,912 |
|---|
6/30/20 | $12,423 | $16,006 | $17,915 |
|---|
6/30/21 | $19,391 | $22,536 | $24,559 |
|---|
6/30/22 | $12,246 | $20,144 | $18,617 |
|---|
6/30/23 | $14,920 | $24,091 | $23,220 |
|---|
6/30/24 | $15,844 | $30,006 | $26,258 |
|---|
6/30/25 | $20,007 | $34,556 | $31,090 |
|---|
6/30/26 | $18,956 | $42,271 | $34,032 |
|---|
|
| AssetsNet |
$ 2,980,422
|
| Holdings Count | Holding |
95
|
| InvestmentCompanyPortfolioTurnover |
45.00%
|
| Additional Fund Statistics [Text Block] |
Fund Statistics as of June 30, 2026 - Net Assets$2,980,422
- Total Number of Portfolio Holdings95
- Portfolio Turnover Rate45%
|
| Holdings [Text Block] |
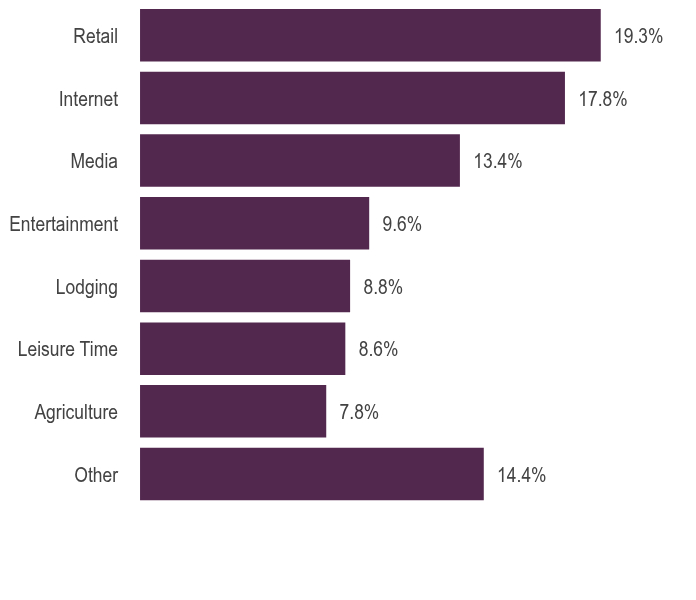
Holdings DiversificationFootnote Reference(1) (% of Net Assets) as of June 30, 2026 Table SummaryValue | Value |
|---|
Other | 14.4% | Agriculture | 7.8% | Leisure Time | 8.6% | Lodging | 8.8% | Entertainment | 9.6% | Media | 13.4% | Internet | 17.8% | Retail | 19.3% | |
| Largest Holdings [Text Block] |
10 Largest HoldingsFootnote Reference(2) (% of Net Assets) as of June 30, 2026 Table SummaryPhilip Morris International, Inc. | 4.1% |
|---|
Netflix, Inc. | 4.0% |
|---|
McDonald's Corp. | 3.3% |
|---|
Walt Disney Co. | 3.1% |
|---|
Booking Holdings, Inc. | 3.0% |
|---|
Altria Group, Inc. | 2.7% |
|---|
Starbucks Corp. | 2.6% |
|---|
Airbnb, Inc. — Class A | 2.3% |
|---|
Comcast Corp. — Class A | 2.3% |
|---|
DoorDash, Inc. — Class A | 2.3% |
|---|
Total | 29.7% |
|---|
|
| Material Fund Change [Text Block] |
|
| C000010412 |
|
| Shareholder Report [Line Items] |
|
| Fund Name |
Precious Metals Fund
|
| Class Name |
Variable Annuity
|
| No Trading Symbol [Flag] |
true
|
| Annual or Semi-Annual Statement [Text Block] |
This semi-annual shareholder report contains important information about the Precious Metals Fund for the period from January 1, 2026 to June 30, 2026.
|
| Additional Information [Text Block] |
You can find additional information about the fund at GuggenheimInvestments.com/variable-insurance-funds. You can also request this information by contacting 800 820 0888 or services@guggenheiminvestments.com.
|
| Additional Information Phone Number |
800 820 0888
|
| Additional Information Email |
<span style="box-sizing: border-box; color: rgb(67, 67, 67); display: inline; flex-wrap: nowrap; font-size: 10.6667px; font-weight: 400; grid-area: auto; line-height: 12.8px; margin: 0px; overflow: visible; text-align: left; text-align-last: auto; white-space-collapse: preserve-breaks;">services@guggenheiminvestments.com</span>
|
| Additional Information Website |
<span style="box-sizing: border-box; color: rgb(67, 67, 67); display: inline; flex-wrap: nowrap; font-size: 10.6667px; font-weight: 400; grid-area: auto; line-height: 12.8px; margin: 0px; overflow: visible; text-align: left; text-align-last: auto; white-space-collapse: preserve-breaks;">GuggenheimInvestments.com/variable-insurance-funds</span>
|
| Expenses [Text Block] |
What were the Fund's costs for the last six months? * Based on a hypothetical $10,000 investment Table SummaryClass | Costs of a $10,000 Investment | Costs Paid as a % of a $10,000 Investment** |
|---|
Variable Annuity | $76 | 1.60% |
|---|
Table Summary* | Excludes expenses of the underlying funds in which the fund invests, if any. |
|---|
** | Annualized |
|---|
|
| Expenses Paid, Amount |
$ 76
|
| Factors Affecting Performance [Text Block] |
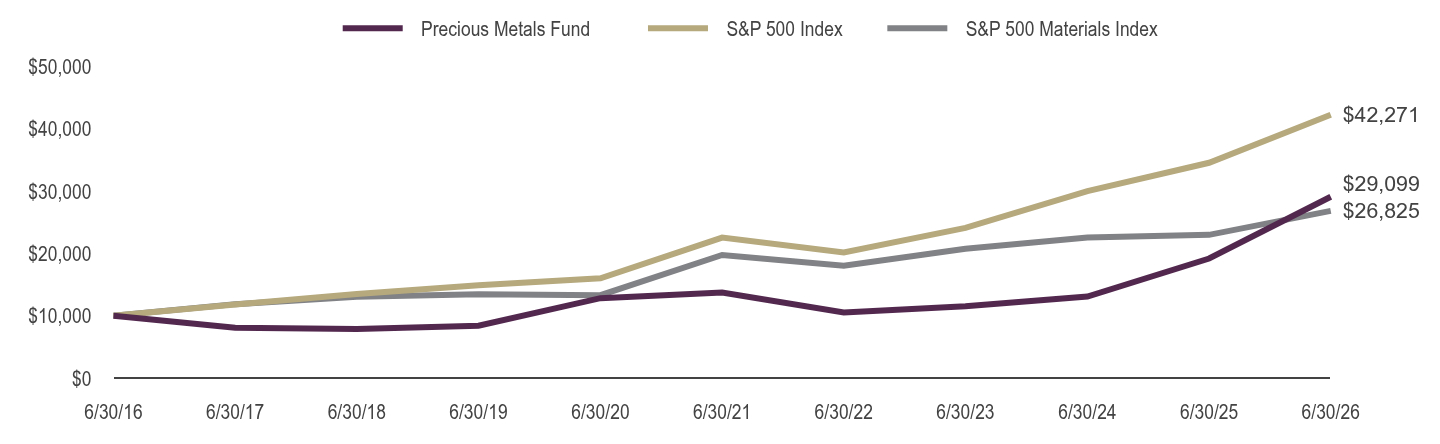
What factors materially affected the Fund's performance over the last six months? The industry that contributed the most to performance was copper. The industry that detracted the most from performance was gold. The holdings that contributed the most to performance were Freeport-McMoRan, Inc., SSR Mining, Inc., and Silvercorp Metals, Inc. The holdings that detracted the most from performance were Gold Fields Ltd. ADR, Sibanye Stillwater Ltd. ADR, and Barrick Mining Corp. |
| Line Graph [Table Text Block] |
Table Summary | Precious Metals Fund | S&P 500 Index | S&P 500 Materials Index |
|---|
6/30/16 | $10,000 | $10,000 | $10,000 |
|---|
6/30/17 | $8,077 | $11,790 | $11,859 |
|---|
6/30/18 | $7,865 | $13,484 | $13,033 |
|---|
6/30/19 | $8,383 | $14,889 | $13,450 |
|---|
6/30/20 | $12,820 | $16,006 | $13,301 |
|---|
6/30/21 | $13,735 | $22,536 | $19,754 |
|---|
6/30/22 | $10,515 | $20,144 | $18,031 |
|---|
6/30/23 | $11,504 | $24,091 | $20,756 |
|---|
6/30/24 | $13,075 | $30,006 | $22,560 |
|---|
6/30/25 | $19,187 | $34,556 | $22,980 |
|---|
6/30/26 | $29,099 | $42,271 | $26,825 |
|---|
|
| AssetsNet |
$ 35,893,332
|
| Holdings Count | Holding |
41
|
| InvestmentCompanyPortfolioTurnover |
370.00%
|
| Additional Fund Statistics Significance or Limits [Text Block] |
Fund Statistics as of June 30, 2026 - Net Assets$35,893,332
- Total Number of Portfolio Holdings41
- Portfolio Turnover Rate370%
|
| Holdings [Text Block] |
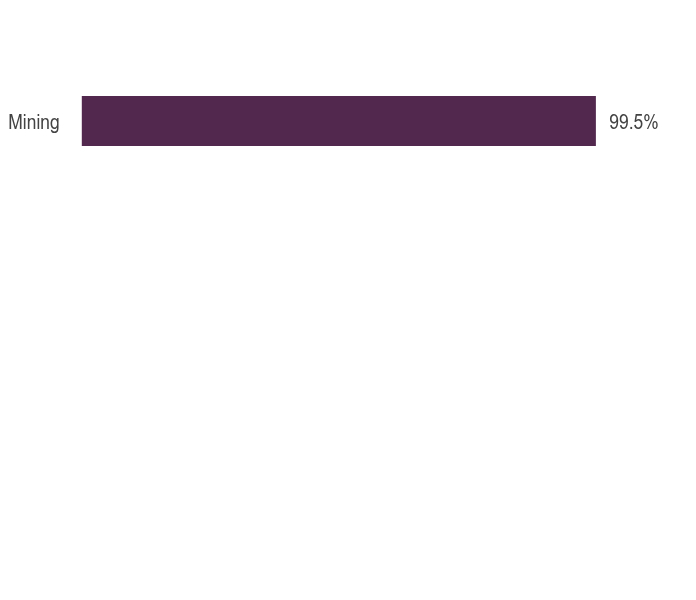
Holdings DiversificationFootnote Reference(1) (% of Net Assets) as of June 30, 2026 Table SummaryValue | Value |
|---|
Mining | 99.5% | |
| Largest Holdings [Text Block] |
10 Largest HoldingsFootnote Reference(2) (% of Net Assets) as of June 30, 2026 Table SummaryNewmont Corp. | 7.7% |
|---|
Freeport-McMoRan, Inc. | 7.2% |
|---|
Agnico Eagle Mines Ltd. | 6.9% |
|---|
Barrick Mining Corp. | 5.9% |
|---|
Wheaton Precious Metals Corp. | 5.6% |
|---|
Franco-Nevada Corp. | 4.5% |
|---|
Anglogold Ashanti plc | 4.3% |
|---|
Gold Fields Ltd. ADR | 4.1% |
|---|
Kinross Gold Corp. | 4.0% |
|---|
Pan American Silver Corp. | 3.3% |
|---|
Total | 53.5% |
|---|
|
| Material Fund Change [Text Block] |
|
| C000010395 |
|
| Shareholder Report [Line Items] |
|
| Fund Name |
Real Estate Fund
|
| Class Name |
Variable Annuity
|
| No Trading Symbol [Flag] |
true
|
| Annual or Semi-Annual Statement [Text Block] |
This semi-annual shareholder report contains important information about the Real Estate Fund for the period from January 1, 2026 to June 30, 2026.
|
| Additional Information [Text Block] |
You can find additional information about the fund at GuggenheimInvestments.com/variable-insurance-funds. You can also request this information by contacting 800 820 0888 or services@guggenheiminvestments.com.
|
| Additional Information Phone Number |
800 820 0888
|
| Additional Information Email |
<span style="box-sizing: border-box; color: rgb(67, 67, 67); display: inline; flex-wrap: nowrap; font-size: 10.6667px; font-weight: 400; grid-area: auto; line-height: 12.8px; margin: 0px; overflow: visible; text-align: left; text-align-last: auto; white-space-collapse: preserve-breaks;">services@guggenheiminvestments.com</span>
|
| Additional Information Website |
<span style="box-sizing: border-box; color: rgb(67, 67, 67); display: inline; flex-wrap: nowrap; font-size: 10.6667px; font-weight: 400; grid-area: auto; line-height: 12.8px; margin: 0px; overflow: visible; text-align: left; text-align-last: auto; white-space-collapse: preserve-breaks;">GuggenheimInvestments.com/variable-insurance-funds</span>
|
| Expenses [Text Block] |
What were the Fund's costs for the last six months? * Based on a hypothetical $10,000 investment Table SummaryClass | Costs of a $10,000 Investment | Costs Paid as a % of a $10,000 Investment** |
|---|
Variable Annuity | $88 | 1.69% |
|---|
Table Summary* | Excludes expenses of the underlying funds in which the fund invests, if any. |
|---|
** | Annualized |
|---|
|
| Expenses Paid, Amount |
$ 88
|
| Factors Affecting Performance [Text Block] |
What factors materially affected the Fund's performance over the last six months? The industries that contributed the most to performance were retail REITS, health care REITs, and data center REITs. Those that detracted the most were real estate services and telecom tower REITs. The holdings that contributed the most to performance were Equinix, Inc., Welltower, Inc., and Iron Mountain, Inc. Those that detracted the most were CoStar Group, Inc., Zillow Group, Inc. - Class C, and CBRE Group, Inc. - Class A. |
| Line Graph [Table Text Block] |
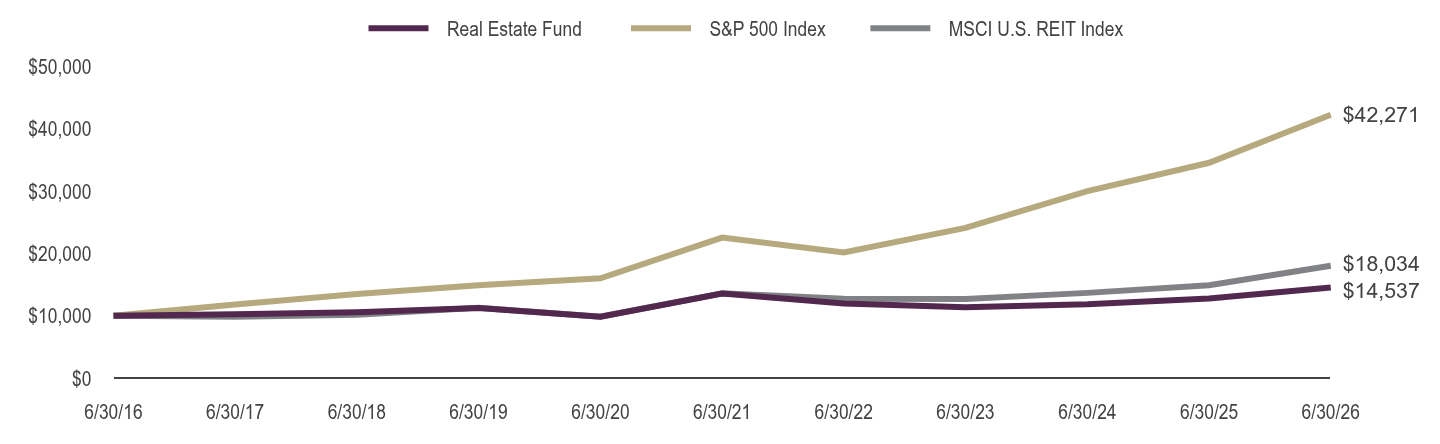
Table Summary | Real Estate Fund | S&P 500 Index | MSCI U.S. REIT Index |
|---|
6/30/16 | $10,000 | $10,000 | $10,000 |
|---|
6/30/17 | $10,215 | $11,790 | $9,818 |
|---|
6/30/18 | $10,556 | $13,484 | $10,168 |
|---|
6/30/19 | $11,248 | $14,889 | $11,293 |
|---|
6/30/20 | $9,831 | $16,006 | $9,840 |
|---|
6/30/21 | $13,560 | $22,536 | $13,585 |
|---|
6/30/22 | $11,955 | $20,144 | $12,713 |
|---|
6/30/23 | $11,353 | $24,091 | $12,702 |
|---|
6/30/24 | $11,828 | $30,006 | $13,667 |
|---|
6/30/25 | $12,775 | $34,556 | $14,886 |
|---|
6/30/26 | $14,537 | $42,271 | $18,034 |
|---|
|
| AssetsNet |
$ 3,601,462
|
| Holdings Count | Holding |
96
|
| InvestmentCompanyPortfolioTurnover |
1334.00%
|
| Additional Fund Statistics [Text Block] |
Fund Statistics as of June 30, 2026 - Net Assets$3,601,462
- Total Number of Portfolio Holdings96
- Portfolio Turnover Rate1,334%
|
| Holdings [Text Block] |
Holdings DiversificationFootnote Reference(1) (% of Net Assets) as of June 30, 2026 Table SummaryValue | Value |
|---|
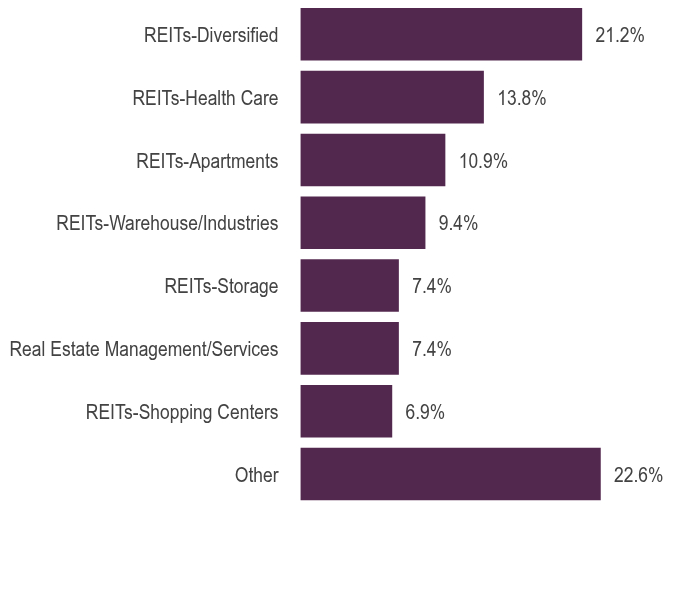
Other | 22.6% | REITs-Shopping Centers | 6.9% | Real Estate Management/Services | 7.4% | REITs-Storage | 7.4% | REITs-Warehouse/Industries | 9.4% | REITs-Apartments | 10.9% | REITs-Health Care | 13.8% | REITs-Diversified | 21.2% | |
| Largest Holdings [Text Block] |
10 Largest HoldingsFootnote Reference(2) (% of Net Assets) as of June 30, 2026 Table SummaryWelltower, Inc. | 4.1% |
|---|
Prologis, Inc. | 3.4% |
|---|
Equinix, Inc. | 3.2% |
|---|
Simon Property Group, Inc. | 2.7% |
|---|
American Tower Corp. | 2.6% |
|---|
Digital Realty Trust, Inc. | 2.5% |
|---|
Realty Income Corp. | 2.4% |
|---|
Public Storage | 2.2% |
|---|
Ventas, Inc. | 2.1% |
|---|
CBRE Group, Inc. — Class A | 2.0% |
|---|
Total | 27.2% |
|---|
|
| Material Fund Change [Text Block] |
|
| C000010389 |
|
| Shareholder Report [Line Items] |
|
| Fund Name |
Retailing Fund
|
| Class Name |
Variable Annuity
|
| No Trading Symbol [Flag] |
true
|
| Annual or Semi-Annual Statement [Text Block] |
This semi-annual shareholder report contains important information about the Retailing Fund for the period from January 1, 2026 to June 30, 2026.
|
| Additional Information [Text Block] |
You can find additional information about the fund at GuggenheimInvestments.com/variable-insurance-funds. You can also request this information by contacting 800 820 0888 or services@guggenheiminvestments.com.
|
| Additional Information Phone Number |
800 820 0888
|
| Additional Information Email |
<span style="box-sizing: border-box; color: rgb(67, 67, 67); display: inline; flex-wrap: nowrap; font-size: 10.6667px; font-weight: 400; grid-area: auto; line-height: 12.8px; margin: 0px; overflow: visible; text-align: left; text-align-last: auto; white-space-collapse: preserve-breaks;">services@guggenheiminvestments.com</span>
|
| Additional Information Website |
<span style="box-sizing: border-box; color: rgb(67, 67, 67); display: inline; flex-wrap: nowrap; font-size: 10.6667px; font-weight: 400; grid-area: auto; line-height: 12.8px; margin: 0px; overflow: visible; text-align: left; text-align-last: auto; white-space-collapse: preserve-breaks;">GuggenheimInvestments.com/variable-insurance-funds</span>
|
| Expenses [Text Block] |
What were the Fund's costs for the last six months? * Based on a hypothetical $10,000 investment Table SummaryClass | Costs of a $10,000 Investment | Costs Paid as a % of a $10,000 Investment** |
|---|
Variable Annuity | $83 | 1.70% |
|---|
Table Summary* | Excludes expenses of the underlying funds in which the fund invests, if any. |
|---|
** | Annualized |
|---|
|
| Expenses Paid, Amount |
$ 83
|
| Factors Affecting Performance [Text Block] |
What factors materially affected the Fund's performance over the last six months? The industries that contributed the most to performance were consumer staples merchandise retail, home furnishing retail, and apparel retail. Those that detracted the most were broadline retail, other specialty retail, and distributors. The holdings that contributed the most to performance were Target Corp., eBay, Inc., and Ross Stores, Inc. Those that detracted the most were PDD Holdings, Inc. ADR, Alibaba Group Holding Ltd. ADR, and Tractor Supply Co. |
| Line Graph [Table Text Block] |
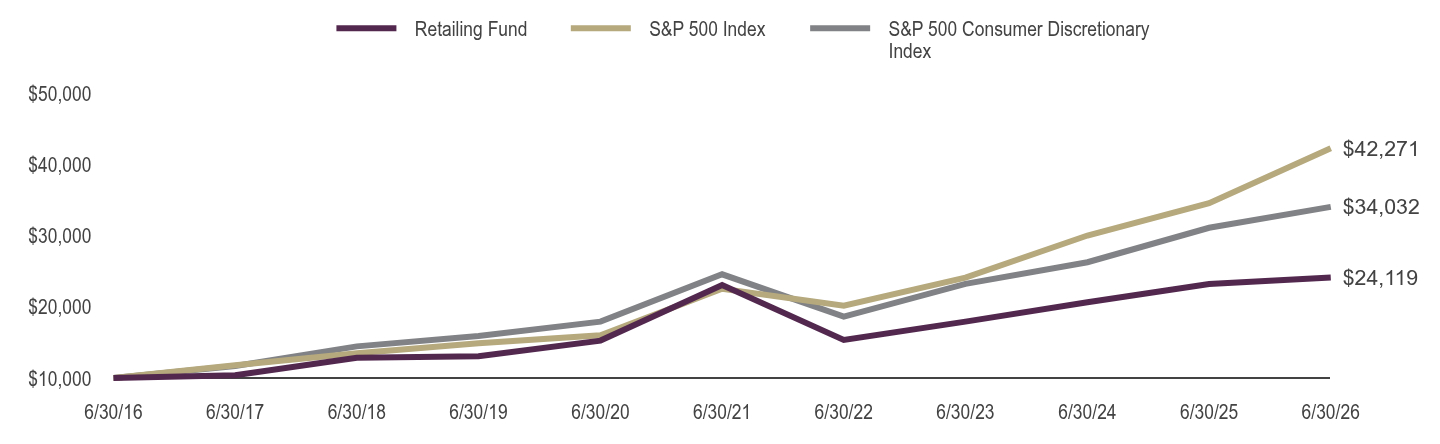
Table Summary | Retailing Fund | S&P 500 Index | S&P 500 Consumer Discretionary Index |
|---|
6/30/16 | $10,000 | $10,000 | $10,000 |
|---|
6/30/17 | $10,378 | $11,790 | $11,690 |
|---|
6/30/18 | $12,853 | $13,484 | $14,443 |
|---|
6/30/19 | $13,054 | $14,889 | $15,912 |
|---|
6/30/20 | $15,251 | $16,006 | $17,915 |
|---|
6/30/21 | $23,042 | $22,536 | $24,559 |
|---|
6/30/22 | $15,354 | $20,144 | $18,617 |
|---|
6/30/23 | $17,917 | $24,091 | $23,220 |
|---|
6/30/24 | $20,641 | $30,006 | $26,258 |
|---|
6/30/25 | $23,208 | $34,556 | $31,090 |
|---|
6/30/26 | $24,119 | $42,271 | $34,032 |
|---|
|
| AssetsNet |
$ 2,200,136
|
| Holdings Count | Holding |
63
|
| InvestmentCompanyPortfolioTurnover |
29.00%
|
| Additional Fund Statistics [Text Block] |
Fund Statistics as of June 30, 2026 - Net Assets$2,200,136
- Total Number of Portfolio Holdings63
- Portfolio Turnover Rate29%
|
| Holdings [Text Block] |
Holdings DiversificationFootnote Reference(1) (% of Net Assets) as of June 30, 2026 Table SummaryValue | Value |
|---|
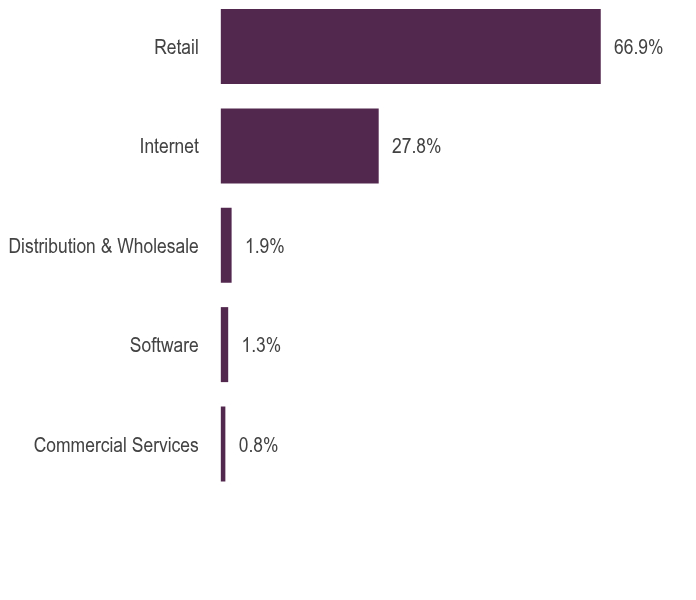
Commercial Services | 0.8% | Software | 1.3% | Distribution & Wholesale | 1.9% | Internet | 27.8% | Retail | 66.9% | |
| Largest Holdings [Text Block] |
10 Largest HoldingsFootnote Reference(2) (% of Net Assets) as of June 30, 2026 Table SummaryAmazon.com, Inc. | 10.2% |
|---|
Walmart, Inc. | 5.0% |
|---|
Home Depot, Inc. | 4.4% |
|---|
Costco Wholesale Corp. | 4.2% |
|---|
Lowe's Companies, Inc. | 3.9% |
|---|
TJX Companies, Inc. | 3.4% |
|---|
O'Reilly Automotive, Inc. | 3.1% |
|---|
Carvana Co. — Class A | 2.8% |
|---|
Ross Stores, Inc. | 2.7% |
|---|
Target Corp. | 2.6% |
|---|
Total | 42.3% |
|---|
|
| Material Fund Change [Text Block] |
|
| C000010391 |
|
| Shareholder Report [Line Items] |
|
| Fund Name |
Technology Fund
|
| Class Name |
Variable Annuity
|
| No Trading Symbol [Flag] |
true
|
| Annual or Semi-Annual Statement [Text Block] |
This semi-annual shareholder report contains important information about the Technology Fund for the period from January 1, 2026 to June 30, 2026.
|
| Additional Information [Text Block] |
You can find additional information about the fund at GuggenheimInvestments.com/variable-insurance-funds. You can also request this information by contacting 800 820 0888 or services@guggenheiminvestments.com.
|
| Additional Information Phone Number |
800 820 0888
|
| Additional Information Email |
<span style="box-sizing: border-box; color: rgb(67, 67, 67); display: inline; flex-wrap: nowrap; font-size: 10.6667px; font-weight: 400; grid-area: auto; line-height: 12.8px; margin: 0px; overflow: visible; text-align: left; text-align-last: auto; white-space-collapse: preserve-breaks;">services@guggenheiminvestments.com</span>
|
| Additional Information Website |
<span style="box-sizing: border-box; color: rgb(67, 67, 67); display: inline; flex-wrap: nowrap; font-size: 10.6667px; font-weight: 400; grid-area: auto; line-height: 12.8px; margin: 0px; overflow: visible; text-align: left; text-align-last: auto; white-space-collapse: preserve-breaks;">GuggenheimInvestments.com/variable-insurance-funds</span>
|
| Expenses [Text Block] |
What were the Fund's costs for the last six months? * Based on a hypothetical $10,000 investment Table SummaryClass | Costs of a $10,000 Investment | Costs Paid as a % of a $10,000 Investment** |
|---|
Variable Annuity | $98 | 1.69% |
|---|
Table Summary* | Excludes expenses of the underlying funds in which the fund invests, if any. |
|---|
** | Annualized |
|---|
|
| Expenses Paid, Amount |
$ 98
|
| Factors Affecting Performance [Text Block] |
What factors materially affected the Fund's performance over the last six months? The industries that contributed the most to performance were semiconductors, technology hardware storage & peripherals, and semiconductors materials & equipment. Those that detracted the most were application software, IT consulting & other services, and systems software. The holdings that contributed the most to performance were Micron Technology, Inc., Sandisk Corp., and Intel Corp. Those that detracted the most were Microsoft Corp., Intuit, Inc., and Palantir Technologies, Inc. - Class A. |
| Line Graph [Table Text Block] |
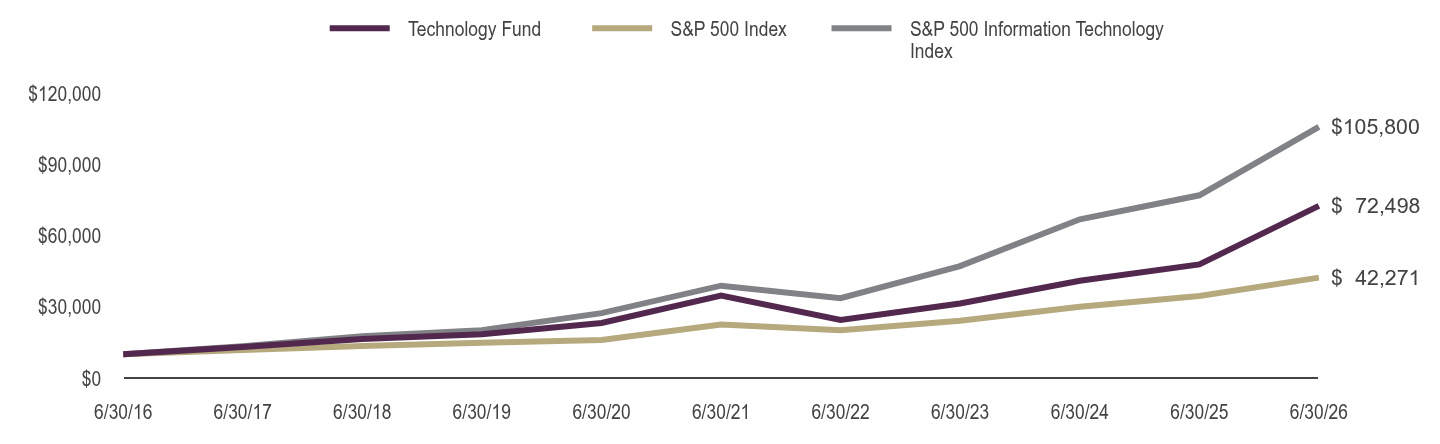
Table Summary | Technology Fund | S&P 500 Index | S&P 500 Information Technology Index |
|---|
6/30/16 | $10,000 | $10,000 | $10,000 |
|---|
6/30/17 | $13,044 | $11,790 | $13,389 |
|---|
6/30/18 | $16,433 | $13,484 | $17,580 |
|---|
6/30/19 | $18,447 | $14,889 | $20,100 |
|---|
6/30/20 | $23,204 | $16,006 | $27,315 |
|---|
6/30/21 | $34,765 | $22,536 | $38,897 |
|---|
6/30/22 | $24,416 | $20,144 | $33,621 |
|---|
6/30/23 | $31,398 | $24,091 | $47,158 |
|---|
6/30/24 | $40,982 | $30,006 | $66,859 |
|---|
6/30/25 | $47,851 | $34,556 | $76,955 |
|---|
6/30/26 | $72,498 | $42,271 | $105,800 |
|---|
|
| AssetsNet |
$ 34,161,399
|
| Holdings Count | Holding |
148
|
| InvestmentCompanyPortfolioTurnover |
89.00%
|
| Additional Fund Statistics [Text Block] |
Fund Statistics as of June 30, 2026 - Net Assets$34,161,399
- Total Number of Portfolio Holdings148
- Portfolio Turnover Rate89%
|
| Holdings [Text Block] |
Holdings DiversificationFootnote Reference(1) (% of Net Assets) as of June 30, 2026 Table SummaryValue | Value |
|---|
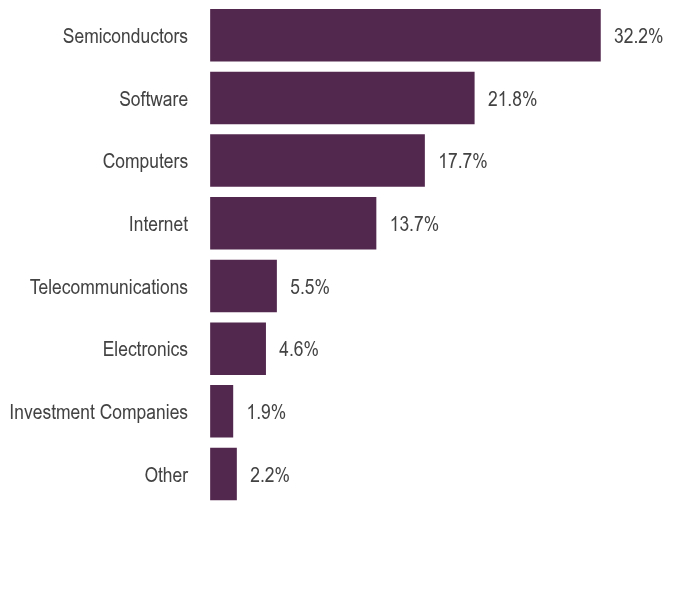
Other | 2.2% | Investment Companies | 1.9% | Electronics | 4.6% | Telecommunications | 5.5% | Internet | 13.7% | Computers | 17.7% | Software | 21.8% | Semiconductors | 32.2% | |
| Largest Holdings [Text Block] |
10 Largest HoldingsFootnote Reference(2) (% of Net Assets) as of June 30, 2026 Table SummaryNVIDIA Corp. | 4.8% |
|---|
Alphabet, Inc. — Class A | 4.7% |
|---|
Apple, Inc. | 4.5% |
|---|
Microsoft Corp. | 3.7% |
|---|
Broadcom, Inc. | 2.9% |
|---|
Micron Technology, Inc. | 2.7% |
|---|
Meta Platforms, Inc. — Class A | 2.7% |
|---|
Advanced Micro Devices, Inc. | 2.4% |
|---|
Sandisk Corp. | 2.0% |
|---|
Applied Materials, Inc. | 1.9% |
|---|
Total | 32.3% |
|---|
|
| Material Fund Change [Text Block] |
|
| C000010392 |
|
| Shareholder Report [Line Items] |
|
| Fund Name |
Telecommunications Fund
|
| Class Name |
Variable Annuity
|
| No Trading Symbol [Flag] |
true
|
| Annual or Semi-Annual Statement [Text Block] |
This semi-annual shareholder report contains important information about the Telecommunications Fund for the period from January 1, 2026 to June 30, 2026.
|
| Additional Information [Text Block] |
You can find additional information about the fund at GuggenheimInvestments.com/variable-insurance-funds. You can also request this information by contacting 800 820 0888 or services@guggenheiminvestments.com.
|
| Additional Information Phone Number |
800 820 0888
|
| Additional Information Email |
<span style="box-sizing: border-box; color: rgb(67, 67, 67); display: inline; flex-wrap: nowrap; font-size: 10.6667px; font-weight: 400; grid-area: auto; line-height: 12.8px; margin: 0px; overflow: visible; text-align: left; text-align-last: auto; white-space-collapse: preserve-breaks;">services@guggenheiminvestments.com</span>
|
| Additional Information Website |
<span style="box-sizing: border-box; color: rgb(67, 67, 67); display: inline; flex-wrap: nowrap; font-size: 10.6667px; font-weight: 400; grid-area: auto; line-height: 12.8px; margin: 0px; overflow: visible; text-align: left; text-align-last: auto; white-space-collapse: preserve-breaks;">GuggenheimInvestments.com/variable-insurance-funds</span>
|
| Expenses [Text Block] |
What were the Fund's costs for the last six months? * Based on a hypothetical $10,000 investment Table SummaryClass | Costs of a $10,000 Investment | Costs Paid as a % of a $10,000 Investment** |
|---|
Variable Annuity | $96 | 1.70% |
|---|
Table Summary* | Excludes expenses of the underlying funds in which the fund invests, if any. |
|---|
** | Annualized |
|---|
|
| Expenses Paid, Amount |
$ 96
|
| Factors Affecting Performance [Text Block] |
What factors materially affected the Fund's performance over the last six months? The industries that contributed the most to performance were communications equipment, alternative carriers, and movies & entertainment. The industries that detracted the most from performance were cable & satellite and application software. The holdings that contributed the most to performance were Lumentum Holdings, Inc., Cisco Systems, Inc., and Ciena Corp. Those that detracted the most were T-Mobile US, Inc., Charter Communications, Inc.- Class A, and AT&T, Inc. |
| Line Graph [Table Text Block] |
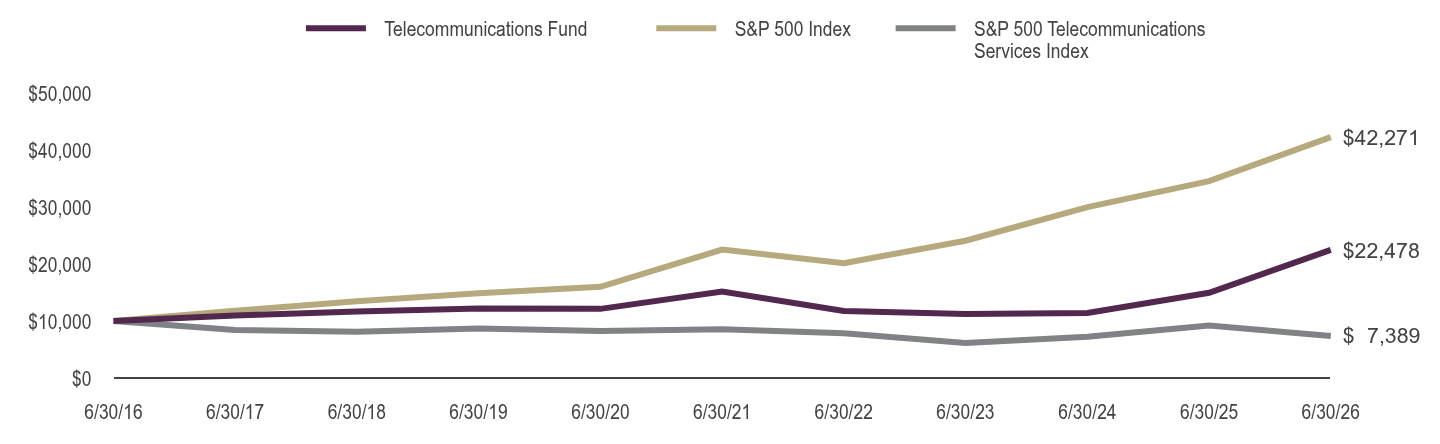
Table Summary | Telecommunications Fund | S&P 500 Index | S&P 500 Telecommunications Services Index |
|---|
6/30/16 | $10,000 | $10,000 | $10,000 |
|---|
6/30/17 | $10,959 | $11,790 | $8,434 |
|---|
6/30/18 | $11,671 | $13,484 | $8,110 |
|---|
6/30/19 | $12,179 | $14,889 | $8,674 |
|---|
6/30/20 | $12,136 | $16,006 | $8,234 |
|---|
6/30/21 | $15,188 | $22,536 | $8,564 |
|---|
6/30/22 | $11,780 | $20,144 | $7,864 |
|---|
6/30/23 | $11,250 | $24,091 | $6,155 |
|---|
6/30/24 | $11,422 | $30,006 | $7,229 |
|---|
6/30/25 | $14,965 | $34,556 | $9,228 |
|---|
6/30/26 | $22,478 | $42,271 | $7,389 |
|---|
|
| AssetsNet |
$ 6,475,887
|
| Holdings Count | Holding |
52
|
| InvestmentCompanyPortfolioTurnover |
155.00%
|
| Additional Fund Statistics [Text Block] |
Fund Statistics as of June 30, 2026 - Net Assets$6,475,887
- Total Number of Portfolio Holdings52
- Portfolio Turnover Rate155%
|
| Holdings [Text Block] |
Holdings DiversificationFootnote Reference(1) (% of Net Assets) as of June 30, 2026 Table SummaryValue | Value |
|---|
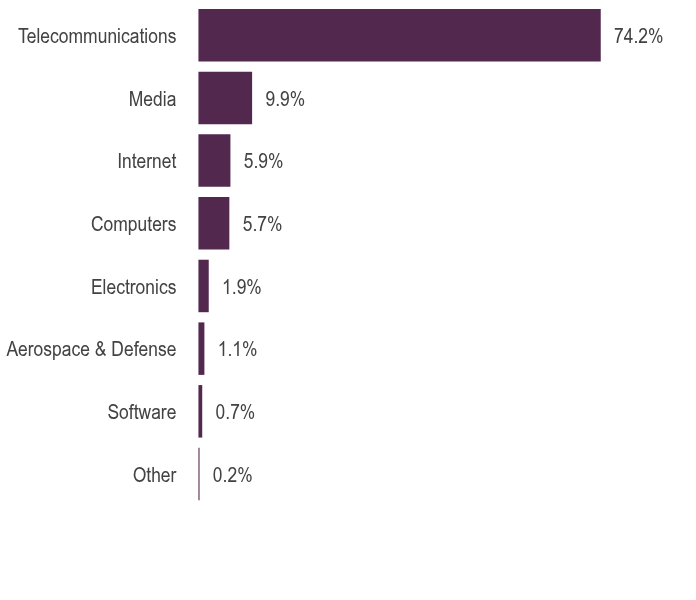
Other | 0.2% | Software | 0.7% | Aerospace & Defense | 1.1% | Electronics | 1.9% | Computers | 5.7% | Internet | 5.9% | Media | 9.9% | Telecommunications | 74.2% | |
| Largest Holdings [Text Block] |
10 Largest HoldingsFootnote Reference(2) (% of Net Assets) as of June 30, 2026 Table SummaryCisco Systems, Inc. | 8.9% |
|---|
Arista Networks, Inc. | 6.1% |
|---|
Verizon Communications, Inc. | 5.3% |
|---|
Ciena Corp. | 5.2% |
|---|
AT&T, Inc. | 5.0% |
|---|
Lumentum Holdings, Inc. | 4.7% |
|---|
Comcast Corp. — Class A | 4.5% |
|---|
Motorola Solutions, Inc. | 4.2% |
|---|
T-Mobile US, Inc. | 3.9% |
|---|
AST SpaceMobile, Inc. — Class A | 3.2% |
|---|
Total | 51.0% |
|---|
|
| Material Fund Change [Text Block] |
|
| C000010393 |
|
| Shareholder Report [Line Items] |
|
| Fund Name |
Transportation Fund
|
| Class Name |
Variable Annuity
|
| No Trading Symbol [Flag] |
true
|
| Annual or Semi-Annual Statement [Text Block] |
This semi-annual shareholder report contains important information about the Transportation Fund for the period from January 1, 2026 to June 30, 2026.
|
| Additional Information [Text Block] |
You can find additional information about the fund at GuggenheimInvestments.com/variable-insurance-funds. You can also request this information by contacting 800 820 0888 or services@guggenheiminvestments.com.
|
| Additional Information Phone Number |
800 820 0888
|
| Additional Information Email |
<span style="box-sizing: border-box; color: rgb(67, 67, 67); display: inline; flex-wrap: nowrap; font-size: 10.6667px; font-weight: 400; grid-area: auto; line-height: 12.8px; margin: 0px; overflow: visible; text-align: left; text-align-last: auto; white-space-collapse: preserve-breaks;">services@guggenheiminvestments.com</span>
|
| Additional Information Website |
<span style="box-sizing: border-box; color: rgb(67, 67, 67); display: inline; flex-wrap: nowrap; font-size: 10.6667px; font-weight: 400; grid-area: auto; line-height: 12.8px; margin: 0px; overflow: visible; text-align: left; text-align-last: auto; white-space-collapse: preserve-breaks;">GuggenheimInvestments.com/variable-insurance-funds</span>
|
| Expenses [Text Block] |
What were the Fund's costs for the last six months? * Based on a hypothetical $10,000 investment Table SummaryClass | Costs of a $10,000 Investment | Costs Paid as a % of a $10,000 Investment** |
|---|
Variable Annuity | $89 | 1.70% |
|---|
Table Summary* | Excludes expenses of the underlying funds in which the fund invests, if any. |
|---|
** | Annualized |
|---|
|
| Expenses Paid, Amount |
$ 89
|
| Factors Affecting Performance [Text Block] |
What factors materially affected the Fund's performance over the last six months? The industries that contributed the most to performance were cargo ground transportation, passenger airlines, and rail transportation. Those that detracted the most were automobile manufacturers, passenger ground transportation and tires & rubber. The holdings that contributed the most to performance were Garrett Motion Inc., FedEx Corp., and Delta Air Lines, Inc. Those that detracted the most were Tesla, Inc, Stellantis N.V., and Uber Technologies, Inc. |
| Line Graph [Table Text Block] |
Table Summary | Transportation Fund | S&P 500 Index | S&P 500 Industrials Index |
|---|
6/30/16 | $10,000 | $10,000 | $10,000 |
|---|
6/30/17 | $13,184 | $11,790 | $12,227 |
|---|
6/30/18 | $14,069 | $13,484 | $12,880 |
|---|
6/30/19 | $13,459 | $14,889 | $14,223 |
|---|
6/30/20 | $13,287 | $16,006 | $12,940 |
|---|
6/30/21 | $23,141 | $22,536 | $19,596 |
|---|
6/30/22 | $17,430 | $20,144 | $16,967 |
|---|
6/30/23 | $20,247 | $24,091 | $21,237 |
|---|
6/30/24 | $18,490 | $30,006 | $24,534 |
|---|
6/30/25 | $19,653 | $34,556 | $30,149 |
|---|
6/30/26 | $25,107 | $42,271 | $38,377 |
|---|
|
| AssetsNet |
$ 2,849,055
|
| Holdings Count | Holding |
80
|
| InvestmentCompanyPortfolioTurnover |
473.00%
|
| Additional Fund Statistics [Text Block] |
Fund Statistics as of June 30, 2026 - Net Assets$2,849,055
- Total Number of Portfolio Holdings80
- Portfolio Turnover Rate473%
|
| Holdings [Text Block] |
Holdings DiversificationFootnote Reference(1) (% of Net Assets) as of June 30, 2026 Table SummaryValue | Value |
|---|
Other | 1.1% | Aerospace & Defense | 0.7% | Leisure Time | 1.0% | Internet | 6.1% | Auto Parts & Equipment | 12.8% | Airlines | 13.1% | Auto Manufacturers | 25.5% | Transportation | 39.3% | |
| Largest Holdings [Text Block] |
10 Largest HoldingsFootnote Reference(2) (% of Net Assets) as of June 30, 2026 Table SummaryTesla, Inc. | 12.2% |
|---|
Union Pacific Corp. | 4.1% |
|---|
Uber Technologies, Inc. | 3.9% |
|---|
United Parcel Service, Inc. — Class B | 3.0% |
|---|
CSX Corp. | 3.0% |
|---|
Norfolk Southern Corp. | 2.7% |
|---|
General Motors Co. | 2.6% |
|---|
Delta Air Lines, Inc. | 2.6% |
|---|
FedEx Corp. | 2.5% |
|---|
Ford Motor Co. | 2.3% |
|---|
Total | 38.9% |
|---|
|
| Material Fund Change [Text Block] |
|
| C000010394 |
|
| Shareholder Report [Line Items] |
|
| Fund Name |
Utilities Fund
|
| Class Name |
Variable Annuity
|
| No Trading Symbol [Flag] |
true
|
| Annual or Semi-Annual Statement [Text Block] |
This semi-annual shareholder report contains important information about the Utilities Fund for the period from January 1, 2026 to June 30, 2026.
|
| Additional Information [Text Block] |
You can find additional information about the fund at GuggenheimInvestments.com/variable-insurance-funds. You can also request this information by contacting 800 820 0888 or services@guggenheiminvestments.com.
|
| Additional Information Phone Number |
800 820 0888
|
| Additional Information Email |
<span style="box-sizing: border-box; color: rgb(67, 67, 67); display: inline; flex-wrap: nowrap; font-size: 10.6667px; font-weight: 400; grid-area: auto; line-height: 12.8px; margin: 0px; overflow: visible; text-align: left; text-align-last: auto; white-space-collapse: preserve-breaks;">services@guggenheiminvestments.com</span>
|
| Additional Information Website |
<span style="box-sizing: border-box; color: rgb(67, 67, 67); display: inline; flex-wrap: nowrap; font-size: 10.6667px; font-weight: 400; grid-area: auto; line-height: 12.8px; margin: 0px; overflow: visible; text-align: left; text-align-last: auto; white-space-collapse: preserve-breaks;">GuggenheimInvestments.com/variable-insurance-funds</span>
|
| Expenses [Text Block] |
What were the Fund's costs for the last six months? * Based on a hypothetical $10,000 investment Table SummaryClass | Costs of a $10,000 Investment | Costs Paid as a % of a $10,000 Investment** |
|---|
Variable Annuity | $87 | 1.69% |
|---|
Table Summary* | Excludes expenses of the underlying funds in which the fund invests, if any. |
|---|
** | Annualized |
|---|
|
| Expenses Paid, Amount |
$ 87
|
| Factors Affecting Performance [Text Block] |
What factors materially affected the Fund's performance over the last six months? The industries that contributed the most to performance were electric utilities, multi utilities, and water utilities. No industries detracted from performance. The holdings that contributed the most to performance were Entergy Corp., American Electric Power Company, Inc., and NextEra Energy, Inc. Those that detracted the most were Constellation Energy Corp., Oklo Inc. - Class A, and NRG Energy, Inc. |
| Line Graph [Table Text Block] |
Table Summary | Utilities Fund | S&P 500 Index | S&P 500 Utilities Index |
|---|
6/30/16 | $10,000 | $10,000 | $10,000 |
|---|
6/30/17 | $10,138 | $11,790 | $10,247 |
|---|
6/30/18 | $10,622 | $13,484 | $10,597 |
|---|
6/30/19 | $12,229 | $14,889 | $12,614 |
|---|
6/30/20 | $11,069 | $16,006 | $12,347 |
|---|
6/30/21 | $12,604 | $22,536 | $14,294 |
|---|
6/30/22 | $13,939 | $20,144 | $16,338 |
|---|
6/30/23 | $13,403 | $24,091 | $15,737 |
|---|
6/30/24 | $14,123 | $30,006 | $16,968 |
|---|
6/30/25 | $17,395 | $34,556 | $20,939 |
|---|
6/30/26 | $19,832 | $42,271 | $23,915 |
|---|
|
| AssetsNet |
$ 9,236,096
|
| Holdings Count | Holding |
53
|
| InvestmentCompanyPortfolioTurnover |
448.00%
|
| Additional Fund Statistics [Text Block] |
Fund Statistics as of June 30, 2026 - Net Assets$9,236,096
- Total Number of Portfolio Holdings53
- Portfolio Turnover Rate448%
|
| Holdings [Text Block] |
Holdings DiversificationFootnote Reference(1) (% of Net Assets) as of June 30, 2026 Table SummaryValue | Value |
|---|
Water | 3.9% | Gas | 7.0% | Electric | 88.5% | |
| Largest Holdings [Text Block] |
10 Largest HoldingsFootnote Reference(2) (% of Net Assets) as of June 30, 2026 Table SummaryNextEra Energy, Inc. | 5.4% |
|---|
Southern Co. | 4.1% |
|---|
Duke Energy Corp. | 3.9% |
|---|
American Electric Power Company, Inc. | 3.5% |
|---|
Constellation Energy Corp. | 3.5% |
|---|
Dominion Energy, Inc. | 3.1% |
|---|
Sempra | 3.1% |
|---|
Entergy Corp. | 3.0% |
|---|
Vistra Corp. | 2.9% |
|---|
Xcel Energy, Inc. | 2.8% |
|---|
Total | 35.3% |
|---|
|
| Material Fund Change [Text Block] |
|
| C000010422 |
|
| Shareholder Report [Line Items] |
|
| Fund Name |
Dow 2x Strategy Fund
|
| Class Name |
Variable Annuity
|
| No Trading Symbol [Flag] |
true
|
| Annual or Semi-Annual Statement [Text Block] |
This semi-annual shareholder report contains important information about the Dow 2x Strategy Fund for the period from January 1, 2026 to June 30, 2026.
|
| Additional Information [Text Block] |
You can find additional information about the fund at GuggenheimInvestments.com/variable-insurance-funds. You can also request this information by contacting 800 820 0888 or services@guggenheiminvestments.com.
|
| Additional Information Phone Number |
800 820 0888
|
| Additional Information Email |
<span style="box-sizing: border-box; color: rgb(67, 67, 67); display: inline; flex-wrap: nowrap; font-size: 10.6667px; font-weight: 400; grid-area: auto; line-height: 12.8px; margin: 0px; overflow: visible; text-align: left; text-align-last: auto; white-space-collapse: preserve-breaks;">services@guggenheiminvestments.com</span>
|
| Additional Information Website |
<span style="box-sizing: border-box; color: rgb(67, 67, 67); display: inline; flex-wrap: nowrap; font-size: 10.6667px; font-weight: 400; grid-area: auto; line-height: 12.8px; margin: 0px; overflow: visible; text-align: left; text-align-last: auto; white-space-collapse: preserve-breaks;">GuggenheimInvestments.com/variable-insurance-funds</span>
|
| Expenses [Text Block] |
What were the Fund's costs for the last six months? * Based on a hypothetical $10,000 investment Table SummaryClass | Costs of a $10,000 Investment | Costs Paid as a % of a $10,000 Investment** |
|---|
Variable Annuity | $96 | 1.80% |
|---|
Table Summary* | Excludes expenses of the underlying funds in which the fund invests, if any. |
|---|
** | Annualized |
|---|
|
| Expenses Paid, Amount |
$ 96
|
| Factors Affecting Performance [Text Block] |
What factors materially affected the Fund's performance over the last six months? The sectors that contributed the most to the return of the underlying index were industrials, health care, and financials. Those that detracted the most were information technology, consumer discretionary, and communication services. The holdings that contributed the most to return of the underlying index were Caterpillar, Inc., Goldman Sachs Group, Inc., and UnitedHealth Group, Inc. Those that detracted the most were Microsoft Corp., Salesforce, Inc., and McDonald's Corp. The Fund maintained a daily correlation of over 99% to its benchmark of 200% of the daily price movement of the Dow Jones Industrial Average. |
| Line Graph [Table Text Block] |
Table Summary | Dow 2x Strategy Fund | S&P 500 Index | Dow Jones Industrial Average |
|---|
6/30/16 | $10,000 | $10,000 | $10,000 |
|---|
6/30/17 | $14,483 | $11,790 | $12,212 |
|---|
6/30/18 | $18,543 | $13,484 | $14,203 |
|---|
6/30/19 | $21,571 | $14,889 | $15,936 |
|---|
6/30/20 | $17,829 | $16,006 | $15,850 |
|---|
6/30/21 | $31,914 | $22,536 | $21,610 |
|---|
6/30/22 | $24,797 | $20,144 | $19,654 |
|---|
6/30/23 | $29,574 | $24,091 | $22,450 |
|---|
6/30/24 | $36,458 | $30,006 | $26,047 |
|---|
6/30/25 | $43,177 | $34,556 | $29,881 |
|---|
6/30/26 | $57,750 | $42,271 | $36,051 |
|---|
|
| AssetsNet |
$ 12,473,389
|
| Holdings Count | Holding |
36
|
| InvestmentCompanyPortfolioTurnover |
234.00%
|
| Additional Fund Statistics [Text Block] |
Fund Statistics as of June 30, 2026 - Net Assets$12,473,389
- Total Number of Portfolio Holdings36
- Portfolio Turnover Rate234%
|
| Holdings [Text Block] |
Holdings DiversificationFootnote Reference(1) (% of Net Assets) as of June 30, 2026 Table SummaryValue | Value |
|---|
Other | 4.9% | Consumer, Cyclical | 7.5% | Communications | 7.8% | Technology | 12.6% | Consumer, Non-cyclical | 13.4% | Equity Futures Contracts Purchased | 14.8% | Industrial | 16.1% | Financial | 22.7% | OTC Equity Index Swap Agreements | 100.4% | |
| Largest Holdings [Text Block] |
10 Largest HoldingsFootnote Reference(2) (% of Net Assets) as of June 30, 2026 Table SummaryCaterpillar, Inc. | 10.3% |
|---|
Goldman Sachs Group, Inc. | 9.8% |
|---|
UnitedHealth Group, Inc. | 4.0% |
|---|
Microsoft Corp. | 3.6% |
|---|
Amgen, Inc. | 3.5% |
|---|
Alphabet, Inc. — Class A | 3.5% |
|---|
Home Depot, Inc. | 3.4% |
|---|
Sherwin-Williams Co. | 3.3% |
|---|
Visa, Inc. — Class A | 3.3% |
|---|
American Express Co. | 3.3% |
|---|
Total | 48.0% |
|---|
|
| Material Fund Change [Text Block] |
|
| C000010424 |
|
| Shareholder Report [Line Items] |
|
| Fund Name |
Inverse Dow 2x Strategy Fund
|
| Class Name |
Variable Annuity
|
| No Trading Symbol [Flag] |
true
|
| Annual or Semi-Annual Statement [Text Block] |
This semi-annual shareholder report contains important information about the Inverse Dow 2x Strategy Fund for the period from January 1, 2026 to June 30, 2026.
|
| Additional Information [Text Block] |
You can find additional information about the fund at GuggenheimInvestments.com/variable-insurance-funds. You can also request this information by contacting 800 820 0888 or services@guggenheiminvestments.com.
|
| Additional Information Phone Number |
800 820 0888
|
| Additional Information Email |
<span style="box-sizing: border-box; color: rgb(67, 67, 67); display: inline; flex-wrap: nowrap; font-size: 10.6667px; font-weight: 400; grid-area: auto; line-height: 12.8px; margin: 0px; overflow: visible; text-align: left; text-align-last: auto; white-space-collapse: preserve-breaks;">services@guggenheiminvestments.com</span>
|
| Additional Information Website |
<span style="box-sizing: border-box; color: rgb(67, 67, 67); display: inline; flex-wrap: nowrap; font-size: 10.6667px; font-weight: 400; grid-area: auto; line-height: 12.8px; margin: 0px; overflow: visible; text-align: left; text-align-last: auto; white-space-collapse: preserve-breaks;">GuggenheimInvestments.com/variable-insurance-funds</span>
|
| Expenses [Text Block] |
What were the Fund's costs for the last six months? * Based on a hypothetical $10,000 investment Table SummaryClass | Costs of a $10,000 Investment | Costs Paid as a % of a $10,000 Investment** |
|---|
Variable Annuity | $82 | 1.75% |
|---|
Table Summary* | Excludes expenses of the underlying funds in which the fund invests, if any. |
|---|
** | Annualized |
|---|
|
| Expenses Paid, Amount |
$ 82
|
| Factors Affecting Performance [Text Block] |
What factors materially affected the Fund's performance over the last six months? The sectors that contributed the most to the return of the underlying index were industrials, health care, and financials. Those that detracted the most were information technology, consumer discretionary, and communication services. The holdings that contributed the most to return of the underlying index were Caterpillar, Inc., Goldman Sachs Group, Inc., and UnitedHealth Group, Inc. Those that detracted the most were Microsoft Corp., Salesforce, Inc., and McDonald's Corp. The Fund maintained a daily correlation of over 99% to its benchmark of -200% of the daily price movement of the Dow Jones Industrial Average. |
| Line Graph [Table Text Block] |
Table Summary | Inverse Dow 2x Strategy Fund | S&P 500 Index | Dow Jones Industrial Average |
|---|
6/30/16 | $10,000 | $10,000 | $10,000 |
|---|
6/30/17 | $6,626 | $11,790 | $12,212 |
|---|
6/30/18 | $4,788 | $13,484 | $14,203 |
|---|
6/30/19 | $3,705 | $14,889 | $15,936 |
|---|
6/30/20 | $2,553 | $16,006 | $15,850 |
|---|
6/30/21 | $1,280 | $22,536 | $21,610 |
|---|
6/30/22 | $1,400 | $20,144 | $19,654 |
|---|
6/30/23 | $1,094 | $24,091 | $22,450 |
|---|
6/30/24 | $912 | $30,006 | $26,047 |
|---|
6/30/25 | $732 | $34,556 | $29,881 |
|---|
6/30/26 | $560 | $42,271 | $36,051 |
|---|
|
| AssetsNet |
$ 846,831
|
| Holdings Count | Holding |
9
|
| InvestmentCompanyPortfolioTurnover |
0.00%
|
| Additional Fund Statistics [Text Block] |
Fund Statistics as of June 30, 2026 - Net Assets$846,831
- Total Number of Portfolio Holdings9
- Portfolio Turnover Rate-%
|
| Holdings [Text Block] |
Holdings DiversificationFootnote Reference(1) (% of Net Assets) as of June 30, 2026 Table SummaryValue | Value |
|---|
OTC Equity Index Swap Agreements Sold Short | -199.9% | |
| Material Fund Change [Text Block] |
|
| C000010396 |
|
| Shareholder Report [Line Items] |
|
| Fund Name |
Mid-Cap 1.5x Strategy Fund
|
| Class Name |
Variable Annuity
|
| No Trading Symbol [Flag] |
true
|
| Annual or Semi-Annual Statement [Text Block] |
This semi-annual shareholder report contains important information about the Mid-Cap 1.5x Strategy Fund for the period from January 1, 2026 to June 30, 2026.
|
| Additional Information [Text Block] |
You can find additional information about the fund at GuggenheimInvestments.com/variable-insurance-funds. You can also request this information by contacting 800 820 0888 or services@guggenheiminvestments.com.
|
| Additional Information Phone Number |
800 820 0888
|
| Additional Information Email |
<span style="box-sizing: border-box; color: rgb(67, 67, 67); display: inline; flex-wrap: nowrap; font-size: 10.6667px; font-weight: 400; grid-area: auto; line-height: 12.8px; margin: 0px; overflow: visible; text-align: left; text-align-last: auto; white-space-collapse: preserve-breaks;">services@guggenheiminvestments.com</span>
|
| Additional Information Website |
<span style="box-sizing: border-box; color: rgb(67, 67, 67); display: inline; flex-wrap: nowrap; font-size: 10.6667px; font-weight: 400; grid-area: auto; line-height: 12.8px; margin: 0px; overflow: visible; text-align: left; text-align-last: auto; white-space-collapse: preserve-breaks;">GuggenheimInvestments.com/variable-insurance-funds</span>
|
| Expenses [Text Block] |
What were the Fund's costs for the last six months? * Based on a hypothetical $10,000 investment Table SummaryClass | Costs of a $10,000 Investment | Costs Paid as a % of a $10,000 Investment** |
|---|
Variable Annuity | $95 | 1.71% |
|---|
Table Summary* | Excludes expenses of the underlying funds in which the fund invests, if any. |
|---|
** | Annualized |
|---|
|
| Expenses Paid, Amount |
$ 95
|
| Factors Affecting Performance [Text Block] |
What factors materially affected the Fund's performance over the last six months? The sectors that contributed the most to the return of the underlying index were information technology, industrials, and energy. The sector that detracted the most was communication services. The holdings that contributed the most to the return of the underlying index were Flex Ltd., Lumentum Holdings, Inc., and MKS, Inc. Those that detracted the most were Guidewire Software, Inc., DocuSign, Inc., and Kratos Defense & Security Solutions, Inc. The Fund maintained a correlation of over 99% to its benchmark of 150% of the daily price movement of the S&P MidCap 400 Index. |
| Line Graph [Table Text Block] |
Table Summary | Mid-Cap 1.5x Strategy Fund | S&P 500 Index | S&P MidCap 400 Index |
|---|
6/30/16 | $10,000 | $10,000 | $10,000 |
|---|
6/30/17 | $12,651 | $11,790 | $11,857 |
|---|
6/30/18 | $14,849 | $13,484 | $13,458 |
|---|
6/30/19 | $14,522 | $14,889 | $13,641 |
|---|
6/30/20 | $11,884 | $16,006 | $12,728 |
|---|
6/30/21 | $21,897 | $22,536 | $19,503 |
|---|
6/30/22 | $16,575 | $20,144 | $16,648 |
|---|
6/30/23 | $19,991 | $24,091 | $19,580 |
|---|
6/30/24 | $22,951 | $30,006 | $22,238 |
|---|
6/30/25 | $24,058 | $34,556 | $23,912 |
|---|
6/30/26 | $32,273 | $42,271 | $30,101 |
|---|
|
| AssetsNet |
$ 4,106,058
|
| Holdings Count | Holding |
409
|
| InvestmentCompanyPortfolioTurnover |
11.00%
|
| Additional Fund Statistics [Text Block] |
Fund Statistics as of June 30, 2026 - Net Assets$4,106,058
- Total Number of Portfolio Holdings409
- Portfolio Turnover Rate11%
|
| Holdings [Text Block] |
Holdings DiversificationFootnote Reference(1) (% of Net Assets) as of June 30, 2026 Table SummaryValue | Value |
|---|
Other | 11.3% | Technology | 8.2% | Consumer, Cyclical | 9.2% | Consumer, Non-cyclical | 10.5% | Financial | 15.0% | Industrial | 19.4% | OTC Equity Index Swap Agreements | 76.1% | |
| Largest Holdings [Text Block] |
10 Largest HoldingsFootnote Reference(2) (% of Net Assets) as of June 30, 2026 Table SummaryGuggenheim Ultra Short Duration Fund — Institutional Class | 3.9% |
|---|
Guggenheim Ultra Short Income ETF | 2.0% |
|---|
Twilio, Inc. — Class A | 0.6% |
|---|
Carpenter Technology Corp. | 0.6% |
|---|
MKS, Inc. | 0.6% |
|---|
Curtiss-Wright Corp. | 0.6% |
|---|
nVent Electric plc | 0.6% |
|---|
Entegris, Inc. | 0.6% |
|---|
ATI, Inc. | 0.5% |
|---|
Illumina, Inc. | 0.5% |
|---|
Total | 10.5% |
|---|
|
| Material Fund Change [Text Block] |
|
| C000010414 |
|
| Shareholder Report [Line Items] |
|
| Fund Name |
Inverse Mid-Cap Strategy Fund
|
| Class Name |
Variable Annuity
|
| No Trading Symbol [Flag] |
true
|
| Annual or Semi-Annual Statement [Text Block] |
This semi-annual shareholder report contains important information about the Inverse Mid-Cap Strategy Fund for the period from January 1, 2026 to June 30, 2026.
|
| Additional Information [Text Block] |
You can find additional information about the fund at GuggenheimInvestments.com/variable-insurance-funds. You can also request this information by contacting 800 820 0888 or services@guggenheiminvestments.com.
|
| Additional Information Phone Number |
800 820 0888
|
| Additional Information Email |
<span style="box-sizing: border-box; color: rgb(67, 67, 67); display: inline; flex-wrap: nowrap; font-size: 10.6667px; font-weight: 400; grid-area: auto; line-height: 12.8px; margin: 0px; overflow: visible; text-align: left; text-align-last: auto; white-space-collapse: preserve-breaks;">services@guggenheiminvestments.com</span>
|
| Additional Information Website |
<span style="box-sizing: border-box; color: rgb(67, 67, 67); display: inline; flex-wrap: nowrap; font-size: 10.6667px; font-weight: 400; grid-area: auto; line-height: 12.8px; margin: 0px; overflow: visible; text-align: left; text-align-last: auto; white-space-collapse: preserve-breaks;">GuggenheimInvestments.com/variable-insurance-funds</span>
|
| Expenses [Text Block] |
What were the Fund's costs for the last six months? * Based on a hypothetical $10,000 investment Table SummaryClass | Costs of a $10,000 Investment | Costs Paid as a % of a $10,000 Investment** |
|---|
Variable Annuity | $76 | 1.65% |
|---|
Table Summary* | Excludes expenses of the underlying funds in which the fund invests, if any. |
|---|
** | Annualized |
|---|
|
| Expenses Paid, Amount |
$ 76
|
| Factors Affecting Performance [Text Block] |
What factors materially affected the Fund's performance over the last six months? The sectors that contributed the most to the return of the underlying index were information technology, industrials, and energy. The sector that detracted the most was communication services. The holdings that contributed the most to the return of the underlying index were Flex Ltd., Lumentum Holdings, Inc., and MKS Inc. Those that detracted the most were Guidewire Software, Inc., DocuSign, Inc., and Kratos Defense & Security Solutions, Inc. The Fund maintained a daily correlation of 99% to its benchmark of -100% of the daily price movement of the S&P MidCap 400 Index. |
| Line Graph [Table Text Block] |
Table Summary | Inverse Mid-Cap Strategy Fund | S&P 500 Index | S&P MidCap 400 Index |
|---|
6/30/16 | $10,000 | $10,000 | $10,000 |
|---|
6/30/17 | $8,412 | $11,790 | $11,857 |
|---|
6/30/18 | $7,428 | $13,484 | $13,458 |
|---|
6/30/19 | $7,268 | $14,889 | $13,641 |
|---|
6/30/20 | $6,805 | $16,006 | $12,728 |
|---|
6/30/21 | $4,250 | $22,536 | $19,503 |
|---|
6/30/22 | $4,669 | $20,144 | $16,648 |
|---|
6/30/23 | $4,026 | $24,091 | $19,580 |
|---|
6/30/24 | $3,810 | $30,006 | $22,238 |
|---|
6/30/25 | $3,654 | $34,556 | $23,912 |
|---|
6/30/26 | $2,986 | $42,271 | $30,101 |
|---|
|
| AssetsNet |
$ 95,998
|
| Holdings Count | Holding |
10
|
| InvestmentCompanyPortfolioTurnover |
0.00%
|
| Additional Fund Statistics [Text Block] |
Fund Statistics as of June 30, 2026 - Net Assets$95,998
- Total Number of Portfolio Holdings10
- Portfolio Turnover Rate-%
|
| Holdings [Text Block] |
Holdings DiversificationFootnote Reference(1) (% of Net Assets) as of June 30, 2026 Table SummaryValue | Value |
|---|
OTC Equity Index Swap Agreements Sold Short | -102.3% | |
| Largest Holdings [Text Block] |
Largest HoldingsFootnote Reference(2) (% of Net Assets) as of June 30, 2026 Table SummaryGuggenheim Ultra Short Duration Fund — Institutional Class | 25.9% |
|---|
Guggenheim Ultra Short Income ETF | 4.5% |
|---|
Total | 30.4% |
|---|
|
| Material Fund Change [Text Block] |
|
| C000010425 |
|
| Shareholder Report [Line Items] |
|
| Fund Name |
NASDAQ-100<sup style="inset: 1.5px 0px 4px; box-sizing: border-box; color: rgb(83, 40, 79); display: inline; flex-wrap: nowrap; font-size: 20px; font-weight: 700; grid-area: auto; line-height: 0px; margin: 0px; overflow: visible; position: relative; text-align: left; text-align-last: auto; white-space-collapse: preserve-breaks;">®</sup> Fund
|
| Class Name |
Variable Annuity
|
| No Trading Symbol [Flag] |
true
|
| Annual or Semi-Annual Statement [Text Block] |
This semi-annual shareholder report contains important information about the NASDAQ-100® Fund for the period from January 1, 2026 to June 30, 2026.
|
| Additional Information [Text Block] |
You can find additional information about the fund at GuggenheimInvestments.com/variable-insurance-funds. You can also request this information by contacting 800 820 0888 or services@guggenheiminvestments.com.
|
| Additional Information Phone Number |
800 820 0888
|
| Additional Information Email |
<span style="box-sizing: border-box; color: rgb(67, 67, 67); display: inline; flex-wrap: nowrap; font-size: 10.6667px; font-weight: 400; grid-area: auto; line-height: 12.8px; margin: 0px; overflow: visible; text-align: left; text-align-last: auto; white-space-collapse: preserve-breaks;">services@guggenheiminvestments.com</span>
|
| Additional Information Website |
<span style="box-sizing: border-box; color: rgb(67, 67, 67); display: inline; flex-wrap: nowrap; font-size: 10.6667px; font-weight: 400; grid-area: auto; line-height: 12.8px; margin: 0px; overflow: visible; text-align: left; text-align-last: auto; white-space-collapse: preserve-breaks;">GuggenheimInvestments.com/variable-insurance-funds</span>
|
| Expenses [Text Block] |
What were the Fund's costs for the last six months? * Based on a hypothetical $10,000 investment Table SummaryClass | Costs of a $10,000 Investment | Costs Paid as a % of a $10,000 Investment** |
|---|
Variable Annuity | $90 | 1.66% |
|---|
Table Summary* | Excludes expenses of the underlying funds in which the fund invests, if any. |
|---|
** | Annualized |
|---|
|
| Expenses Paid, Amount |
$ 90
|
| Factors Affecting Performance [Text Block] |
What factors materially affected the Fund's performance over the last six months? The sectors that contributed the most to the return of the underlying index were information technology, consumer staples, and materials. Those that detracted the most were health care, consumer discretionary, and communication services. The holdings that contributed the most to the return of the underlying index were Micron Technology, Inc., Advanced Micro Devices, Inc., and Intel Corp. Those that detracted the most were Microsoft Corp., Palantir Technologies, Inc. - Class A, and Intuit, Inc. The Fund maintained a daily correlation of over 99% to its benchmark of 100% of the daily price movement of the NASDAQ-100 Index. |
| Line Graph [Table Text Block] |
Table Summary | NASDAQ-100® Fund | S&P 500 Index | NASDAQ-100 Index |
|---|
6/30/16 | $10,000 | $10,000 | $10,000 |
|---|
6/30/17 | $12,773 | $11,790 | $12,939 |
|---|
6/30/18 | $15,864 | $13,484 | $16,304 |
|---|
6/30/19 | $17,133 | $14,889 | $17,961 |
|---|
6/30/20 | $22,206 | $16,006 | $24,028 |
|---|
6/30/21 | $31,672 | $22,536 | $34,685 |
|---|
6/30/22 | $24,582 | $20,144 | $27,617 |
|---|
6/30/23 | $32,246 | $24,091 | $36,767 |
|---|
6/30/24 | $41,562 | $30,006 | $48,080 |
|---|
6/30/25 | $47,493 | $34,556 | $55,823 |
|---|
6/30/26 | $62,725 | $42,271 | $75,018 |
|---|
|
| AssetsNet |
$ 146,079,394
|
| Holdings Count | Holding |
111
|
| InvestmentCompanyPortfolioTurnover |
87.00%
|
| Additional Fund Statistics [Text Block] |
Fund Statistics as of June 30, 2026 - Net Assets$146,079,394
- Total Number of Portfolio Holdings111
- Portfolio Turnover Rate87%
|
| Holdings [Text Block] |
Holdings DiversificationFootnote Reference(1) (% of Net Assets) as of June 30, 2026 Table SummaryValue | Value |
|---|
Other | 6.0% | Consumer, Non-cyclical | 5.6% | Consumer, Cyclical | 8.4% | OTC Equity Index Swap Agreements | 10.9% | Communications | 19.2% | Technology | 49.9% | |
| Largest Holdings [Text Block] |
10 Largest HoldingsFootnote Reference(2) (% of Net Assets) as of June 30, 2026 Table SummaryNVIDIA Corp. | 6.6% |
|---|
Guggenheim Ultra Short Duration Fund — Institutional Class | 6.3% |
|---|
Apple, Inc. | 5.8% |
|---|
Guggenheim Ultra Short Income ETF | 5.0% |
|---|
Micron Technology, Inc. | 4.9% |
|---|
Microsoft Corp. | 3.8% |
|---|
Advanced Micro Devices, Inc. | 3.6% |
|---|
Amazon.com, Inc. | 3.5% |
|---|
Tesla, Inc. | 2.9% |
|---|
Alphabet, Inc. — Class A | 2.8% |
|---|
Total | 45.2% |
|---|
|
| Material Fund Change [Text Block] |
|
| C000010421 |
|
| Shareholder Report [Line Items] |
|
| Fund Name |
NASDAQ-100<sup style="inset: 1.5px 0px 4px; box-sizing: border-box; color: rgb(83, 40, 79); display: inline; flex-wrap: nowrap; font-size: 20px; font-weight: 700; grid-area: auto; line-height: 0px; margin: 0px; overflow: visible; position: relative; text-align: left; text-align-last: auto; white-space-collapse: preserve-breaks;">®</sup> 2x Strategy Fund
|
| Class Name |
Variable Annuity
|
| No Trading Symbol [Flag] |
true
|
| Annual or Semi-Annual Statement [Text Block] |
This semi-annual shareholder report contains important information about the NASDAQ-100® 2x Strategy Fund for the period from January 1, 2026 to June 30, 2026.
|
| Additional Information [Text Block] |
You can find additional information about the fund at GuggenheimInvestments.com/variable-insurance-funds. You can also request this information by contacting 800 820 0888 or services@guggenheiminvestments.com.
|
| Additional Information Phone Number |
800 820 0888
|
| Additional Information Email |
<span style="box-sizing: border-box; color: rgb(67, 67, 67); display: inline; flex-wrap: nowrap; font-size: 10.6667px; font-weight: 400; grid-area: auto; line-height: 12.8px; margin: 0px; overflow: visible; text-align: left; text-align-last: auto; white-space-collapse: preserve-breaks;">services@guggenheiminvestments.com</span>
|
| Additional Information Website |
<span style="box-sizing: border-box; color: rgb(67, 67, 67); display: inline; flex-wrap: nowrap; font-size: 10.6667px; font-weight: 400; grid-area: auto; line-height: 12.8px; margin: 0px; overflow: visible; text-align: left; text-align-last: auto; white-space-collapse: preserve-breaks;">GuggenheimInvestments.com/variable-insurance-funds</span>
|
| Expenses [Text Block] |
What were the Fund's costs for the last six months? * Based on a hypothetical $10,000 investment Table SummaryClass | Costs of a $10,000 Investment | Costs Paid as a % of a $10,000 Investment** |
|---|
Variable Annuity | $110 | 1.87% |
|---|
Table Summary* | Excludes expenses of the underlying funds in which the fund invests, if any. |
|---|
** | Annualized |
|---|
|
| Expenses Paid, Amount |
$ 110
|
| Factors Affecting Performance [Text Block] |
What factors materially affected the Fund's performance over the last six months? The sectors that contributed the most to the return of the underlying index were information technology, consumer staples, and materials. Those that detracted the most were health care, consumer discretionary, and communication services. The holdings that contributed the most to the return of the underlying index were Micron Technology, Inc., Advanced Micro Devices, Inc., and Intel Corp. Those that detracted the most were Microsoft Corp., Palantir Technologies, Inc. - Class A, and Intuit, Inc. The Fund maintained a daily correlation of over 99% to its benchmark of 200% of the daily price movement of the NASDAQ-100 Index. |
| Line Graph [Table Text Block] |
Table Summary | NASDAQ-100® 2x Strategy Fund | S&P 500 Index | NASDAQ-100 Index |
|---|
6/30/16 | $10,000 | $10,000 | $10,000 |
|---|
6/30/17 | $16,119 | $11,790 | $12,939 |
|---|
6/30/18 | $23,985 | $13,484 | $16,304 |
|---|
6/30/19 | $26,456 | $14,889 | $17,961 |
|---|
6/30/20 | $40,141 | $16,006 | $24,028 |
|---|
6/30/21 | $77,765 | $22,536 | $34,685 |
|---|
6/30/22 | $44,007 | $20,144 | $27,617 |
|---|
6/30/23 | $68,642 | $24,091 | $36,767 |
|---|
6/30/24 | $106,036 | $30,006 | $48,080 |
|---|
6/30/25 | $124,394 | $34,556 | $55,823 |
|---|
6/30/26 | $202,946 | $42,271 | $75,018 |
|---|
|
| AssetsNet |
$ 154,709,978
|
| Holdings Count | Holding |
110
|
| InvestmentCompanyPortfolioTurnover |
173.00%
|
| Additional Fund Statistics [Text Block] |
Fund Statistics as of June 30, 2026 - Net Assets$154,709,978
- Total Number of Portfolio Holdings110
- Portfolio Turnover Rate173%
|
| Holdings [Text Block] |
Holdings DiversificationFootnote Reference(1) (% of Net Assets) as of June 30, 2026 Table SummaryValue | Value |
|---|
Other | 3.9% | Consumer, Non-cyclical | 5.7% | Consumer, Cyclical | 8.6% | Equity Futures Contracts Purchased | 14.6% | Communications | 19.6% | Technology | 50.7% | OTC Equity Index Swap Agreements | 97.2% | |
| Largest Holdings [Text Block] |
10 Largest HoldingsFootnote Reference(2) (% of Net Assets) as of June 30, 2026 Table SummaryNVIDIA Corp. | 6.7% |
|---|
Apple, Inc. | 5.9% |
|---|
Micron Technology, Inc. | 5.0% |
|---|
Microsoft Corp. | 3.8% |
|---|
Advanced Micro Devices, Inc. | 3.6% |
|---|
Amazon.com, Inc. | 3.6% |
|---|
Tesla, Inc. | 2.9% |
|---|
Alphabet, Inc. — Class A | 2.9% |
|---|
Intel Corp. | 2.7% |
|---|
Alphabet, Inc. — Class C | 2.7% |
|---|
Total | 39.8% |
|---|
|
| Material Fund Change [Text Block] |
|
| C000010426 |
|
| Shareholder Report [Line Items] |
|
| Fund Name |
Inverse NASDAQ-100<sup style="inset: 1.5px 0px 4px; box-sizing: border-box; color: rgb(83, 40, 79); display: inline; flex-wrap: nowrap; font-size: 20px; font-weight: 700; grid-area: auto; line-height: 0px; margin: 0px; overflow: visible; position: relative; text-align: left; text-align-last: auto; white-space-collapse: preserve-breaks;">®</sup> Strategy Fund
|
| Class Name |
Variable Annuity
|
| No Trading Symbol [Flag] |
true
|
| Annual or Semi-Annual Statement [Text Block] |
This semi-annual shareholder report contains important information about the Inverse NASDAQ-100® Strategy Fund for the period from January 1, 2026 to June 30, 2026.
|
| Additional Information [Text Block] |
You can find additional information about the fund at GuggenheimInvestments.com/variable-insurance-funds. You can also request this information by contacting 800 820 0888 or services@guggenheiminvestments.com.
|
| Additional Information Phone Number |
800 820 0888
|
| Additional Information Email |
<span style="box-sizing: border-box; color: rgb(67, 67, 67); display: inline; flex-wrap: nowrap; font-size: 10.6667px; font-weight: 400; grid-area: auto; line-height: 12.8px; margin: 0px; overflow: visible; text-align: left; text-align-last: auto; white-space-collapse: preserve-breaks;">services@guggenheiminvestments.com</span>
|
| Additional Information Website |
<span style="box-sizing: border-box; color: rgb(67, 67, 67); display: inline; flex-wrap: nowrap; font-size: 10.6667px; font-weight: 400; grid-area: auto; line-height: 12.8px; margin: 0px; overflow: visible; text-align: left; text-align-last: auto; white-space-collapse: preserve-breaks;">GuggenheimInvestments.com/variable-insurance-funds</span>
|
| Expenses [Text Block] |
What were the Fund's costs for the last six months? * Based on a hypothetical $10,000 investment Table SummaryClass | Costs of a $10,000 Investment | Costs Paid as a % of a $10,000 Investment** |
|---|
Variable Annuity | $77 | 1.70% |
|---|
Table Summary* | Excludes expenses of the underlying funds in which the fund invests, if any. |
|---|
** | Annualized |
|---|
|
| Expenses Paid, Amount |
$ 77
|
| Factors Affecting Performance [Text Block] |
What factors materially affected the Fund's performance over the last six months? The sectors that contributed the most to the return of the underlying index were information technology, consumer staples, and materials. Those that detracted the most were health care, consumer discretionary, and communication services. The holdings that contributed the most to the return of the underlying index were Micron Technology, Inc., Advanced Micro Devices, Inc., and Intel Corp. Those that detracted the most were Microsoft Corp., Palantir Technologies, Inc. - Class A, and Intuit, Inc. The Fund maintained a daily correlation of over 99% to its benchmark of -100% of the daily price movement of the NASDAQ-100 Index. |
| Line Graph [Table Text Block] |
Table Summary | Inverse NASDAQ-100® Strategy Fund | S&P 500 Index | NASDAQ-100 Index |
|---|
6/30/16 | $10,000 | $10,000 | $10,000 |
|---|
6/30/17 | $7,723 | $11,790 | $12,939 |
|---|
6/30/18 | $6,057 | $13,484 | $16,304 |
|---|
6/30/19 | $5,421 | $14,889 | $17,961 |
|---|
6/30/20 | $3,659 | $16,006 | $24,028 |
|---|
6/30/21 | $2,521 | $22,536 | $34,685 |
|---|
6/30/22 | $2,896 | $20,144 | $27,617 |
|---|
6/30/23 | $2,165 | $24,091 | $36,767 |
|---|
6/30/24 | $1,778 | $30,006 | $48,080 |
|---|
6/30/25 | $1,547 | $34,556 | $55,823 |
|---|
6/30/26 | $1,176 | $42,271 | $75,018 |
|---|
|
| AssetsNet |
$ 902,247
|
| Holdings Count | Holding |
10
|
| InvestmentCompanyPortfolioTurnover |
0.00%
|
| Additional Fund Statistics [Text Block] |
Fund Statistics as of June 30, 2026 - Net Assets$902,247
- Total Number of Portfolio Holdings10
- Portfolio Turnover Rate-%
|
| Holdings [Text Block] |
Holdings DiversificationFootnote Reference(1) (% of Net Assets) as of June 30, 2026 Table SummaryValue | Value |
|---|
OTC Equity Index Swap Agreements Sold Short | -98.4% | |
| Largest Holdings [Text Block] |
Largest HoldingsFootnote Reference(2) (% of Net Assets) as of June 30, 2026 Table SummaryGuggenheim Ultra Short Duration Fund — Institutional Class | 13.2% |
|---|
Guggenheim Ultra Short Income ETF | 3.9% |
|---|
Total | 17.1% |
|---|
|
| Material Fund Change [Text Block] |
|
| C000010397 |
|
| Shareholder Report [Line Items] |
|
| Fund Name |
Russell 2000<sup style="inset: 1.5px 0px 4px; box-sizing: border-box; color: rgb(83, 40, 79); display: inline; flex-wrap: nowrap; font-size: 20px; font-weight: 700; grid-area: auto; line-height: 0px; margin: 0px; overflow: visible; position: relative; text-align: left; text-align-last: auto; white-space-collapse: preserve-breaks;">®</sup> 1.5x Strategy Fund
|
| Class Name |
Variable Annuity
|
| No Trading Symbol [Flag] |
true
|
| Annual or Semi-Annual Statement [Text Block] |
This semi-annual shareholder report contains important information about the Russell 2000® 1.5x Strategy Fund for the period from January 1, 2026 to June 30, 2026.
|
| Additional Information [Text Block] |
You can find additional information about the fund at GuggenheimInvestments.com/variable-insurance-funds. You can also request this information by contacting 800 820 0888 or services@guggenheiminvestments.com.
|
| Additional Information Phone Number |
800 820 0888
|
| Additional Information Email |
<span style="box-sizing: border-box; color: rgb(67, 67, 67); display: inline; flex-wrap: nowrap; font-size: 10.6667px; font-weight: 400; grid-area: auto; line-height: 12.8px; margin: 0px; overflow: visible; text-align: left; text-align-last: auto; white-space-collapse: preserve-breaks;">services@guggenheiminvestments.com</span>
|
| Additional Information Website |
<span style="box-sizing: border-box; color: rgb(67, 67, 67); display: inline; flex-wrap: nowrap; font-size: 10.6667px; font-weight: 400; grid-area: auto; line-height: 12.8px; margin: 0px; overflow: visible; text-align: left; text-align-last: auto; white-space-collapse: preserve-breaks;">GuggenheimInvestments.com/variable-insurance-funds</span>
|
| Expenses [Text Block] |
What were the Fund's costs for the last six months? * Based on a hypothetical $10,000 investment Table SummaryClass | Costs of a $10,000 Investment | Costs Paid as a % of a $10,000 Investment** |
|---|
Variable Annuity | $100 | 1.74% |
|---|
Table Summary* | Excludes expenses of the underlying funds in which the fund invests, if any. |
|---|
** | Annualized |
|---|
|
| Expenses Paid, Amount |
$ 100
|
| Factors Affecting Performance [Text Block] |
What factors materially affected the Fund's performance over the last six months? The sectors that contributed the most to the return of the underlying index were information technology, industrials, and health care. No sectors detracted from performance. The holdings that contributed the most to the return of the underlying index were Bloom Energy Corp. - Class A, Credo Technology Group Holding Ltd., and Sterling Infrastructure, Inc. Those that detracted the most were Kratos Defense & Security Solutions, Inc., AeroVironment, Inc., and Verra Mobility Corp. - Class A. The Fund maintained a daily correlation of over 99% to its benchmark of 150% of the daily price movement of the Russell 2000 Index. |
| Line Graph [Table Text Block] |
Table Summary | Russell 2000® 1.5x Strategy Fund | S&P 500 Index | Russell 2000 Index |
|---|
6/30/16 | $10,000 | $10,000 | $10,000 |
|---|
6/30/17 | $13,644 | $11,790 | $12,460 |
|---|
6/30/18 | $16,868 | $13,484 | $14,649 |
|---|
6/30/19 | $15,350 | $14,889 | $14,164 |
|---|
6/30/20 | $12,583 | $16,006 | $13,226 |
|---|
6/30/21 | $25,182 | $22,536 | $21,429 |
|---|
6/30/22 | $15,494 | $20,144 | $16,029 |
|---|
6/30/23 | $17,413 | $24,091 | $18,002 |
|---|
6/30/24 | $19,048 | $30,006 | $19,812 |
|---|
6/30/25 | $19,908 | $34,556 | $21,334 |
|---|
6/30/26 | $31,406 | $42,271 | $30,034 |
|---|
|
| AssetsNet |
$ 5,712,336
|
| Holdings Count | Holding |
1,981
|
| InvestmentCompanyPortfolioTurnover |
8.00%
|
| Additional Fund Statistics [Text Block] |
Fund Statistics as of June 30, 2026 - Net Assets$5,712,336
- Total Number of Portfolio Holdings1,981
- Portfolio Turnover Rate8%
|
| Holdings [Text Block] |
Holdings DiversificationFootnote Reference(1) (% of Net Assets) as of June 30, 2026 Table SummaryValue | Value |
|---|
Other | 16.0% | Exchange-Traded Funds | 19.8% | Equity Futures Contracts Purchased | 26.7% | OTC Equity Index Swap Agreements | 87.1% | |
| Largest Holdings [Text Block] |
10 Largest HoldingsFootnote Reference(2) (% of Net Assets) as of June 30, 2026 Table SummaryVanguard Russell 2000 ETF | 9.9% |
|---|
iShares Russell 2000 Index ETF | 9.9% |
|---|
Guggenheim Ultra Short Income ETF | 3.0% |
|---|
Guggenheim Ultra Short Duration Fund — Institutional Class | 3.0% |
|---|
Moog, Inc. — Class A | 0.1% |
|---|
Hut 8 Corp. | 0.1% |
|---|
Cytokinetics, Inc. | 0.1% |
|---|
Viasat, Inc. | 0.1% |
|---|
BrightSpring Health Services, Inc. | 0.1% |
|---|
MaxLinear, Inc. | 0.1% |
|---|
Total | 26.4% |
|---|
|
| Material Fund Change [Text Block] |
|
| C000032290 |
|
| Shareholder Report [Line Items] |
|
| Fund Name |
Russell 2000<sup style="inset: 1.5px 0px 4px; box-sizing: border-box; color: rgb(83, 40, 79); display: inline; flex-wrap: nowrap; font-size: 20px; font-weight: 700; grid-area: auto; line-height: 0px; margin: 0px; overflow: visible; position: relative; text-align: left; text-align-last: auto; white-space-collapse: preserve-breaks;">®</sup> 2x Strategy Fund
|
| Class Name |
Variable Annuity
|
| No Trading Symbol [Flag] |
true
|
| Annual or Semi-Annual Statement [Text Block] |
This semi-annual shareholder report contains important information about the Russell 2000® 2x Strategy Fund for the period from January 1, 2026 to June 30, 2026.
|
| Additional Information [Text Block] |
You can find additional information about the fund at GuggenheimInvestments.com/variable-insurance-funds. You can also request this information by contacting 800 820 0888 or services@guggenheiminvestments.com.
|
| Additional Information Phone Number |
800 820 0888
|
| Additional Information Email |
<span style="box-sizing: border-box; color: rgb(67, 67, 67); display: inline; flex-wrap: nowrap; font-size: 10.6667px; font-weight: 400; grid-area: auto; line-height: 12.8px; margin: 0px; overflow: visible; text-align: left; text-align-last: auto; white-space-collapse: preserve-breaks;">services@guggenheiminvestments.com</span>
|
| Additional Information Website |
<span style="box-sizing: border-box; color: rgb(67, 67, 67); display: inline; flex-wrap: nowrap; font-size: 10.6667px; font-weight: 400; grid-area: auto; line-height: 12.8px; margin: 0px; overflow: visible; text-align: left; text-align-last: auto; white-space-collapse: preserve-breaks;">GuggenheimInvestments.com/variable-insurance-funds</span>
|
| Expenses [Text Block] |
What were the Fund's costs for the last six months? * Based on a hypothetical $10,000 investment Table SummaryClass | Costs of a $10,000 Investment | Costs Paid as a % of a $10,000 Investment** |
|---|
Variable Annuity | $115 | 1.92% |
|---|
Table Summary* | Excludes expenses of the underlying funds in which the fund invests, if any. |
|---|
** | Annualized |
|---|
|
| Expenses Paid, Amount |
$ 115
|
| Factors Affecting Performance [Text Block] |
What factors materially affected the Fund's performance over the last six months? The sectors that contributed the most to the return of the underlying index were information technology, industrials, and health care. No sectors detracted from performance. The holdings that contributed the most to the return of the underlying index were Bloom Energy Corp.- Class A, Credo Technology Group Holding Ltd., and Sterling Infrastructure, Inc. Those that detracted the most were Kratos Defense & Security Solutions, Inc., AeroVironment, Inc., and Verra Mobility Corp.- Class A. The Fund maintained a daily correlation of over 99% to its benchmark of 200% of the daily price movement of the Russell 2000 Index. |
| Line Graph [Table Text Block] |
Table Summary | Russell 2000® 2x Strategy Fund | S&P 500 Index | Russell 2000 Index |
|---|
6/30/16 | $10,000 | $10,000 | $10,000 |
|---|
6/30/17 | $14,755 | $11,790 | $12,460 |
|---|
6/30/18 | $19,418 | $13,484 | $14,649 |
|---|
6/30/19 | $16,819 | $14,889 | $14,164 |
|---|
6/30/20 | $11,908 | $16,006 | $13,226 |
|---|
6/30/21 | $29,354 | $22,536 | $21,429 |
|---|
6/30/22 | $15,510 | $20,144 | $16,029 |
|---|
6/30/23 | $17,352 | $24,091 | $18,002 |
|---|
6/30/24 | $18,718 | $30,006 | $19,812 |
|---|
6/30/25 | $18,850 | $34,556 | $21,334 |
|---|
6/30/26 | $33,593 | $42,271 | $30,034 |
|---|
|
| AssetsNet |
$ 3,396,312
|
| Holdings Count | Holding |
13
|
| InvestmentCompanyPortfolioTurnover |
0.00%
|
| Additional Fund Statistics [Text Block] |
Fund Statistics as of June 30, 2026 - Net Assets$3,396,312
- Total Number of Portfolio Holdings13
- Portfolio Turnover Rate-%
|
| Holdings [Text Block] |
Holdings DiversificationFootnote Reference(1) (% of Net Assets) as of June 30, 2026 Table SummaryValue | Value |
|---|
Exchange-Traded Funds | 16.5% | Equity Futures Contracts Purchased | 26.9% | OTC Equity Index Swap Agreements | 155.4% | |
| Largest Holdings [Text Block] |
Largest HoldingsFootnote Reference(2) (% of Net Assets) as of June 30, 2026 Table SummaryVanguard Russell 2000 ETF | 8.3% |
|---|
iShares Russell 2000 Index ETF | 8.2% |
|---|
Total | 16.5% |
|---|
|
| Material Fund Change [Text Block] |
|
| C000010415 |
|
| Shareholder Report [Line Items] |
|
| Fund Name |
Inverse Russell 2000<sup style="inset: 1.5px 0px 4px; box-sizing: border-box; color: rgb(83, 40, 79); display: inline; flex-wrap: nowrap; font-size: 20px; font-weight: 700; grid-area: auto; line-height: 0px; margin: 0px; overflow: visible; position: relative; text-align: left; text-align-last: auto; white-space-collapse: preserve-breaks;">®</sup> Strategy Fund
|
| Class Name |
Variable Annuity
|
| No Trading Symbol [Flag] |
true
|
| Annual or Semi-Annual Statement [Text Block] |
This semi-annual shareholder report contains important information about the Inverse Russell 2000® Strategy Fund for the period from January 1, 2026 to June 30, 2026.
|
| Additional Information [Text Block] |
You can find additional information about the fund at GuggenheimInvestments.com/variable-insurance-funds. You can also request this information by contacting 800 820 0888 or services@guggenheiminvestments.com.
|
| Additional Information Phone Number |
800 820 0888
|
| Additional Information Email |
<span style="box-sizing: border-box; color: rgb(67, 67, 67); display: inline; flex-wrap: nowrap; font-size: 10.6667px; font-weight: 400; grid-area: auto; line-height: 12.8px; margin: 0px; overflow: visible; text-align: left; text-align-last: auto; white-space-collapse: preserve-breaks;">services@guggenheiminvestments.com</span>
|
| Additional Information Website |
<span style="box-sizing: border-box; color: rgb(67, 67, 67); display: inline; flex-wrap: nowrap; font-size: 10.6667px; font-weight: 400; grid-area: auto; line-height: 12.8px; margin: 0px; overflow: visible; text-align: left; text-align-last: auto; white-space-collapse: preserve-breaks;">GuggenheimInvestments.com/variable-insurance-funds</span>
|
| Expenses [Text Block] |
What were the Fund's costs for the last six months? * Based on a hypothetical $10,000 investment Table SummaryClass | Costs of a $10,000 Investment | Costs Paid as a % of a $10,000 Investment** |
|---|
Variable Annuity | $76 | 1.69% |
|---|
Table Summary* | Excludes expenses of the underlying funds in which the fund invests, if any. |
|---|
** | Annualized |
|---|
|
| Expenses Paid, Amount |
$ 76
|
| Factors Affecting Performance [Text Block] |
What factors materially affected the Fund's performance over the last six months? The sectors that contributed the most to the return of the underlying index were information technology, industrials, and health care. No sectors detracted from performance. The holdings that contributed the most to the return of the underlying index were Bloom Energy Corp. - Class A, Credo Technology Group Holding Ltd., and Sterling Infrastructure, Inc. Those that detracted the most were Kratos Defense & Security Solutions, Inc., AeroVironment, Inc., and Verra Mobility Corp. - Class A. The Fund maintained a daily correlation of over 99% to its benchmark of -100% of the daily price movement of the Russell 2000 Index. |
| Line Graph [Table Text Block] |
Table Summary | Inverse Russell 2000® Strategy Fund | S&P 500 Index | Russell 2000 Index |
|---|
6/30/16 | $10,000 | $10,000 | $10,000 |
|---|
6/30/17 | $7,861 | $11,790 | $12,460 |
|---|
6/30/18 | $6,655 | $13,484 | $14,649 |
|---|
6/30/19 | $6,829 | $14,889 | $14,164 |
|---|
6/30/20 | $6,238 | $16,006 | $13,226 |
|---|
6/30/21 | $3,610 | $22,536 | $21,429 |
|---|
6/30/22 | $4,440 | $20,144 | $16,029 |
|---|
6/30/23 | $3,942 | $24,091 | $18,002 |
|---|
6/30/24 | $3,779 | $30,006 | $19,812 |
|---|
6/30/25 | $3,603 | $34,556 | $21,334 |
|---|
6/30/26 | $2,601 | $42,271 | $30,034 |
|---|
|
| AssetsNet |
$ 136,328
|
| Holdings Count | Holding |
10
|
| InvestmentCompanyPortfolioTurnover |
0.00%
|
| Additional Fund Statistics [Text Block] |
Fund Statistics as of June 30, 2026 - Net Assets$136,328
- Total Number of Portfolio Holdings10
- Portfolio Turnover Rate-%
|
| Holdings [Text Block] |
Holdings DiversificationFootnote Reference(1) (% of Net Assets) as of June 30, 2026 Table SummaryValue | Value |
|---|
OTC Equity Index Swap Agreements Sold Short | -98.8% | |
| Largest Holdings [Text Block] |
Largest HoldingsFootnote Reference(2) (% of Net Assets) as of June 30, 2026 Table SummaryGuggenheim Ultra Short Duration Fund — Institutional Class | 35.3% |
|---|
Guggenheim Ultra Short Income ETF | 4.2% |
|---|
Total | 39.5% |
|---|
|
| Material Fund Change [Text Block] |
|
| C000010401 |
|
| Shareholder Report [Line Items] |
|
| Fund Name |
Nova Fund
|
| Class Name |
Variable Annuity
|
| No Trading Symbol [Flag] |
true
|
| Annual or Semi-Annual Statement [Text Block] |
This semi-annual shareholder report contains important information about the Nova Fund for the period from January 1, 2026 to June 30, 2026.
|
| Additional Information [Text Block] |
You can find additional information about the fund at GuggenheimInvestments.com/variable-insurance-funds. You can also request this information by contacting 800 820 0888 or services@guggenheiminvestments.com.
|
| Additional Information Phone Number |
800 820 0888
|
| Additional Information Email |
<span style="box-sizing: border-box; color: rgb(67, 67, 67); display: inline; flex-wrap: nowrap; font-size: 10.6667px; font-weight: 400; grid-area: auto; line-height: 12.8px; margin: 0px; overflow: visible; text-align: left; text-align-last: auto; white-space-collapse: preserve-breaks;">services@guggenheiminvestments.com</span>
|
| Additional Information Website |
<span style="box-sizing: border-box; color: rgb(67, 67, 67); display: inline; flex-wrap: nowrap; font-size: 10.6667px; font-weight: 400; grid-area: auto; line-height: 12.8px; margin: 0px; overflow: visible; text-align: left; text-align-last: auto; white-space-collapse: preserve-breaks;">GuggenheimInvestments.com/variable-insurance-funds</span>
|
| Expenses [Text Block] |
What were the Fund's costs for the last six months? * Based on a hypothetical $10,000 investment Table SummaryClass | Costs of a $10,000 Investment | Costs Paid as a % of a $10,000 Investment** |
|---|
Variable Annuity | $86 | 1.63% |
|---|
Table Summary* | Excludes expenses of the underlying funds in which the fund invests, if any. |
|---|
** | Annualized |
|---|
|
| Expenses Paid, Amount |
$ 86
|
| Factors Affecting Performance [Text Block] |
What factors materially affected the Fund's performance over the last six months? The sectors that contributed the most to the return of the underlying index were information technology, industrials, and energy. Those that detracted the most were financials and consumer discretionary. The holdings that contributed the most to the return of the underlying index were Micron Technology, Inc., Advanced Micro Devices, Inc., and Intel Corp. Those that detracted the most were Microsoft Corp., Meta Platforms Inc. - Class A, and Palantir Technologies Inc. - Class A. The Fund maintained a daily correlation of over 99% to its benchmark of 150% of the daily price movement of the S&P 500 Index. |
| Line Graph [Table Text Block] |
Table Summary | Nova Fund | S&P 500 Index |
|---|
6/30/16 | $10,000 | $10,000 |
|---|
6/30/17 | $12,576 | $11,790 |
|---|
6/30/18 | $14,938 | $13,484 |
|---|
6/30/19 | $16,600 | $14,889 |
|---|
6/30/20 | $17,105 | $16,006 |
|---|
6/30/21 | $27,898 | $22,536 |
|---|
6/30/22 | $22,557 | $20,144 |
|---|
6/30/23 | $27,941 | $24,091 |
|---|
6/30/24 | $36,950 | $30,006 |
|---|
6/30/25 | $43,009 | $34,556 |
|---|
6/30/26 | $55,471 | $42,271 |
|---|
|
| AssetsNet |
$ 50,601,983
|
| Holdings Count | Holding |
512
|
| InvestmentCompanyPortfolioTurnover |
226.00%
|
| Additional Fund Statistics [Text Block] |
Fund Statistics as of June 30, 2026 - Net Assets$50,601,983
- Total Number of Portfolio Holdings512
- Portfolio Turnover Rate226%
|
| Holdings [Text Block] |
Holdings DiversificationFootnote Reference(1) (% of Net Assets) as of June 30, 2026 Table SummaryValue | Value |
|---|
Other | 5.5% | Consumer, Cyclical | 6.1% | Industrial | 7.1% | Financial | 10.5% | Consumer, Non-cyclical | 10.6% | Communications | 13.3% | Equity Futures Contracts Purchased | 14.9% | Technology | 28.8% | OTC Equity Index Swap Agreements | 53.0% | |
| Largest Holdings [Text Block] |
10 Largest HoldingsFootnote Reference(2) (% of Net Assets) as of June 30, 2026 Table SummaryNVIDIA Corp. | 6.2% |
|---|
Apple, Inc. | 5.4% |
|---|
Guggenheim Ultra Short Duration Fund — Institutional Class | 4.0% |
|---|
Microsoft Corp. | 3.5% |
|---|
Guggenheim Ultra Short Income ETF | 3.2% |
|---|
Amazon.com, Inc. | 3.0% |
|---|
Alphabet, Inc. — Class A | 2.7% |
|---|
Broadcom, Inc. | 2.3% |
|---|
Alphabet, Inc. — Class C | 2.1% |
|---|
Micron Technology, Inc. | 1.7% |
|---|
Total | 34.1% |
|---|
|
| Material Fund Change [Text Block] |
|
| C000010420 |
|
| Shareholder Report [Line Items] |
|
| Fund Name |
S&P 500<sup style="inset: 1.5px 0px 4px; box-sizing: border-box; color: rgb(83, 40, 79); display: inline; flex-wrap: nowrap; font-size: 20px; font-weight: 700; grid-area: auto; line-height: 0px; margin: 0px; overflow: visible; position: relative; text-align: left; text-align-last: auto; white-space-collapse: preserve-breaks;">®</sup> 2x Strategy Fund
|
| Class Name |
Variable Annuity
|
| No Trading Symbol [Flag] |
true
|
| Annual or Semi-Annual Statement [Text Block] |
This semi-annual shareholder report contains important information about the S&P 500® 2x Strategy Fund for the period from January 1, 2026 to June 30, 2026.
|
| Additional Information [Text Block] |
You can find additional information about the fund at GuggenheimInvestments.com/variable-insurance-funds. You can also request this information by contacting 800 820 0888 or services@guggenheiminvestments.com.
|
| Additional Information Phone Number |
800 820 0888
|
| Additional Information Email |
<span style="box-sizing: border-box; color: rgb(67, 67, 67); display: inline; flex-wrap: nowrap; font-size: 10.6667px; font-weight: 400; grid-area: auto; line-height: 12.8px; margin: 0px; overflow: visible; text-align: left; text-align-last: auto; white-space-collapse: preserve-breaks;">services@guggenheiminvestments.com</span>
|
| Additional Information Website |
<span style="box-sizing: border-box; color: rgb(67, 67, 67); display: inline; flex-wrap: nowrap; font-size: 10.6667px; font-weight: 400; grid-area: auto; line-height: 12.8px; margin: 0px; overflow: visible; text-align: left; text-align-last: auto; white-space-collapse: preserve-breaks;">GuggenheimInvestments.com/variable-insurance-funds</span>
|
| Expenses [Text Block] |
What were the Fund's costs for the last six months? * Based on a hypothetical $10,000 investment Table SummaryClass | Costs of a $10,000 Investment | Costs Paid as a % of a $10,000 Investment** |
|---|
Variable Annuity | $97 | 1.80% |
|---|
Table Summary* | Excludes expenses of the underlying funds in which the fund invests, if any. |
|---|
** | Annualized |
|---|
|
| Expenses Paid, Amount |
$ 97
|
| Factors Affecting Performance [Text Block] |
What factors materially affected the Fund's performance over the last six months? The sectors that contributed the most to the return of the underlying index were information technology, industrials, and energy. Those that detracted the most were financials and consumer discretionary. The holdings that contributed the most to the return of the underlying index were Micron Technology, Inc., Advanced Micro Devices, Inc., and Intel Corp. Those that detracted the most were Microsoft Corp., Meta Platforms, Inc. - Class A, and Palantir Technologies, Inc. - Class A. The Fund maintained a daily correlation of over 99% to its benchmark of 200% of the daily price movement of the S&P 500 Index. |
| Line Graph [Table Text Block] |
Table Summary | S&P 500® 2x Strategy Fund | S&P 500 Index |
|---|
6/30/16 | $10,000 | $10,000 |
|---|
6/30/17 | $13,475 | $11,790 |
|---|
6/30/18 | $16,709 | $13,484 |
|---|
6/30/19 | $18,936 | $14,889 |
|---|
6/30/20 | $18,357 | $16,006 |
|---|
6/30/21 | $34,681 | $22,536 |
|---|
6/30/22 | $25,675 | $20,144 |
|---|
6/30/23 | $33,167 | $24,091 |
|---|
6/30/24 | $46,929 | $30,006 |
|---|
6/30/25 | $55,616 | $34,556 |
|---|
6/30/26 | $76,594 | $42,271 |
|---|
|
| AssetsNet |
$ 128,034,830
|
| Holdings Count | Holding |
513
|
| InvestmentCompanyPortfolioTurnover |
34.00%
|
| Additional Fund Statistics [Text Block] |
Fund Statistics as of June 30, 2026 - Net Assets$128,034,830
- Total Number of Portfolio Holdings513
- Portfolio Turnover Rate34%
|
| Holdings [Text Block] |
Holdings DiversificationFootnote Reference(1) (% of Net Assets) as of June 30, 2026 Table SummaryValue | Value |
|---|
Other | 6.0% | Consumer, Cyclical | 6.7% | Industrial | 7.7% | Financial | 11.4% | Consumer, Non-cyclical | 11.5% | Communications | 14.5% | Equity Futures Contracts Purchased | 20.9% | Technology | 31.4% | OTC Equity Index Swap Agreements | 89.9% | |
| Largest Holdings [Text Block] |
10 Largest HoldingsFootnote Reference(2) (% of Net Assets) as of June 30, 2026 Table SummaryNVIDIA Corp. | 6.7% |
|---|
Apple, Inc. | 5.9% |
|---|
Microsoft Corp. | 3.8% |
|---|
Amazon.com, Inc. | 3.2% |
|---|
Alphabet, Inc. — Class A | 2.9% |
|---|
Broadcom, Inc. | 2.5% |
|---|
Alphabet, Inc. — Class C | 2.3% |
|---|
Micron Technology, Inc. | 1.8% |
|---|
Meta Platforms, Inc. — Class A | 1.7% |
|---|
Tesla, Inc. | 1.6% |
|---|
Total | 32.4% |
|---|
|
| Material Fund Change [Text Block] |
|
| C000010423 |
|
| Shareholder Report [Line Items] |
|
| Fund Name |
Inverse S&P 500<sup style="inset: 1.5px 0px 4px; box-sizing: border-box; color: rgb(83, 40, 79); display: inline; flex-wrap: nowrap; font-size: 20px; font-weight: 700; grid-area: auto; line-height: 0px; margin: 0px; overflow: visible; position: relative; text-align: left; text-align-last: auto; white-space-collapse: preserve-breaks;">®</sup> Strategy Fund
|
| Class Name |
Variable Annuity
|
| No Trading Symbol [Flag] |
true
|
| Annual or Semi-Annual Statement [Text Block] |
This semi-annual shareholder report contains important information about the Inverse S&P 500® Strategy Fund for the period from January 1, 2026 to June 30, 2026.
|
| Additional Information [Text Block] |
You can find additional information about the fund at GuggenheimInvestments.com/variable-insurance-funds. You can also request this information by contacting 800 820 0888 or services@guggenheiminvestments.com.
|
| Additional Information Phone Number |
800 820 0888
|
| Additional Information Email |
<span style="box-sizing: border-box; color: rgb(67, 67, 67); display: inline; flex-wrap: nowrap; font-size: 10.6667px; font-weight: 400; grid-area: auto; line-height: 12.8px; margin: 0px; overflow: visible; text-align: left; text-align-last: auto; white-space-collapse: preserve-breaks;">services@guggenheiminvestments.com</span>
|
| Additional Information Website |
<span style="box-sizing: border-box; color: rgb(67, 67, 67); display: inline; flex-wrap: nowrap; font-size: 10.6667px; font-weight: 400; grid-area: auto; line-height: 12.8px; margin: 0px; overflow: visible; text-align: left; text-align-last: auto; white-space-collapse: preserve-breaks;">GuggenheimInvestments.com/variable-insurance-funds</span>
|
| Expenses [Text Block] |
What were the Fund's costs for the last six months? * Based on a hypothetical $10,000 investment Table SummaryClass | Costs of a $10,000 Investment | Costs Paid as a % of a $10,000 Investment** |
|---|
Variable Annuity | $81 | 1.70% |
|---|
Table Summary* | Excludes expenses of the underlying funds in which the fund invests, if any. |
|---|
** | Annualized |
|---|
|
| Expenses Paid, Amount |
$ 81
|
| Factors Affecting Performance [Text Block] |
What factors materially affected the Fund's performance over the last six months? The sectors that contributed the most to the return of the underlying index were information technology, industrials, and energy. Those that detracted the most were financials and consumer discretionary. The holdings that contributed the most to the return of the underlying index were Micron Technology, Inc., Advanced Micro Devices, Inc., and Intel Corp. Those that detracted the most were Microsoft Corp., Meta Platforms, Inc. - Class A, and Palantir Technologies Inc. - Class A. The Fund maintained a daily correlation of over 99% to its benchmark of -100% of the daily price movement of the S&P 500 Index. |
| Line Graph [Table Text Block] |
Table Summary | Inverse S&P 500® Strategy Fund | S&P 500 Index |
|---|
6/30/16 | $10,000 | $10,000 |
|---|
6/30/17 | $8,490 | $11,790 |
|---|
6/30/18 | $7,443 | $13,484 |
|---|
6/30/19 | $6,773 | $14,889 |
|---|
6/30/20 | $5,699 | $16,006 |
|---|
6/30/21 | $3,964 | $22,536 |
|---|
6/30/22 | $4,170 | $20,144 |
|---|
6/30/23 | $3,576 | $24,091 |
|---|
6/30/24 | $3,121 | $30,006 |
|---|
6/30/25 | $2,851 | $34,556 |
|---|
6/30/26 | $2,443 | $42,271 |
|---|
|
| AssetsNet |
$ 1,951,342
|
| Holdings Count | Holding |
10
|
| InvestmentCompanyPortfolioTurnover |
0.00%
|
| Additional Fund Statistics [Text Block] |
Fund Statistics as of June 30, 2026 - Net Assets$1,951,342
- Total Number of Portfolio Holdings10
- Portfolio Turnover Rate-%
|
| Holdings [Text Block] |
Holdings DiversificationFootnote Reference(1) (% of Net Assets) as of June 30, 2026 Table SummaryValue | Value |
|---|
OTC Equity Index Swap Agreements Sold Short | -100.0% | |
| Largest Holdings [Text Block] |
Largest HoldingsFootnote Reference(2) (% of Net Assets) as of June 30, 2026 Table SummaryGuggenheim Ultra Short Duration Fund — Institutional Class | 6.0% |
|---|
Guggenheim Ultra Short Income ETF | 4.6% |
|---|
Total | 10.6% |
|---|
|
| Material Fund Change [Text Block] |
|
| C000010408 |
|
| Shareholder Report [Line Items] |
|
| Fund Name |
S&P 500<sup style="inset: 1.5px 0px 4px; box-sizing: border-box; color: rgb(83, 40, 79); display: inline; flex-wrap: nowrap; font-size: 20px; font-weight: 700; grid-area: auto; line-height: 0px; margin: 0px; overflow: visible; position: relative; text-align: left; text-align-last: auto; white-space-collapse: preserve-breaks;">®</sup> Pure Growth Fund
|
| Class Name |
Variable Annuity
|
| No Trading Symbol [Flag] |
true
|
| Annual or Semi-Annual Statement [Text Block] |
This semi-annual shareholder report contains important information about the S&P 500® Pure Growth Fund for the period from January 1, 2026 to June 30, 2026.
|
| Additional Information [Text Block] |
You can find additional information about the fund at GuggenheimInvestments.com/variable-insurance-funds. You can also request this information by contacting 800 820 0888 or services@guggenheiminvestments.com.
|
| Additional Information Phone Number |
800 820 0888
|
| Additional Information Email |
<span style="box-sizing: border-box; color: rgb(67, 67, 67); display: inline; flex-wrap: nowrap; font-size: 10.6667px; font-weight: 400; grid-area: auto; line-height: 12.8px; margin: 0px; overflow: visible; text-align: left; text-align-last: auto; white-space-collapse: preserve-breaks;">services@guggenheiminvestments.com</span>
|
| Additional Information Website |
<span style="box-sizing: border-box; color: rgb(67, 67, 67); display: inline; flex-wrap: nowrap; font-size: 10.6667px; font-weight: 400; grid-area: auto; line-height: 12.8px; margin: 0px; overflow: visible; text-align: left; text-align-last: auto; white-space-collapse: preserve-breaks;">GuggenheimInvestments.com/variable-insurance-funds</span>
|
| Expenses [Text Block] |
What were the Fund's costs for the last six months? * Based on a hypothetical $10,000 investment Table SummaryClass | Costs of a $10,000 Investment | Costs Paid as a % of a $10,000 Investment** |
|---|
Variable Annuity | $94 | 1.60% |
|---|
Table Summary* | Excludes expenses of the underlying funds in which the fund invests, if any. |
|---|
** | Annualized |
|---|
|
| Expenses Paid, Amount |
$ 94
|
| Factors Affecting Performance [Text Block] |
What factors materially affected the Fund's performance over the last six months? The sectors that contributed the most to the return of the underlying index for the reporting period were information technology, industrials, and consumer staples. The sectors that detracted the most were health care, consumer discretionary, and communication services. The holdings that contributed the most to the return of the underlying index for the reporting period were Sandisk Corp., Micron Technology, Inc., and Comfort Systems USA, Inc. Those that detracted the most were AppLovin Corp.- Class A, Palantir Technologies Inc.- Class A, and Insulet Corp. The Fund maintained a daily correlation of over 99% to the S&P 500 Pure Growth Index for the reporting period. |
| Line Graph [Table Text Block] |
Table Summary | S&P 500® Pure Growth Fund | S&P 500 Index | S&P 500 Pure Growth Index |
|---|
6/30/16 | $10,000 | $10,000 | $10,000 |
|---|
6/30/17 | $11,534 | $11,790 | $11,735 |
|---|
6/30/18 | $13,912 | $13,484 | $14,411 |
|---|
6/30/19 | $14,396 | $14,889 | $15,164 |
|---|
6/30/20 | $15,547 | $16,006 | $16,665 |
|---|
6/30/21 | $21,801 | $22,536 | $23,805 |
|---|
6/30/22 | $17,307 | $20,144 | $19,189 |
|---|
6/30/23 | $17,913 | $24,091 | $20,189 |
|---|
6/30/24 | $21,721 | $30,006 | $24,922 |
|---|
6/30/25 | $26,430 | $34,556 | $30,843 |
|---|
6/30/26 | $36,420 | $42,271 | $43,266 |
|---|
|
| AssetsNet |
$ 37,630,332
|
| Holdings Count | Holding |
68
|
| InvestmentCompanyPortfolioTurnover |
51.00%
|
| Additional Fund Statistics [Text Block] |
Fund Statistics as of June 30, 2026 - Net Assets$37,630,332
- Total Number of Portfolio Holdings68
- Portfolio Turnover Rate51%
|
| Holdings [Text Block] |
Holdings DiversificationFootnote Reference(1) (% of Net Assets) as of June 30, 2026 Table SummaryValue | Value |
|---|
Other | 8.0% | Consumer, Non-cyclical | 9.4% | Consumer, Cyclical | 12.8% | Communications | 15.0% | Industrial | 18.5% | Technology | 35.9% | |
| Largest Holdings [Text Block] |
10 Largest HoldingsFootnote Reference(2) (% of Net Assets) as of June 30, 2026 Table SummarySandisk Corp. | 10.4% |
|---|
Micron Technology, Inc. | 4.2% |
|---|
Comfort Systems USA, Inc. | 3.3% |
|---|
KLA Corp. | 3.1% |
|---|
Advanced Micro Devices, Inc. | 2.6% |
|---|
Lam Research Corp. | 2.4% |
|---|
Ciena Corp. | 2.3% |
|---|
Crowdstrike Holdings, Inc. — Class A | 2.2% |
|---|
Vertiv Holdings Co. — Class A | 2.1% |
|---|
Monolithic Power Systems, Inc. | 2.1% |
|---|
Total | 34.7% |
|---|
|
| Material Fund Change [Text Block] |
|
| C000010407 |
|
| Shareholder Report [Line Items] |
|
| Fund Name |
S&P 500<sup style="inset: 1.5px 0px 4px; box-sizing: border-box; color: rgb(83, 40, 79); display: inline; flex-wrap: nowrap; font-size: 20px; font-weight: 700; grid-area: auto; line-height: 0px; margin: 0px; overflow: visible; position: relative; text-align: left; text-align-last: auto; white-space-collapse: preserve-breaks;">®</sup> Pure Value Fund
|
| Class Name |
Variable Annuity
|
| No Trading Symbol [Flag] |
true
|
| Annual or Semi-Annual Statement [Text Block] |
This semi-annual shareholder report contains important information about the S&P 500® Pure Value Fund for the period from January 1, 2026 to June 30, 2026.
|
| Additional Information [Text Block] |
You can find additional information about the fund at GuggenheimInvestments.com/variable-insurance-funds. You can also request this information by contacting 800 820 0888 or services@guggenheiminvestments.com.
|
| Additional Information Phone Number |
800 820 0888
|
| Additional Information Email |
<span style="box-sizing: border-box; color: rgb(67, 67, 67); display: inline; flex-wrap: nowrap; font-size: 10.6667px; font-weight: 400; grid-area: auto; line-height: 12.8px; margin: 0px; overflow: visible; text-align: left; text-align-last: auto; white-space-collapse: preserve-breaks;">services@guggenheiminvestments.com</span>
|
| Additional Information Website |
<span style="box-sizing: border-box; color: rgb(67, 67, 67); display: inline; flex-wrap: nowrap; font-size: 10.6667px; font-weight: 400; grid-area: auto; line-height: 12.8px; margin: 0px; overflow: visible; text-align: left; text-align-last: auto; white-space-collapse: preserve-breaks;">GuggenheimInvestments.com/variable-insurance-funds</span>
|
| Expenses [Text Block] |
What were the Fund's costs for the last six months? * Based on a hypothetical $10,000 investment Table SummaryClass | Costs of a $10,000 Investment | Costs Paid as a % of a $10,000 Investment** |
|---|
Variable Annuity | $84 | 1.60% |
|---|
Table Summary* | Excludes expenses of the underlying funds in which the fund invests, if any. |
|---|
** | Annualized |
|---|
|
| Expenses Paid, Amount |
$ 84
|
| Factors Affecting Performance [Text Block] |
What factors materially affected the Fund's performance over the last six months? The sectors that contributed the most to the return of the underlying index for the reporting period were health care, energy, and financials. The sector that detracted the most was communication services. The holdings that contributed the most to the return of the underlying index for the reporting period Centene Corp., Humana, Inc., and Hewlett Packard Enterprise Co. Those that detracted the most were Charter Communications, Inc.- Class A, Molina Healthcare, Inc., and Paramount Skydance Corporation - Class B. The Fund maintained a daily correlation of over 99% to the S&P 500 Pure Value Index for the reporting period. |
| Line Graph [Table Text Block] |
Table Summary | S&P 500® Pure Value Fund | S&P 500 Index | S&P 500 Pure Value Index |
|---|
6/30/16 | $10,000 | $10,000 | $10,000 |
|---|
6/30/17 | $11,720 | $11,790 | $11,934 |
|---|
6/30/18 | $13,021 | $13,484 | $13,461 |
|---|
6/30/19 | $13,033 | $14,889 | $13,702 |
|---|
6/30/20 | $9,699 | $16,006 | $10,392 |
|---|
6/30/21 | $15,713 | $22,536 | $17,168 |
|---|
6/30/22 | $15,410 | $20,144 | $17,112 |
|---|
6/30/23 | $16,096 | $24,091 | $18,209 |
|---|
6/30/24 | $17,474 | $30,006 | $20,102 |
|---|
6/30/25 | $19,860 | $34,556 | $23,239 |
|---|
6/30/26 | $24,400 | $42,271 | $28,985 |
|---|
|
| AssetsNet |
$ 20,845,381
|
| Holdings Count | Holding |
122
|
| InvestmentCompanyPortfolioTurnover |
79.00%
|
| Additional Fund Statistics [Text Block] |
Fund Statistics as of June 30, 2026 - Net Assets$20,845,381
- Total Number of Portfolio Holdings122
- Portfolio Turnover Rate79%
|
| Holdings [Text Block] |
Holdings DiversificationFootnote Reference(1) (% of Net Assets) as of June 30, 2026 Table SummaryValue | Value |
|---|
Other | 6.9% | Communications | 5.2% | Industrial | 6.2% | Basic Materials | 8.3% | Energy | 9.6% | Consumer, Cyclical | 12.8% | Financial | 20.4% | Consumer, Non-cyclical | 30.5% | |
| Largest Holdings [Text Block] |
10 Largest HoldingsFootnote Reference(2) (% of Net Assets) as of June 30, 2026 Table SummaryCentene Corp. | 2.7% |
|---|
Humana, Inc. | 2.5% |
|---|
Archer-Daniels-Midland Co. | 2.2% |
|---|
Bunge Global S.A. | 2.2% |
|---|
CVS Health Corp. | 2.1% |
|---|
Ford Motor Co. | 2.0% |
|---|
Dow, Inc. | 1.8% |
|---|
General Motors Co. | 1.7% |
|---|
Target Corp. | 1.7% |
|---|
Cigna Group | 1.7% |
|---|
Total | 20.6% |
|---|
|
| Material Fund Change [Text Block] |
|
| C000010413 |
|
| Shareholder Report [Line Items] |
|
| Fund Name |
S&P MidCap 400<sup style="inset: 1.5px 0px 4px; box-sizing: border-box; color: rgb(83, 40, 79); display: inline; flex-wrap: nowrap; font-size: 20px; font-weight: 700; grid-area: auto; line-height: 0px; margin: 0px; overflow: visible; position: relative; text-align: left; text-align-last: auto; white-space-collapse: preserve-breaks;">®</sup> Pure Growth Fund
|
| Class Name |
Variable Annuity
|
| No Trading Symbol [Flag] |
true
|
| Annual or Semi-Annual Statement [Text Block] |
This semi-annual shareholder report contains important information about the S&P MidCap 400® Pure Growth Fund for the period from January 1, 2026 to June 30, 2026.
|
| Additional Information [Text Block] |
You can find additional information about the fund at GuggenheimInvestments.com/variable-insurance-funds. You can also request this information by contacting 800 820 0888 or services@guggenheiminvestments.com.
|
| Additional Information Phone Number |
800 820 0888
|
| Additional Information Email |
<span style="box-sizing: border-box; color: rgb(67, 67, 67); display: inline; flex-wrap: nowrap; font-size: 10.6667px; font-weight: 400; grid-area: auto; line-height: 12.8px; margin: 0px; overflow: visible; text-align: left; text-align-last: auto; white-space-collapse: preserve-breaks;">services@guggenheiminvestments.com</span>
|
| Additional Information Website |
<span style="box-sizing: border-box; color: rgb(67, 67, 67); display: inline; flex-wrap: nowrap; font-size: 10.6667px; font-weight: 400; grid-area: auto; line-height: 12.8px; margin: 0px; overflow: visible; text-align: left; text-align-last: auto; white-space-collapse: preserve-breaks;">GuggenheimInvestments.com/variable-insurance-funds</span>
|
| Expenses [Text Block] |
What were the Fund's costs for the last six months? * Based on a hypothetical $10,000 investment Table SummaryClass | Costs of a $10,000 Investment | Costs Paid as a % of a $10,000 Investment** |
|---|
Variable Annuity | $88 | 1.60% |
|---|
Table Summary* | Excludes expenses of the underlying funds in which the fund invests, if any. |
|---|
** | Annualized |
|---|
|
| Expenses Paid, Amount |
$ 88
|
| Factors Affecting Performance [Text Block] |
What factors materially affected the Fund's performance over the last six months? The sectors that contributed the most to the return of the underlying index for the reporting period were industrials, information technology, and energy. Those that detracted the most from the return of the underlying index were consumer discretionary, materials, and consumer staples. The holdings that contributed the most to the return of the underlying index for the reporting period were Sterling Infrastructure, Inc., Vicor Corp., and Carpenter Technology Corp. Those that detracted the most were Celsius Holdings, Inc., AeroVironment, Inc., and Planet Fitness, Inc. Class A. The Fund maintained a daily correlation of over 99% to the S&P MidCap 400 Pure Growth Index for the reporting period. |
| Line Graph [Table Text Block] |
Table Summary | S&P MidCap 400® Pure Growth Fund | S&P 500 Index | S&P MidCap 400 Pure Growth Index |
|---|
6/30/16 | $10,000 | $10,000 | $10,000 |
|---|
6/30/17 | $11,419 | $11,790 | $11,608 |
|---|
6/30/18 | $13,044 | $13,484 | $13,492 |
|---|
6/30/19 | $11,934 | $14,889 | $12,544 |
|---|
6/30/20 | $11,981 | $16,006 | $12,785 |
|---|
6/30/21 | $17,811 | $22,536 | $19,358 |
|---|
6/30/22 | $12,722 | $20,144 | $14,033 |
|---|
6/30/23 | $15,146 | $24,091 | $17,010 |
|---|
6/30/24 | $18,768 | $30,006 | $21,475 |
|---|
6/30/25 | $18,580 | $34,556 | $21,632 |
|---|
6/30/26 | $24,277 | $42,271 | $28,757 |
|---|
|
| AssetsNet |
$ 10,314,326
|
| Holdings Count | Holding |
101
|
| InvestmentCompanyPortfolioTurnover |
216.00%
|
| Additional Fund Statistics [Text Block] |
Fund Statistics as of June 30, 2026 - Net Assets$10,314,326
- Total Number of Portfolio Holdings101
- Portfolio Turnover Rate216%
|
| Holdings [Text Block] |
Holdings DiversificationFootnote Reference(1) (% of Net Assets) as of June 30, 2026 Table SummaryValue | Value |
|---|
Other | 9.7% | Communications | 5.0% | Basic Materials | 6.0% | Consumer, Cyclical | 8.5% | Technology | 13.2% | Consumer, Non-cyclical | 23.0% | Industrial | 34.0% | |
| Largest Holdings [Text Block] |
10 Largest HoldingsFootnote Reference(2) (% of Net Assets) as of June 30, 2026 Table SummarySterling Infrastructure, Inc. | 3.0% |
|---|
Carpenter Technology Corp. | 2.5% |
|---|
Vicor Corp. | 2.5% |
|---|
DigitalOcean Holdings, Inc. | 2.4% |
|---|
Arrowhead Pharmaceuticals, Inc. | 2.3% |
|---|
TTM Technologies, Inc. | 2.1% |
|---|
MasTec, Inc. | 2.1% |
|---|
Woodward, Inc. | 2.0% |
|---|
TechnipFMC plc | 1.9% |
|---|
Rambus, Inc. | 1.9% |
|---|
Total | 22.7% |
|---|
|
| Material Fund Change [Text Block] |
|
| C000010411 |
|
| Shareholder Report [Line Items] |
|
| Fund Name |
S&P MidCap 400<sup style="inset: 1.5px 0px 4px; box-sizing: border-box; color: rgb(83, 40, 79); display: inline; flex-wrap: nowrap; font-size: 20px; font-weight: 700; grid-area: auto; line-height: 0px; margin: 0px; overflow: visible; position: relative; text-align: left; text-align-last: auto; white-space-collapse: preserve-breaks;">®</sup> Pure Value Fund
|
| Class Name |
Variable Annuity
|
| No Trading Symbol [Flag] |
true
|
| Annual or Semi-Annual Statement [Text Block] |
This semi-annual shareholder report contains important information about the S&P MidCap 400® Pure Value Fund for the period from January 1, 2026 to June 30, 2026.
|
| Additional Information [Text Block] |
You can find additional information about the fund at GuggenheimInvestments.com/variable-insurance-funds. You can also request this information by contacting 800 820 0888 or services@guggenheiminvestments.com.
|
| Additional Information Phone Number |
800 820 0888
|
| Additional Information Email |
<span style="box-sizing: border-box; color: rgb(67, 67, 67); display: inline; flex-wrap: nowrap; font-size: 10.6667px; font-weight: 400; grid-area: auto; line-height: 12.8px; margin: 0px; overflow: visible; text-align: left; text-align-last: auto; white-space-collapse: preserve-breaks;">services@guggenheiminvestments.com</span>
|
| Additional Information Website |
<span style="box-sizing: border-box; color: rgb(67, 67, 67); display: inline; flex-wrap: nowrap; font-size: 10.6667px; font-weight: 400; grid-area: auto; line-height: 12.8px; margin: 0px; overflow: visible; text-align: left; text-align-last: auto; white-space-collapse: preserve-breaks;">GuggenheimInvestments.com/variable-insurance-funds</span>
|
| Expenses [Text Block] |
What were the Fund's costs for the last six months? * Based on a hypothetical $10,000 investment Table SummaryClass | Costs of a $10,000 Investment | Costs Paid as a % of a $10,000 Investment** |
|---|
Variable Annuity | $84 | 1.60% |
|---|
Table Summary* | Excludes expenses of the underlying funds in which the fund invests, if any. |
|---|
** | Annualized |
|---|
|
| Expenses Paid, Amount |
$ 84
|
| Factors Affecting Performance [Text Block] |
What factors materially affected the Fund's performance over the last six months? The sectors that contributed the most to the return of the underlying index for the reporting period were information technology, energy, and consumer discretionary. The sector that detracted the most was consumer staples. The holdings that contributed the most to the return of the underlying index for the reporting period were Arrow Electronics, Inc., Avnet, Inc., and TD Synnex Corp. Those that detracted the most were Concentrix Corp., Whirlpool Corp., Coty, Inc.- Class A. The Fund maintained a daily correlation of over 99% to the S&P MidCap 400 Pure Value Index for the reporting period. |
| Line Graph [Table Text Block] |
Table Summary | S&P MidCap 400® Pure Value Fund | S&P 500 Index | S&P MidCap 400 Pure Value Index |
|---|
6/30/16 | $10,000 | $10,000 | $10,000 |
|---|
6/30/17 | $12,226 | $11,790 | $12,451 |
|---|
6/30/18 | $13,611 | $13,484 | $14,099 |
|---|
6/30/19 | $12,955 | $14,889 | $13,656 |
|---|
6/30/20 | $9,927 | $16,006 | $10,619 |
|---|
6/30/21 | $17,979 | $22,536 | $19,661 |
|---|
6/30/22 | $16,415 | $20,144 | $18,247 |
|---|
6/30/23 | $20,390 | $24,091 | $23,108 |
|---|
6/30/24 | $22,041 | $30,006 | $25,431 |
|---|
6/30/25 | $23,955 | $34,556 | $28,115 |
|---|
6/30/26 | $28,445 | $42,271 | $33,973 |
|---|
|
| AssetsNet |
$ 7,325,892
|
| Holdings Count | Holding |
99
|
| InvestmentCompanyPortfolioTurnover |
117.00%
|
| Additional Fund Statistics [Text Block] |
Fund Statistics as of June 30, 2026 - Net Assets$7,325,892
- Total Number of Portfolio Holdings99
- Portfolio Turnover Rate117%
|
| Holdings [Text Block] |
Holdings DiversificationFootnote Reference(1) (% of Net Assets) as of June 30, 2026 Table SummaryValue | Value |
|---|
Other | 3.2% | Basic Materials | 5.1% | Consumer, Non-cyclical | 7.2% | Energy | 11.7% | Financial | 22.2% | Industrial | 23.9% | Consumer, Cyclical | 26.3% | |
| Largest Holdings [Text Block] |
10 Largest HoldingsFootnote Reference(2) (% of Net Assets) as of June 30, 2026 Table SummaryArrow Electronics, Inc. | 4.0% |
|---|
Avnet, Inc. | 4.0% |
|---|
PBF Energy, Inc. — Class A | 2.9% |
|---|
TD SYNNEX Corp. | 2.8% |
|---|
HF Sinclair Corp. | 2.5% |
|---|
Lear Corp. | 2.3% |
|---|
Brighthouse Financial, Inc. | 1.9% |
|---|
Sirius XM Holdings, Inc. | 1.8% |
|---|
Park Hotels & Resorts, Inc. REIT | 1.8% |
|---|
Macy's, Inc. | 1.7% |
|---|
Total | 25.7% |
|---|
|
| Material Fund Change [Text Block] |
|
| C000010410 |
|
| Shareholder Report [Line Items] |
|
| Fund Name |
S&P SmallCap 600<sup style="inset: 1.5px 0px 4px; box-sizing: border-box; color: rgb(83, 40, 79); display: inline; flex-wrap: nowrap; font-size: 20px; font-weight: 700; grid-area: auto; line-height: 0px; margin: 0px; overflow: visible; position: relative; text-align: left; text-align-last: auto; white-space-collapse: preserve-breaks;">®</sup> Pure Growth Fund
|
| Class Name |
Variable Annuity
|
| No Trading Symbol [Flag] |
true
|
| Annual or Semi-Annual Statement [Text Block] |
This semi-annual shareholder report contains important information about the S&P SmallCap 600® Pure Growth Fund for the period from January 1, 2026 to June 30, 2026.
|
| Additional Information [Text Block] |
You can find additional information about the fund at GuggenheimInvestments.com/variable-insurance-funds. You can also request this information by contacting 800 820 0888 or services@guggenheiminvestments.com.
|
| Additional Information Phone Number |
800 820 0888
|
| Additional Information Email |
<span style="box-sizing: border-box; color: rgb(67, 67, 67); display: inline; flex-wrap: nowrap; font-size: 10.6667px; font-weight: 400; grid-area: auto; line-height: 12.8px; margin: 0px; overflow: visible; text-align: left; text-align-last: auto; white-space-collapse: preserve-breaks;">services@guggenheiminvestments.com</span>
|
| Additional Information Website |
<span style="box-sizing: border-box; color: rgb(67, 67, 67); display: inline; flex-wrap: nowrap; font-size: 10.6667px; font-weight: 400; grid-area: auto; line-height: 12.8px; margin: 0px; overflow: visible; text-align: left; text-align-last: auto; white-space-collapse: preserve-breaks;">GuggenheimInvestments.com/variable-insurance-funds</span>
|
| Expenses [Text Block] |
What were the Fund's costs for the last six months? * Based on a hypothetical $10,000 investment Table SummaryClass | Costs of a $10,000 Investment | Costs Paid as a % of a $10,000 Investment** |
|---|
Variable Annuity | $92 | 1.60% |
|---|
Table Summary* | Excludes expenses of the underlying funds in which the fund invests, if any. |
|---|
** | Annualized |
|---|
|
| Expenses Paid, Amount |
$ 92
|
| Factors Affecting Performance [Text Block] |
What factors materially affected the Fund's performance over the last six months? The sectors that contributed the most to the return of the underlying index for the reporting period were information technology, industrials, and financials. No sectors detracted from performance. The holdings that contributed the most to the return of the underlying index for the reporting period were ACM Research, Inc.- Class A, Powell Industries, Inc., and StoneX Group, Inc. Those that detracted the most were TransMedics Group, Inc., Vital Farms, Inc., and Artivion, Inc. The Fund maintained a daily correlation of over 99% to the S&P SmallCap 600 Pure Growth Index for the reporting period. |
| Line Graph [Table Text Block] |
Table Summary | S&P SmallCap 600® Pure Growth Fund | S&P 500 Index | S&P SmallCap 600 Pure Growth Index |
|---|
6/30/16 | $10,000 | $10,000 | $10,000 |
|---|
6/30/17 | $12,352 | $11,790 | $12,591 |
|---|
6/30/18 | $15,056 | $13,484 | $15,613 |
|---|
6/30/19 | $13,106 | $14,889 | $13,852 |
|---|
6/30/20 | $11,761 | $16,006 | $12,649 |
|---|
6/30/21 | $18,828 | $22,536 | $20,666 |
|---|
6/30/22 | $13,225 | $20,144 | $14,740 |
|---|
6/30/23 | $14,665 | $24,091 | $16,634 |
|---|
6/30/24 | $16,356 | $30,006 | $18,901 |
|---|
6/30/25 | $17,338 | $34,556 | $20,382 |
|---|
6/30/26 | $24,641 | $42,271 | $29,566 |
|---|
|
| AssetsNet |
$ 12,934,785
|
| Holdings Count | Holding |
129
|
| InvestmentCompanyPortfolioTurnover |
179.00%
|
| Additional Fund Statistics [Text Block] |
Fund Statistics as of June 30, 2026 - Net Assets$12,934,785
- Total Number of Portfolio Holdings129
- Portfolio Turnover Rate179%
|
| Holdings [Text Block] |
Holdings DiversificationFootnote Reference(1) (% of Net Assets) as of June 30, 2026 Table SummaryValue | Value |
|---|
Other | 2.2% | Communications | 7.4% | Consumer, Cyclical | 8.3% | Technology | 10.7% | Industrial | 19.2% | Financial | 20.9% | Consumer, Non-cyclical | 31.2% | |
| Largest Holdings [Text Block] |
10 Largest HoldingsFootnote Reference(2) (% of Net Assets) as of June 30, 2026 Table SummaryACM Research, Inc. — Class A | 3.6% |
|---|
Powell Industries, Inc. | 2.0% |
|---|
Argan, Inc. | 2.0% |
|---|
Dave, Inc. | 1.8% |
|---|
StoneX Group, Inc. | 1.6% |
|---|
Protagonist Therapeutics, Inc. | 1.5% |
|---|
Sphere Entertainment Co. | 1.5% |
|---|
Clear Secure, Inc. — Class A | 1.5% |
|---|
Alignment Healthcare, Inc. | 1.5% |
|---|
Liquidia Corp. | 1.4% |
|---|
Total | 18.4% |
|---|
|
| Material Fund Change [Text Block] |
|
| C000010409 |
|
| Shareholder Report [Line Items] |
|
| Fund Name |
S&P SmallCap 600<sup style="inset: 1.5px 0px 4px; box-sizing: border-box; color: rgb(83, 40, 79); display: inline; flex-wrap: nowrap; font-size: 20px; font-weight: 700; grid-area: auto; line-height: 0px; margin: 0px; overflow: visible; position: relative; text-align: left; text-align-last: auto; white-space-collapse: preserve-breaks;">®</sup> Pure Value Fund
|
| Class Name |
Variable Annuity
|
| No Trading Symbol [Flag] |
true
|
| Annual or Semi-Annual Statement [Text Block] |
This semi-annual shareholder report contains important information about the S&P SmallCap 600® Pure Value Fund for the period from January 1, 2026 to June 30, 2026.
|
| Additional Information [Text Block] |
You can find additional information about the fund at GuggenheimInvestments.com/variable-insurance-funds. You can also request this information by contacting 800 820 0888 or services@guggenheiminvestments.com.
|
| Additional Information Phone Number |
800 820 0888
|
| Additional Information Email |
<span style="box-sizing: border-box; color: rgb(67, 67, 67); display: inline; flex-wrap: nowrap; font-size: 10.6667px; font-weight: 400; grid-area: auto; line-height: 12.8px; margin: 0px; overflow: visible; text-align: left; text-align-last: auto; white-space-collapse: preserve-breaks;">services@guggenheiminvestments.com</span>
|
| Additional Information Website |
<span style="box-sizing: border-box; color: rgb(67, 67, 67); display: inline; flex-wrap: nowrap; font-size: 10.6667px; font-weight: 400; grid-area: auto; line-height: 12.8px; margin: 0px; overflow: visible; text-align: left; text-align-last: auto; white-space-collapse: preserve-breaks;">GuggenheimInvestments.com/variable-insurance-funds</span>
|
| Expenses [Text Block] |
What were the Fund's costs for the last six months? * Based on a hypothetical $10,000 investment Table SummaryClass | Costs of a $10,000 Investment | Costs Paid as a % of a $10,000 Investment** |
|---|
Variable Annuity | $89 | 1.60% |
|---|
Table Summary* | Excludes expenses of the underlying funds in which the fund invests, if any. |
|---|
** | Annualized |
|---|
|
| Expenses Paid, Amount |
$ 89
|
| Factors Affecting Performance [Text Block] |
What factors materially affected the Fund's performance over the last six months? The sectors that contributed the most to the return of the underlying index for the reporting period were information technology, consumer discretionary, and industrials. No sectors detracted from performance. The holdings that contributed the most to the return of the underlying index for the reporting period were Ichor Holdings, Ltd., Vishay Intertechnology, Inc., and Acadia Healthcare Company, Inc. Those that detracted the most were DXC Technology Co., Angi, Inc. - Class A, and Everforth, Inc. The Fund maintained a daily correlation of over 99% to the S&P SmallCap 600 Pure Value Index for the reporting period. |
| Line Graph [Table Text Block] |
Table Summary | S&P SmallCap 600® Pure Value Fund | S&P 500 Index | S&P SmallCap 600 Pure Value Index |
|---|
6/30/16 | $10,000 | $10,000 | $10,000 |
|---|
6/30/17 | $11,538 | $11,790 | $11,725 |
|---|
6/30/18 | $13,433 | $13,484 | $13,889 |
|---|
6/30/19 | $10,887 | $14,889 | $11,450 |
|---|
6/30/20 | $8,156 | $16,006 | $8,729 |
|---|
6/30/21 | $16,230 | $22,536 | $17,771 |
|---|
6/30/22 | $14,182 | $20,144 | $15,846 |
|---|
6/30/23 | $15,881 | $24,091 | $18,116 |
|---|
6/30/24 | $16,863 | $30,006 | $19,546 |
|---|
6/30/25 | $17,783 | $34,556 | $20,989 |
|---|
6/30/26 | $25,281 | $42,271 | $30,458 |
|---|
|
| AssetsNet |
$ 11,506,012
|
| Holdings Count | Holding |
158
|
| InvestmentCompanyPortfolioTurnover |
148.00%
|
| Additional Fund Statistics [Text Block] |
Fund Statistics as of June 30, 2026 - Net Assets$11,506,012
- Total Number of Portfolio Holdings158
- Portfolio Turnover Rate148%
|
| Holdings [Text Block] |
Holdings DiversificationFootnote Reference(1) (% of Net Assets) as of June 30, 2026 Table SummaryValue | Value |
|---|
Other | 13.1% | Energy | 6.8% | Financial | 11.4% | Industrial | 15.7% | Consumer, Non-cyclical | 24.2% | Consumer, Cyclical | 28.3% | |
| Largest Holdings [Text Block] |
10 Largest HoldingsFootnote Reference(2) (% of Net Assets) as of June 30, 2026 Table SummaryIchor Holdings Ltd. | 3.0% |
|---|
Acadia Healthcare Company, Inc. | 1.8% |
|---|
Newell Brands, Inc. | 1.7% |
|---|
Vestis Corp. | 1.6% |
|---|
Vishay Intertechnology, Inc. | 1.6% |
|---|
Edgewell Personal Care Co. | 1.5% |
|---|
ArcBest Corp. | 1.5% |
|---|
Molina Healthcare, Inc. | 1.4% |
|---|
MarineMax, Inc. | 1.4% |
|---|
Cracker Barrel Old Country Store, Inc. | 1.3% |
|---|
Total | 16.8% |
|---|
|
| Material Fund Change [Text Block] |
|
| C000010390 |
|
| Shareholder Report [Line Items] |
|
| Fund Name |
Government Long Bond 1.2x Strategy Fund
|
| Class Name |
Variable Annuity
|
| No Trading Symbol [Flag] |
true
|
| Annual or Semi-Annual Statement [Text Block] |
This semi-annual shareholder report contains important information about the Government Long Bond 1.2x Strategy Fund for the period from January 1, 2026 to June 30, 2026.
|
| Additional Information [Text Block] |
You can find additional information about the fund at GuggenheimInvestments.com/variable-insurance-funds. You can also request this information by contacting 800 820 0888 or services@guggenheiminvestments.com.
|
| Additional Information Phone Number |
800 820 0888
|
| Additional Information Email |
<span style="box-sizing: border-box; color: rgb(67, 67, 67); display: inline; flex-wrap: nowrap; font-size: 10.6667px; font-weight: 400; grid-area: auto; line-height: 12.8px; margin: 0px; overflow: visible; text-align: left; text-align-last: auto; white-space-collapse: preserve-breaks;">services@guggenheiminvestments.com</span>
|
| Additional Information Website |
<span style="box-sizing: border-box; color: rgb(67, 67, 67); display: inline; flex-wrap: nowrap; font-size: 10.6667px; font-weight: 400; grid-area: auto; line-height: 12.8px; margin: 0px; overflow: visible; text-align: left; text-align-last: auto; white-space-collapse: preserve-breaks;">GuggenheimInvestments.com/variable-insurance-funds</span>
|
| Expenses [Text Block] |
What were the Fund's costs for the last six months? * Based on a hypothetical $10,000 investment Table SummaryClass | Costs of a $10,000 Investment | Costs Paid as a % of a $10,000 Investment** |
|---|
Variable Annuity | $66 | 1.33% |
|---|
Table Summary* | Excludes expenses of the underlying funds in which the fund invests, if any. |
|---|
** | Annualized |
|---|
|
| Expenses Paid, Amount |
$ 66
|
| Factors Affecting Performance [Text Block] |
What factors materially affected the Fund's performance over the last six months? Long-term U.S. Treasury yields experienced some volatility throughout the reporting period but ultimately ended the period slightly higher compared to where they started. Long-term yields reached their highs in May 2026 due to inflation concerns related to the effects of a prolonged closure of the strait of Hormuz. At the end of the reporting period the market was pricing in over one 25 basis point (one basis point equals 0.01%) rate hike for the remainder of 2026. |
| Line Graph [Table Text Block] |
Table Summary | Government Long Bond 1.2x Strategy Fund | Bloomberg U.S. Aggregate Bond Index | Bloomberg U.S. Treasury Bellwether 30 Year Total Return Index |
|---|
6/30/16 | $10,000 | $10,000 | $10,000 |
|---|
6/30/17 | $8,776 | $9,969 | $9,121 |
|---|
6/30/18 | $8,575 | $9,929 | $9,105 |
|---|
6/30/19 | $9,697 | $10,710 | $10,277 |
|---|
6/30/20 | $12,917 | $11,646 | $13,335 |
|---|
6/30/21 | $10,728 | $11,607 | $11,502 |
|---|
6/30/22 | $7,976 | $10,413 | $9,240 |
|---|
6/30/23 | $6,874 | $10,315 | $8,345 |
|---|
6/30/24 | $6,043 | $10,587 | $7,711 |
|---|
6/30/25 | $5,855 | $11,230 | $7,714 |
|---|
6/30/26 | $5,848 | $11,656 | $7,895 |
|---|
|
| AssetsNet |
$ 11,835,095
|
| Holdings Count | Holding |
9
|
| InvestmentCompanyPortfolioTurnover |
941.00%
|
| Additional Fund Statistics [Text Block] |
Fund Statistics as of June 30, 2026 - Net Assets$11,835,095
- Total Number of Portfolio Holdings9
- Portfolio Turnover Rate941%
|
| Holdings [Text Block] |
Holdings DiversificationFootnote Reference(1) (% of Net Assets) as of June 30, 2026 Table SummaryValue | Value |
|---|
U.S. Government Securities | 53.8% | Interest Rate Futures Contracts Purchased | 66.4% | |
| Largest Holdings [Text Block] |
Largest HoldingsFootnote Reference(2) (% of Net Assets) as of June 30, 2026 Table SummaryU.S. Treasury Bonds 5.00% due 05/15/56 | 53.8% |
|---|
Guggenheim Ultra Short Income ETF | 2.3% |
|---|
Guggenheim Ultra Short Duration Fund — Institutional Class | 1.6% |
|---|
Total | 57.7% |
|---|
|
| Material Fund Change [Text Block] |
|
| C000010404 |
|
| Shareholder Report [Line Items] |
|
| Fund Name |
Inverse Government Long Bond Strategy Fund
|
| Class Name |
Variable Annuity
|
| No Trading Symbol [Flag] |
true
|
| Annual or Semi-Annual Statement [Text Block] |
This semi-annual shareholder report contains important information about the Inverse Government Long Bond Strategy Fund for the period from January 1, 2026 to June 30, 2026.
|
| Additional Information [Text Block] |
You can find additional information about the fund at GuggenheimInvestments.com/variable-insurance-funds. You can also request this information by contacting 800 820 0888 or services@guggenheiminvestments.com.
|
| Additional Information Phone Number |
800 820 0888
|
| Additional Information Email |
<span style="box-sizing: border-box; color: rgb(67, 67, 67); display: inline; flex-wrap: nowrap; font-size: 10.6667px; font-weight: 400; grid-area: auto; line-height: 12.8px; margin: 0px; overflow: visible; text-align: left; text-align-last: auto; white-space-collapse: preserve-breaks;">services@guggenheiminvestments.com</span>
|
| Additional Information Website |
<span style="box-sizing: border-box; color: rgb(67, 67, 67); display: inline; flex-wrap: nowrap; font-size: 10.6667px; font-weight: 400; grid-area: auto; line-height: 12.8px; margin: 0px; overflow: visible; text-align: left; text-align-last: auto; white-space-collapse: preserve-breaks;">GuggenheimInvestments.com/variable-insurance-funds</span>
|
| Expenses [Text Block] |
What were the Fund's costs for the last six months? * Based on a hypothetical $10,000 investment Table SummaryClass | Costs of a $10,000 Investment | Costs Paid as a % of a $10,000 Investment** |
|---|
Variable Annuity | $286 | 5.72% |
|---|
Table Summary* | Excludes expenses of the underlying funds in which the fund invests, if any. |
|---|
** | Annualized |
|---|
|
| Expenses Paid, Amount |
$ 286
|
| Factors Affecting Performance [Text Block] |
What factors materially affected the Fund's performance over the last six months? Long-term U.S. Treasury yields experienced some volatility throughout the reporting period but ultimately ended the period slightly higher compared to where they started. Long-term yields reached their highs in May 2026 due to inflation concerns related to the effects of a prolonged closure of the strait of Hormuz. At the end of the reporting period the market was pricing in over one 25 basis point (one basis point equals 0.01%) rate hike for the remainder of 2026. |
| Line Graph [Table Text Block] |
Table Summary | Inverse Government Long Bond Strategy Fund | Bloomberg U.S. Aggregate Bond Index | Bloomberg U.S. Treasury Bellwether 30 Year Total Return Index |
|---|
6/30/16 | $10,000 | $10,000 | $10,000 |
|---|
6/30/17 | $10,893 | $9,969 | $9,121 |
|---|
6/30/18 | $10,951 | $9,929 | $9,105 |
|---|
6/30/19 | $9,885 | $10,710 | $10,277 |
|---|
6/30/20 | $7,235 | $11,646 | $13,335 |
|---|
6/30/21 | $8,119 | $11,607 | $11,502 |
|---|
6/30/22 | $9,693 | $10,413 | $9,240 |
|---|
6/30/23 | $10,942 | $10,315 | $8,345 |
|---|
6/30/24 | $12,712 | $10,587 | $7,711 |
|---|
6/30/25 | $13,518 | $11,230 | $7,714 |
|---|
6/30/26 | $13,896 | $11,656 | $7,895 |
|---|
|
| AssetsNet |
$ 1,623,095
|
| Holdings Count | Holding |
12
|
| InvestmentCompanyPortfolioTurnover |
1882.00%
|
| Additional Fund Statistics [Text Block] |
Fund Statistics as of June 30, 2026 - Net Assets$1,623,095
- Total Number of Portfolio Holdings12
- Portfolio Turnover Rate1,882%
|
| Holdings [Text Block] |
Holdings DiversificationFootnote Reference(1) (% of Net Assets) as of June 30, 2026 Table SummaryValue | Value |
|---|
U.S. Government Securities Sold Short | -87.2% | Interest Rate Futures Contracts Sold Short | -14.2% | |
| Largest Holdings [Text Block] |
Largest HoldingsFootnote Reference(2) (% of Net Assets) as of June 30, 2026 Table SummaryGuggenheim Ultra Short Duration Fund — Institutional Class | 19.6% |
|---|
Federal Farm Credit Bank 3.75% (SOFR + 0.13%, Rate Floor: 0.00%) due 08/12/26 | 15.4% |
|---|
Guggenheim Ultra Short Income ETF | 2.7% |
|---|
Total | 37.7% |
|---|
|
| Material Fund Change [Text Block] |
|
| C000046626 |
|
| Shareholder Report [Line Items] |
|
| Fund Name |
High Yield Strategy Fund
|
| Class Name |
Variable Annuity
|
| No Trading Symbol [Flag] |
true
|
| Annual or Semi-Annual Statement [Text Block] |
This semi-annual shareholder report contains important information about the High Yield Strategy Fund for the period from January 1, 2026 to June 30, 2026.
|
| Additional Information [Text Block] |
You can find additional information about the fund at GuggenheimInvestments.com/variable-insurance-funds. You can also request this information by contacting 800 820 0888 or services@guggenheiminvestments.com.
|
| Additional Information Phone Number |
800 820 0888
|
| Additional Information Email |
<span style="box-sizing: border-box; color: rgb(67, 67, 67); display: inline; flex-wrap: nowrap; font-size: 10.6667px; font-weight: 400; grid-area: auto; line-height: 12.8px; margin: 0px; overflow: visible; text-align: left; text-align-last: auto; white-space-collapse: preserve-breaks;">services@guggenheiminvestments.com</span>
|
| Additional Information Website |
<span style="box-sizing: border-box; color: rgb(67, 67, 67); display: inline; flex-wrap: nowrap; font-size: 10.6667px; font-weight: 400; grid-area: auto; line-height: 12.8px; margin: 0px; overflow: visible; text-align: left; text-align-last: auto; white-space-collapse: preserve-breaks;">GuggenheimInvestments.com/variable-insurance-funds</span>
|
| Expenses [Text Block] |
What were the Fund's costs for the last six months? * Based on a hypothetical $10,000 investment Table SummaryClass | Costs of a $10,000 Investment | Costs Paid as a % of a $10,000 Investment** |
|---|
Variable Annuity | $78 | 1.57% |
|---|
Table Summary* | Excludes expenses of the underlying funds in which the fund invests, if any. |
|---|
** | Annualized |
|---|
|
| Expenses Paid, Amount |
$ 78
|
| Factors Affecting Performance [Text Block] |
What factors materially affected the Fund's performance over the last six months? High yield generated positive returns for the Reporting Period. During the period, high yield markets experienced some volatility due to geopolitical events in the middle east. Markets rebounded from the initial concerns and generated positive absolute returns for the remainder of the reporting period. All sectors contributed positively to the Bloomberg U.S. Corporate High Yield Index (the "Index") with notable positive contributions from Energy and Consumer Discretionary. On the ratings side, BB-rated holdings led contributions to the index returns. |
| Line Graph [Table Text Block] |
Table Summary | High Yield Strategy Fund | Bloomberg U.S. Aggregate Bond Index | Bloomberg U.S. Corporate High Yield Index |
|---|
6/30/16 | $10,000 | $10,000 | $10,000 |
|---|
6/30/17 | $10,777 | $9,969 | $11,270 |
|---|
6/30/18 | $10,947 | $9,929 | $11,565 |
|---|
6/30/19 | $12,092 | $10,710 | $12,430 |
|---|
6/30/20 | $11,314 | $11,646 | $12,434 |
|---|
6/30/21 | $12,672 | $11,607 | $14,345 |
|---|
6/30/22 | $10,672 | $10,413 | $12,507 |
|---|
6/30/23 | $11,681 | $10,315 | $13,640 |
|---|
6/30/24 | $12,847 | $10,587 | $15,064 |
|---|
6/30/25 | $14,243 | $11,230 | $16,613 |
|---|
6/30/26 | $14,799 | $11,656 | $17,595 |
|---|
|
| AssetsNet |
$ 5,193,240
|
| Holdings Count | Holding |
15
|
| InvestmentCompanyPortfolioTurnover |
0.00%
|
| Additional Fund Statistics [Text Block] |
Fund Statistics as of June 30, 2026 - Net Assets$5,193,240
- Total Number of Portfolio Holdings15
- Portfolio Turnover Rate-%
|
| Holdings [Text Block] |
Holdings DiversificationFootnote Reference(1) (% of Net Assets) as of June 30, 2026 Table SummaryValue | Value |
|---|
Other | 5.7% | Centrally Cleared Credit Default Swap Agreements Protection Sold | 87.7% | Interest Rate Futures Contracts Purchased | 96.8% | |
| Largest Holdings [Text Block] |
Largest HoldingsFootnote Reference(2) (% of Net Assets) as of June 30, 2026 Table SummaryGuggenheim Ultra Short Duration Fund — Institutional Class | 11.1% |
|---|
Guggenheim Ultra Short Income ETF | 4.0% |
|---|
iShares iBoxx $ High Yield Corporate Bond ETF | 2.4% |
|---|
State Street SPDR Bloomberg High Yield Bond ETF | 2.3% |
|---|
Total | 19.8% |
|---|
|
| Material Fund Change [Text Block] |
|
| C000010418 |
|
| Shareholder Report [Line Items] |
|
| Fund Name |
Europe 1.25x Strategy Fund
|
| Class Name |
Variable Annuity
|
| No Trading Symbol [Flag] |
true
|
| Annual or Semi-Annual Statement [Text Block] |
This semi-annual shareholder report contains important information about the Europe 1.25x Strategy Fund for the period from January 1, 2026 to June 30, 2026.
|
| Additional Information [Text Block] |
You can find additional information about the fund at GuggenheimInvestments.com/variable-insurance-funds. You can also request this information by contacting 800 820 0888 or services@guggenheiminvestments.com.
|
| Additional Information Phone Number |
800 820 0888
|
| Additional Information Email |
<span style="box-sizing: border-box; color: rgb(67, 67, 67); display: inline; flex-wrap: nowrap; font-size: 10.6667px; font-weight: 400; grid-area: auto; line-height: 12.8px; margin: 0px; overflow: visible; text-align: left; text-align-last: auto; white-space-collapse: preserve-breaks;">services@guggenheiminvestments.com</span>
|
| Additional Information Website |
<span style="box-sizing: border-box; color: rgb(67, 67, 67); display: inline; flex-wrap: nowrap; font-size: 10.6667px; font-weight: 400; grid-area: auto; line-height: 12.8px; margin: 0px; overflow: visible; text-align: left; text-align-last: auto; white-space-collapse: preserve-breaks;">GuggenheimInvestments.com/variable-insurance-funds</span>
|
| Expenses [Text Block] |
What were the Fund's costs for the last six months? * Based on a hypothetical $10,000 investment Table SummaryClass | Costs of a $10,000 Investment | Costs Paid as a % of a $10,000 Investment** |
|---|
Variable Annuity | $85 | 1.63% |
|---|
Table Summary* | Excludes expenses of the underlying funds in which the fund invests, if any. |
|---|
** | Annualized |
|---|
|
| Expenses Paid, Amount |
$ 85
|
| Factors Affecting Performance [Text Block] |
What factors materially affected the Fund's performance over the last six months? The sectors that contributed the most to the return of the underlying index for the reporting period were information technology, financials and industrials. The sectors that detracted the most from performance were consumer discretionary and communication services. The holdings that contributed the most to the return of the underlying index for the reporting period were ASML Holding N.V., HSBC Holdings plc, and ABB LTD. Those that detracted the most were SAP, LVMH Moet Hennessy Louis Vuitton SE, and EssilorLuxottica S.A. The fund maintained a daily correlation of over 99% to its benchmark of 125% of the daily price movement of the STOXX Europe 50 Index. |
| Line Graph [Table Text Block] |
Table Summary | Europe 1.25x Strategy Fund | MSCI World ex U.S. Index | STOXX Europe 50 Index |
|---|
6/30/16 | $10,000 | $10,000 | $10,000 |
|---|
6/30/17 | $11,970 | $11,949 | $12,431 |
|---|
6/30/18 | $12,032 | $12,790 | $12,701 |
|---|
6/30/19 | $12,556 | $12,955 | $13,469 |
|---|
6/30/20 | $11,484 | $12,253 | $12,865 |
|---|
6/30/21 | $15,270 | $16,370 | $16,595 |
|---|
6/30/22 | $12,715 | $13,626 | $14,580 |
|---|
6/30/23 | $16,145 | $15,999 | $19,188 |
|---|
6/30/24 | $18,168 | $17,795 | $22,044 |
|---|
6/30/25 | $19,901 | $21,124 | $24,641 |
|---|
6/30/26 | $24,263 | $25,557 | $30,260 |
|---|
|
| AssetsNet |
$ 1,891,015
|
| Holdings Count | Holding |
56
|
| InvestmentCompanyPortfolioTurnover |
378.00%
|
| Additional Fund Statistics [Text Block] |
Fund Statistics as of June 30, 2026 - Net Assets$1,891,015
- Total Number of Portfolio Holdings56
- Portfolio Turnover Rate378%
|
| Holdings [Text Block] |
Country CompositionFootnote Reference(1) (% of Total Investments) as of June 30, 2026 Table SummaryUnited States | 62.1% |
|---|
France | 7.7% |
|---|
United Kingdom | 7.6% |
|---|
Germany | 5.9% |
|---|
Netherlands | 5.4% |
|---|
Switzerland | 3.6% |
|---|
Spain | 3.2% |
|---|
Italy | 2.1% |
|---|
Others | 2.4% |
|---|
Total Investments | 100.0% |
|---|
Holdings DiversificationFootnote Reference(3) (% of Net Assets) as of June 30, 2026 Table SummaryValue | Value |
|---|
Other | 8.7% | Technology | 5.3% | Industrial | 7.6% | Financial | 10.2% | Consumer, Non-cyclical | 11.8% | Equity Futures Contracts Purchased | 82.1% | Currency Futures Contracts Purchased | 83.3% | |
| Largest Holdings [Text Block] |
10 Largest HoldingsFootnote Reference(2) (% of Net Assets) as of June 30, 2026 Table SummaryGuggenheim Ultra Short Duration Fund — Institutional Class | 9.6% |
|---|
ASML Holding N.V. | 4.4% |
|---|
Guggenheim Ultra Short Income ETF | 4.1% |
|---|
HSBC Holdings plc ADR | 1.9% |
|---|
Novartis AG ADR | 1.7% |
|---|
AstraZeneca plc | 1.7% |
|---|
Roche Holding AG ADR | 1.6% |
|---|
Nestle S.A. ADR | 1.5% |
|---|
Siemens AG ADR | 1.3% |
|---|
Shell plc ADR | 1.2% |
|---|
Total | 29.0% |
|---|
|
| Material Fund Change [Text Block] |
|
| C000010419 |
|
| Shareholder Report [Line Items] |
|
| Fund Name |
Japan 2x Strategy Fund
|
| Class Name |
Variable Annuity
|
| No Trading Symbol [Flag] |
true
|
| Annual or Semi-Annual Statement [Text Block] |
This semi-annual shareholder report contains important information about the Japan 2x Strategy Fund for the period from January 1, 2026 to June 30, 2026.
|
| Additional Information [Text Block] |
You can find additional information about the fund at GuggenheimInvestments.com/variable-insurance-funds. You can also request this information by contacting 800 820 0888 or services@guggenheiminvestments.com.
|
| Additional Information Phone Number |
800 820 0888
|
| Additional Information Email |
<span style="box-sizing: border-box; color: rgb(67, 67, 67); display: inline; flex-wrap: nowrap; font-size: 10.6667px; font-weight: 400; grid-area: auto; line-height: 12.8px; margin: 0px; overflow: visible; text-align: left; text-align-last: auto; white-space-collapse: preserve-breaks;">services@guggenheiminvestments.com</span>
|
| Additional Information Website |
<span style="box-sizing: border-box; color: rgb(67, 67, 67); display: inline; flex-wrap: nowrap; font-size: 10.6667px; font-weight: 400; grid-area: auto; line-height: 12.8px; margin: 0px; overflow: visible; text-align: left; text-align-last: auto; white-space-collapse: preserve-breaks;">GuggenheimInvestments.com/variable-insurance-funds</span>
|
| Expenses [Text Block] |
What were the Fund's costs for the last six months? * Based on a hypothetical $10,000 investment Table SummaryClass | Costs of a $10,000 Investment | Costs Paid as a % of a $10,000 Investment** |
|---|
Variable Annuity | $105 | 1.60% |
|---|
Table Summary* | Excludes expenses of the underlying funds in which the fund invests, if any. |
|---|
** | Annualized |
|---|
|
| Expenses Paid, Amount |
$ 105
|
| Factors Affecting Performance [Text Block] |
What factors materially affected the Fund's performance over the last six months? The sectors that contributed the most to the return of the underlying index for the reporting period were information technology, industrials, and consumer discretionary. The sectors that detracted the most were health care and real estate. The holdings that contributed the most to the return of the underlying index were Tokyo Electron, Ltd., Advantest Corp., and Fast Retailing Co., Ltd. Those that detracted the most were Sony Group Corp., Konami Group Corp., and Nintendo Co., Ltd. The fund maintained a daily correlation of over 99% to its benchmark of 200% of the daily price movement of the fair value of the Nikkei-225 Stock Average Index. |
| Line Graph [Table Text Block] |
Table Summary | Japan 2x Strategy Fund | MSCI World ex U.S. Index | Nikkei-225 Stock Average Index |
|---|
6/30/16 | $10,000 | $10,000 | $10,000 |
|---|
6/30/17 | $13,445 | $11,949 | $12,862 |
|---|
6/30/18 | $16,528 | $12,790 | $14,320 |
|---|
6/30/19 | $15,340 | $12,955 | $13,659 |
|---|
6/30/20 | $15,589 | $12,253 | $14,309 |
|---|
6/30/21 | $23,774 | $16,370 | $18,485 |
|---|
6/30/22 | $12,808 | $13,626 | $16,945 |
|---|
6/30/23 | $16,885 | $15,999 | $21,308 |
|---|
6/30/24 | $17,569 | $17,795 | $25,413 |
|---|
6/30/25 | $20,505 | $21,124 | $25,994 |
|---|
6/30/26 | $42,652 | $25,557 | $44,981 |
|---|
|
| AssetsNet |
$ 5,088,196
|
| Holdings Count | Holding |
9
|
| InvestmentCompanyPortfolioTurnover |
0.00%
|
| Additional Fund Statistics [Text Block] |
Fund Statistics as of June 30, 2026 - Net Assets$5,088,196
- Total Number of Portfolio Holdings9
- Portfolio Turnover Rate-%
|
| Holdings [Text Block] |
Holdings DiversificationFootnote Reference(1) (% of Net Assets) as of June 30, 2026 Table SummaryValue | Value |
|---|
Equity Futures Contracts Purchased | 198.4% | Currency Futures Contracts Purchased | 199.1% | |
| Material Fund Change [Text Block] |
|
| C000010402 |
|
| Shareholder Report [Line Items] |
|
| Fund Name |
Strengthening Dollar 2x Strategy Fund
|
| Class Name |
Variable Annuity
|
| No Trading Symbol [Flag] |
true
|
| Annual or Semi-Annual Statement [Text Block] |
This semi-annual shareholder report contains important information about the Strengthening Dollar 2x Strategy Fund for the period from January 1, 2026 to June 30, 2026.
|
| Additional Information [Text Block] |
You can find additional information about the fund at GuggenheimInvestments.com/variable-insurance-funds. You can also request this information by contacting 800 820 0888 or services@guggenheiminvestments.com.
|
| Additional Information Phone Number |
800 820 0888
|
| Additional Information Email |
<span style="box-sizing: border-box; color: rgb(67, 67, 67); display: inline; flex-wrap: nowrap; font-size: 10.6667px; font-weight: 400; grid-area: auto; line-height: 12.8px; margin: 0px; overflow: visible; text-align: left; text-align-last: auto; white-space-collapse: preserve-breaks;">services@guggenheiminvestments.com</span>
|
| Additional Information Website |
<span style="box-sizing: border-box; color: rgb(67, 67, 67); display: inline; flex-wrap: nowrap; font-size: 10.6667px; font-weight: 400; grid-area: auto; line-height: 12.8px; margin: 0px; overflow: visible; text-align: left; text-align-last: auto; white-space-collapse: preserve-breaks;">GuggenheimInvestments.com/variable-insurance-funds</span>
|
| Expenses [Text Block] |
What were the Fund's costs for the last six months? * Based on a hypothetical $10,000 investment Table SummaryClass | Costs of a $10,000 Investment | Costs Paid as a % of a $10,000 Investment** |
|---|
Variable Annuity | $105 | 2.04% |
|---|
Table Summary* | Excludes expenses of the underlying funds in which the fund invests, if any. |
|---|
** | Annualized |
|---|
|
| Expenses Paid, Amount |
$ 105
|
| Factors Affecting Performance [Text Block] |
What factors materially affected the Fund's performance over the last six months? The components which positively contributed the most to the performance of the underlying index for the reporting period were euro, Japanese yen, and Canadian dollar. No components detracted from the performance of the underlying index. The fund maintained a daily correlation of over 98% to its benchmark of 200% of the daily price movement of the U.S. Dollar Index. |
| Line Graph [Table Text Block] |
Table Summary | Strengthening Dollar 2x Strategy Fund | Bloomberg U.S. Aggregate Bond Index | U.S. Dollar Index |
|---|
6/30/16 | $10,000 | $10,000 | $10,000 |
|---|
6/30/17 | $9,965 | $9,969 | $9,968 |
|---|
6/30/18 | $9,992 | $9,929 | $9,846 |
|---|
6/30/19 | $10,726 | $10,710 | $10,019 |
|---|
6/30/20 | $11,118 | $11,646 | $10,150 |
|---|
6/30/21 | $9,869 | $11,607 | $9,625 |
|---|
6/30/22 | $12,250 | $10,413 | $10,914 |
|---|
6/30/23 | $12,287 | $10,315 | $10,726 |
|---|
6/30/24 | $13,771 | $10,587 | $11,032 |
|---|
6/30/25 | $12,061 | $11,230 | $10,089 |
|---|
6/30/26 | $13,689 | $11,656 | $10,543 |
|---|
|
| AssetsNet |
$ 1,356,129
|
| Holdings Count | Holding |
7
|
| InvestmentCompanyPortfolioTurnover |
0.00%
|
| Additional Fund Statistics [Text Block] |
Fund Statistics as of June 30, 2026 - Net Assets$1,356,129
- Total Number of Portfolio Holdings7
- Portfolio Turnover Rate-%
|
| Holdings [Text Block] |
Holdings DiversificationFootnote Reference(1) (% of Net Assets) as of June 30, 2026 Table SummaryValue | Value |
|---|
OTC Currency Index Swap Agreements | 49.8% | Currency Futures Contracts Purchased | 148.8% | |
| Material Fund Change [Text Block] |
|
| C000010400 |
|
| Shareholder Report [Line Items] |
|
| Fund Name |
Weakening Dollar 2x Strategy Fund
|
| Class Name |
Variable Annuity
|
| No Trading Symbol [Flag] |
true
|
| Annual or Semi-Annual Statement [Text Block] |
This semi-annual shareholder report contains important information about the Weakening Dollar 2x Strategy Fund for the period from January 1, 2026 to June 30, 2026.
|
| Additional Information [Text Block] |
You can find additional information about the fund at GuggenheimInvestments.com/variable-insurance-funds. You can also request this information by contacting 800 820 0888 or services@guggenheiminvestments.com.
|
| Additional Information Phone Number |
800 820 0888
|
| Additional Information Email |
<span style="box-sizing: border-box; color: rgb(67, 67, 67); display: inline; flex-wrap: nowrap; font-size: 10.6667px; font-weight: 400; grid-area: auto; line-height: 12.8px; margin: 0px; overflow: visible; text-align: left; text-align-last: auto; white-space-collapse: preserve-breaks;">services@guggenheiminvestments.com</span>
|
| Additional Information Website |
<span style="box-sizing: border-box; color: rgb(67, 67, 67); display: inline; flex-wrap: nowrap; font-size: 10.6667px; font-weight: 400; grid-area: auto; line-height: 12.8px; margin: 0px; overflow: visible; text-align: left; text-align-last: auto; white-space-collapse: preserve-breaks;">GuggenheimInvestments.com/variable-insurance-funds</span>
|
| Expenses [Text Block] |
What were the Fund's costs for the last six months? * Based on a hypothetical $10,000 investment Table SummaryClass | Costs of a $10,000 Investment | Costs Paid as a % of a $10,000 Investment** |
|---|
Variable Annuity | $99 | 2.05% |
|---|
Table Summary* | Excludes expenses of the underlying funds in which the fund invests, if any. |
|---|
** | Annualized |
|---|
|
| Expenses Paid, Amount |
$ 99
|
| Factors Affecting Performance [Text Block] |
What factors materially affected the Fund's performance over the last six months? The components which positively contributed the most to the performance of the underlying index for the reporting period were euro, Japanese yen, and Canadian dollar. No components detracted from the performance of the underlying index. The fund maintained a daily correlation of over 97% to its benchmark of -200% of the daily price movement of the U.S. Dollar Index. |
| Line Graph [Table Text Block] |
Table Summary | Weakening Dollar 2x Strategy Fund | Bloomberg U.S. Aggregate Bond Index | U.S. Dollar Index |
|---|
6/30/16 | $10,000 | $10,000 | $10,000 |
|---|
6/30/17 | $9,841 | $9,969 | $9,968 |
|---|
6/30/18 | $9,664 | $9,929 | $9,846 |
|---|
6/30/19 | $8,976 | $10,710 | $10,019 |
|---|
6/30/20 | $8,267 | $11,646 | $10,150 |
|---|
6/30/21 | $8,959 | $11,607 | $9,625 |
|---|
6/30/22 | $6,740 | $10,413 | $10,914 |
|---|
6/30/23 | $6,741 | $10,315 | $10,726 |
|---|
6/30/24 | $6,319 | $10,587 | $11,032 |
|---|
6/30/25 | $7,424 | $11,230 | $10,089 |
|---|
6/30/26 | $6,701 | $11,656 | $10,543 |
|---|
|
| AssetsNet |
$ 3,549,039
|
| Holdings Count | Holding |
7
|
| InvestmentCompanyPortfolioTurnover |
0.00%
|
| Additional Fund Statistics [Text Block] |
Fund Statistics as of June 30, 2026 - Net Assets$3,549,039
- Total Number of Portfolio Holdings7
- Portfolio Turnover Rate-%
|
| Holdings [Text Block] |
Holdings DiversificationFootnote Reference(1) (% of Net Assets) as of June 30, 2026 Table SummaryValue | Value |
|---|
Currency Futures Contracts Sold Short | -156.4% | OTC Currency Index Swap Agreements Sold Short | -43.4% | |
| Material Fund Change [Text Block] |
|
| C000010403 |
|
| Shareholder Report [Line Items] |
|
| Fund Name |
Commodities Strategy Fund
|
| Class Name |
Variable Annuity
|
| No Trading Symbol [Flag] |
true
|
| Annual or Semi-Annual Statement [Text Block] |
This semi-annual shareholder report contains important information about the Commodities Strategy Fund for the period from January 1, 2026 to June 30, 2026.
|
| Additional Information [Text Block] |
You can find additional information about the fund at GuggenheimInvestments.com/variable-insurance-funds. You can also request this information by contacting 800 820 0888 or services@guggenheiminvestments.com.
|
| Additional Information Phone Number |
800 820 0888
|
| Additional Information Email |
<span style="box-sizing: border-box; color: rgb(67, 67, 67); display: inline; flex-wrap: nowrap; font-size: 10.6667px; font-weight: 400; grid-area: auto; line-height: 12.8px; margin: 0px; overflow: visible; text-align: left; text-align-last: auto; white-space-collapse: preserve-breaks;">services@guggenheiminvestments.com</span>
|
| Additional Information Website |
<span style="box-sizing: border-box; color: rgb(67, 67, 67); display: inline; flex-wrap: nowrap; font-size: 10.6667px; font-weight: 400; grid-area: auto; line-height: 12.8px; margin: 0px; overflow: visible; text-align: left; text-align-last: auto; white-space-collapse: preserve-breaks;">GuggenheimInvestments.com/variable-insurance-funds</span>
|
| Expenses [Text Block] |
What were the Fund's costs for the last six months? * Based on a hypothetical $10,000 investment Table SummaryClass | Costs of a $10,000 Investment | Costs Paid as a % of a $10,000 Investment** |
|---|
Variable Annuity | $91 | 1.65% |
|---|
Table Summary* | Excludes expenses of the underlying funds in which the fund invests, if any. |
|---|
** | Annualized |
|---|
|
| Expenses Paid, Amount |
$ 91
|
| Factors Affecting Performance [Text Block] |
What factors materially affected the Fund's performance over the last six months? The fund obtained exposure to the commodities markets through futures on the S&P Goldman Sachs Commodity Index (the "Index"). Energy and Industrial Metal sectors had some of the best sector performances for the reporting period. 14 of the 24 index components had positive returns for the period. The components with some of the largest positive returns were Gas Oil, Heating Oil and Gasoline. The components with some of the largest negative returns were Cocoa, Silver, and Corn. |
| Line Graph [Table Text Block] |
Table Summary | Commodities Strategy Fund | S&P 500 Index | S&P Goldman Sachs Commodity Index |
|---|
6/30/16 | $10,000 | $10,000 | $10,000 |
|---|
6/30/17 | $9,028 | $11,790 | $9,098 |
|---|
6/30/18 | $11,534 | $13,484 | $11,831 |
|---|
6/30/19 | $9,952 | $14,889 | $10,471 |
|---|
6/30/20 | $6,684 | $16,006 | $6,922 |
|---|
6/30/21 | $10,460 | $22,536 | $10,893 |
|---|
6/30/22 | $14,851 | $20,144 | $15,799 |
|---|
6/30/23 | $12,460 | $24,091 | $13,553 |
|---|
6/30/24 | $14,114 | $30,006 | $15,587 |
|---|
6/30/25 | $13,917 | $34,556 | $15,627 |
|---|
6/30/26 | $17,873 | $42,271 | $20,376 |
|---|
|
| AssetsNet |
$ 8,022,435
|
| Holdings Count | Holding |
9
|
| InvestmentCompanyPortfolioTurnover |
0.00%
|
| Additional Fund Statistics Significance or Limits [Text Block] |
Fund Statistics as of June 30, 2026 - Net Assets$8,022,435
- Total Number of Portfolio Holdings9
- Portfolio Turnover Rate-%
|
| Holdings [Text Block] |
Holdings DiversificationFootnote Reference(1) (% of Net Assets) as of June 30, 2026 Table SummaryValue | Value |
|---|
Commodity Futures Contracts Purchased | 100.6% | |
| Largest Holdings [Text Block] |
Largest HoldingsFootnote Reference(2) (% of Net Assets) as of June 30, 2026 Table SummaryGuggenheim Ultra Short Duration Fund — Institutional Class | 14.2% |
|---|
Federal Farm Credit Bank 3.75% (SOFR + 0.13%, Rate Floor: 0.00%) due 08/12/26 | 5.9% |
|---|
Guggenheim Ultra Short Income ETF | 5.8% |
|---|
Total | 25.9% |
|---|
|
| Material Fund Change [Text Block] |
|
| C000069235 |
|
| Shareholder Report [Line Items] |
|
| Fund Name |
Global Managed Futures Strategy Fund
|
| Class Name |
Variable Annuity
|
| No Trading Symbol [Flag] |
true
|
| Annual or Semi-Annual Statement [Text Block] |
This semi-annual shareholder report contains important information about the Global Managed Futures Strategy Fund for the period from January 1, 2026 to June 30, 2026.
|
| Additional Information [Text Block] |
You can find additional information about the fund at GuggenheimInvestments.com/variable-insurance-funds. You can also request this information by contacting 800 820 0888 or services@guggenheiminvestments.com.
|
| Additional Information Phone Number |
800 820 0888
|
| Additional Information Email |
<span style="box-sizing: border-box; color: rgb(67, 67, 67); display: inline; flex-wrap: nowrap; font-size: 10.6667px; font-weight: 400; grid-area: auto; line-height: 12.8px; margin: 0px; overflow: visible; text-align: left; text-align-last: auto; white-space-collapse: preserve-breaks;">services@guggenheiminvestments.com</span>
|
| Additional Information Website |
<span style="box-sizing: border-box; color: rgb(67, 67, 67); display: inline; flex-wrap: nowrap; font-size: 10.6667px; font-weight: 400; grid-area: auto; line-height: 12.8px; margin: 0px; overflow: visible; text-align: left; text-align-last: auto; white-space-collapse: preserve-breaks;">GuggenheimInvestments.com/variable-insurance-funds</span>
|
| Expenses [Text Block] |
What were the Fund's costs for the last six months? * Based on a hypothetical $10,000 investment Table SummaryClass | Costs of a $10,000 Investment | Costs Paid as a % of a $10,000 Investment** |
|---|
Variable Annuity | $103 | 2.03% |
|---|
Table Summary* | Excludes expenses of the underlying funds in which the fund invests, if any. |
|---|
** | Annualized |
|---|
|
| Expenses Paid, Amount |
$ 103
|
| Factors Affecting Performance [Text Block] |
What factors materially affected the Fund's performance over the last six months? The fund's trend-following strategy captures directional moves and gives back gains as trends reverse — H1 2026 showed this, driven by energy. Q1 Commodities dominated as Mideast conflict and closure of a key Gulf route sent crude sharply higher, and the model captured strong trends. These reversed in Q2 as a ceasefire and reopened routes triggered a rapid oil unwind, flipping Energy from top winner to top detractor. Precious Metals compounded this as easing risk, a stronger dollar, and rate shifts drove gold to its worst decline in a decade. Grains/Softs added drag. Equities were steadier, led by Asia/Europe. Overall, the fund posted strong H1 gains, partly reversed in Q2. |
| Line Graph [Table Text Block] |
Table Summary | Global Managed Futures Strategy Fund | S&P 500 Index | ICE BofA 3-Month U.S. Treasury Bill Index |
|---|
6/30/16 | $10,000 | $10,000 | $10,000 |
|---|
6/30/17 | $9,326 | $11,790 | $10,049 |
|---|
6/30/18 | $9,801 | $13,484 | $10,186 |
|---|
6/30/19 | $9,819 | $14,889 | $10,421 |
|---|
6/30/20 | $10,102 | $16,006 | $10,591 |
|---|
6/30/21 | $10,814 | $22,536 | $10,601 |
|---|
6/30/22 | $11,838 | $20,144 | $10,619 |
|---|
6/30/23 | $11,921 | $24,091 | $11,000 |
|---|
6/30/24 | $12,571 | $30,006 | $11,594 |
|---|
6/30/25 | $11,563 | $34,556 | $12,137 |
|---|
6/30/26 | $13,128 | $42,271 | $12,603 |
|---|
|
| AssetsNet |
$ 12,565,433
|
| Holdings Count | Holding |
75
|
| InvestmentCompanyPortfolioTurnover |
0.00%
|
| Additional Fund Statistics [Text Block] |
Fund Statistics as of June 30, 2026 - Net Assets$12,565,433
- Total Number of Portfolio Holdings75
- Portfolio Turnover Rate-%
|
| Holdings [Text Block] |
Holdings DiversificationFootnote Reference(1) (% of Net Assets) as of June 30, 2026 Table SummaryValue | Value |
|---|
Other | 3.8% | Interest Rate Futures Contracts Sold Short | -137.1% | Commodity Futures Contracts Sold Short | -31.5% | Currency Futures Contracts Sold Short | -29.6% | Interest Rate Futures Contracts Purchased | 16.0% | Equity Futures Contracts Purchased | 34.5% | Commodity Futures Contracts Purchased | 56.4% | |
| Largest Holdings [Text Block] |
Largest HoldingsFootnote Reference(2) (% of Net Assets) as of June 30, 2026 Table SummaryGuggenheim Strategy Fund III | 17.5% |
|---|
Guggenheim Ultra Short Income ETF | 0.9% |
|---|
Guggenheim Ultra Short Duration Fund — Institutional Class | 0.6% |
|---|
Total | 19.0% |
|---|
|
| Material Fund Change [Text Block] |
|
| C000010416 |
|
| Shareholder Report [Line Items] |
|
| Fund Name |
Multi-Hedge Strategies Fund
|
| Class Name |
Variable Annuity
|
| No Trading Symbol [Flag] |
true
|
| Annual or Semi-Annual Statement [Text Block] |
This semi-annual shareholder report contains important information about the Multi-Hedge Strategies Fund for the period from January 1, 2026 to June 30, 2026.
|
| Additional Information [Text Block] |
You can find additional information about the fund at GuggenheimInvestments.com/variable-insurance-funds. You can also request this information by contacting 800 820 0888 or services@guggenheiminvestments.com.
|
| Additional Information Phone Number |
800 820 0888
|
| Additional Information Email |
<span style="box-sizing: border-box; color: rgb(67, 67, 67); display: inline; flex-wrap: nowrap; font-size: 10.6667px; font-weight: 400; grid-area: auto; line-height: 12.8px; margin: 0px; overflow: visible; text-align: left; text-align-last: auto; white-space-collapse: preserve-breaks;">services@guggenheiminvestments.com</span>
|
| Additional Information Website |
<span style="box-sizing: border-box; color: rgb(67, 67, 67); display: inline; flex-wrap: nowrap; font-size: 10.6667px; font-weight: 400; grid-area: auto; line-height: 12.8px; margin: 0px; overflow: visible; text-align: left; text-align-last: auto; white-space-collapse: preserve-breaks;">GuggenheimInvestments.com/variable-insurance-funds</span>
|
| Expenses [Text Block] |
What were the Fund's costs for the last six months? * Based on a hypothetical $10,000 investment Table SummaryClass | Costs of a $10,000 Investment | Costs Paid as a % of a $10,000 Investment** |
|---|
Variable Annuity | $71 | 1.38% |
|---|
Table Summary* | Excludes expenses of the underlying funds in which the fund invests, if any. |
|---|
** | Annualized |
|---|
|
| Expenses Paid, Amount |
$ 71
|
| Factors Affecting Performance [Text Block] |
What factors materially affected the Fund's performance over the last six months? The fund's global macro strategies were the largest contributor during the period, with Trend (managed futures beta), Premia (Carry, Flow, and Value), and Core (multi-strategy beta) all posting positive contributions. Long/short equity was the second largest contributor and top performer in the first half, driven by fundamental (momentum, value) and industry (IT) tilts. Closed-end fund arbitrage also had modest positive contributions as none of the strategies in the fund detracted from performance over this period. |
| Line Graph [Table Text Block] |
Table Summary | Multi-Hedge Strategies Fund | S&P 500 Index | HFRX Global Hedge Fund Index |
|---|
6/30/16 | $10,000 | $10,000 | $10,000 |
|---|
6/30/17 | $10,056 | $11,790 | $10,600 |
|---|
6/30/18 | $9,892 | $13,484 | $10,862 |
|---|
6/30/19 | $10,265 | $14,889 | $10,650 |
|---|
6/30/20 | $10,809 | $16,006 | $10,979 |
|---|
6/30/21 | $12,264 | $22,536 | $12,298 |
|---|
6/30/22 | $11,862 | $20,144 | $11,669 |
|---|
6/30/23 | $11,850 | $24,091 | $11,822 |
|---|
6/30/24 | $12,364 | $30,006 | $12,462 |
|---|
6/30/25 | $11,502 | $34,556 | $13,054 |
|---|
6/30/26 | $12,622 | $42,271 | $14,315 |
|---|
|
| AssetsNet |
$ 27,170,502
|
| Holdings Count | Holding |
349
|
| InvestmentCompanyPortfolioTurnover |
78.00%
|
| Additional Fund Statistics [Text Block] |
Fund Statistics as of June 30, 2026 - Net Assets$27,170,502
- Total Number of Portfolio Holdings349
- Portfolio Turnover Rate78%
|
| Holdings [Text Block] |
Holdings DiversificationFootnote Reference(1) (% of Net Assets) as of June 30, 2026 Table SummaryValue | Value |
|---|
Other | -7.7% | Interest Rate Futures Contracts Sold Short | -53.3% | OTC Custom Basket Swap Agreements Sold Short | -25.7% | Commodity Futures Contracts Sold Short | -17.5% | Currency Futures Contracts Sold Short | -15.7% | Equity Futures Contracts Sold Short | -4.8% | Closed-End Mutual Funds | 5.3% | Currency Futures Contracts Purchased | 12.7% | Interest Rate Futures Contracts Purchased | 16.5% | Equity Futures Contracts Purchased | 16.5% | Commodity Futures Contracts Purchased | 19.7% | Common Stocks | 20.4% | OTC Custom Basket Swap Agreements | 40.2% | |
| Largest Holdings [Text Block] |
10 Largest HoldingsFootnote Reference(2) (% of Net Assets) as of June 30, 2026 Table SummaryGuggenheim Strategy Fund III | 9.1% |
|---|
Guggenheim Ultra Short Income ETF | 4.8% |
|---|
Guggenheim Ultra Short Duration Fund — Institutional Class | 2.0% |
|---|
Chart Industries, Inc. | 1.8% |
|---|
Janus Henderson Group plc | 1.0% |
|---|
DigitalBridge Group, Inc. | 1.0% |
|---|
Kenvue, Inc. | 1.0% |
|---|
International Money Express, Inc. | 1.0% |
|---|
Organon & Co. | 0.9% |
|---|
Sila Realty Trust, Inc. REIT | 0.9% |
|---|
Total | 23.5% |
|---|
|
| Material Fund Change [Text Block] |
|
| C000010379 |
|
| Shareholder Report [Line Items] |
|
| Fund Name |
U.S. Government Money Market Fund
|
| Class Name |
Variable Annuity
|
| No Trading Symbol [Flag] |
true
|
| Annual or Semi-Annual Statement [Text Block] |
This semi-annual shareholder report contains important information about the U.S. Government Money Market Fund for the period from January 1, 2026 to June 30, 2026.
|
| Additional Information [Text Block] |
You can find additional information about the fund at GuggenheimInvestments.com/variable-insurance-funds. You can also request this information by contacting 800 820 0888 or services@guggenheiminvestments.com.
|
| Additional Information Phone Number |
800 820 0888
|
| Additional Information Email |
<span style="box-sizing: border-box; color: rgb(67, 67, 67); display: inline; flex-wrap: nowrap; font-size: 10.6667px; font-weight: 400; grid-area: auto; line-height: 12.8px; margin: 0px; overflow: visible; text-align: left; text-align-last: auto; white-space-collapse: preserve-breaks;">services@guggenheiminvestments.com</span>
|
| Additional Information Website |
<span style="box-sizing: border-box; color: rgb(67, 67, 67); display: inline; flex-wrap: nowrap; font-size: 10.6667px; font-weight: 400; grid-area: auto; line-height: 12.8px; margin: 0px; overflow: visible; text-align: left; text-align-last: auto; white-space-collapse: preserve-breaks;">GuggenheimInvestments.com/variable-insurance-funds</span>
|
| Expenses [Text Block] |
What were the Fund's costs for the last six months? * Based on a hypothetical $10,000 investment Table SummaryClass | Costs of a $10,000 Investment | Costs Paid as a % of a $10,000 Investment** |
|---|
Variable Annuity | $70 | 1.40% |
|---|
Table Summary* | Excludes expenses of the underlying funds in which the fund invests, if any. |
|---|
** | Annualized |
|---|
|
| Expenses Paid, Amount |
$ 70
|
| Factors Affecting Performance [Text Block] |
What factors materially affected the Fund's performance over the last six months? During the reporting period, the U.S. Federal Open Market Committee kept short term interest rates unchanged. The committee noted throughout the reporting period that the economy continued to expand, and the unemployment rate had seen little change. Inflation has remained elevated above the committee’s 2 percent goal due to increases in prices in certain sectors. By the end of the reporting period, markets were pricing in over one 25 basis point (one basis point equals 0.01%) hike through the end of 2026. |
| AssetsNet |
$ 41,144,877
|
| Holdings Count | Holding |
18
|
| InvestmentCompanyPortfolioTurnover |
0.00%
|
| Additional Fund Statistics [Text Block] |
Fund Statistics as of June 30, 2026 - Net Assets$41,144,877
- Total Number of Portfolio Holdings18
- Portfolio Turnover Rate-%
|
| Holdings [Text Block] |
Holdings Diversification (% of Net Assets) as of June 30, 2026 Table SummaryValue | Value |
|---|
Federal Home Loan Bank - Federal Agency Notes | 9.7% | U.S. Treasury Bills | 15.5% | Federal Farm Credit Bank - Federal Agency Notes | 17.4% | Federal Home Loan Bank - Federal Agency Discount Notes | 17.9% | Repurchase Agreements | 39.8% | |
| Material Fund Change [Text Block] |
|