Pay Versus Performance
As required by Item 402(v) of Regulation S-K, we are providing the following disclosure regarding compensation actually paid (“CAP”) as defined by the Securities Exchange Commission to our principal executive officer (“PEO”) and non-PEO named executive officers (“Non-PEO NEOs”) and certain financial performance measures for the fiscal years listed below. The Compensation Committee did not consider the pay versus performance disclosure below as a basis for making its pay decisions, and the CAP calculations continue to be estimates at best of future value that may not be realized, but we do think that it is a more meaningful measure of pay and performance alliance than an unadjusted comparison of TSR to an estimate of compensation at a different, earlier point in time without accounting for subsequent events during the period. For further information regarding the Company’s pay for performance philosophy and how we seek to align executive compensation with the Company’s performance, please see “ Compensation Discussion and Analysis” above.
The amounts set forth below under the headings “Compensation Actually Paid to PEO” for our PEO and “Average Compensation Actually Paid to Non-PEO NEOs” have been calculated in a manner consistent with Item 402(v) of Regulation S-K.
|
Year (1) |
Summary (2) |
Compensation (3)(7) |
Average (4) |
Average (4) |
Value of (5) |
Net (6) |
||||||||||||||||||
|
2025 |
$ | 1,173,150 | $ | 778,306 | $ | 993,900 | $ | 910,682 | $ | 210.74 | $ | 9.687 | ||||||||||||
|
2024 |
$ | 2,595,060 | $ | 13,021,203 | $ | 676,342 | $ | 1,396,898 | $ | 223.21 | $ | 12.792 | ||||||||||||
|
2023 |
$ | 1,261,032 | $ | (1,486,908 | ) | $ | 674,888 | $ | 259,610 | $ | 67.55 | $ | (8.192 | ) | ||||||||||
|
(1) |
We are a smaller reporting company pursuant to Rule 405 of the Securities Act of 1933, and as such, we are only required to include information for the past three fiscal years in this table. |
|
(2) |
Our PEO for each of the applicable fiscal years 2025, 2024 and 2023 is Bryan Ganz, our former Chief Executive Officer. Mr. Ganz retired from serving as Chief Executive Officer effective March 2, 2026. |
|
(3) |
In calculating the CAP, the fair value or change in fair value, as applicable, of the equity awards included in such calculations was computed in accordance with FASB ASC Topic 718 and the valuation assumptions used to calculate fair values were determined in a consistent manner and did not materially differ from those disclosed at the time of grant. |
|
(4) |
Our Non-PEO NEOs for fiscal year 2025 are Ms. Kearnes and Mr. Pham; for fiscal year 2024 are Ms. Kearnes, Mr. Pham, and David North, our former Chief Financial Officer; and for fiscal year 2023 are Mr. North and Mr. Pham. For the fiscal year 2024 the average is based on three individuals. However, Ms. Kearnes and Mr. North each held the position of Chief Financial Officer for a portion of the year. |
|
(5) |
Pursuant to the SEC rules, the Total Shareholder Return (“TSR”) reflected in this column assumes $100 was invested on November 30, 2022 in our common stock. Historic stock price performance is not necessarily indicative of future stock price performance. |
|
(6) |
The amounts reflected in this column represent the net income (loss) reflected in our audited financial statements for each applicable fiscal year. |
EXECUTIVE COMPENSATION
|
(7) |
For fiscal years 2025, 2024 and 2023, calculation of our PEO’s CAP reflects adjustments made to the total compensation amounts reported in the Summary Compensation Table (“SCT”) for those fiscal year, computed in accordance with Item 402(v) of Regulation S-K. The CAP dollar amounts included in the table do not reflect the actual amount of compensation earned by the executive or paid by us during the applicable year. The adjustments made to the SCT total for purposes of calculating CAP, in accordance with the relevant rules, are reflected below: |
|
Fiscal Year |
2025 |
2024 |
2023 |
|||||||||
|
PEO SCT Total |
$ | 1,173,150 | $ | 2,595,060 | $ | 1,261,032 | ||||||
|
- Grant Date Fair Value of Option Awards and Stock Awards Granted in Fiscal Year(A) |
$ | 0 | $ | (2,479,500 | ) | $ | (424,782 | ) | ||||
|
+ Fair Value at Fiscal Year-End of Outstanding and Unvested Option Awards and Stock Awards Granted in Fiscal Year |
$ | 0 | $ | 10,534,850 | $ | 239,998 | ||||||
|
+ Year-Over-Year Change in Fair Value of Outstanding and Unvested Option Awards and Stock Awards Granted in Prior Fiscal Years |
$ | (623,492 | ) | $ | 1,764,319 | $ | (571,500 | ) | ||||
|
+ Fair Value at Vesting Date of Option Awards and Stock Awards Granted in Fiscal Year that Vested During Fiscal Year |
$ | 0 | $ | 0 | $ | 0 | ||||||
|
+ Change in Fair Value as of Vesting Date of Option Awards and Stock Awards Granted in Prior Fiscal Years that Vested During Fiscal Year |
$ | 228,648 | $ | 606,474 | $ | (1,990,875 | ) | |||||
|
- Fair Value as of Prior Fiscal Year-End of Option Awards and Stock Awards Granted in Prior Fiscal Years that Failed to Meet Applicable Vesting Conditions During Fiscal Year |
$ | 0 | $ | 0 | $ | (780 | ) | |||||
|
Compensation Actually Paid to PEO |
$ | 778,306 | $ | 13,021,203 | $ | (1,486,908 | ) | |||||
|
(A) For 2023, this amount represents the grant date fair value of 66,666 options. For additional information, see Note 4 to the Summary Compensation Table |
|
(8) |
For fiscal years 2025, 2024 and 2023, calculation of the average CAP for Non-PEO NEOs reflects the following adjustments made to the total compensation amounts reported for the applicable Non-PEO NEOs for those fiscal years, computed in accordance with Item 402(v) of Regulation S-K. The CAP dollar amounts included in the table do not reflect the actual amount of compensation earned by the executives or paid by us during the applicable year. The adjustments made to the SCT total for purposes of calculating CAP, in accordance with the relevant rules, are: |
|
Fiscal Year |
2025 |
2024 |
2023 |
|||||||||
|
Non-PEO NEO Average SCT Total |
$ | 993,900 | $ | 676,342 | $ | 674,888 | ||||||
|
- Grant Date Fair Value of Option Awards and Stock Awards Granted in Fiscal Year |
$ | (355,011 | ) | $ | (240,996 | ) | $ | (212,388 | ) | |||
|
+ Fair Value at Fiscal Year-End of Outstanding and Unvested Option Awards and Stock Awards Granted in Fiscal Year |
$ | 272,454 | $ | 519,070 | $ | 119,999 | ||||||
|
+ Year over Year Change in Fair Value of Outstanding and Unvested Option Awards and Stock Awards Granted in Prior Fiscal Years |
$ | (48,129 | ) | $ | 215,995 | $ | (220,159 | ) | ||||
|
+ Fair Value at Vesting Date of Option Awards and Stock Awards Granted in Fiscal Year that Vested During Fiscal Year |
$ | 0 | $ | 0 | $ | 0 | ||||||
|
+ Change in Fair Value as of Vesting Date of Option Awards and Stock Awards Granted in Prior Fiscal that Vested During Fiscal Year |
$ | 47,469 | $ | 226,487 | $ | (102,678 | ) | |||||
|
- Fair Value as of Prior Fiscal Year-End of Option Awards and Stock Awards Granted in Prior Fiscal Years that Failed to Meet Applicable Vesting Conditions During Fiscal Year |
$ | 0 | $ | 0 | $ | (53 | ) | |||||
|
Average Compensation Actually Paid |
$ | 910,682 | $ | 1,396,898 | $ | 259,610 | ||||||
In accordance with Item 402(v) of Regulation S-K, we are providing the following descriptions of the relationships between the information presented in the table above.
EXECUTIVE COMPENSATION
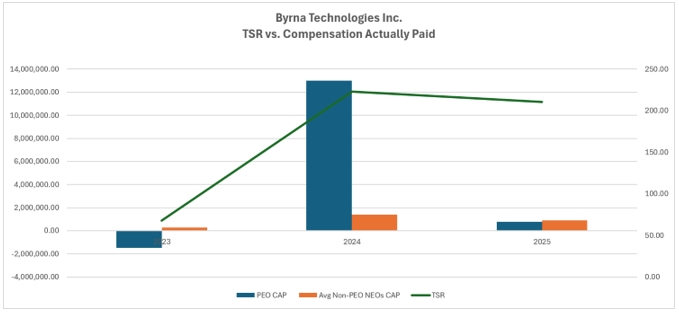
Relationship between Compensation Actually Paid and Company TSR
The following graph sets forth the relationship between the CAP for our PEO, the average of CAP for our Non-PEO NEOs, and the Company’s cumulative Total Shareholder Return (“TSR”) over the three most recently completed fiscal years.
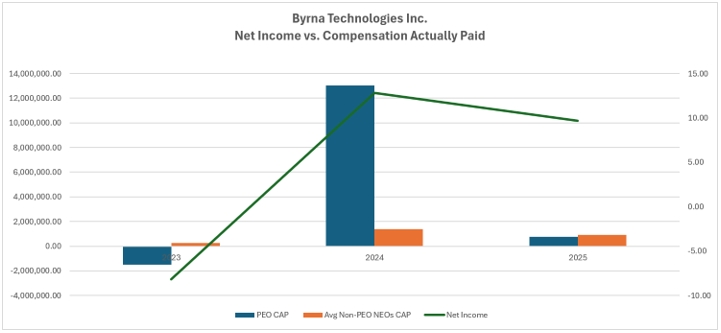
Compensation Actually Paid and Net Income (Loss)
The following graph sets forth the relationship between CAP for our PEO, the average of CAP for our Non-PEO NEOs, and the Company’s net income (loss) over the three most recently completed fiscal years.
All information provided above under the “Pay Versus Performance” heading will not be deemed to be incorporated by reference into any filing of the Company under the Securities Act of 1933, as amended, or the Exchange Act, whether made before or after the date hereof and irrespective of any general incorporation language in any such filing, except to the extent the Company specifically incorporates such information by reference.
EXECUTIVE COMPENSATION