Shareholder Report
|
12 Months Ended |
|
Jun. 30, 2026
USD ($)
Holding
|
|---|
| Shareholder Report [Line Items] |
|
| Document Type |
N-CSR
|
| Amendment Flag |
false
|
| Registrant Name |
NEW COVENANT FUNDS
|
| Entity Central Index Key |
0001070222
|
| Entity Investment Company Type |
N-1A
|
| Document Period End Date |
Jun. 30, 2026
|
| C000074154 |
|
| Shareholder Report [Line Items] |
|
| Fund Name |
New Covenant Growth Fund
|
| Trading Symbol |
NCGFX
|
| Annual or Semi-Annual Statement [Text Block] |
Annual Shareholder Report
|
| Shareholder Report Annual or Semi-Annual |
annual shareholder report
|
| Additional Information [Text Block] |
This annual shareholder report contains important information about New Covenant Growth Fund (the "Fund") for the period from July 1, 2025 to June 30, 2026. You can find additional information about the Fund at https://www.seic.com/mutual-fund-documentation/prospectuses-and-reports. You can also request this information by contacting us at 877-835-4531.
|
| Additional Information Phone Number |
877-835-4531
|
| Additional Information Website |
https://www.seic.com/mutual-fund-documentation/prospectuses-and-reports
|
| Expenses [Text Block] |
What were the Fund costs for the last year?(based on a hypothetical $10,000 investment) Table SummaryFund Name | Costs of a $10,000 investment | Costs paid as a percentage of a $10,000 investment |
|---|
New Covenant Growth Fund | $80 | 0.72% |
|---|
|
| Expenses Paid, Amount |
$ 80
|
| Expense Ratio, Percent |
0.72%
|
| Factors Affecting Performance [Text Block] |
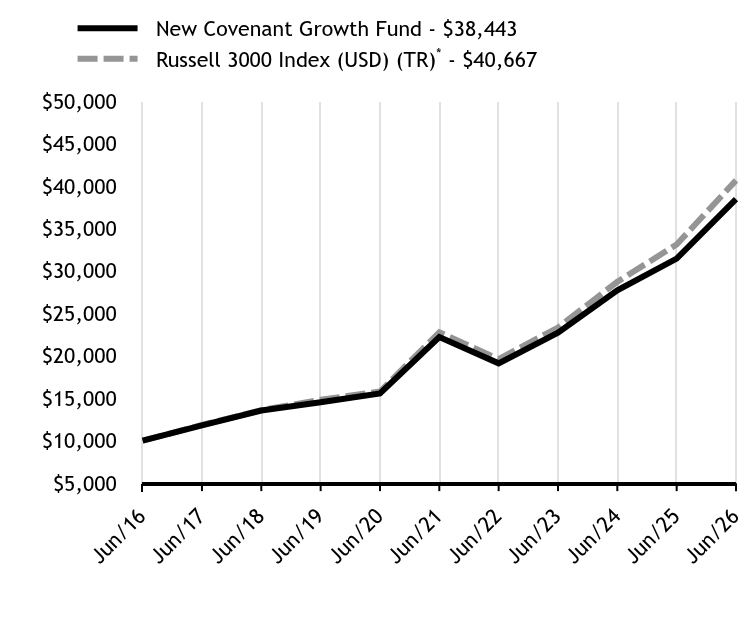
How did the Fund perform in the last year? The Fund modestly underperformed its benchmark, the Russell 3000 Index (USD) (TR) — which tracks the performance of the 3,000 largest U.S. companies representing approximately 96% of the investable U.S. equity market — for the 12-month period ending June 30, 2026. The Fund’s holdings in the energy sector lagged relative to the benchmark’s energy sector holdings, weighing on performance for the reporting period. Fund performance was enhanced by an overweight to the semiconductor sector but was hampered by an underweight to the aerospace and defense industry, which outperformed within the benchmark. The Fund also benefited from not owning tobacco company stocks, as the sector underperformed within the benchmark Russell 3000 Index (USD) (TR) for the reporting period. |
| Performance Past Does Not Indicate Future [Text] |
Past performance is not indicative of future performance.
|
| Line Graph [Table Text Block] |
Table Summary | New Covenant Growth Fund | Russell 3000 Index (USD) (TR)Footnote Reference* |
|---|
Jun/16 | $10,000 | $10,000 |
|---|
Jun/17 | $11,812 | $11,851 |
|---|
Jun/18 | $13,553 | $13,602 |
|---|
Jun/19 | $14,530 | $14,824 |
|---|
Jun/20 | $15,573 | $15,792 |
|---|
Jun/21 | $22,205 | $22,767 |
|---|
Jun/22 | $19,114 | $19,610 |
|---|
Jun/23 | $22,714 | $23,327 |
|---|
Jun/24 | $27,706 | $28,721 |
|---|
Jun/25 | $31,440 | $33,114 |
|---|
Jun/26 | $38,443 | $40,667 |
|---|
|
| AssetsNet |
$ 580,052,000
|
| Holdings Count | Holding |
1,510
|
| Advisory Fees Paid, Amount |
$ 1,288
|
| InvestmentCompanyPortfolioTurnover |
5.00%
|
| Additional Fund Statistics [Text Block] |
Key Fund Statistics as of June 30, 2026Table Summary | Total Net Assets (000's) | Number of Holdings | Total Advisory Fees Paid (000's) | Portfolio Turnover Rate |
|---|
| $580,052 | 1,510 | $1,288 | 5% |
|---|
|
| Holdings [Text Block] |
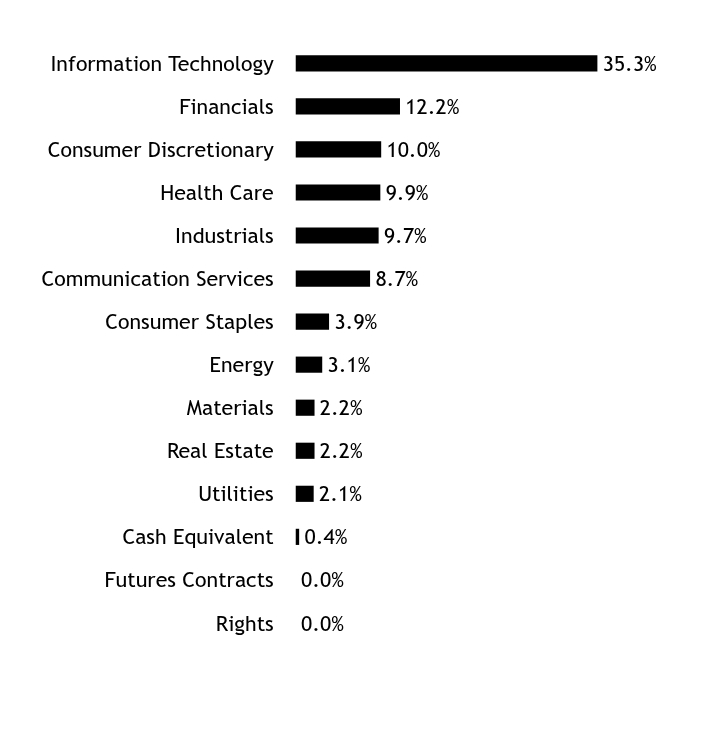
Asset/Sector WeightingsFootnote Reference*Table SummaryValue | Value |
|---|
Rights | 0.0% | Futures Contracts | 0.0% | Cash Equivalent | 0.4% | Utilities | 2.1% | Real Estate | 2.2% | Materials | 2.2% | Energy | 3.1% | Consumer Staples | 3.9% | Communication Services | 8.7% | Industrials | 9.7% | Health Care | 9.9% | Consumer Discretionary | 10.0% | Financials | 12.2% | Information Technology | 35.3% | | Footnote | Description | Footnote* | Percentages are calculated based on total net assets. |
|
| Largest Holdings [Text Block] |
Table SummaryHolding Name | | | Percentage of
Total Net AssetsFootnote Reference(A) |
|---|
NVIDIA Corp | | | 6.5% | Apple Inc | | | 5.8% | Microsoft Corp | | | 4.0% | Amazon.com Inc | | | 3.3% | Alphabet Inc, Cl A | | | 2.8% | Broadcom Inc | | | 2.5% | Alphabet Inc, Cl C | | | 2.2% | Micron Technology Inc | | | 1.8% | Tesla Inc | | | 1.8% | Meta Platforms Inc, Cl A | | | 1.6% | | Footnote | Description | Footnote(A) | Cash Equivalents are not shown in the top ten holdings. |
|
| Material Fund Change [Text Block] |
There were no material changes during the reporting period. |
| C000074155 |
|
| Shareholder Report [Line Items] |
|
| Fund Name |
New Covenant Income Fund
|
| Trading Symbol |
NCICX
|
| Annual or Semi-Annual Statement [Text Block] |
Annual Shareholder Report
|
| Shareholder Report Annual or Semi-Annual |
annual shareholder report
|
| Additional Information [Text Block] |
This annual shareholder report contains important information about New Covenant Income Fund (the "Fund") for the period from July 1, 2025 to June 30, 2026. You can find additional information about the Fund at https://www.seic.com/mutual-fund-documentation/prospectuses-and-reports. You can also request this information by contacting us at 877-835-4531.
|
| Additional Information Phone Number |
877-835-4531
|
| Additional Information Website |
https://www.seic.com/mutual-fund-documentation/prospectuses-and-reports
|
| Expenses [Text Block] |
What were the Fund costs for the last year?(based on a hypothetical $10,000 investment) Table SummaryFund Name | Costs of a $10,000 investment | Costs paid as a percentage of a $10,000 investment |
|---|
New Covenant Income Fund | $76 | 0.75% |
|---|
|
| Expenses Paid, Amount |
$ 76
|
| Expense Ratio, Percent |
0.75%
|
| Factors Affecting Performance [Text Block] |
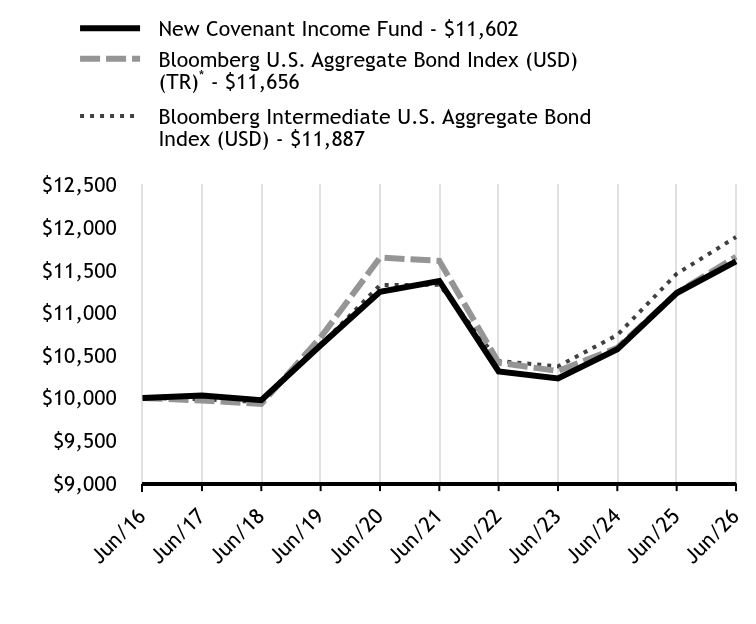
How did the Fund perform in the last year? The Fund modestly underperformed its benchmark, the Bloomberg Intermediate U.S. Aggregate Bond Index (USD) (TR) — which tracks the performance of fixed-rate, publicly issued, investment-grade bonds — for the 12-month period ending June 30, 2026. During the reporting period, the Federal Reserve ("Fed") reduced its benchmark interest rate by a cumulative 75 basis points in the final four months of 2025, to a target range of 3.50% to 3.75%, and then remained on hold through June 2026. The steady rate path occurred as inflation remained above the Fed’s 2% target and geopolitical tensions in the Middle East contributed to higher energy prices and uncertainty around the outlook for inflation and interest rates. Fund performance for the reporting period was supported by an overweight to agency mortgage-backed securities ("MBS"). Security selection within the sector also contributed to performance, as the Fund’s managers generally favored specified pools over to-be-announced ("TBA") exposure. (TBA securities are forward contracts to buy or sell mortgage-backed securities ("MBS") without immediately identifying the exact underlying loans.) An underweight to corporate credit was a detractor as spreads remained tight during the reporting period, although this was partially offset by positive security selection within the corporate sector. An overweight to asset-backed securities ("ABS") bolstered Fund performance, with the managers generally favoring prime tranches, and an allocation to AAA rated collateralized loan obligations ("CLOs") also had a positive impact. A slightly long duration posture and an overweight to the 2-year segment of the yield curve weighed on Fund performance as the market shifted from pricing in additional rate cuts in 2026 to considering the possibility of a less accommodative Federal Reserve monetary policy path. At the Fund manager level, Income Research + Management benefited from positioning within the ABS sector and security selection in corporate bonds. Metropolitan West Asset Management LLC’s performance was enhanced by overweight allocations to agency MBS and AAA rated CLOs, while an underweight to corporate bonds and yield-curve positioning detracted from performance. |
| Performance Past Does Not Indicate Future [Text] |
Past performance is not indicative of future performance.
|
| Line Graph [Table Text Block] |
Table Summary | New Covenant Income Fund | Bloomberg U.S. Aggregate Bond Index (USD) (TR)Footnote Reference* | Bloomberg Intermediate U.S. Aggregate Bond Index (USD) |
|---|
Jun/16 | $10,000 | $10,000 | $10,000 |
|---|
Jun/17 | $10,028 | $9,969 | $9,984 |
|---|
Jun/18 | $9,973 | $9,929 | $9,952 |
|---|
Jun/19 | $10,618 | $10,710 | $10,621 |
|---|
Jun/20 | $11,246 | $11,646 | $11,323 |
|---|
Jun/21 | $11,372 | $11,608 | $11,328 |
|---|
Jun/22 | $10,310 | $10,413 | $10,433 |
|---|
Jun/23 | $10,229 | $10,315 | $10,370 |
|---|
Jun/24 | $10,570 | $10,587 | $10,738 |
|---|
Jun/25 | $11,230 | $11,230 | $11,456 |
|---|
Jun/26 | $11,602 | $11,656 | $11,887 |
|---|
|
| AssetsNet |
$ 350,805,000
|
| Holdings Count | Holding |
852
|
| Advisory Fees Paid, Amount |
$ 953
|
| InvestmentCompanyPortfolioTurnover |
285.00%
|
| Additional Fund Statistics [Text Block] |
Key Fund Statistics as of June 30, 2026Table Summary | Total Net Assets (000's) | Number of Holdings | Total Advisory Fees Paid (000's) | Portfolio Turnover Rate |
|---|
| $350,805 | 852 | $953 | 285% |
|---|
|
| Holdings [Text Block] |
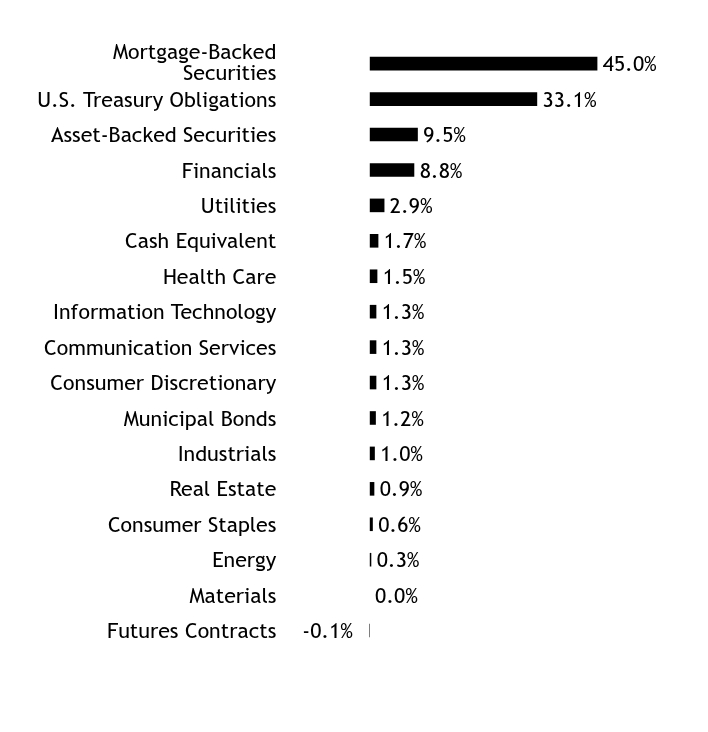
Asset/Sector WeightingsFootnote Reference*Table SummaryValue | Value |
|---|
Futures Contracts | -0.1% | Materials | 0.0% | Energy | 0.3% | Consumer Staples | 0.6% | Real Estate | 0.9% | Industrials | 1.0% | Municipal Bonds | 1.2% | Consumer Discretionary | 1.3% | Communication Services | 1.3% | Information Technology | 1.3% | Health Care | 1.5% | Cash Equivalent | 1.7% | Utilities | 2.9% | Financials | 8.8% | Asset-Backed Securities | 9.5% | U.S. Treasury Obligations | 33.1% | Mortgage-Backed Securities | 45.0% | | Footnote | Description | Footnote* | Percentages are calculated based on total net assets. |
|
| Largest Holdings [Text Block] |
Table SummaryHolding Name | Coupon Rate | Maturity Date | Percentage of Total
Net AssetsFootnote Reference(A) |
|---|
U.S. Treasury Notes | 4.125%
| 06/30/28
| 8.9% | U.S. Treasury Notes | 4.125%
| 05/31/31
| 4.9% | U.S. Treasury Notes | 4.125%
| 06/30/31
| 4.0% | U.S. Treasury Notes | 4.000%
| 05/31/28
| 3.0% | U.S. Treasury Notes | 3.500%
| 02/28/31
| 2.3% | FNMA | 3.500%
| 07/15/56
| 2.2% | U.S. Treasury Notes | 3.875%
| 05/15/29
| 1.9% | U.S. Treasury Notes | 4.125%
| 02/15/36
| 1.5% | U.S. Treasury Notes | 4.125%
| 06/15/29
| 1.2% | U.S. Treasury Notes | 4.250%
| 06/30/33
| 1.2% | | Footnote | Description | Footnote(A) | Cash Equivalents are not shown in the top ten holdings. |
|
| Material Fund Change [Text Block] |
There were no material changes to the Fund during the reporting period. |
| C000013702 |
|
| Shareholder Report [Line Items] |
|
| Fund Name |
New Covenant Balanced Growth Fund
|
| Trading Symbol |
NCBGX
|
| Annual or Semi-Annual Statement [Text Block] |
Annual Shareholder Report
|
| Shareholder Report Annual or Semi-Annual |
annual shareholder report
|
| Additional Information [Text Block] |
This annual shareholder report contains important information about New Covenant Balanced Growth Fund (the "Fund") for the period from July 1, 2025 to June 30, 2026. You can find additional information about the Fund at https://www.seic.com/mutual-fund-documentation/prospectuses-and-reports. You can also request this information by contacting us at 877-835-4531.
|
| Additional Information Phone Number |
877-835-4531
|
| Additional Information Website |
https://www.seic.com/mutual-fund-documentation/prospectuses-and-reports
|
| Expenses Paid, Amount |
$ 14
|
| Expense Ratio, Percent |
0.13%
|
| Performance Past Does Not Indicate Future [Text] |
Past performance is not indicative of future performance.
|
| AssetsNet |
$ 373,465,000
|
| Holdings Count | Holding |
3
|
| Advisory Fees Paid, Amount |
$ 0
|
| InvestmentCompanyPortfolioTurnover |
8.00%
|
| C000074153 |
|
| Shareholder Report [Line Items] |
|
| Fund Name |
New Covenant Balanced Income Fund
|
| Trading Symbol |
NCBIX
|
| Annual or Semi-Annual Statement [Text Block] |
Annual Shareholder Report
|
| Shareholder Report Annual or Semi-Annual |
annual shareholder report
|
| Additional Information [Text Block] |
This annual shareholder report contains important information about New Covenant Balanced Income Fund (the "Fund") for the period from July 1, 2025 to June 30, 2026. You can find additional information about the Fund at https://www.seic.com/mutual-fund-documentation/prospectuses-and-reports. You can also request this information by contacting us at 877-835-4531.
|
| Additional Information Phone Number |
877-835-4531
|
| Additional Information Website |
https://www.seic.com/mutual-fund-documentation/prospectuses-and-reports
|
| Expenses Paid, Amount |
$ 16
|
| Expense Ratio, Percent |
0.15%
|
| Performance Past Does Not Indicate Future [Text] |
Past performance is not indicative of future performance.
|
| AssetsNet |
$ 76,730,000
|
| Holdings Count | Holding |
3
|
| Advisory Fees Paid, Amount |
$ 0
|
| InvestmentCompanyPortfolioTurnover |
8.00%
|