Exhibit 99.5
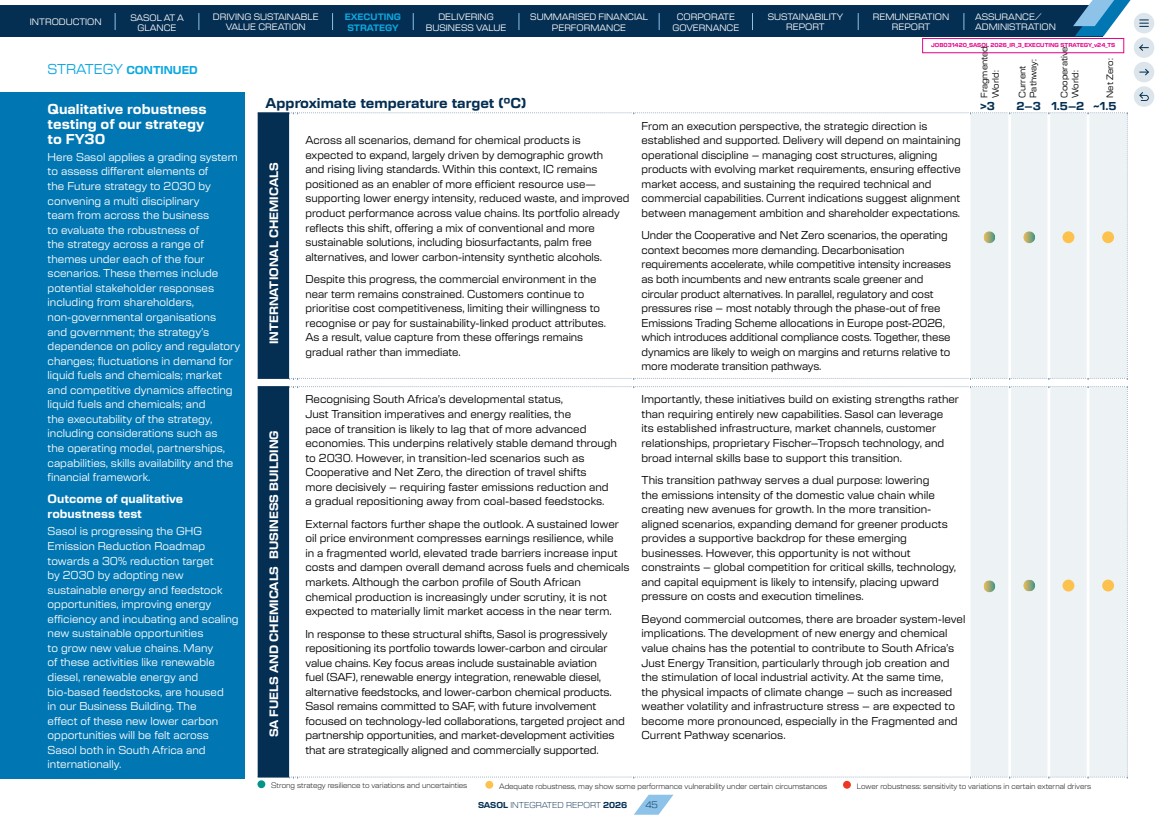
| EBITDA: US$450 – 600 million EBITDA margin: 10 – 12% US$53 – US$58/bbl oil breakeven STRATEGY Sasol’s strategic intent is to enhance near-term value delivery while laying the foundations for sustainable long-term growth. Delivering full potential while positioning for long-term value 1 STRENGTHEN FOUNDATION Business of today Strategic pillar This is underpinned by disciplined execution, portfolio resilience and rigorous capital allocation, guided by clear trade-offs between performance, balance sheet strength and the pace of transformation. Through this approach, Sasol aims to build a more resilient, competitive and future-ready business, aligned with integrated value creation and supported by clear delivery against defined targets. US$55 – US$60/bbl oil breakeven. EBITDA**: US$375 – 450 million EBITDA margin: 8 – 10% Delivered SA brent oil breakeven US$49/bbl. (Includes~US$6 – 9/bbl impact)* Delivered US$604 million Adjusted EBITDA EBITDA margin 12%. (Includes ~US$150 – 200m EBITDA and 2 – 3% EBITDA margin impact)*** Restore and stabilise the Southern Africa integrated value chain to be a reliable supplier and deliver competitive costs and resilient cash generation through the cycle. Reset to deliver structurally competitive margins, strong cash generation in line with peers through the cycle, and leading customer focus among peers. Improve coal feedstock quality and mining performance Restore operational reliability across the value chain Enhance cost competitiveness and margins Improved EBITDA performance over the cycle Improve portfolio resilience and returns Reduce fixed costs and reset the operating model Priorities Priorities Southern Africa Energy and Chemicals International Chemicals (IC) S1 S2 Strategic objective Strategic objective US$50/bbl oil breakeven for value chain by FY28. EBITDA: US$750 – US$850 million and >15% EBITDA margin by FY28. OUTLOOK OUTLOOK FY26 FY26 FY27 TARGET FY27 TARGET ** Earnings before interest, tax, depreciation and amortisation *** Includes the benefit of a more supportive macro-economic environment in in Q4 FY26 * Includes the benefit of no SO shutdown in FY26 and a more supportive macro-economic environment in Q4 FY26 SASOL INTEGRATED REPORT 2026 39 JOB031420_SASOL 2026_IR_3_EXECUTING STRATEGY_v24_TS INTRODUCTION SUMMARISED FINANCIAL PERFORMANCE SUSTAINABILITY REPORT SASOL AT A GLANCE DRIVING SUSTAINABLE VALUE CREATION EXECUTING STRATEGY DELIVERING BUSINESS VALUE CORPORATE GOVERNANCE ASSURANCE/ ADMINISTRATION REMUNERATION REPORT |
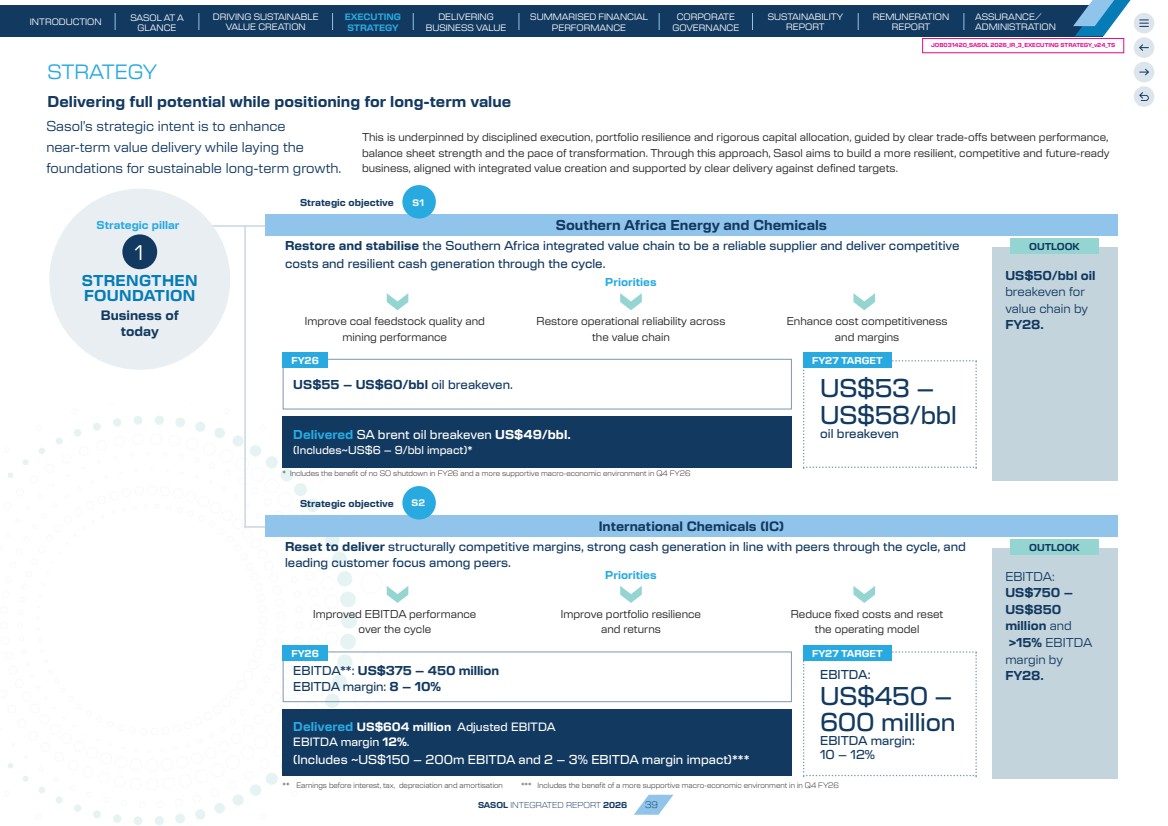
| GROW AND TRANSFORM Business of tomorrow Sasol’s strategy provides a clear pathway to near-term value delivery and optionality for long-term value creation The strategy is anchored in defined commitments through FY28, providing a clear pathway to strengthen the foundation, advance growth and transformation, resulting in financial resilience being restored. In parallel, work is underway to define the company’s ambition beyond FY28, clarifying the strategic direction, portfolio choices and trade-offs required for sustained competitiveness and long-term value creation. Strategic pillar 2 Partial fine coal solution: Commissioning of fine coal beneficiation facility. Delivered fine coal beneficiation facility (Destoning) in December 2025 as a key enabler for the emission reduction roadmap delivery Refer to pages 53 and 56 for more details. Achieved ISCC+ certification for renewable diesel, SAF and comonomer products via our Natref and Secunda facilities Grow and transform by reducing portfolio carbon intensity while scaling value-accretive, lower-carbon businesses that enhance long-term resilience and shareholder value. Scale a competitive renewable energy platform Advance sustainable fuels and chemicals selectively Protect and extend value from the gas value chain Priorities STRATEGY CONTINUED Business building Strategic objective S3 Approximately 2GW RE operational by FY30+ >10mt Scope 2 GHG reduction by FY30 (cumulative) OUTLOOK FY26 1 – 2 million litres per annum sustainable product offtake. FY27 TARGET SASOL INTEGRATED REPORT 2026 40 JOB031420_SASOL 2026_IR_3_EXECUTING STRATEGY_v24_TS INTRODUCTION SUMMARISED FINANCIAL PERFORMANCE SUSTAINABILITY REPORT SASOL AT A GLANCE DRIVING SUSTAINABLE VALUE CREATION EXECUTING STRATEGY DELIVERING BUSINESS VALUE CORPORATE GOVERNANCE ASSURANCE/ ADMINISTRATION REMUNERATION REPORT |
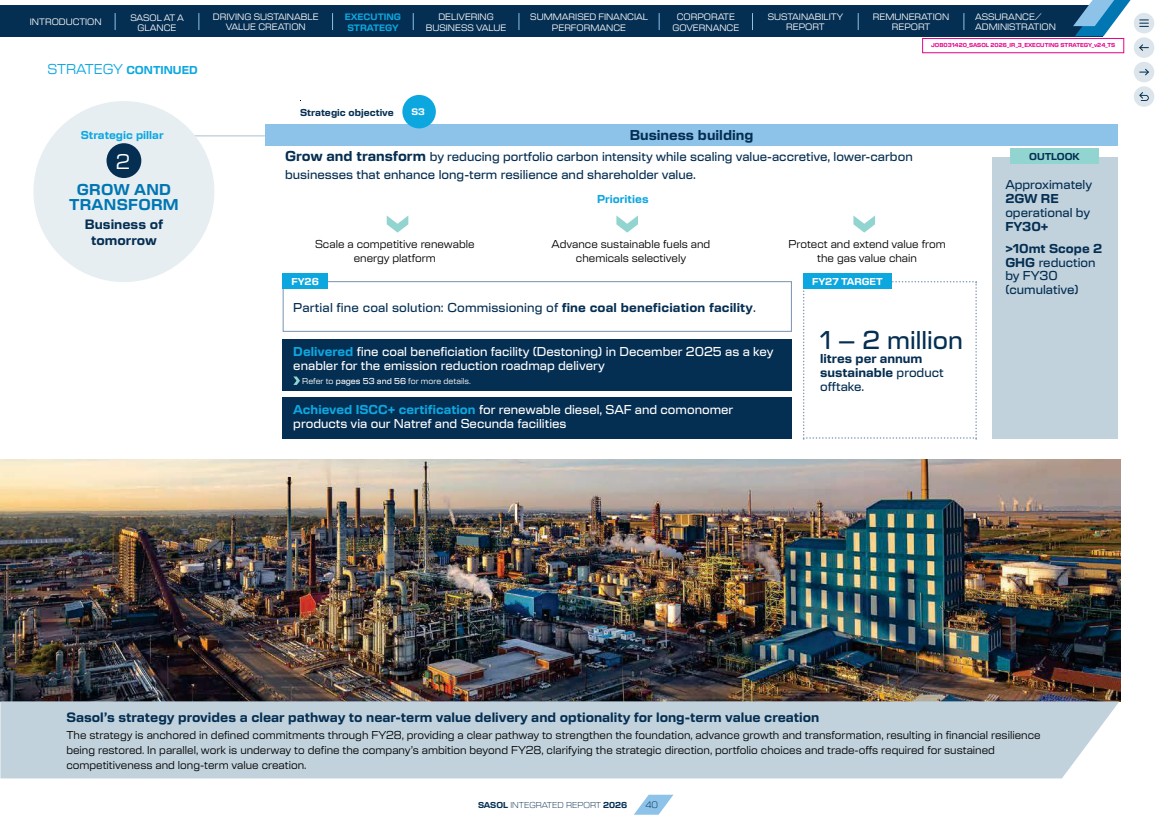
| STRATEGY CONTINUED Sasol’s strategy remains relevant despite heightened volatility across the energy and chemicals sectors, characterised by shifting market dynamics and capital constraints. The focus has sharpened on delivery; stabilising near-term performance, rebuilding momentum and creating the financial headroom to pursue future growth and transformation opportunities. Credibility through disciplined execution S1 S2 S3 SA Brent oil break even US$49/bbl EBITDA US$604m ~510MW RE is already online The renewable power platform has entered scaled execution, and achieving early cost savings and reducing carbon intensity aligned with our ERR. Renewable energy trading licence received and early cost savings and Scope 2 emission reductions achieved. Sustainable fuels and products have been de-risked through early-stage milestones, including ISCC+ readiness, progression of Sustainable Aviation Fuel at Natref and the establishment of technology partnerships, creating credible development pathways. Across business building, execution has moved from concept to delivery. The strategic reset initiatives are driving disciplined self-help actions, prioritising cost reduction, portfolio optimisation and operational reliability rather than reliance on market recovery. Decisive portfolio actions, including mothballing and closures across selected assets such as European Union (EU) Alkylphenol and the HF linear alkyl benzene (HF-LAB), US Guerbet alcohols and America Phenolics, have reduced structural losses. Approximately US$150 — 200m of Adjusted EBITDA is directly as a result of the benefit of stronger pricing associated with the Middle East conflict. Coal quality has improved with the destoning plant online, while Mining initiatives to improve own coal production and reduce external purchases will continue into FY27. Southern Africa cost competitiveness has improved, with FY26 breakeven of approximately US$49/bbl achieved, in line with market guidance. Excluding the macroeconomic tailwinds and the absence of a Secunda shutdown, the breakeven would have been US$55 – 58/bbl. This improvement reflects the outcome of focused execution across the value chain, even against a backdrop of continued external market volatility seen in FY26 as a result of the Middle East conflict. Operational reliability across the core asset base has also strengthened and improved, with Secunda sustaining production above 7,2Mt, gasifier availability consistently exceeding targets at around 87%, and Natref improvement from FY25, demonstrating regained operational control. Gas continues to play a strategic bridging role, with Mozambique gas solutions sustaining near-term value while longer-term structural enablers such as policy, pricing, production sharing agreement coming online and long-term LNG options are actively advanced. In the near term, methane rich gas from Secunda will successfully bridge the supply for external customers until LNG is available, subject to pricing considerations. In parallel, the emission reduction roadmap (ERR) has been reset to materially lower capital intensity, avoid Secunda turndown and better align decarbonisation with value protection. Driving disciplined execution against our Capital Market Commitments to reset and strengthen the IC business. In Southern Africa, performance improvement efforts are translating into tangible outcomes. SASOL INTEGRATED REPORT 2026 41 JOB031420_SASOL 2026_IR_3_EXECUTING STRATEGY_v24_TS INTRODUCTION SUMMARISED FINANCIAL PERFORMANCE SUSTAINABILITY REPORT SASOL AT A GLANCE DRIVING SUSTAINABLE VALUE CREATION EXECUTING STRATEGY DELIVERING BUSINESS VALUE CORPORATE GOVERNANCE ASSURANCE/ ADMINISTRATION REMUNERATION REPORT |
| STRATEGY CONTINUED Sasol is advancing a structured approach to position the portfolio for sustained value creation beyond FY30 – anchored in disciplined portfolio choices, enhanced competitiveness, and a pragmatic pathway through the energy and chemicals transition. FY30+ This work reflects a deliberate shift from static planning toward a more dynamic, choice-led strategy – ensuring Sasol protects the strength of the base while building credible, flexible pathways into the future. The emphasis remains on disciplined execution, capital efficiency, and positioning the portfolio to compete across a range of future market scenarios. Develop a measured, value-driven transition approach that aligns decarbonisation with regulatory direction, economic viability, and broader portfolio strategy Maintain strategic flexibility through phased entry, partnerships, modular investments, and staged capital deployment rather than binary commitments Identify and scale lower-carbon and higher-growth opportunities selectively as technology, policy, customer demand, and economics evolve Balance near-term earnings protection with long-term repositioning by prioritising competitive, scalable investments that avoid value dilution Value-Led Transition and Strategic Optionality Progressing a systematic review of portfolio roles and “right-to-win” positions across core and emerging value pools Differentiating assets and businesses into cash-generative foundations, optimisation opportunities, innovation and future growth platforms Assessing selective participation in adjacencies and new value chains, with a focus on scale, partnering, and capital efficiency Building a long-term portfolio that supports both resilience and exposure to structurally growing markets Future-fit Portfolio Shaping Driving end-to-end value chain optimisation across coal, gas, and chemicals to improve structural margins Identifying integration benefits and bottleneck releases to unlock latent capacity and improve throughput economics Advancing cost and reliability improvements through operational excellence, resource optimisation, and selective technology deployment Enhancing market positioning and product mix flexibility to respond to evolving demand and pricing dynamics Strengthening Core Value Chains Embedding sharper capital allocation frameworks aligned to risk-adjusted returns, cash generation, and strategic relevance Introducing clearer guardrails for investment prioritisation, balancing reinvestment in the base with disciplined growth Strengthening portfolio trade-off decisions, including pacing, sequencing, and optionality preservation Ensuring resilience under multiple scenarios, including commodity cycles, policy changes, and transition dynamics Capital Allocation and Value Discipline Strengthening integration and decision-making across business to support a more dynamic strategy Embedding clear accountability and performance metrics aligned to portfolio roles and value creation objectives Evolving toward a more growth-oriented and externally anchored mindset, while maintaining cost discipline Building capability in strategic partnerships, portfolio management, and capital agility Execution and Organisational Enablement SASOL INTEGRATED REPORT 2026 42 JOB031420_SASOL 2026_IR_3_EXECUTING STRATEGY_v24_TS INTRODUCTION SUMMARISED FINANCIAL PERFORMANCE SUSTAINABILITY REPORT SASOL AT A GLANCE DRIVING SUSTAINABLE VALUE CREATION EXECUTING STRATEGY DELIVERING BUSINESS VALUE CORPORATE GOVERNANCE ASSURANCE/ ADMINISTRATION REMUNERATION REPORT |
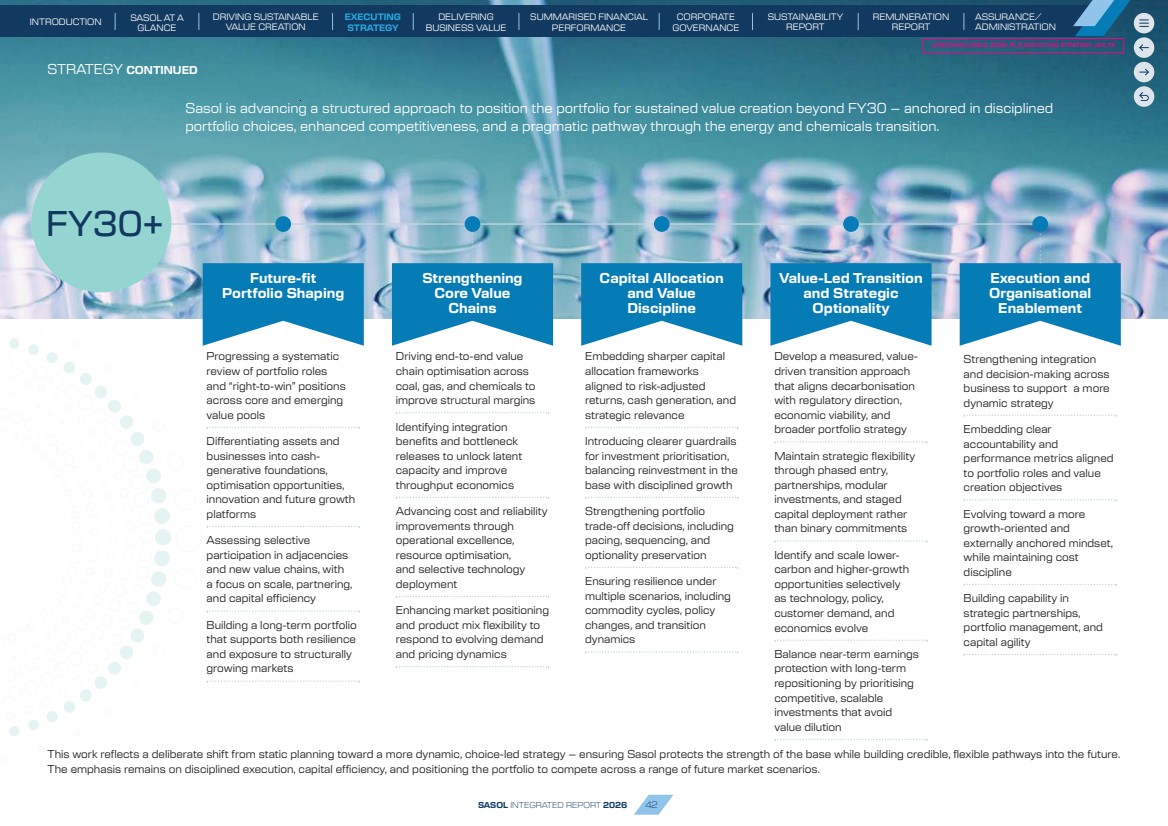
| Resilience of Sasol’s portfolio Scenario updates Sasol updates its global and South African scenarios annually to reflect changes in the external environment and to test the resilience of its strategy. The scenarios draw on external scenario sets, market intelligence, internal modelling and expert insights, providing a balanced but challenging view of possible futures. They support strategy development, risk identification, opportunity assessment and decision-making. Scenarios are not predictions. They are alternative but plausible futures used to understand uncertainty, strengthen strategic resilience and inform decision-making. They are most useful when considered together, as elements of different scenarios may emerge simultaneously. Although this writeup reflects a climate and emissions bias, which is important for Sasol, the underlying scenarios cover a wider range of issues including geopolitics, regulation, consumer responses, technology advances and market conditions. The Current Pathway reflects a world in which the energy transition continues, but at a measured and uneven pace. Global economic growth stabilises at around 3%, supported by a gradual normalisation of commodity cycles, although periodic volatility remains a persistent feature of markets. Policy ambition advances incrementally, and while technology adoption continues, it does not accelerate to its full potential due to affordability, infrastructure, and coordination constraints. Fossil fuels remain a significant part of the global energy mix for longer, with transition pressures building steadily rather than abruptly. Overall, this scenario represents a pragmatic continuation of current trends, characterised by ongoing uncertainty, episodic shocks, geopolitical tensions, and sustained adaptation spending as global warming progresses. Higher tariffs, increased conflicts and tensions – result heightened uncertainty and a more fragmented global economy. New geographic trade relationships raise security of supply concerns for energy, commodities and components, increasing the cost of minerals and metals key to the energy transition, further increasing affordability challenges. Adaptation costs are significant, related to more frequent and extreme weather events. Signposts to monitor activity in each of the scenarios include: • Global trade restrictions and tariffs; intra bloc trade versus cross-block trade • Frequency of Regulatory and policy changes including RED II, flexible allocation, carbon border tax design • Global and South African carbon regulation including carbon tax recycling and carbon budget • Macroeconomic drivers such as oil price, rand/dollar exchange rate, inflation, economic growth, product prices, feedstock price, upstream investment, ethane-ethylene price spreads, South Africa GDP/capita • Electricity growth versus GDP growth and renewables energy spend versus grid spend • Sustainability strategy and associated costs of investment required • The pace of technology development • Financing and funding trends and requirements • Align transition pace with customer needs SIGNPOSTS The current context is defined by continued global growth under heightened fragility, with geopolitical and policy uncertainty a feature of the operating environment. Global GDP growth remains positive but below historical averages, supported by technology investment and easing inflation, while constrained by trade friction, elevated debt levels and limited fiscal space. Macroeconomic volatility persists rather than recessionary collapse, making resilience and balance sheet strength pure growth exposure. Geopolitics has shifted from episodic disruption to structural fragmentation. Strategic rivalry – particularly between the US and China – continues to reshape trade, technology and industrial policy. Ongoing conflicts in Ukraine and the Middle East sustain energy price volatility and expose the sensitivity of inflation, logistics and supply chains to political shocks. Governments increasingly treat trade, energy and technology as national security instruments rather than efficiency-driven systems. Global trade remains resilient but is re-routed rather than liberalised. Industrial policy has overtaken free trade as the organising principle, with subsidies, tariffs, local content rules and carbon border measures shaping capital allocation. Supply chains are shortening and realigning via “connector economies” such as the association of South East Asian nations (ASEAN), India and Mexico, while carbon intensive and trade exposed sectors face rising regulatory and cost pressures. Technology – especially artificial intelligence (AI) – is the strongest accelerating force. AI drives a semiconductor super cycle, data centre expansion and rising power demand, linking digital competitiveness directly to energy system resilience. CURRENT PATHWAY (TEMPERATURE INCREASE 2 – 3°C) FRAGMENTED WORLD (TEMPERATURE INCREASE >3°C) Scenario 1 Scenario 2 STRATEGY CONTINUED SASOL INTEGRATED REPORT 2026 43 JOB031420_SASOL 2026_IR_3_EXECUTING STRATEGY_v24_TS INTRODUCTION SUMMARISED FINANCIAL PERFORMANCE SUSTAINABILITY REPORT SASOL AT A GLANCE DRIVING SUSTAINABLE VALUE CREATION EXECUTING STRATEGY DELIVERING BUSINESS VALUE CORPORATE GOVERNANCE ASSURANCE/ ADMINISTRATION REMUNERATION REPORT |
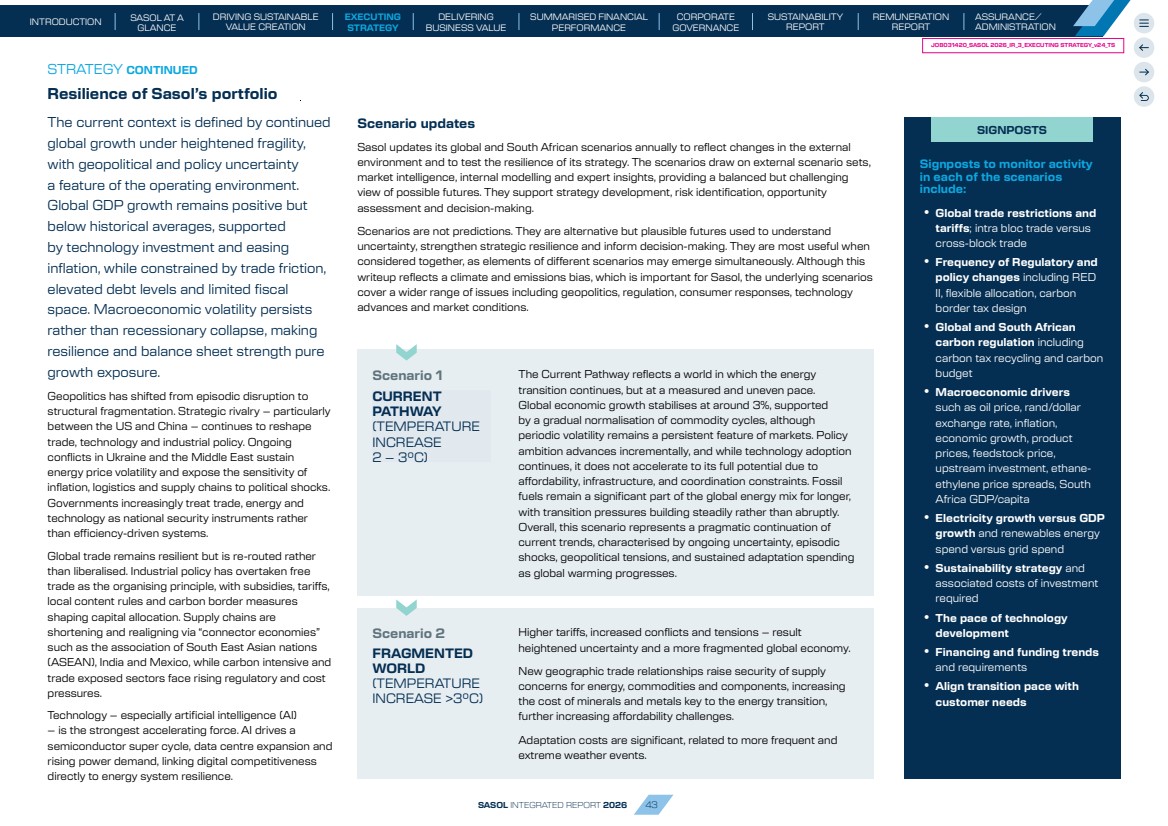
| Quantitative robustness testing of our strategy to FY30 Scenarios are used to test the robustness of our strategy, both qualitatively and quantitatively, to assist in identifying potential risks and opportunities as well as to improve overall strategic resilience. The result of the robustness testing assists in shaping the Sasol of the future strategy and in identifying possible risks to the strategy. Sasol is actively monitoring opportunities for further value creation into the future. The testing process involves developing price assumptions for each product and feedstock under each scenario, including oil, refined products, natural gas, chemicals and US ethane. These price assumptions, together with the outcomes of the financial modelling, are reviewed and approved by the Sasol Group Assumptions Committee. Through Group Finance, a detailed financial modelling exercise is then undertaken to test financial robustness through to FY30, using Earnings Before Interest, Taxes, Depreciation and Amortisation (EBITDA) as the key metric. The modelling outcomes are subsequently signed off by the Assumptions Committee and used to inform decision-making. The graph below shows the outcome of the qualitative robustness test. The line indicates the indexed FY26 EBITDA in the Current Pathway at an index of 100. This is compared to the indexed values in the scenarios in FY30 relative to the 100 index line. The comparison in the different scenarios is dependent on the relative oil price and feedstock cost variations. Despite varying scenarios, Sasol employs an agile process that proactively adjusts and shapes its strategy, enhancing resilience by capitalising on new, sustainable growth opportunities. In the Cooperative World, strong multilateral cooperation underpins faster progress on both climate action and economic development. Governments align policy frameworks, trade barriers are reduced, and technology sharing accelerates innovation and deployment across regions. The energy transition advances more rapidly, supported by lower market volatility and clearer policy signals, enabling capital to flow into low-carbon solutions with greater confidence. Fossil fuel demand declines more quickly, while petrochemical demand comes under increasing pressure from higher recycling rates, circularity, and improved material efficiency. Overall, this scenario is defined by greater system efficiency, faster technology diffusion, and a more predictable operating environment—albeit with structural pressure on traditional hydrocarbon-based activities. Adaptation costs are moderated as the system transitions away from fossil-based feedstocks. The Net Zero World assumes a strong and coordinated global commitment to limiting warming to 1,5°C, supported by stringent policies, carbon pricing mechanisms, and penalties for emissions-intensive activities. Decarbonisation accelerates rapidly across all sectors, leading to a sharp decline in fossil fuel demand. Low-carbon technologies—including renewable power, green hydrogen, and circular business models—scale quickly as capital is redirected toward sustainable systems. While this scenario delivers the most decisive climate outcome and the lowest long-term adaptation costs, it is currently less probable given geopolitical and economic realities. Nevertheless, it remains a critical reference case for stress-testing strategies, investments, and resilience under conditions of rapid and potentially disruptive transition. COOPERATIVE WORLD (TEMPERATURE INCREASE 1,5 – 2°C) NET ZERO WORLD (TEMPERATURE INCREASE ~1,5°C) Scenario 3 Scenario 4 STRATEGY CONTINUED EBITDA and oil price index in 2030 Current Pathway Fragmented World Cooperative World Net-Zero World Earnings (ZAR bil) in real terms FY26 Oil price ($/bbl) in real terms FY26 SASOL INTEGRATED REPORT 2026 44 JOB031420_SASOL 2026_IR_3_EXECUTING STRATEGY_v24_TS INTRODUCTION SUMMARISED FINANCIAL PERFORMANCE SUSTAINABILITY REPORT SASOL AT A GLANCE DRIVING SUSTAINABLE VALUE CREATION EXECUTING STRATEGY DELIVERING BUSINESS VALUE CORPORATE GOVERNANCE ASSURANCE/ ADMINISTRATION REMUNERATION REPORT |
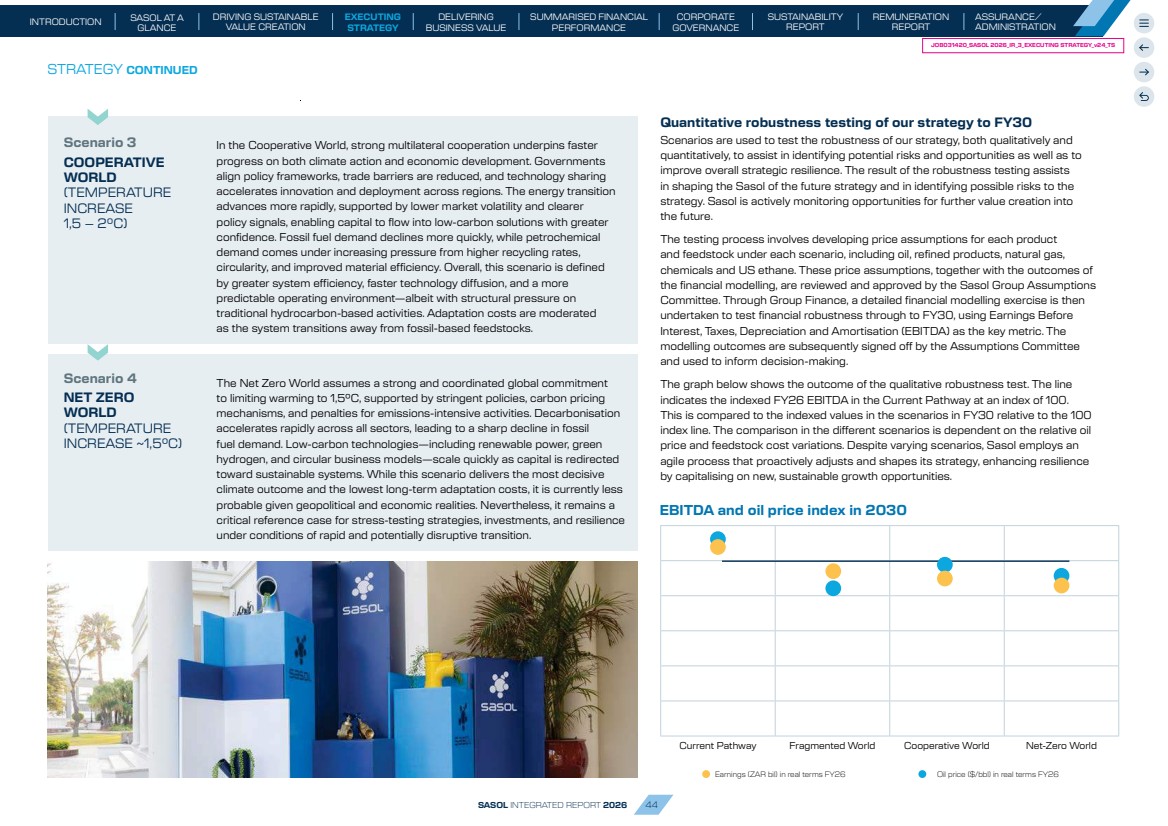
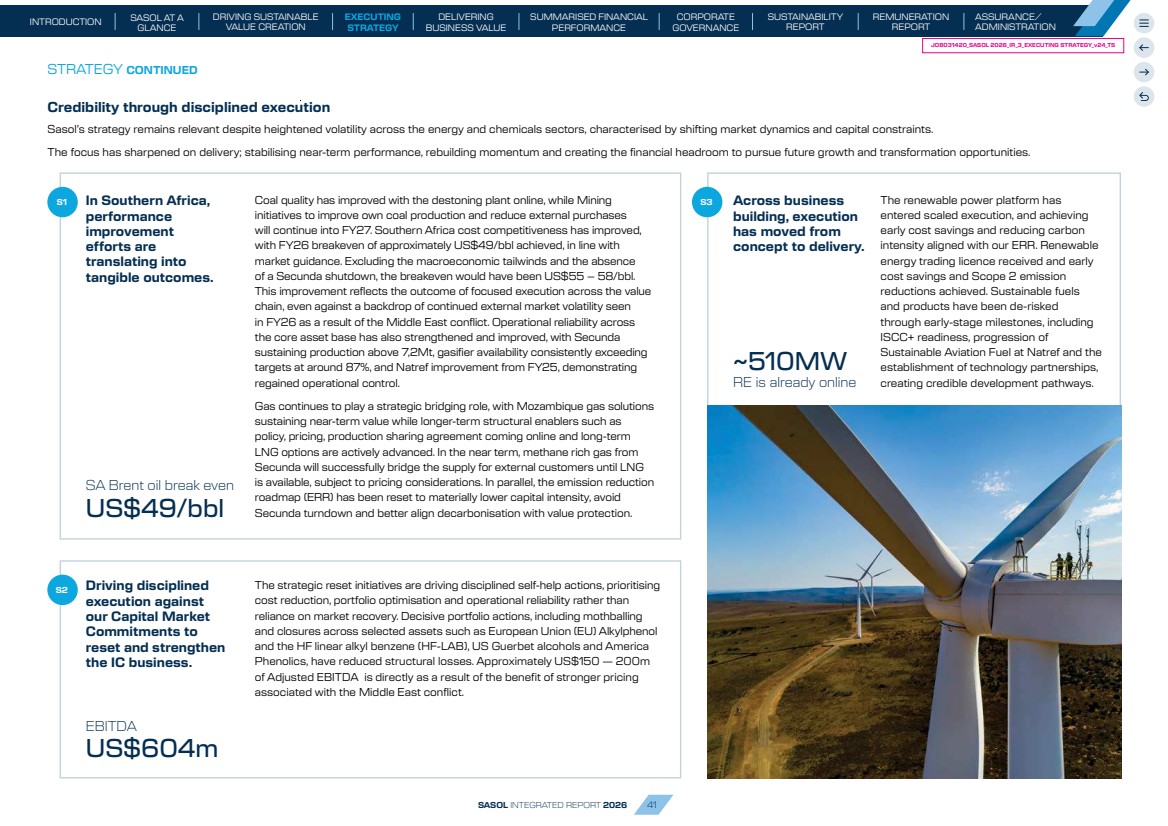
| Fragmented World: Current Pathway: Cooperative World: Net Zero: Qualitative robustness testing of our strategy to FY30 Here Sasol applies a grading system to assess different elements of the Future strategy to 2030 by convening a multi disciplinary team from across the business to evaluate the robustness of the strategy across a range of themes under each of the four scenarios. These themes include potential stakeholder responses including from shareholders, non-governmental organisations and government; the strategy’s dependence on policy and regulatory changes; fluctuations in demand for liquid fuels and chemicals; market and competitive dynamics affecting liquid fuels and chemicals; and the executability of the strategy, including considerations such as the operating model, partnerships, capabilities, skills availability and the financial framework. Outcome of qualitative robustness test Sasol is progressing the GHG Emission Reduction Roadmap towards a 30% reduction target by 2030 by adopting new sustainable energy and feedstock opportunities, improving energy efficiency and incubating and scaling new sustainable opportunities to grow new value chains. Many of these activities like renewable diesel, renewable energy and bio-based feedstocks, are housed in our Business Building. The effect of these new lower carbon opportunities will be felt across Sasol both in South Africa and internationally. STRATEGY CONTINUED Approximate temperature target (°C) Adequate robustness, may show some performance vulnerability under certain circumstances Lower robustness: sensitivity to variations in certain external drivers >3 2–3 1.5–2 ~1.5 INTERNATIONAL CHEMICALS Across all scenarios, demand for chemical products is expected to expand, largely driven by demographic growth and rising living standards. Within this context, IC remains positioned as an enabler of more efficient resource use— supporting lower energy intensity, reduced waste, and improved product performance across value chains. Its portfolio already reflects this shift, offering a mix of conventional and more sustainable solutions, including biosurfactants, palm free alternatives, and lower carbon-intensity synthetic alcohols. Despite this progress, the commercial environment in the near term remains constrained. Customers continue to prioritise cost competitiveness, limiting their willingness to recognise or pay for sustainability-linked product attributes. As a result, value capture from these offerings remains gradual rather than immediate. From an execution perspective, the strategic direction is established and supported. Delivery will depend on maintaining operational discipline – managing cost structures, aligning products with evolving market requirements, ensuring effective market access, and sustaining the required technical and commercial capabilities. Current indications suggest alignment between management ambition and shareholder expectations. Under the Cooperative and Net Zero scenarios, the operating context becomes more demanding. Decarbonisation requirements accelerate, while competitive intensity increases as both incumbents and new entrants scale greener and circular product alternatives. In parallel, regulatory and cost pressures rise – most notably through the phase-out of free Emissions Trading Scheme allocations in Europe post-2026, which introduces additional compliance costs. Together, these dynamics are likely to weigh on margins and returns relative to more moderate transition pathways. SA FUELS AND CHEMICALS BUSINESS BUILDING Recognising South Africa’s developmental status, Just Transition imperatives and energy realities, the pace of transition is likely to lag that of more advanced economies. This underpins relatively stable demand through to 2030. However, in transition-led scenarios such as Cooperative and Net Zero, the direction of travel shifts more decisively – requiring faster emissions reduction and a gradual repositioning away from coal-based feedstocks. External factors further shape the outlook. A sustained lower oil price environment compresses earnings resilience, while in a fragmented world, elevated trade barriers increase input costs and dampen overall demand across fuels and chemicals markets. Although the carbon profile of South African chemical production is increasingly under scrutiny, it is not expected to materially limit market access in the near term. In response to these structural shifts, Sasol is progressively repositioning its portfolio towards lower-carbon and circular value chains. Key focus areas include sustainable aviation fuel (SAF), renewable energy integration, renewable diesel, alternative feedstocks, and lower-carbon chemical products. Sasol remains committed to SAF, with future involvement focused on technology-led collaborations, targeted project and partnership opportunities, and market-development activities that are strategically aligned and commercially supported. Importantly, these initiatives build on existing strengths rather than requiring entirely new capabilities. Sasol can leverage its established infrastructure, market channels, customer relationships, proprietary Fischer–Tropsch technology, and broad internal skills base to support this transition. This transition pathway serves a dual purpose: lowering the emissions intensity of the domestic value chain while creating new avenues for growth. In the more transition-aligned scenarios, expanding demand for greener products provides a supportive backdrop for these emerging businesses. However, this opportunity is not without constraints – global competition for critical skills, technology, and capital equipment is likely to intensify, placing upward pressure on costs and execution timelines. Beyond commercial outcomes, there are broader system-level implications. The development of new energy and chemical value chains has the potential to contribute to South Africa’s Just Energy Transition, particularly through job creation and the stimulation of local industrial activity. At the same time, the physical impacts of climate change – such as increased weather volatility and infrastructure stress – are expected to become more pronounced, especially in the Fragmented and Current Pathway scenarios. Strong strategy resilience to variations and uncertainties SASOL INTEGRATED REPORT 2026 45 JOB031420_SASOL 2026_IR_3_EXECUTING STRATEGY_v24_TS INTRODUCTION SUMMARISED FINANCIAL PERFORMANCE SUSTAINABILITY REPORT SASOL AT A GLANCE DRIVING SUSTAINABLE VALUE CREATION EXECUTING STRATEGY DELIVERING BUSINESS VALUE CORPORATE GOVERNANCE ASSURANCE / ADMINISTRATION REMUNERATION REPORT |