Exhibit 99.3
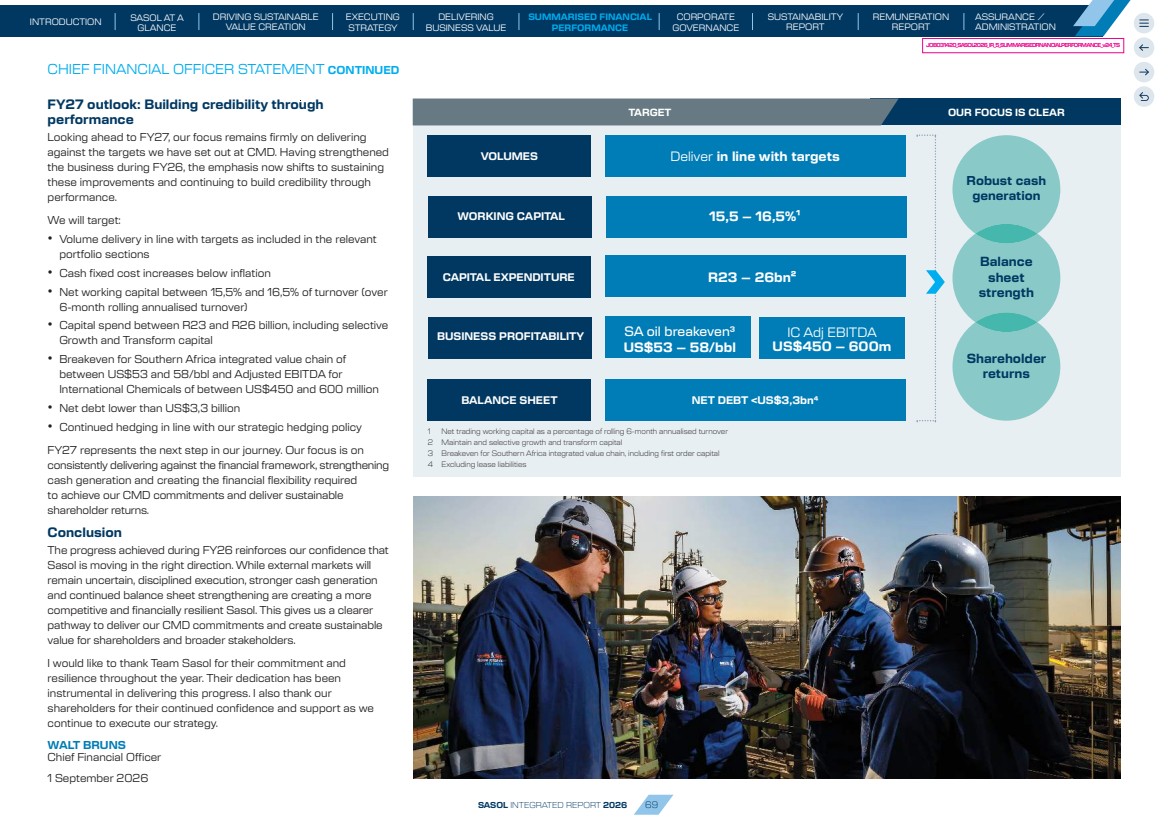
| CHIEF FINANCIAL OFFICER STATEMENT Our financial framework continued to guide the decisions we made during FY26. Improved operational performance, strict cost management and disciplined capital allocation created operating leverage across the business, positioning Sasol to convert improved market conditions in the latter part of the year into stronger earnings and further balance sheet strengthening. While this progress is encouraging, we recognise that it is part of the ongoing journey to deliver the FY28 commitments we made at our Capital Markets Day (CMD). Our focus remains on consistent execution, stronger cash generation and building a more resilient Sasol. Dear stakeholders FY26 marked another important step in delivering the commitments we set out at our CMD and strengthening Sasol’s financial position. We continued to advance our strategic priorities to restore the Southern Africa value chain, reset International Chemicals and deliver our Grow and Transform agenda. KEY MESSAGES made during FY26. Improved operational performance, strict cost management and disciplined capital allocation created operating leverage across the business, positioning Sasol to convert improved market conditions in the latter part of the year into stronger earnings and further balance sheet strengthening. While this progress is encouraging, we recognise that it is part of the ongoing journey to deliver the FY28 commitments we made at our Capital Markets Day (CMD). Our focus remains on convert improved market conditions in the latter part of the year While this progress is encouraging, we recognise that it is part made at our Capital Markets Day (CMD). Our focus remains on consistent execution, stronger cash generation and building a more resilient Sasol. into stronger earnings and further balance sheet strengthening. cost management and disciplined capital allocation created operating leverage across the business, positioning Sasol to made during FY26. Improved operational performance, strict While this progress is encouraging, we recognise that it is part of the ongoing journey to deliver the FY28 commitments we made at our Capital Markets Day (CMD). Our focus remains on consistent execution, stronger cash generation and building a operating leverage across the business, positioning Sasol to convert improved market conditions in the latter part of the year cost management and disciplined capital allocation created made during FY26. Improved operational performance, strict Our financial framework continued to guide the decisions we • Stronger earnings through improved business delivery and supportive macro conditions • Continued balance sheet strengthening through sustainable cash generation and focused debt reduction • Improved competitiveness through ongoing cost and capital discipline • Enhanced financial resilience and continued progress towards sustainable shareholder returns • Proactive risk management with hedging programme in progress WALT BRUNS // Chief Financial Officer Salient features Adjusted EBITDA* of R61 billion, up 17% compared to prior year, driven by a combination of management actions and more supportive macros in the last quarter Sales volumes increased by 4% to prior year, through improved operational performance Disciplined capital spend of R21 billion, 18% lower than prior year Free cash flow decreased by 5% to R11,9 billion, impacted by elevated working capital and once-off Transnet settlement received in prior year Net debt reduced by 11% to US$3,3 billion**, with deleveraging prioritised Strong liquidity position of ~US $5 billion, ensuring financial resilience The year was characterised by ongoing volatility across energy, refining and chemicals markets, geopolitical uncertainty and evolving global trade dynamics. However, macro conditions became more supportive in the fourth quarter following the Middle East (ME) conflict, and it is important to acknowledge the contribution this made to our performance. Equally important is that Sasol was better positioned to capture this benefit as a result of the operational and commercial progress we have made across the business. Our financial priorities remain unchanged: improving sustainable free cash flow, reducing debt, allocating capital with discipline and resuming dividends when appropriate. These priorities continue to guide our decisions and underpin our commitment to creating long-term value for shareholders and broader stakeholders. Disciplined capital allocation 3 Resume dividend Improve sustainable free cash flow Deleverage balance sheet 1 2 4 Consistent execution against these priorities over the past two years is delivering tangible results, strengthening Sasol’s competitiveness and improving financial resilience. While there is more work to do, we are building a structurally stronger business that is better positioned to create sustainable value for our shareholders through the cycle. * Adjusted EBITDA is calculated by adjusting earnings before interest and tax for depreciation, amortisation, share-based payments, remeasurement items, change in discount rates of environmental provisions, unrealised translation gains and losses on derivatives and hedging activities. ** Total debt excluding leases less cash and cash equivalents SASOL INTEGRATED REPORT 2026 66 JOB031420_SASOL 2026_IR_5_SUMMARISED FINANCIAL PERFORMANCE_v24_TS INTRODUCTION SUMMARISED FINANCIAL PERFORMANCE SUSTAINABILITY REPORT SASOL AT A GLANCE DRIVING SUSTAINABLE VALUE CREATION EXECUTING STRATEGY DELIVERING BUSINESS VALUE CORPORATE GOVERNANCE ASSURANCE / ADMINISTRATION REMUNERATION REPORT |
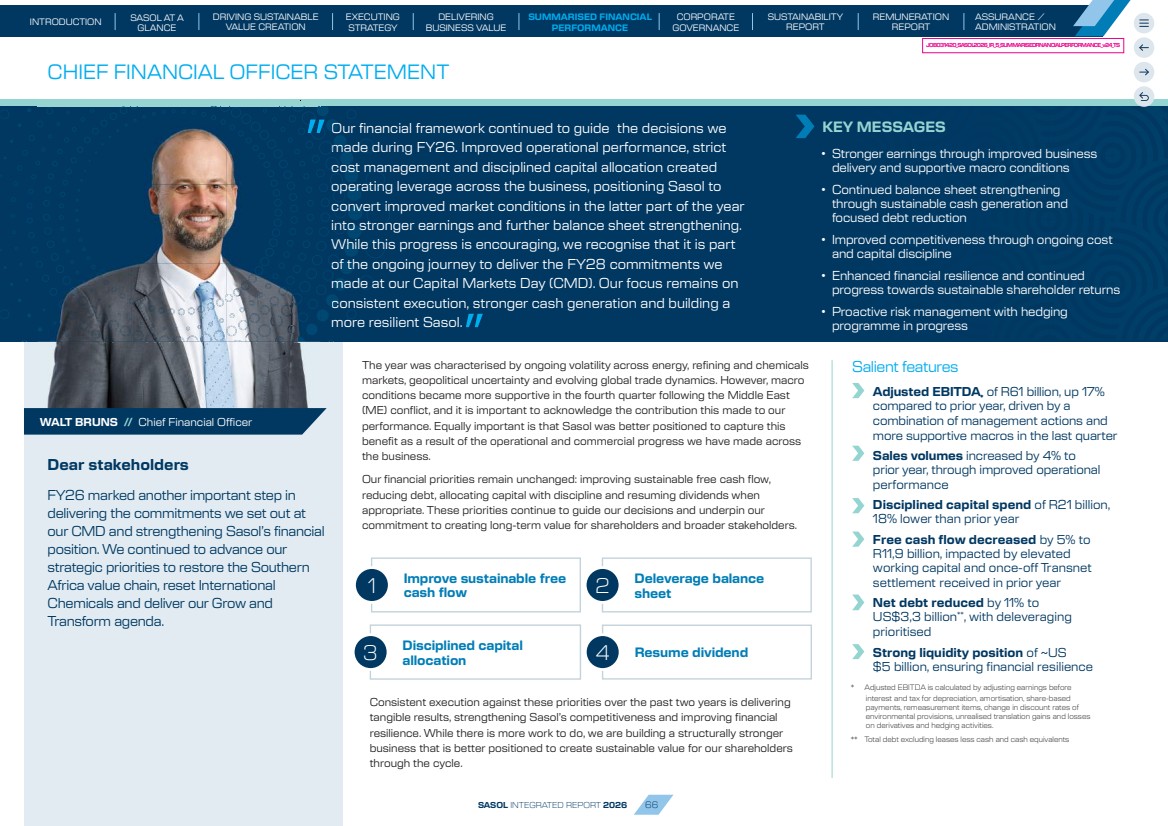
| CHIEF FINANCIAL OFFICER STATEMENT CONTINUED Financial performance for the year Delivering stronger financial performance We delivered a stronger financial performance in FY26, with improved earnings and robust cash generation. We delivered or exceeded against all our key market guidance metrics with exception of net working capital which was above target range at year-end due to higher pricing resulting from the ME conflict and fuels inventory build. Adjusted EBITDA increased by 17% to R61 billion, driven by 4% higher sales volumes, stronger oil prices and significantly improved fuel differentials following the ME conflict in the fourth quarter. These benefits were partly offset by a stronger Rand/US dollar exchange rate. The Gross Margin % improved from 45% to 46% with variable costs also increasing mainly due to higher sales volumes and increased crude purchases to accommodate the higher Natref shareholding capacity following the Prax business rescue. Cost containment remains one of our key focus areas. 0 100 200 300 400 Jun 24 Jun 25 Jun 26 Turnover Gross margin % % 47 45 46 0 10 20 30 40 50 60 Rbn 275 249 272 Turnover (Rand billion) and gross margin (%) 60,0 60,7 51,8 51,8 0 15 30 45 60 75 Jun 25Jun 24 Jun 26 Rbn Adjusted EBITDA (Rand billion) 7,2 11,9 12,6 51,8 0 5 10 15 Jun 25Jun 24 Jun 26 Rbn Free cash flow (Rand billion)* * Free cash flow is defined as cash available from operating activities less first order capital and related capital accruals. The Free cash flow calculation has been updated, in line with the revised capital allocation framework, to include selective growth and transform capital as part of first order capital, previously included under second order capital. Prior years have been reclassified accordingly. Net working capital, measured as the percentage of turnover on a rolling 12-month basis, increased to 18,3% (16,6% on rolling 6-month basis), above our guidance range of 15,5% – 16,5%. This was driven by higher Q4FY26 pricing, the impact of utilising Prax’s shareholding capacity at Natref and higher fuels volumes at year end. These volumes will, however, support planned shutdowns early in FY27. Improving working capital remains a key priority and represents a significant opportunity to strengthen cash conversion over the coming year. Capital expenditure of R21 billion was 18% lower than the prior year, mainly due to the conclusion of major feedstock gas and compliance spend, together with the absence of the Secunda Operation shutdown in the financial year. We continue to optimise capital across the portfolio, while maintaining safe, reliable and compliant operations. Importantly, this progress has enabled us to revise our FY27 capital guidance and resulted in cumulative savings of R12 – 14 billion over the 3 year-period against the ranges communicated at CMD. Free cash flow of R11,9 billion decreased 5% compared to the prior year, despite higher earnings and lower capital expenditure. Cash flow was impacted by higher afore-mentioned year-end working capital. Excluding the Transnet SOC Limited net cash settlement received in the prior year, cash generation improved 26%. In the Southern Africa business, we achieved an oil breakeven price of US$49/bbl. Excluding the macroeconomic tailwinds and the absence of a Secunda shutdown, the breakeven would have been US$55 to 58/bbl. This compares positively to US$63/bbl in FY25, excluding the once-off Transnet settlement. The improvement reflects the continued benefits of our operational improvement, cost and capital optimisation initiatives. In International Chemicals, the reset programme continues to improve the competitiveness of the portfolio and largely offset the impact of weaker-than-expected market conditions experienced during the first nine months of the year. Together with stronger market conditions in the fourth quarter, this supported adjusted EBITDA of US$604 million. Approximately US$150 – 200m of Adjusted EBITDA is directly as a result of the benefit of stronger pricing associated with the ME conflict. Total impairments of R16,8 billion mainly related to the Secunda liquid fuels refinery cash generating unit (CGU) (R7,7 billion), the Polyethylene CGU (R3,7 billion) and the Production Sharing Agreement development in Mozambique (R3,8 billion). While management actions improved the recoverable amount of the CGUs, these benefits were offset by the stronger forecast Rand/US$ exchange rate and longer term US$ pricing. We remain focused on progressing initiatives further to be incorporated in the impairment calculations. 4,1 3,3 3,7 0 1 2 3 4 5 Jun 25Jun 24 Jun 26 US$bn Net debt excluding leases (US$ billion) SASOL INTEGRATED REPORT 2026 67 JOB031420_SASOL 2026_IR_5_SUMMARISED FINANCIAL PERFORMANCE_v24_TS INTRODUCTION SUMMARISED FINANCIAL PERFORMANCE SUSTAINABILITY REPORT SASOL AT A GLANCE DRIVING SUSTAINABLE VALUE CREATION EXECUTING STRATEGY DELIVERING BUSINESS VALUE CORPORATE GOVERNANCE ASSURANCE / ADMINISTRATION REMUNERATION REPORT |
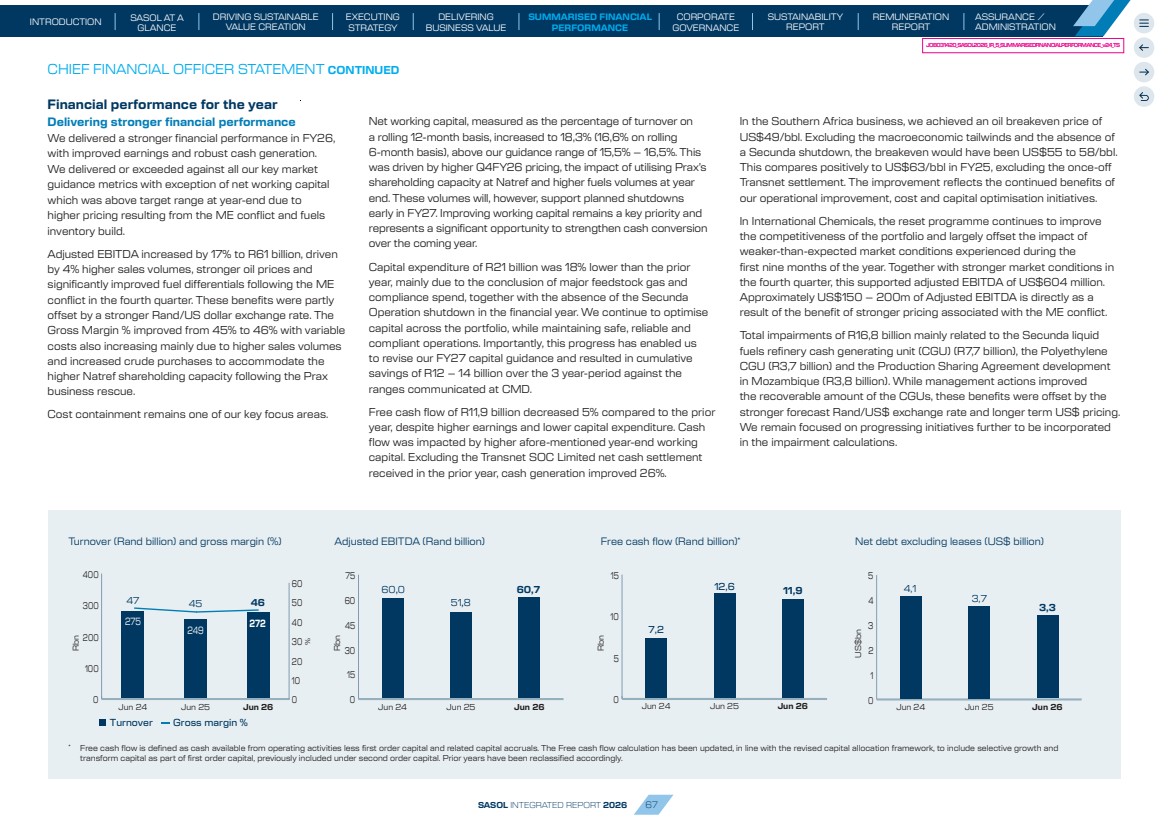
| CHIEF FINANCIAL OFFICER STATEMENT CONTINUED REVISED CAPITAL ALLOCATION FRAMEWORK 1 Net debt excluding lease liabilities 2 After tax, interest and 1st order capital expenditure 1 ST ORDER ALLOCATION 2ND ORDER ALLOCATION NET DEBT1 SUSTAINABLY <US$3 BILLION Deliver additional shareholder returns Invest in growth and transform Further debt reduction Selective Growth and Transform (1st order) Smaller, high-return growth projects and incremental transform initiatives Optimise maintain capital Ensuring continued safe and reliable operations Strengthen the balance sheet Reinforce financial resilience to manage volatility Growth and Transform capital shifted Prioritise value-accretive investments once balance sheet allows Maintain safe and reliable operations Selective Growth and Transform PAY DIVIDENDS OF 30% OF FREE CASH FLOW2 1 1 3 2 4 3 4 2 Further strengthening our financial position FY26 marked another year of meaningful progress in reducing net debt and strengthening our balance sheet. Net debt (excluding leases) reduced by 11% to US$3,3 billion compared to US$3,7 billion in the prior year, and below our guidance of less than US$3,7 billion, reflecting continued cash generation and disciplined capital allocation. Total debt also decreased from US$5,8 billion (R103,3 billion) to US$5,7 billion (R93,9 billion), while liquidity remained strong at US$5 billion, providing sufficient financial resilience. During the year, we further optimised our debt maturity profile through the successful issuance of both a 5-year, R5,3 billion floating rate bond in exchange for US$300 million and a US$750 million bond maturing in 2033, together with the partial repayment of our 2028 and 2029 bond maturities (i.e. debt neutral). This materially extended our debt maturity profile, further reduced near-term refinancing risk and improved the regional mix of our debt to better match the underlying cash generation of our assets. Our proactive hedging programme continues to mitigate the volatility arising from oil price and exchange rate movements. Our strategy is to provide downside protection while retaining upside participation and managing hedging costs. The FY27 oil hedging programme is complete, while the FY27 ZAR/USD hedging programme remains underway. Disciplined capital allocation Our capital allocation framework remains central to how we create long-term shareholder value. It provides a disciplined and transparent approach to allocating capital across the business, balancing the need to maintain safe and reliable operations, strengthen the balance sheet, invest in future growth opportunities, and enhance shareholder returns. In FY26, we continued to apply this framework by prioritising investments that protect the competitiveness of our existing operations while advancing selective growth opportunities. As gas development costs within the PSA licence in Mozambique come to an end, we are redirecting capital to ensure coal and gas feedstock security. At the same time, we remain disciplined in pursuing selective growth opportunities. This included the €60 million final investment decision for the Brunsbüttel specialty alumina project in Germany, supporting the growth of our Advanced Materials business. Until our net debt target of below US$3 billion on a sustainable basis is achieved, deleveraging will remain our primary capital allocation priority. Thereafter, our stronger financial position will provide more flexibility to allocate capital where it creates the greatest value, including further debt reduction, additional value-accretive growth investments and/or enhanced shareholder returns. SASOL INTEGRATED REPORT 2026 68 JOB031420_SASOL 2026_IR_5_SUMMARISED FINANCIAL PERFORMANCE_v24_TS INTRODUCTION SUMMARISED FINANCIAL PERFORMANCE SUSTAINABILITY REPORT SASOL AT A GLANCE DRIVING SUSTAINABLE VALUE CREATION EXECUTING STRATEGY DELIVERING BUSINESS VALUE CORPORATE GOVERNANCE ASSURANCE / ADMINISTRATION REMUNERATION REPORT |
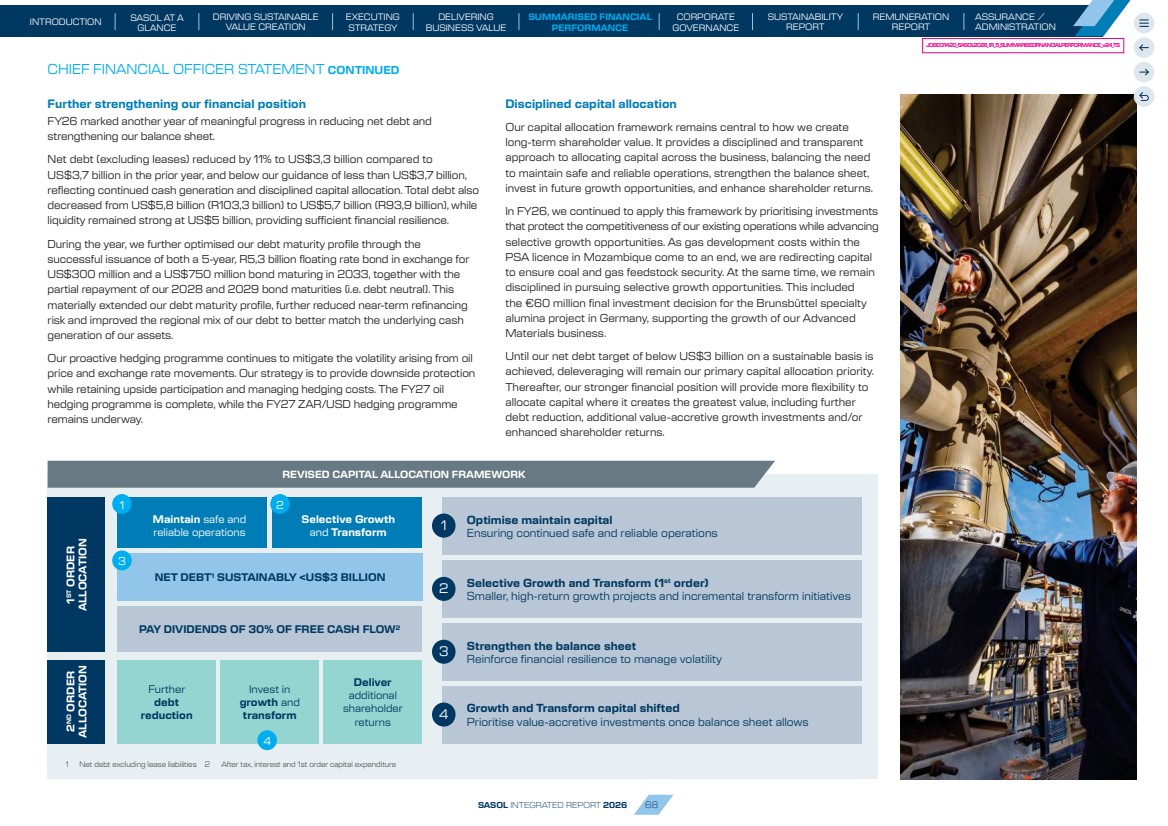
| CHIEF FINANCIAL OFFICER STATEMENT CONTINUED FY27 outlook: Building credibility through performance Looking ahead to FY27, our focus remains firmly on delivering against the targets we have set out at CMD. Having strengthened the business during FY26, the emphasis now shifts to sustaining these improvements and continuing to build credibility through performance. We will target: • Volume delivery in line with targets as included in the relevant portfolio sections • Cash fixed cost increases below inflation • Net working capital between 15,5% and 16,5% of turnover (over 6-month rolling annualised turnover) • Capital spend between R23 and R26 billion, including selective Growth and Transform capital • Breakeven for Southern Africa integrated value chain of between US$53 and 58/bbl and Adjusted EBITDA for International Chemicals of between US$450 and 600 million • Net debt lower than US$3,3 billion • Continued hedging in line with our strategic hedging policy FY27 represents the next step in our journey. Our focus is on consistently delivering against the financial framework, strengthening cash generation and creating the financial flexibility required to achieve our CMD commitments and deliver sustainable shareholder returns. Conclusion The progress achieved during FY26 reinforces our confidence that Sasol is moving in the right direction. While external markets will remain uncertain, disciplined execution, stronger cash generation and continued balance sheet strengthening are creating a more competitive and financially resilient Sasol. This gives us a clearer pathway to deliver our CMD commitments and create sustainable value for shareholders and broader stakeholders. I would like to thank Team Sasol for their commitment and resilience throughout the year. Their dedication has been instrumental in delivering this progress. I also thank our shareholders for their continued confidence and support as we continue to execute our strategy. WALT BRUNS Chief Financial Officer 1 September 2026 TARGET BALANCE SHEET BUSINESS PROFITABILITY CAPITAL EXPENDITURE WORKING CAPITAL VOLUMES R23 – 26bn² SA oil breakeven3 US$53 – 58/bbl 15,5 – 16,5%¹ Deliver in line with targets OUR FOCUS IS CLEAR IC Adj EBITDA US$450 – 600m Robust cash generation Balance sheet strength Shareholder returns NET DEBT <US$3,3bn4 1 Net trading working capital as a percentage of rolling 6-month annualised turnover 2 Maintain and selective growth and transform capital 3 Breakeven for Southern Africa integrated value chain, including first order capital 4 Excluding lease liabilities SASOL INTEGRATED REPORT 2026 69 JOB031420_SASOL 2026_IR_5_SUMMARISED FINANCIAL PERFORMANCE_v24_TS INTRODUCTION SUMMARISED FINANCIAL PERFORMANCE SUSTAINABILITY REPORT SASOL AT A GLANCE DRIVING SUSTAINABLE VALUE CREATION EXECUTING STRATEGY DELIVERING BUSINESS VALUE CORPORATE GOVERNANCE ASSURANCE / ADMINISTRATION REMUNERATION REPORT |