Exhibit 99.2
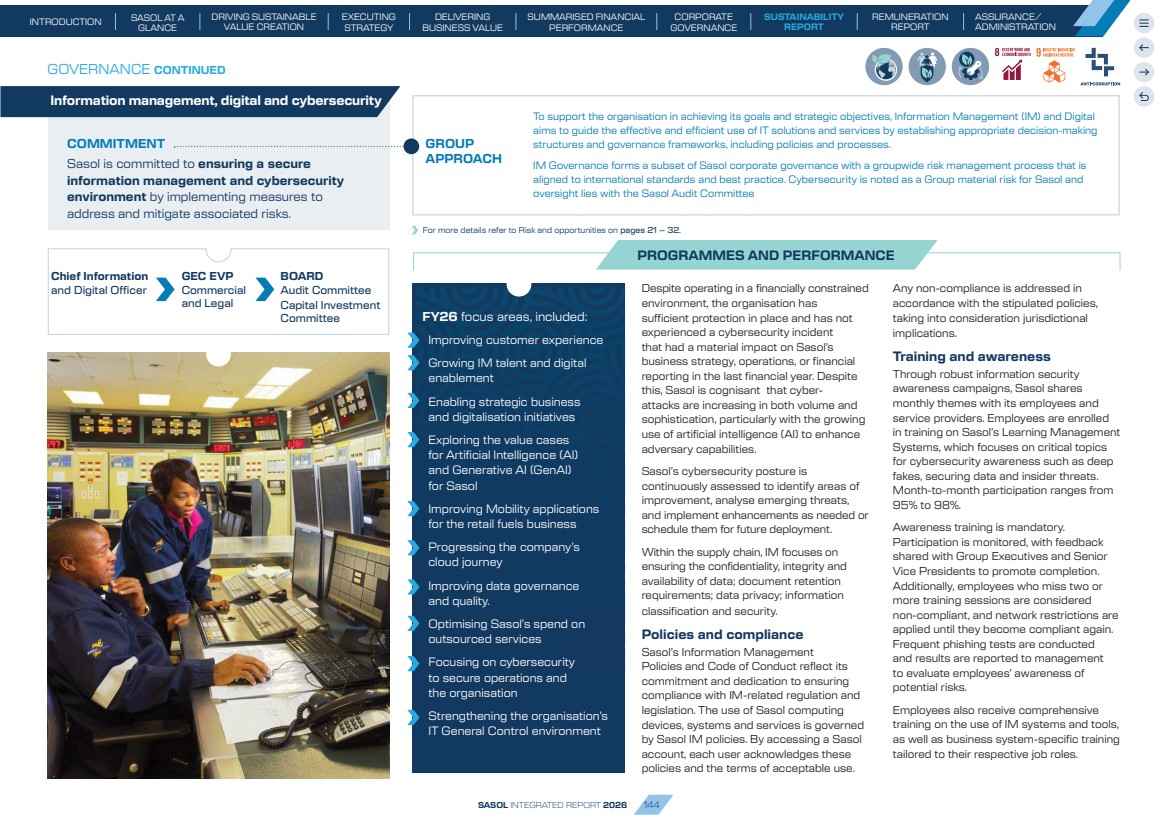
| Chief Information and Digital Officer GEC EVP Commercial and Legal BOARD Audit Committee Capital Investment Committee Ethics continued GOVERNANCE CONTINUED COMMITMENT Sasol is committed to ensuring a secure information management and cybersecurity environment by implementing measures to address and mitigate associated risks. To support the organisation in achieving its goals and strategic objectives, Information Management (IM) and Digital aims to guide the effective and efficient use of IT solutions and services by establishing appropriate decision-making structures and governance frameworks, including policies and processes. IM Governance forms a subset of Sasol corporate governance with a groupwide risk management process that is aligned to international standards and best practice. Cybersecurity is noted as a Group material risk for Sasol and oversight lies with the Sasol Audit Committee GROUP APPROACH Information management, digital and cybersecurity For more details refer to Risk and opportunities on pages 21 – 32. Despite operating in a financially constrained environment, the organisation has sufficient protection in place and has not experienced a cybersecurity incident that had a material impact on Sasol’s business strategy, operations, or financial reporting in the last financial year. Despite this, Sasol is cognisant that cyber-attacks are increasing in both volume and sophistication, particularly with the growing use of artificial intelligence (AI) to enhance adversary capabilities. Sasol’s cybersecurity posture is continuously assessed to identify areas of improvement, analyse emerging threats, and implement enhancements as needed or schedule them for future deployment. Within the supply chain, IM focuses on ensuring the confidentiality, integrity and availability of data; document retention requirements; data privacy; information classification and security. Policies and compliance Sasol’s Information Management Policies and Code of Conduct reflect its commitment and dedication to ensuring compliance with IM-related regulation and legislation. The use of Sasol computing devices, systems and services is governed by Sasol IM policies. By accessing a Sasol account, each user acknowledges these policies and the terms of acceptable use. Any non-compliance is addressed in accordance with the stipulated policies, taking into consideration jurisdictional implications. Training and awareness Through robust information security awareness campaigns, Sasol shares monthly themes with its employees and service providers. Employees are enrolled in training on Sasol’s Learning Management Systems, which focuses on critical topics for cybersecurity awareness such as deep fakes, securing data and insider threats. Month-to-month participation ranges from 95% to 98%. Awareness training is mandatory. Participation is monitored, with feedback shared with Group Executives and Senior Vice Presidents to promote completion. Additionally, employees who miss two or more training sessions are considered non-compliant, and network restrictions are applied until they become compliant again. Frequent phishing tests are conducted and results are reported to management to evaluate employees’ awareness of potential risks. Employees also receive comprehensive training on the use of IM systems and tools, as well as business system-specific training tailored to their respective job roles. FY26 focus areas, included: Improving customer experience Growing IM talent and digital enablement Enabling strategic business and digitalisation initiatives Exploring the value cases for Artificial Intelligence (AI) and Generative AI (GenAI) for Sasol Improving Mobility applications for the retail fuels business Progressing the company’s cloud journey Improving data governance and quality. Optimising Sasol’s spend on outsourced services Focusing on cybersecurity to secure operations and the organisation Strengthening the organisation’s IT General Control environment PROGRAMMES AND PERFORMANCE SASOL INTEGRATED REPORT 2026 144 SUSTAINABILITY REPORT SASOL AT A GLANCE DRIVING SUSTAINABLE VALUE CREATION EXECUTING STRATEGY INTRODUCTION DELIVERING BUSINESS VALUE CORPORATE GOVERNANCE SUMMARISED FINANCIAL PERFORMANCE ASSURANCE/ ADMINISTRATION REMUNERATION REPORT |
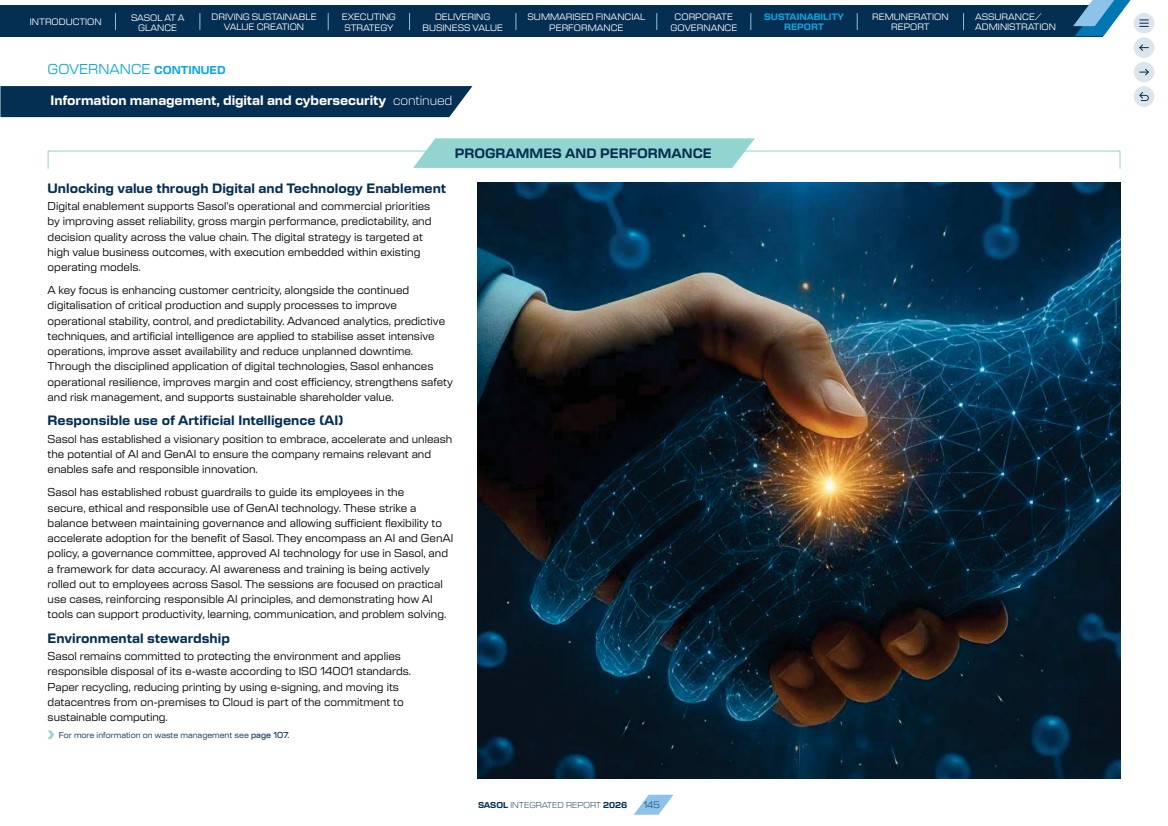
| Information management, digital and cybersecurity continued Unlocking value through Digital and Technology Enablement Digital enablement supports Sasol’s operational and commercial priorities by improving asset reliability, gross margin performance, predictability, and decision quality across the value chain. The digital strategy is targeted at high value business outcomes, with execution embedded within existing operating models. A key focus is enhancing customer centricity, alongside the continued digitalisation of critical production and supply processes to improve operational stability, control, and predictability. Advanced analytics, predictive techniques, and artificial intelligence are applied to stabilise asset intensive operations, improve asset availability and reduce unplanned downtime. Through the disciplined application of digital technologies, Sasol enhances operational resilience, improves margin and cost efficiency, strengthens safety and risk management, and supports sustainable shareholder value. Responsible use of Artificial Intelligence (AI) Sasol has established a visionary position to embrace, accelerate and unleash the potential of AI and GenAI to ensure the company remains relevant and enables safe and responsible innovation. Sasol has established robust guardrails to guide its employees in the secure, ethical and responsible use of GenAI technology. These strike a balance between maintaining governance and allowing sufficient flexibility to accelerate adoption for the benefit of Sasol. They encompass an AI and GenAI policy, a governance committee, approved AI technology for use in Sasol, and a framework for data accuracy. AI awareness and training is being actively rolled out to employees across Sasol. The sessions are focused on practical use cases, reinforcing responsible AI principles, and demonstrating how AI tools can support productivity, learning, communication, and problem solving. Environmental stewardship Sasol remains committed to protecting the environment and applies responsible disposal of its e-waste according to IS0 14001 standards. Paper recycling, reducing printing by using e-signing, and moving its datacentres from on-premises to Cloud is part of the commitment to sustainable computing. For more information on waste management see page 107. GOVERNANCE CONTINUED PROGRAMMES AND PERFORMANCE SASOL INTEGRATED REPORT 2026 145 SUSTAINABILITY REPORT SASOL AT A GLANCE DRIVING SUSTAINABLE VALUE CREATION EXECUTING STRATEGY INTRODUCTION DELIVERING BUSINESS VALUE CORPORATE GOVERNANCE SUMMARISED FINANCIAL PERFORMANCE ASSURANCE/ ADMINISTRATION REMUNERATION REPORT |
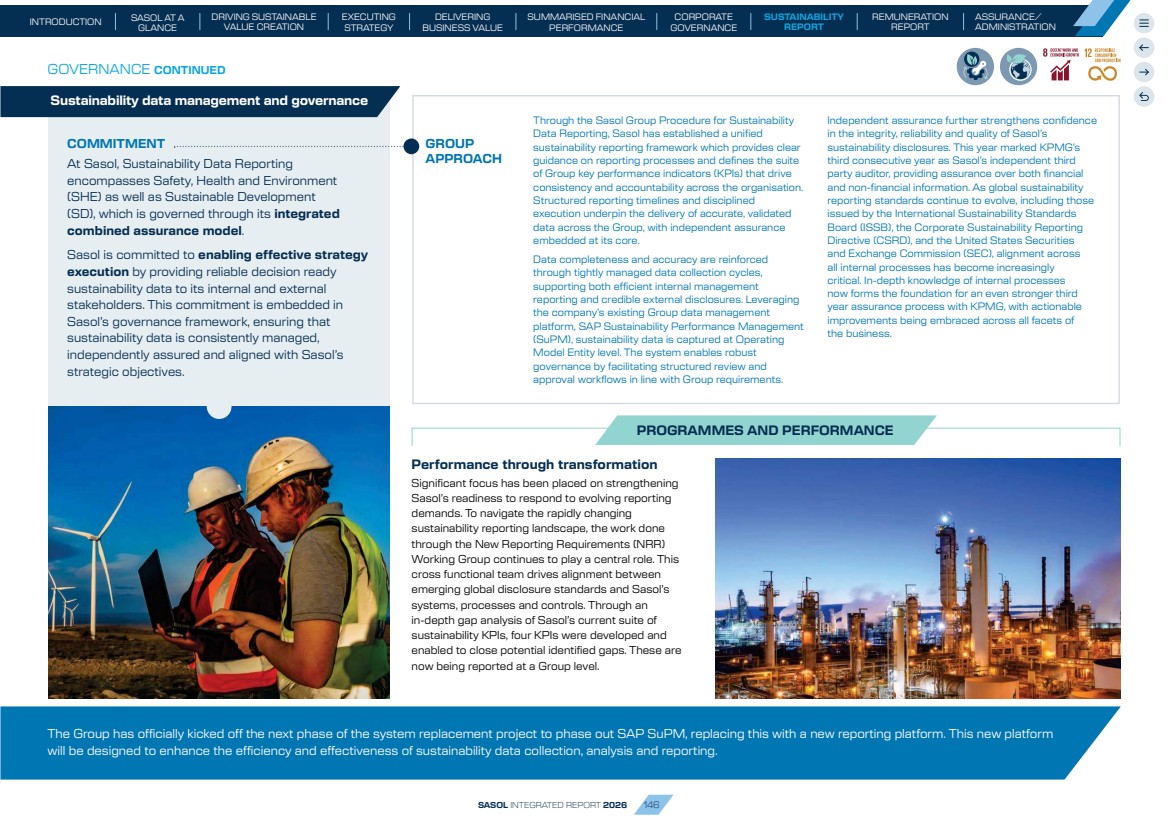
| GOVERNANCE CONTINUED Ethics continued COMMITMENT At Sasol, Sustainability Data Reporting encompasses Safety, Health and Environment (SHE) as well as Sustainable Development (SD), which is governed through its integrated combined assurance model. Sasol is committed to enabling effective strategy execution by providing reliable decision ready sustainability data to its internal and external stakeholders. This commitment is embedded in Sasol’s governance framework, ensuring that sustainability data is consistently managed, independently assured and aligned with Sasol’s strategic objectives. Through the Sasol Group Procedure for Sustainability Data Reporting, Sasol has established a unified sustainability reporting framework which provides clear guidance on reporting processes and defines the suite of Group key performance indicators (KPIs) that drive consistency and accountability across the organisation. Structured reporting timelines and disciplined execution underpin the delivery of accurate, validated data across the Group, with independent assurance embedded at its core. Data completeness and accuracy are reinforced through tightly managed data collection cycles, supporting both efficient internal management reporting and credible external disclosures. Leveraging the company’s existing Group data management platform, SAP Sustainability Performance Management (SuPM), sustainability data is captured at Operating Model Entity level. The system enables robust governance by facilitating structured review and approval workflows in line with Group requirements. Independent assurance further strengthens confidence in the integrity, reliability and quality of Sasol’s sustainability disclosures. This year marked KPMG’s third consecutive year as Sasol’s independent third party auditor, providing assurance over both financial and non-financial information. As global sustainability reporting standards continue to evolve, including those issued by the International Sustainability Standards Board (ISSB), the Corporate Sustainability Reporting Directive (CSRD), and the United States Securities and Exchange Commission (SEC), alignment across all internal processes has become increasingly critical. In-depth knowledge of internal processes now forms the foundation for an even stronger third year assurance process with KPMG, with actionable improvements being embraced across all facets of the business. GROUP APPROACH Sustainability data management and governance Performance through transformation Significant focus has been placed on strengthening Sasol’s readiness to respond to evolving reporting demands. To navigate the rapidly changing sustainability reporting landscape, the work done through the New Reporting Requirements (NRR) Working Group continues to play a central role. This cross functional team drives alignment between emerging global disclosure standards and Sasol’s systems, processes and controls. Through an in-depth gap analysis of Sasol’s current suite of sustainability KPIs, four KPIs were developed and enabled to close potential identified gaps. These are now being reported at a Group level. PROGRAMMES AND PERFORMANCE The Group has officially kicked off the next phase of the system replacement project to phase out SAP SuPM, replacing this with a new reporting platform. This new platform will be designed to enhance the efficiency and effectiveness of sustainability data collection, analysis and reporting. SASOL INTEGRATED REPORT 2026 146 SUSTAINABILITY REPORT SASOL AT A GLANCE DRIVING SUSTAINABLE VALUE CREATION EXECUTING STRATEGY INTRODUCTION DELIVERING BUSINESS VALUE CORPORATE GOVERNANCE SUMMARISED FINANCIAL PERFORMANCE ASSURANCE/ ADMINISTRATION REMUNERATION REPORT |
| REMUNERATION REPORT We are committed to maintaining a Remuneration Policy that is aligned with Sasol’s Purpose, strategic priorities and values. Through our remuneration outcomes, we incentivise and reward the delivery of sustainable performance across our People, Planet and Profit objectives, thereby supporting long-term value creation for all stakeholders. THIS REMUNERATION REPORT CONTAINS THREE PARTS: PART I Remuneration at a glance 148 Committee Chairman’s background statement 151 PART II Remuneration Policy (FY27 to FY29) 156 PART III Remuneration Implementation Report (FY26) 164 SASOL INTEGRATED REPORT 2026 147 SUSTAINABILITY REPORT SASOL AT A GLANCE DRIVING SUSTAINABLE VALUE CREATION EXECUTING STRATEGY INTRODUCTION DELIVERING BUSINESS VALUE CORPORATE GOVERNANCE SUMMARISED FINANCIAL PERFORMANCE ASSURANCE / ADMINISTRATION REMUNERATION REPORT |
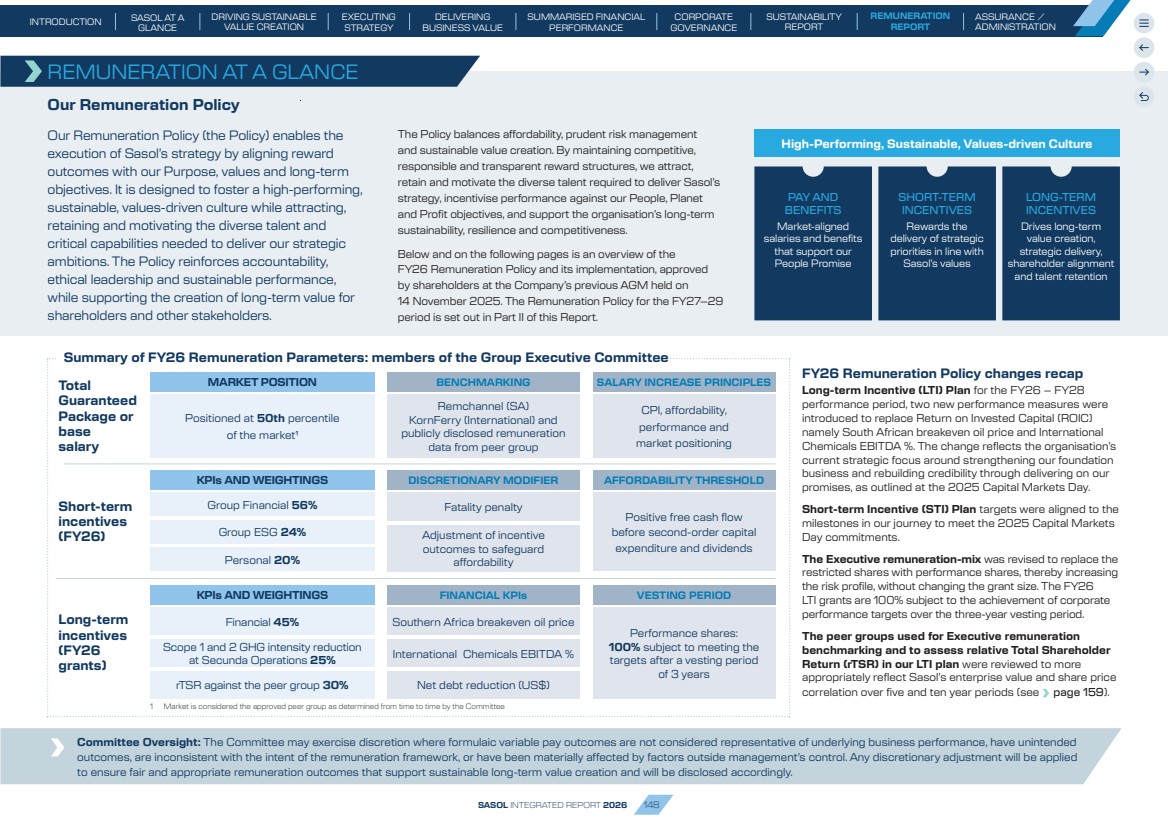
| Our Remuneration Policy Our Remuneration Policy (the Policy) enables the execution of Sasol’s strategy by aligning reward outcomes with our Purpose, values and long-term objectives. It is designed to foster a high-performing, sustainable, values-driven culture while attracting, retaining and motivating the diverse talent and critical capabilities needed to deliver our strategic ambitions. The Policy reinforces accountability, ethical leadership and sustainable performance, while supporting the creation of long-term value for shareholders and other stakeholders. REMUNERATION AT A GLANCE Financial 45% Scope 1 and 2 GHG intensity reduction at Secunda Operations 25% rTSR against the peer group 30% KPIs AND WEIGHTINGS Southern Africa breakeven oil price International Chemicals EBITDA % Net debt reduction (US$) VESTING PERIOD Performance shares: 100% subject to meeting the targets after a vesting period of 3 years Long-term incentives (FY26 grants) Fatality penalty DISCRETIONARY MODIFIER Positive free cash flow before second-order capital expenditure and dividends AFFORDABILITY THRESHOLD Group Financial 56% Group ESG 24% Personal 20% KPIs AND WEIGHTINGS Short-term incentives (FY26) Remchannel (SA) KornFerry (International) and publicly disclosed remuneration data from peer group BENCHMARKING CPI, affordability, performance and market positioning SALARY INCREASE PRINCIPLES Positioned at 50th percentile of the market1 Total MARKET POSITION Guaranteed Package or base salary Committee Oversight: The Committee may exercise discretion where formulaic variable pay outcomes are not considered representative of underlying business performance, have unintended outcomes, are inconsistent with the intent of the remuneration framework, or have been materially affected by factors outside management’s control. Any discretionary adjustment will be applied to ensure fair and appropriate remuneration outcomes that support sustainable long-term value creation and will be disclosed accordingly. FY26 Remuneration Policy changes recap Long-term Incentive (LTI) Plan for the FY26 – FY28 performance period, two new performance measures were introduced to replace Return on Invested Capital (ROIC) namely South African breakeven oil price and International Chemicals EBITDA %. The change reflects the organisation’s current strategic focus around strengthening our foundation business and rebuilding credibility through delivering on our promises, as outlined at the 2025 Capital Markets Day. Short-term Incentive (STI) Plan targets were aligned to the milestones in our journey to meet the 2025 Capital Markets Day commitments. The Executive remuneration-mix was revised to replace the restricted shares with performance shares, thereby increasing the risk profile, without changing the grant size. The FY26 LTI grants are 100% subject to the achievement of corporate performance targets over the three-year vesting period. The peer groups used for Executive remuneration benchmarking and to assess relative Total Shareholder Return (rTSR) in our LTI plan were reviewed to more appropriately reflect Sasol’s enterprise value and share price correlation over five and ten year periods (see page 159). Summary of FY26 Remuneration Parameters: members of the Group Executive Committee High-Performing, Sustainable, Values-driven Culture LONG-TERM INCENTIVES Drives long-term value creation, strategic delivery, shareholder alignment and talent retention SHORT-TERM INCENTIVES Rewards the delivery of strategic priorities in line with Sasol’s values PAY AND BENEFITS Market-aligned salaries and benefits that support our People Promise The Policy balances affordability, prudent risk management and sustainable value creation. By maintaining competitive, responsible and transparent reward structures, we attract, retain and motivate the diverse talent required to deliver Sasol’s strategy, incentivise performance against our People, Planet and Profit objectives, and support the organisation’s long-term sustainability, resilience and competitiveness. Below and on the following pages is an overview of the FY26 Remuneration Policy and its implementation, approved by shareholders at the Company’s previous AGM held on 14 November 2025. The Remuneration Policy for the FY27–29 period is set out in Part II of this Report. FINANCIAL KPIs Adjustment of incentive outcomes to safeguard affordability 1 Market is considered the approved peer group as determined from time to time by the Committee SASOL INTEGRATED REPORT 2026 148 SUSTAINABILITY REPORT SASOL AT A GLANCE DRIVING SUSTAINABLE VALUE CREATION EXECUTING STRATEGY INTRODUCTION DELIVERING BUSINESS VALUE CORPORATE GOVERNANCE SUMMARISED FINANCIAL PERFORMANCE ASSURANCE / ADMINISTRATION REMUNERATION REPORT |
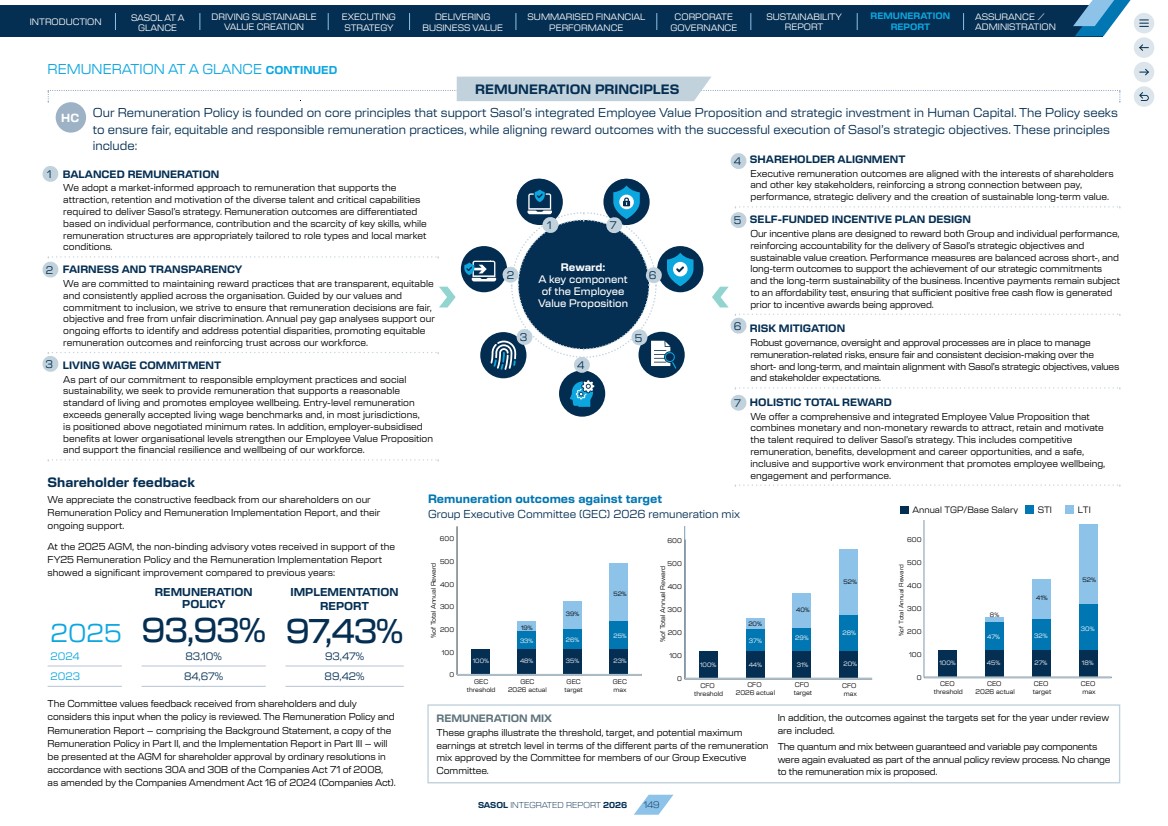
| REMUNERATION AT A GLANCE CONTINUED Shareholder feedback We appreciate the constructive feedback from our shareholders on our Remuneration Policy and Remuneration Implementation Report, and their ongoing support. At the 2025 AGM, the non-binding advisory votes received in support of the FY25 Remuneration Policy and the Remuneration Implementation Report showed a significant improvement compared to previous years: 2025 2024 2023 83,10% 84,67% 93,47% 89,42% The Committee values feedback received from shareholders and duly considers this input when the policy is reviewed. The Remuneration Policy and Remuneration Report – comprising the Background Statement, a copy of the Remuneration Policy in Part II, and the Implementation Report in Part III – will be presented at the AGM for shareholder approval by ordinary resolutions in accordance with sections 30A and 30B of the Companies Act 71 of 2008, as amended by the Companies Amendment Act 16 of 2024 (Companies Act). REMUNERATION POLICY 93,93% IMPLEMENTATION REPORT 97,43% Group Executive Committee (GEC) 2026 remuneration mix REMUNERATION MIX These graphs illustrate the threshold, target, and potential maximum earnings at stretch level in terms of the different parts of the remuneration mix approved by the Committee for members of our Group Executive Committee. In addition, the outcomes against the targets set for the year under review are included. The quantum and mix between guaranteed and variable pay components were again evaluated as part of the annual policy review process. No change to the remuneration mix is proposed. %of Total Annual Reward 0 100 200 300 400 500 600 GEC max GEC target GEC 2026 actual GEC threshold 19% 100% 48% 33% 35% 26% 39% 23% 25% 52% 0 100 200 300 400 500 600 %of Total Annual Reward CFO max CFO target CFO 2026 actual CFO threshold 100% 44% 37% 31% 20% 28% 52% 29% 40% 20% 0 100 200 300 400 500 600 700 %of Total Annual Reward CEO max CEO target CEO 2026 actual CEO threshold 100% 45% 47% 8% 27% 32% 41% 18% 30% 52% Remuneration outcomes against target Annual TGP/Base Salary STI LTI Our Remuneration Policy is founded on core principles that support Sasol’s integrated Employee Value Proposition and strategic investment in Human Capital. The Policy seeks to ensure fair, equitable and responsible remuneration practices, while aligning reward outcomes with the successful execution of Sasol’s strategic objectives. These principles include: 4 SHAREHOLDER ALIGNMENT Executive remuneration outcomes are aligned with the interests of shareholders and other key stakeholders, reinforcing a strong connection between pay, performance, strategic delivery and the creation of sustainable long-term value. 5 SELF-FUNDED INCENTIVE PLAN DESIGN Our incentive plans are designed to reward both Group and individual performance, reinforcing accountability for the delivery of Sasol’s strategic objectives and sustainable value creation. Performance measures are balanced across short-, and long-term outcomes to support the achievement of our strategic commitments and the long-term sustainability of the business. Incentive payments remain subject to an affordability test, ensuring that sufficient positive free cash flow is generated prior to incentive awards being approved. 6 RISK MITIGATION Robust governance, oversight and approval processes are in place to manage remuneration-related risks, ensure fair and consistent decision-making over the short- and long-term, and maintain alignment with Sasol’s strategic objectives, values and stakeholder expectations. 7 HOLISTIC TOTAL REWARD We offer a comprehensive and integrated Employee Value Proposition that combines monetary and non-monetary rewards to attract, retain and motivate the talent required to deliver Sasol’s strategy. This includes competitive remuneration, benefits, development and career opportunities, and a safe, inclusive and supportive work environment that promotes employee wellbeing, engagement and performance. 1 BALANCED REMUNERATION We adopt a market-informed approach to remuneration that supports the attraction, retention and motivation of the diverse talent and critical capabilities required to deliver Sasol’s strategy. Remuneration outcomes are differentiated based on individual performance, contribution and the scarcity of key skills, while remuneration structures are appropriately tailored to role types and local market conditions. 2 FAIRNESS AND TRANSPARENCY We are committed to maintaining reward practices that are transparent, equitable and consistently applied across the organisation. Guided by our values and commitment to inclusion, we strive to ensure that remuneration decisions are fair, objective and free from unfair discrimination. Annual pay gap analyses support our ongoing efforts to identify and address potential disparities, promoting equitable remuneration outcomes and reinforcing trust across our workforce. 3 LIVING WAGE COMMITMENT As part of our commitment to responsible employment practices and social sustainability, we seek to provide remuneration that supports a reasonable standard of living and promotes employee wellbeing. Entry-level remuneration exceeds generally accepted living wage benchmarks and, in most jurisdictions, is positioned above negotiated minimum rates. In addition, employer-subsidised benefits at lower organisational levels strengthen our Employee Value Proposition and support the financial resilience and wellbeing of our workforce. 5 4 3 2 1 7 6 Reward: A key component of the Employee Value Proposition REMUNERATION PRINCIPLES HC 1 4 5 6 7 2 3 SASOL INTEGRATED REPORT 2026 149 SUSTAINABILITY REPORT SASOL AT A GLANCE DRIVING SUSTAINABLE VALUE CREATION EXECUTING STRATEGY INTRODUCTION DELIVERING BUSINESS VALUE CORPORATE GOVERNANCE SUMMARISED FINANCIAL PERFORMANCE ASSURANCE / ADMINISTRATION REMUNERATION REPORT |
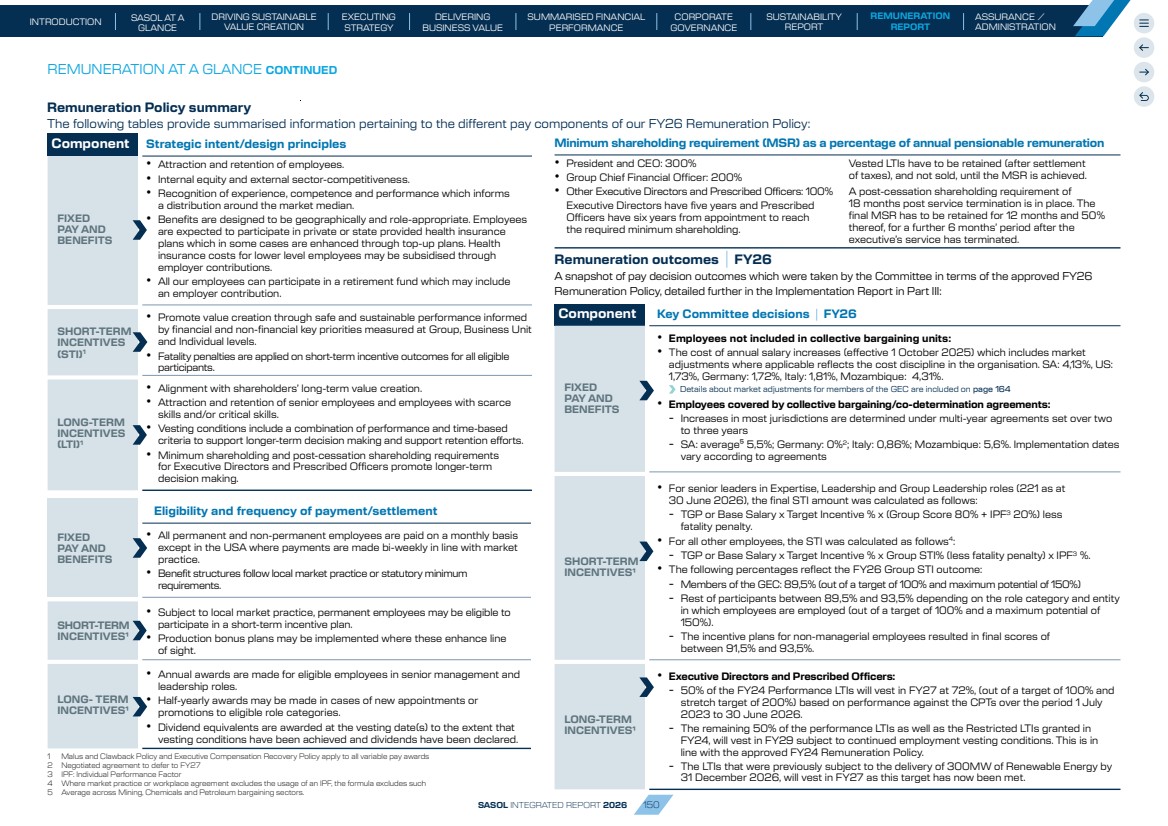
| Component Strategic intent/design principles FIXED PAY AND BENEFITS • Attraction and retention of employees. • Internal equity and external sector-competitiveness. • Recognition of experience, competence and performance which informs a distribution around the market median. • Benefits are designed to be geographically and role-appropriate. Employees are expected to participate in private or state provided health insurance plans which in some cases are enhanced through top-up plans. Health insurance costs for lower level employees may be subsidised through employer contributions. • All our employees can participate in a retirement fund which may include an employer contribution. SHORT-TERM INCENTIVES (STI)1 • Promote value creation through safe and sustainable performance informed by financial and non-financial key priorities measured at Group, Business Unit and Individual levels. • Fatality penalties are applied on short-term incentive outcomes for all eligible participants. LONG-TERM INCENTIVES (LTI)1 • Alignment with shareholders’ long-term value creation. • Attraction and retention of senior employees and employees with scarce skills and/or critical skills. • Vesting conditions include a combination of performance and time-based criteria to support longer-term decision making and support retention efforts. • Minimum shareholding and post-cessation shareholding requirements for Executive Directors and Prescribed Officers promote longer-term decision making. FIXED PAY AND BENEFITS Eligibility and frequency of payment/settlement • All permanent and non-permanent employees are paid on a monthly basis except in the USA where payments are made bi-weekly in line with market practice. • Benefit structures follow local market practice or statutory minimum requirements. SHORT-TERM INCENTIVES1 • Subject to local market practice, permanent employees may be eligible to participate in a short-term incentive plan. • Production bonus plans may be implemented where these enhance line of sight. LONG- TERM INCENTIVES1 • Annual awards are made for eligible employees in senior management and leadership roles. • Half-yearly awards may be made in cases of new appointments or promotions to eligible role categories. • Dividend equivalents are awarded at the vesting date(s) to the extent that vesting conditions have been achieved and dividends have been declared. 1 Malus and Clawback Policy and Executive Compensation Recovery Policy apply to all variable pay awards 2 Negotiated agreement to defer to FY27 3 IPF: Individual Performance Factor 4 Where market practice or workplace agreement excludes the usage of an IPF, the formula excludes such 5 Average across Mining, Chemicals and Petroleum bargaining sectors. Remuneration Policy summary The following tables provide summarised information pertaining to the different pay components of our FY26 Remuneration Policy: Minimum shareholding requirement (MSR) as a percentage of annual pensionable remuneration • President and CEO: 300% • Group Chief Financial Officer: 200% • Other Executive Directors and Prescribed Officers: 100% Executive Directors have five years and Prescribed Officers have six years from appointment to reach the required minimum shareholding. Vested LTIs have to be retained (after settlement of taxes), and not sold, until the MSR is achieved. A post-cessation shareholding requirement of 18 months post service termination is in place. The final MSR has to be retained for 12 months and 50% thereof, for a further 6 months’ period after the executive’s service has terminated. Remuneration outcomes FY26 A snapshot of pay decision outcomes which were taken by the Committee in terms of the approved FY26 Remuneration Policy, detailed further in the Implementation Report in Part III: Component Key Committee decisions FY26 FIXED PAY AND BENEFITS • Employees not included in collective bargaining units: • The cost of annual salary increases (effective 1 October 2025) which includes market adjustments where applicable reflects the cost discipline in the organisation. SA: 4,13%, US: 1,73%, Germany: 1,72%, Italy: 1,81%, Mozambique: 4,31%. Details about market adjustments for members of the GEC are included on page 164 • Employees covered by collective bargaining/co-determination agreements: - Increases in most jurisdictions are determined under multi-year agreements set over two to three years - SA: average⁵ 5,5%; Germany: 0%2; Italy: 0,86%; Mozambique: 5,6%. Implementation dates vary according to agreements SHORT-TERM INCENTIVES1 • For senior leaders in Expertise, Leadership and Group Leadership roles (221 as at 30 June 2026), the final STI amount was calculated as follows: - TGP or Base Salary x Target Incentive % x (Group Score 80% + IPF3 20%) less fatality penalty. • For all other employees, the STI was calculated as follows4: - TGP or Base Salary x Target Incentive % x Group STI% (less fatality penalty) x IPF3 %. • The following percentages reflect the FY26 Group STI outcome: - Members of the GEC: 89,5% (out of a target of 100% and maximum potential of 150%) - Rest of participants between 89,5% and 93,5% depending on the role category and entity in which employees are employed (out of a target of 100% and a maximum potential of 150%). - The incentive plans for non-managerial employees resulted in final scores of between 91,5% and 93,5%. LONG-TERM INCENTIVES1 • Executive Directors and Prescribed Officers: - 50% of the FY24 Performance LTIs will vest in FY27 at 72%, (out of a target of 100% and stretch target of 200%) based on performance against the CPTs over the period 1 July 2023 to 30 June 2026. - The remaining 50% of the performance LTIs as well as the Restricted LTIs granted in FY24, will vest in FY29 subject to continued employment vesting conditions. This is in line with the approved FY24 Remuneration Policy. - The LTIs that were previously subject to the delivery of 300MW of Renewable Energy by 31 December 2026, will vest in FY27 as this target has now been met. REMUNERATION AT A GLANCE CONTINUED SASOL INTEGRATED REPORT 2026 150 SUSTAINABILITY REPORT SASOL AT A GLANCE DRIVING SUSTAINABLE VALUE CREATION EXECUTING STRATEGY INTRODUCTION DELIVERING BUSINESS VALUE CORPORATE GOVERNANCE SUMMARISED FINANCIAL PERFORMANCE ASSURANCE / ADMINISTRATION REMUNERATION REPORT |
| Dear stakeholders FY26 marked an important year in the execution of Sasol’s strategic agenda. Building on the strategic direction articulated at the 2025 Capital Markets Day, Sasol continued to advance its plans to strengthen, grow and transform the business, supported by a disciplined financial framework. Throughout the year, the Committee carefully considered progress against these strategic commitments to ensure that remuneration outcomes remained aligned with performance, strategy execution and sustainable long-term value creation. DR. MARTINA FLÖEL // Chairman of Remuneration Committee PART I: REMUNERATION COMMITTEE CHAIRMAN’S BACKGROUND STATEMENT I am pleased to present the Remuneration Report for the financial year ended 30 June 2026. FY26 marked an important year in the execution of Sasol’s strategic agenda. As the Company progressed its plans to strengthen, grow and transform the business in an evolving global environment, the Committee remained focused on ensuring that our Remuneration Policy and outcomes continued to support the delivery of our strategic objectives, sustainable performance and long-term value creation. During FY26, the Committee focused on: • Aligning remuneration outcomes with Sasol’s strategic priorities and long-term value creation objectives. • Recognising performance across the Group, Business Units and individual employees. • Reviewing the Remuneration Policy to ensure continued alignment with strategy, governance requirements and shareholder expectations. • Retaining key and critical talent while maintaining a disciplined approach to cost management in a challenging macroeconomic environment. KEY MESSAGES The Remuneration Committee remains focused on ensuring that our reward framework supports Sasol’s strategic ambitions, incentivises the achievement of both short- and long-term priorities, reflects shareholder expectations and enables the attraction and retention of critical talent. Our unwavering commitment to safety remains a fundamental consideration in all discussions relating to performance, behaviour and remuneration outcomes. In addition to its review of the forward-looking Remuneration Policy detailed in Part II, the Committee also considered and approved market-related, competitive remuneration structures for FY27. As Sasol continued to advance its strategic agenda, the Committee carefully considered the Group’s performance against agreed targets and assessed whether performance measures and milestones remained appropriately aligned with the achievement of Sasol’s priorities over the short- and long-term periods. Shareholder feedback and engagement We value the continued engagement and support of our shareholders. At the 2025 Annual General Meeting, the Remuneration Policy received 93,93% shareholder support, while the Implementation Report received support of 97,43%. In June 2026, I, together with management, met with major institutional shareholders ahead of the FY27 remuneration cycle to discuss policy developments and remuneration structures. Shareholder feedback was carefully considered and, where appropriate, incorporated into the FY27 remuneration framework, further strengthening the alignment between remuneration, performance and sustainable long-term value creation. SASOL INTEGRATED REPORT 2026 151 SUSTAINABILITY REPORT SASOL AT A GLANCE DRIVING SUSTAINABLE VALUE CREATION EXECUTING STRATEGY INTRODUCTION DELIVERING BUSINESS VALUE CORPORATE GOVERNANCE SUMMARISED FINANCIAL PERFORMANCE ASSURANCE / ADMINISTRATION REMUNERATION REPORT |
| PART I: REMUNERATION COMMITTEE CHAIRMAN’S BACKGROUND STATEMENT CONTINUED During the year under review, the Remuneration Policy was formally reviewed against prevailing market practice and the remuneration frameworks of relevant peer companies to assess its continued competitiveness, appropriateness and alignment with Sasol’s strategic objectives. The review did not identify any material gaps or strategic considerations requiring policy changes, but the policy was updated to ensure alignment with the changes to the Companies Act 71 of 2008, as amended by the Companies Amendment Act 16 of 2024 – South Africa (Companies Act) sections 30A and 30B, the JSE Listings Requirements and Principle 11 of the King V Report on Corporate Governance™ in South Africa, 2025. Accordingly, the Committee elected to retain the core principles and overall structure of the Remuneration Policy, recognising that stability and consistency support the successful execution of Sasol’s strategy. No material changes were made to the Policy framework, although annual incentive design principles (including the formula used in the calculation of incentives) and performance targets were refined to reflect the Group’s evolving strategic priorities. The Committee will continue to monitor external developments and shareholder expectations to ensure that the Policy remains fit for purpose. The Committee also ensured that the FY26 incentive frameworks remained closely aligned with the delivery of Sasol’s strategic priorities. The annual incentive framework was refined to strengthen accountability for the execution of key near-term priorities focused on improving operational performance, strengthening cash generation and supporting the delivery of commitments made at the 2025 Capital Markets Day. To further strengthen capital discipline and cash generation, the sustenance capital expenditure target was incorporated into the free cash flow to turnover metric, enhancing the relationship between operational performance, capital allocation and cash outcomes. The long-term incentive framework was similarly refined to support the delivery of Sasol’s strategic priorities over the FY26 – FY28 performance cycle. The Return on Invested Capital (ROIC) measure was temporarily replaced with performance measures that more directly support the Group’s current focus on strengthening the foundation business, improving financial resilience and reducing net debt. The Committee intends to reconsider the inclusion of ROIC as the capital investment programme progresses and value creation priorities evolve. New LTI measures were introduced to drive sustained improvement in cash generation and operational resilience, including a target for the International Chemicals business to achieve an EBITDA margin of 15% by FY28, and for the South African business, a target to reach a breakeven oil price of US$50 by FY28. Legal and Regulatory Update On 22 May 2026, sections 30A and 30B of the Companies Act came into force with immediate effect. These sections replace the previous non-binding advisory voting regime under the JSE Listings Requirements with an ordinary vote regime. Specifically: • Section 30A provides that the Remuneration Policy, detailed in Part II of this Report, must be presented at the AGM for approval by shareholders through an ordinary resolution every three years or whenever a material amendment to the policy is made, whichever occurs first. • Section 30B provides that the Remuneration Report, comprising the Background Statement, a copy of the Remuneration Policy, and the Implementation Report must be presented at the AGM for approval by shareholders through ordinary resolution every year. Section 30B also introduces certain remuneration disclosures that must be made in the Implementation Report, detailed in Part III of this Report. Regulatory compliance Our reporting complies with the: JSE Limited (JSE) Listings Requirements IR AFS United States Securities and Exchange Commission (SEC) rules and regulations 20-F South African Companies Act 71 of 2008, as amended IR AFS King IV and V™ Reports on Corporate Governance for South Africa IR AFS The Committee’s focus for the year under review To ensure that Sasol’s remuneration practices remain competitive, fit for purpose and aligned with the Group’s strategy, the Committee undertook the following key activities during FY26: • Reviewed and approved the executive remuneration mix against relevant market benchmarks, informed by advice from the independent remuneration advisor. • Approved the annual salary increase budgets for the workforce. • Approved salary increases (and some market adjustments) for Prescribed Officers and recommended to the Board for approval salary increases for the Group Company Secretary, the Chief Assurance Officer and the Executive Directors. These included market adjustments where appropriate. • Approved the design principles and performance targets applicable to the FY26 short-term and long-term incentive plans. • Reviewed remuneration practices, policy provisions and reward structures against market developments and relevant peer companies. • Reviewed horizontal and vertical pay gap analyses across our operations with more than 200 employees, confirming the absence of systemic discriminatory remuneration practices. In South Africa, this included both race- and gender-based pay equity assessments, as well as the remuneration gap review prescribed by section 30B of the Companies Act. • Considered people-related risks and trends as reported through the Group’s risk management processes. • Assessed whether any circumstances arose requiring the application of the Malus and Clawback Policy and confirmed that no such intervention was necessary during the year. • Conducted a scheduled review of and approved remuneration-related policies, including those dealing with minimum shareholding requirements, malus and clawback provisions and executive remuneration recovery mechanisms. • Considered shareholder voting outcomes, investor feedback and external advisor commentary on the Remuneration Report, and reviewed opportunities to further enhance remuneration disclosures and stakeholder engagement. • Reviewed the Committee’s Terms of Reference and annual work plan and approved the continued appointment of the independent remuneration advisor (Deloitte SA), for the next financial year. In the context of developing a compelling employee value proposition, the Committee also considered initiatives aimed at strengthening organisational effectiveness, inclusion and sustainable performance. In this context, the return of South African office-based employees to the office environment, five days per week, was supported as a means of enhancing collaboration, accountability and cross-functional integration in support of Sasol’s strategic priorities. SASOL INTEGRATED REPORT 2026 152 SUSTAINABILITY REPORT SASOL AT A GLANCE DRIVING SUSTAINABLE VALUE CREATION EXECUTING STRATEGY INTRODUCTION DELIVERING BUSINESS VALUE CORPORATE GOVERNANCE SUMMARISED FINANCIAL PERFORMANCE ASSURANCE / ADMINISTRATION REMUNERATION REPORT |
| PART I: REMUNERATION COMMITTEE CHAIRMAN’S BACKGROUND STATEMENT CONTINUED During the year, Sasol’s South African operations implemented a revised retirement fund strategy that intends to consolidate the number of retirement funds available to employees from four to two. This harmonisation enabled the introduction of a more cost-effective and enhanced group risk benefit structure for participating employees. The implementation commenced during the second half of FY26 and is expected to be finalised in FY27. In addition, the Committee reviewed workforce trends, including gender representation and workforce turnover with a particular focus on the Group’s ability to attract, retain and advance key talent segments. Consistent with emerging governance expectations and Sasol’s commitment to transparency, we voluntarily decided to disclose in the Implementation Report, the gender pay gap for our South African workforce, reinforcing our commitment to fairness, responsible governance and an inclusive workplace culture. Remuneration outcomes align with business outcomes FY26 represented a year of continued operational and financial recovery for Sasol. The Group delivered a materially improved performance relative to prior years, supported by stronger operational execution, improved production volumes, disciplined cost management and positive free cash flow generation. Performance against sustainability objectives was mixed, but the Committee was very pleased with the significant improvements in the Process and Occupational Safety performance. Notwithstanding these improvements, the Group suffered the tragic loss of two employees. The Committee extends its sincere condolences to their families, colleagues and loved ones. Safety remains an area of continued focus for management and the Board. Against this backdrop, the Committee considered the outcomes of both the annual Short-term Incentive (STI) and Long-term Incentive (LTI) plans. While financial performance improved meaningfully, certain financial measures remained below target. At the same time, management delivered strong operational, strategic and sustainability outcomes that support the long-term resilience, competitiveness and value creation potential of the business. The Committee therefore exercised its judgement within the approved policy framework to ensure that remuneration outcomes appropriately reflected both the improved financial performance and the delivery of critical strategic objectives. Accordingly, the Committee approved an FY26 STI outcome that recognises the strong delivery while remaining aligned with the Group’s affordability position. In respect of the FY24 LTI awards vesting in FY27, the Committee approved outcomes that reflected performance over the three-year period, including progress against the Group’s ESG commitments, balanced against outcomes on certain financial and shareholder return measures. There was no trigger identified in the past year to implement the Clawback and Malus or the Executive Recovery Policies. Fit for purpose incentive designs The Group’s incentive plans continue to motivate and reward employees in a manner that enables operational performance, reinforces desired behaviours and promotes sustainable value creation. Recognising the critical contribution of operational employees, plant-level production incentive plans in Southern Africa remained in place during FY26. These plans are designed to be simple, transparent and focused on the safe, efficient and reliable delivery of operational outcomes, while supporting an inclusive performance culture. The overall cost of these plans remains capped at the equivalent cost of partial participation (~15% – 40% of the STI target amount per role category) in the Group’s STI plan. During FY26, the Group introduced the My Marketing and Sales Incentive Plan as a pilot initiative. The pilot is intended to evaluate the effectiveness of a more tailored incentive approach for marketing and sales roles, consistent with the Group’s remuneration principles. The review at the end of the year confirmed that this Plan did not meaningfully change the performance and will therefore be reviewed in FY27. Top Up: LTI Pool In 2022, shareholders approved an allocation of shares equivalent to 5% of the Company’s issued share capital to support future LTI awards. Owing primarily to the significant depreciation in the Sasol share price since then, the approved share pool is expected to be fully utilised earlier than originally anticipated. Having considered alternative approaches, including cash-settled awards, we concluded that equity-settled awards remain the most appropriate mechanism to align executives’ interests with those of shareholders. Accordingly, we will seek shareholder approval at the 2026 AGM to replenish the LTI pool to 5% of the Company’s issued share capital, which, based on current modelling assumptions, is expected to support future awards until at least 2032. Looking Forward: FY27 In preparation for the FY27 Remuneration Policy review, I, with members of management, engaged with major institutional investors representing approximately 40% of issued share capital to discuss proposed policy refinements. The Committee carefully considered the feedback received and incorporated those recommendations that were aligned with the Group’s remuneration philosophy, strategic priorities and governance objectives. A key policy change is the removal of the Individual Performance Factor from the calculation of short-term incentive awards for members of the Group Executive Committee. As a result, STI outcomes for the GEC will be determined solely based on performance against the Group STI scorecard, consistent with prevailing market practice. There will be no change to the Performance Management Policy. The FY27 Remuneration Policy presented in Part II of this Report will be tabled for shareholder approval at the November 2026 AGM. Independent Advisor During the year, the Committee engaged external advisors as required to support the effective discharge of its responsibilities. Following a formal procurement process, Deloitte South Africa was appointed as the Committee’s independent remuneration advisor and attended Committee meetings from 1 September 2025. The Committee is satisfied that the advisor operated independently throughout the year and complied with all applicable governance and independence requirements. Closing The Committee remains committed to maintaining a remuneration framework that is fair, responsible and aligned with Sasol’s strategic priorities, values and long-term objectives. We believe that the remuneration outcomes reflected in this report appropriately recognise performance, support the successful execution of our strategy and promote sustainable long-term value creation for shareholders and other stakeholders. We thank our shareholders for their continued engagement and support and look forward to ongoing constructive dialogue as we continue to strengthen, grow and transform Sasol. DR. MARTINA FLÖEL Chairman of Remuneration Committee 28 August 2026 SASOL INTEGRATED REPORT 2026 153 SUSTAINABILITY REPORT SASOL AT A GLANCE DRIVING SUSTAINABLE VALUE CREATION EXECUTING STRATEGY INTRODUCTION DELIVERING BUSINESS VALUE CORPORATE GOVERNANCE SUMMARISED FINANCIAL PERFORMANCE ASSURANCE / ADMINISTRATION REMUNERATION REPORT |
| PART II: SECTION A – REMUNERATION POLICY Overview of remuneration elements Subject to shareholder approval being obtained under section 30A of the Companies Act, this Remuneration Policy will operate on a forward-looking basis for FY27 to FY29, and will remain subject to periodic review by the Committee to ensure that it remains fit for purpose. Fixed Pay Base salary or Total Guaranteed Package (TGP) is offered depending on location. TGP (in SA) includes the base salary and the cost of all employer contributions to approved benefit funds. Broad pay bands are set with reference to location and sector median benchmarks that reflect the complexity, scope and scale of our business to ensure that we attract and retain the employees required to drive the Group’s strategic objectives. The Committee approves the cost of annual increases after considering market and economic data as well as affordability. Individual increases are approved by the Committee (for Prescribed Officers) and the Board (for the Executive Directors and the Company Secretary) having regard to the benchmarks, budgets and individual performance. Application Salaries are paid monthly in all jurisdictions, except in the United States where bi-weekly payments are processed. In Germany, annual salaries are divided by 13 to enable payment of a 13th cheque in November. Annual salary increases are effective 1 October. Market or internal equity adjustments are approved when considered appropriate. Benefits and Allowances Benefits include, but are not limited to, membership of a retirement plan, healthcare, and risk cover which in some cases may be partly subsidised by the Company. • Informed by market practice, Executives can structure a car allowance from their TGP, or a dedicated Company-owned vehicle may be provided, depending on location. • Leave benefits are globally aligned and unused leave is paid out at service termination. • Additional benefits and allowances are offered to employees on expatriate assignments. • A chauffeur service is available for business travel and occasional private use and taxed accordingly. Application Benefits are designed in accordance with the relevant market practice for each jurisdiction within which we operate. Benefits are offered for retirement, for reasons of sickness, including health insurance, temporary and permanent disability, incapacity, or death. TO BE UPDATED EXECUTIVE REMUNERATION Where the Committee determines that a material amendment to this policy is necessary before the three-year approval cycle lapses, such amendment will be disclosed and the revised Remuneration Policy will be resubmitted to shareholders for fresh approval prior to implementation. The Committee is responsible for determining whether a proposed amendment is material, considering its likely effect on remuneration outcomes and shareholder expectations. This Remuneration Policy is designed to operate as an enduring framework setting out the Group’s policy on remuneration, with detail specific to each financial year disclosed separately in Part III, the Implementation Report, for the relevant financial year. Part II is divided into two sections: Section A sets out the Policy principles applicable to executive management; Section B sets out the Policy principles for the wider workforce. SASOL INTEGRATED REPORT 2026 154 SUSTAINABILITY REPORT SASOL AT A GLANCE DRIVING SUSTAINABLE VALUE CREATION EXECUTING STRATEGY INTRODUCTION DELIVERING BUSINESS VALUE CORPORATE GOVERNANCE SUMMARISED FINANCIAL PERFORMANCE ASSURANCE / ADMINISTRATION REMUNERATION REPORT |
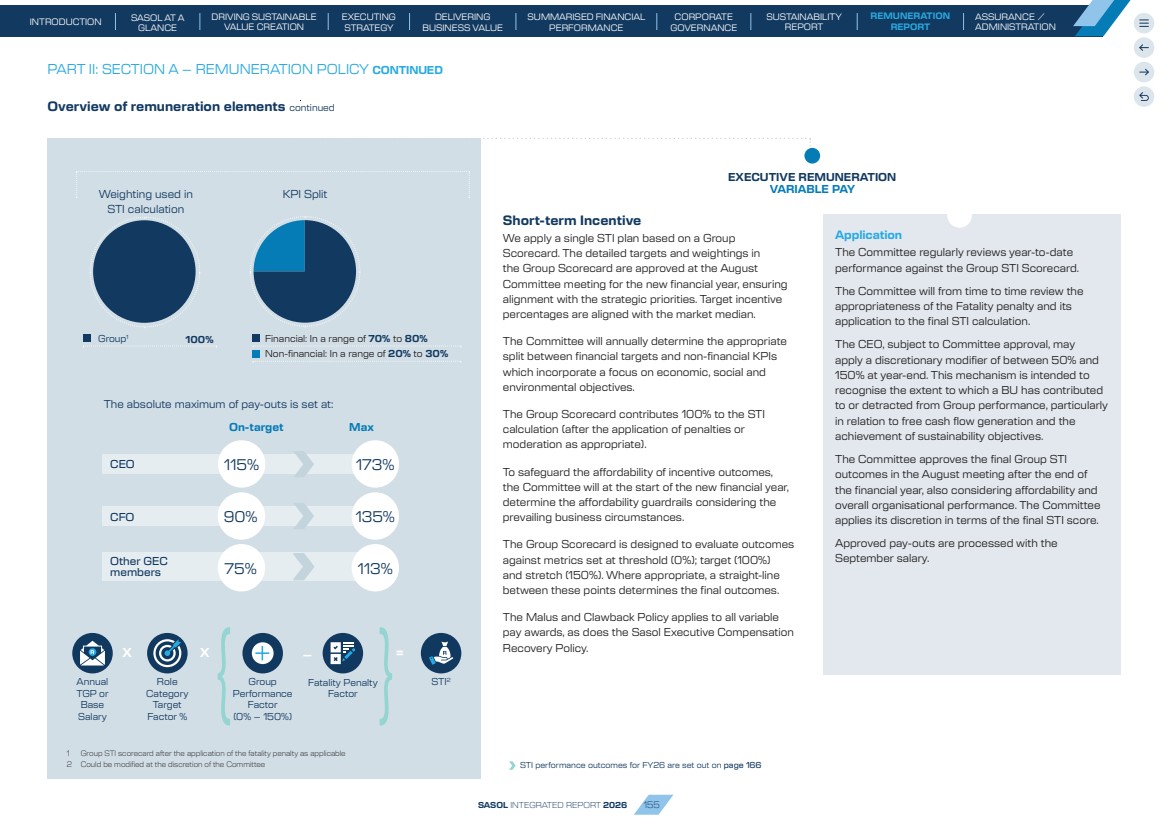
| Short-term Incentive We apply a single STI plan based on a Group Scorecard. The detailed targets and weightings in the Group Scorecard are approved at the August Committee meeting for the new financial year, ensuring alignment with the strategic priorities. Target incentive percentages are aligned with the market median. The Committee will annually determine the appropriate split between financial targets and non-financial KPIs which incorporate a focus on economic, social and environmental objectives. The Group Scorecard contributes 100% to the STI calculation (after the application of penalties or moderation as appropriate). To safeguard the affordability of incentive outcomes, the Committee will at the start of the new financial year, determine the affordability guardrails considering the prevailing business circumstances. The Group Scorecard is designed to evaluate outcomes against metrics set at threshold (0%); target (100%) and stretch (150%). Where appropriate, a straight-line between these points determines the final outcomes. The Malus and Clawback Policy applies to all variable pay awards, as does the Sasol Executive Compensation Recovery Policy. Application The Committee regularly reviews year-to-date performance against the Group STI Scorecard. The Committee will from time to time review the appropriateness of the Fatality penalty and its application to the final STI calculation. The CEO, subject to Committee approval, may apply a discretionary modifier of between 50% and 150% at year-end. This mechanism is intended to recognise the extent to which a BU has contributed to or detracted from Group performance, particularly in relation to free cash flow generation and the achievement of sustainability objectives. The Committee approves the final Group STI outcomes in the August meeting after the end of the financial year, also considering affordability and overall organisational performance. The Committee applies its discretion in terms of the final STI score. Approved pay-outs are processed with the September salary. STI performance outcomes for FY26 are set out on page 166 Overview of remuneration elements continued EXECUTIVE REMUNERATION VARIABLE PAY Group1 100% Weighting used in STI calculation Financial: In a range of 70% to 80% Non-financial: In a range of 20% to 30% KPI Split PART II: SECTION A – REMUNERATION POLICY CONTINUED On-target Max CEO CFO Other GEC members The absolute maximum of pay-outs is set at: 90% 75% 115% 173% 135% 113% X X – = Role Category Target Factor % Fatality Penalty Factor Annual TGP or Base Salary STI Group 2 Performance Factor (0% – 150%) 1 Group STI scorecard after the application of the fatality penalty as applicable 2 Could be modified at the discretion of the Committee SASOL INTEGRATED REPORT 2026 155 SUSTAINABILITY REPORT SASOL AT A GLANCE DRIVING SUSTAINABLE VALUE CREATION EXECUTING STRATEGY INTRODUCTION DELIVERING BUSINESS VALUE CORPORATE GOVERNANCE SUMMARISED FINANCIAL PERFORMANCE ASSURANCE / ADMINISTRATION REMUNERATION REPORT |
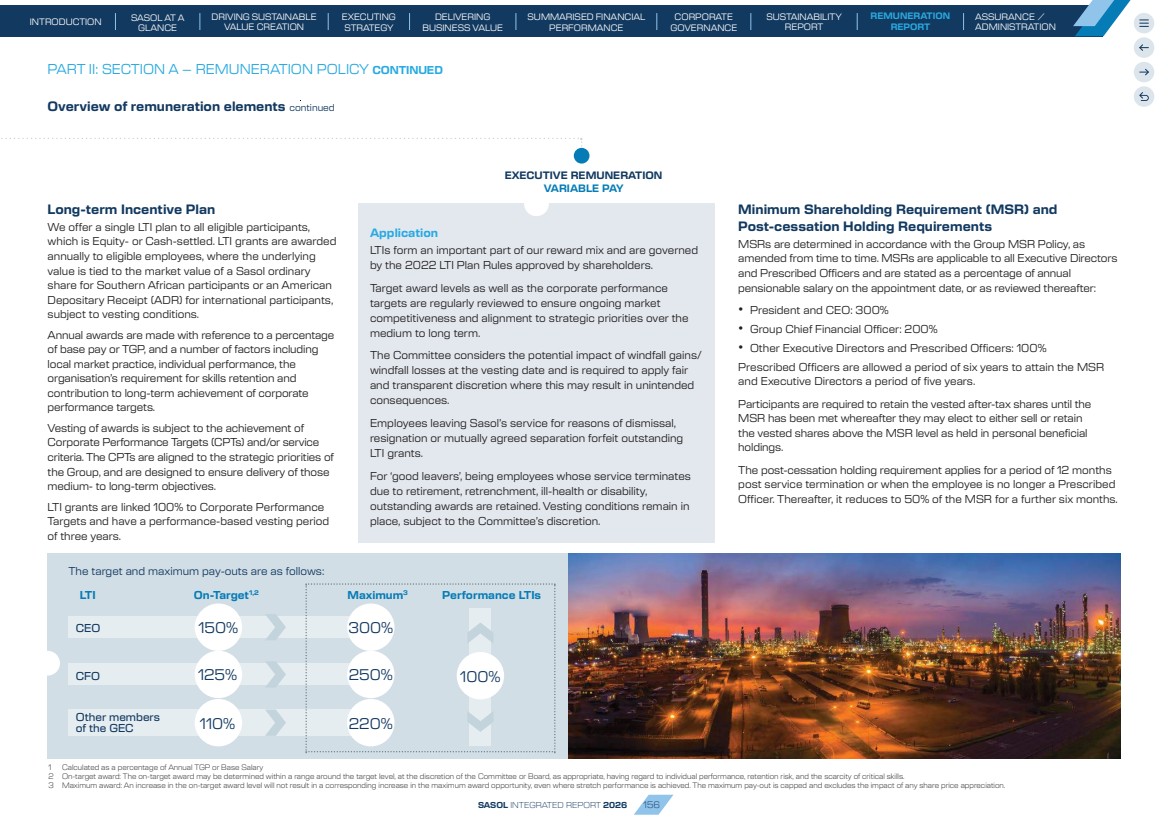
| Overview of remuneration elements continued Long-term Incentive Plan We offer a single LTI plan to all eligible participants, which is Equity- or Cash-settled. LTI grants are awarded annually to eligible employees, where the underlying value is tied to the market value of a Sasol ordinary share for Southern African participants or an American Depositary Receipt (ADR) for international participants, subject to vesting conditions. Annual awards are made with reference to a percentage of base pay or TGP, and a number of factors including local market practice, individual performance, the organisation’s requirement for skills retention and contribution to long-term achievement of corporate performance targets. Vesting of awards is subject to the achievement of Corporate Performance Targets (CPTs) and/or service criteria. The CPTs are aligned to the strategic priorities of the Group, and are designed to ensure delivery of those medium- to long-term objectives. LTI grants are linked 100% to Corporate Performance Targets and have a performance-based vesting period of three years. EXECUTIVE REMUNERATION VARIABLE PAY Minimum Shareholding Requirement (MSR) and Post-cessation Holding Requirements MSRs are determined in accordance with the Group MSR Policy, as amended from time to time. MSRs are applicable to all Executive Directors and Prescribed Officers and are stated as a percentage of annual pensionable salary on the appointment date, or as reviewed thereafter: • President and CEO: 300% • Group Chief Financial Officer: 200% • Other Executive Directors and Prescribed Officers: 100% Prescribed Officers are allowed a period of six years to attain the MSR and Executive Directors a period of five years. Participants are required to retain the vested after-tax shares until the MSR has been met whereafter they may elect to either sell or retain the vested shares above the MSR level as held in personal beneficial holdings. The post-cessation holding requirement applies for a period of 12 months post service termination or when the employee is no longer a Prescribed Officer. Thereafter, it reduces to 50% of the MSR for a further six months. PART II: SECTION A – REMUNERATION POLICY CONTINUED Application LTIs form an important part of our reward mix and are governed by the 2022 LTI Plan Rules approved by shareholders. Target award levels as well as the corporate performance targets are regularly reviewed to ensure ongoing market competitiveness and alignment to strategic priorities over the medium to long term. The Committee considers the potential impact of windfall gains/ windfall losses at the vesting date and is required to apply fair and transparent discretion where this may result in unintended consequences. Employees leaving Sasol’s service for reasons of dismissal, resignation or mutually agreed separation forfeit outstanding LTI grants. For ‘good leavers’, being employees whose service terminates due to retirement, retrenchment, ill-health or disability, outstanding awards are retained. Vesting conditions remain in place, subject to the Committee’s discretion. The target and maximum pay-outs are as follows: LTI On-Target1,2 Maximum3 Performance LTIs CEO CFO Other members of the GEC 125% 110% 150% 300% 250% 100% 220% 1 Calculated as a percentage of Annual TGP or Base Salary 2 On-target award: The on-target award may be determined within a range around the target level, at the discretion of the Committee or Board, as appropriate, having regard to individual performance, retention risk, and the scarcity of critical skills. 3 Maximum award: An increase in the on-target award level will not result in a corresponding increase in the maximum award opportunity, even where stretch performance is achieved. The maximum pay-out is capped and excludes the impact of any share price appreciation. SASOL INTEGRATED REPORT 2026 156 SUSTAINABILITY REPORT SASOL AT A GLANCE DRIVING SUSTAINABLE VALUE CREATION EXECUTING STRATEGY INTRODUCTION DELIVERING BUSINESS VALUE CORPORATE GOVERNANCE SUMMARISED FINANCIAL PERFORMANCE ASSURANCE / ADMINISTRATION REMUNERATION REPORT |
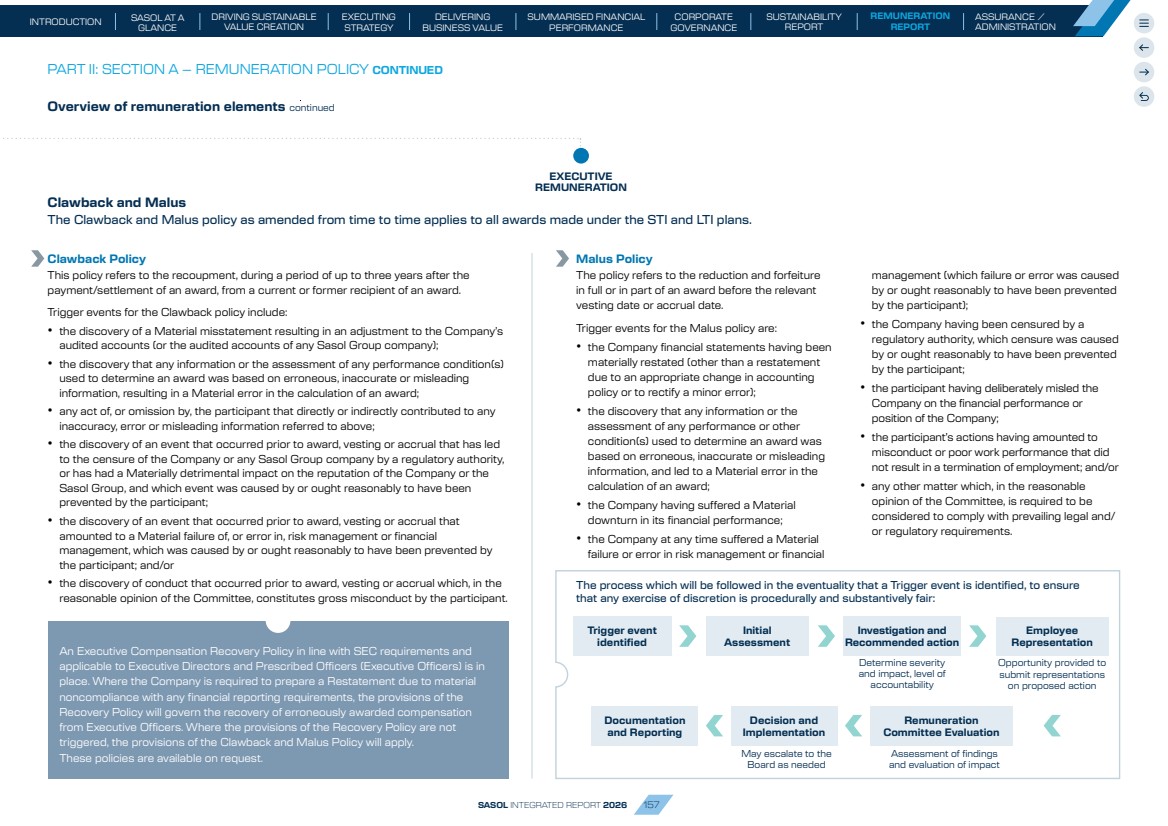
| Overview of remuneration elements continued Clawback and Malus The Clawback and Malus policy as amended from time to time applies to all awards made under the STI and LTI plans. Clawback Policy This policy refers to the recoupment, during a period of up to three years after the payment/settlement of an award, from a current or former recipient of an award. Trigger events for the Clawback policy include: • the discovery of a Material misstatement resulting in an adjustment to the Company’s audited accounts (or the audited accounts of any Sasol Group company); • the discovery that any information or the assessment of any performance condition(s) used to determine an award was based on erroneous, inaccurate or misleading information, resulting in a Material error in the calculation of an award; • any act of, or omission by, the participant that directly or indirectly contributed to any inaccuracy, error or misleading information referred to above; • the discovery of an event that occurred prior to award, vesting or accrual that has led to the censure of the Company or any Sasol Group company by a regulatory authority, or has had a Materially detrimental impact on the reputation of the Company or the Sasol Group, and which event was caused by or ought reasonably to have been prevented by the participant; • the discovery of an event that occurred prior to award, vesting or accrual that amounted to a Material failure of, or error in, risk management or financial management, which was caused by or ought reasonably to have been prevented by the participant; and/or • the discovery of conduct that occurred prior to award, vesting or accrual which, in the reasonable opinion of the Committee, constitutes gross misconduct by the participant. An Executive Compensation Recovery Policy in line with SEC requirements and applicable to Executive Directors and Prescribed Officers (Executive Officers) is in place. Where the Company is required to prepare a Restatement due to material noncompliance with any financial reporting requirements, the provisions of the Recovery Policy will govern the recovery of erroneously awarded compensation from Executive Officers. Where the provisions of the Recovery Policy are not triggered, the provisions of the Clawback and Malus Policy will apply. These policies are available on request. Malus Policy The policy refers to the reduction and forfeiture in full or in part of an award before the relevant vesting date or accrual date. Trigger events for the Malus policy are: • the Company financial statements having been materially restated (other than a restatement due to an appropriate change in accounting policy or to rectify a minor error); • the discovery that any information or the assessment of any performance or other condition(s) used to determine an award was based on erroneous, inaccurate or misleading information, and led to a Material error in the calculation of an award; • the Company having suffered a Material downturn in its financial performance; • the Company at any time suffered a Material failure or error in risk management or financial management (which failure or error was caused by or ought reasonably to have been prevented by the participant); • the Company having been censured by a regulatory authority, which censure was caused by or ought reasonably to have been prevented by the participant; • the participant having deliberately misled the Company on the financial performance or position of the Company; • the participant’s actions having amounted to misconduct or poor work performance that did not result in a termination of employment; and/or • any other matter which, in the reasonable opinion of the Committee, is required to be considered to comply with prevailing legal and/ or regulatory requirements. Initial Assessment May escalate to the Board as needed Employee Representation Investigation and Recommended action Remuneration Committee Evaluation Trigger event identified Documentation and Reporting Decision and Implementation Assessment of findings and evaluation of impact Opportunity provided to submit representations on proposed action Determine severity and impact, level of accountability EXECUTIVE REMUNERATION PART II: SECTION A – REMUNERATION POLICY CONTINUED The process which will be followed in the eventuality that a Trigger event is identified, to ensure that any exercise of discretion is procedurally and substantively fair: SASOL INTEGRATED REPORT 2026 157 SUSTAINABILITY REPORT SASOL AT A GLANCE DRIVING SUSTAINABLE VALUE CREATION EXECUTING STRATEGY INTRODUCTION DELIVERING BUSINESS VALUE CORPORATE GOVERNANCE SUMMARISED FINANCIAL PERFORMANCE ASSURANCE / ADMINISTRATION REMUNERATION REPORT |
| Remuneration Committee: Risk and Governance Sasol conforms to all applicable statutes and remuneration regulations and governance codes in the different jurisdictions where it conducts business and the Committee conducts itself in accordance with its Terms of Reference as amended from time to time. The Committee is appointed by the Board to assist in ensuring that the Group pays its employees in a fair, responsible and transparent manner by putting in place affordable, competitive and equitable reward systems that encourage the accomplishment of strategic goals and favourable results over the short, medium and long term. Following careful evaluation of performance in relation to the pre-approved targets that have been established for the performance period, all incentive pay-outs and the vesting of performance LTIs are authorised. Salary increases are approved individually by the Committee for Prescribed Officers and by the Board for Executive Directors, the Chief Assurance Officer and the Group Company Secretary. Members of management are recused from meetings when matters impacting their own remuneration are discussed. In these meetings, the Committee discusses and confirms all decisions taken without management present. The Committee ensures effective risk management oversight in relation to material remuneration risks within its scope. The following processes mitigate against unintended outcomes and risks: The Committee considers people related risks on a quarterly basis. The Remuneration Policy is transparent and made available to all stakeholders. All executive reward policy exceptions are approved by the Committee or the Board, as appropriate. Incentive plan design principles and targets as well as the reward mix are reviewed annually to ensure alignment with strategy and the market. The vesting of LTI plans is subject to corporate performance and/or time-based criteria. Grants are never backdated nor awarded in a closed period. Executives do not approve their own benefits or remuneration and are recused from all discussions relating to their own remuneration. The maximum incentive awards, based on performance outcomes, but not share price movement, are capped by a pre-approved formula. The Committee retains discretion to alter any reward outcomes or deviate from this Policy if this is considered to be in the best interests of the Company. MSRs and post-cessation shareholding requirements are implemented for Executive Directors and Prescribed Officers. A comprehensive Malus and Clawback Policy as well as an Executive Compensation Recovery Policy apply. www The Committee’s Terms of Reference and the Group Remuneration Policy are available on our website: www.sasol.com PART II: SECTION A – REMUNERATION POLICY CONTINUED SASOL INTEGRATED REPORT 2026 158 SUSTAINABILITY REPORT SASOL AT A GLANCE DRIVING SUSTAINABLE VALUE CREATION EXECUTING STRATEGY INTRODUCTION DELIVERING BUSINESS VALUE CORPORATE GOVERNANCE SUMMARISED FINANCIAL PERFORMANCE ASSURANCE / ADMINISTRATION REMUNERATION REPORT |
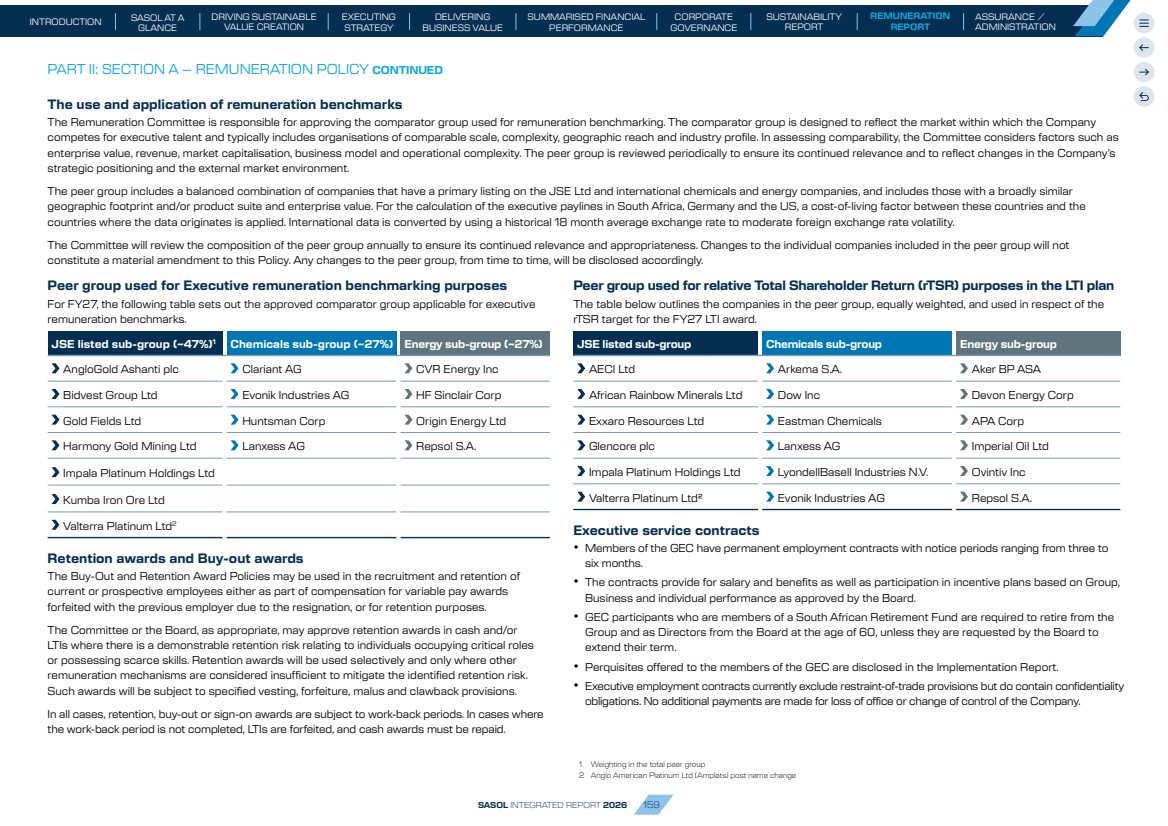
| The use and application of remuneration benchmarks The Remuneration Committee is responsible for approving the comparator group used for remuneration benchmarking. The comparator group is designed to reflect the market within which the Company competes for executive talent and typically includes organisations of comparable scale, complexity, geographic reach and industry profile. In assessing comparability, the Committee considers factors such as enterprise value, revenue, market capitalisation, business model and operational complexity. The peer group is reviewed periodically to ensure its continued relevance and to reflect changes in the Company’s strategic positioning and the external market environment. The peer group includes a balanced combination of companies that have a primary listing on the JSE Ltd and international chemicals and energy companies, and includes those with a broadly similar geographic footprint and/or product suite and enterprise value. For the calculation of the executive paylines in South Africa, Germany and the US, a cost-of-living factor between these countries and the countries where the data originates is applied. International data is converted by using a historical 18 month average exchange rate to moderate foreign exchange rate volatility. The Committee will review the composition of the peer group annually to ensure its continued relevance and appropriateness. Changes to the individual companies included in the peer group will not constitute a material amendment to this Policy. Any changes to the peer group, from time to time, will be disclosed accordingly. Peer group used for Executive remuneration benchmarking purposes For FY27, the following table sets out the approved comparator group applicable for executive remuneration benchmarks. JSE listed sub-group (~47%)1 Chemicals sub-group (~27%) Energy sub-group (~27%) AngloGold Ashanti plc Clariant AG CVR Energy Inc Bidvest Group Ltd Evonik Industries AG HF Sinclair Corp Gold Fields Ltd Huntsman Corp Origin Energy Ltd Harmony Gold Mining Ltd Lanxess AG Repsol S.A. Impala Platinum Holdings Ltd Kumba Iron Ore Ltd Valterra Platinum Ltd2 Retention awards and Buy-out awards The Buy-Out and Retention Award Policies may be used in the recruitment and retention of current or prospective employees either as part of compensation for variable pay awards forfeited with the previous employer due to the resignation, or for retention purposes. The Committee or the Board, as appropriate, may approve retention awards in cash and/or LTIs where there is a demonstrable retention risk relating to individuals occupying critical roles or possessing scarce skills. Retention awards will be used selectively and only where other remuneration mechanisms are considered insufficient to mitigate the identified retention risk. Such awards will be subject to specified vesting, forfeiture, malus and clawback provisions. In all cases, retention, buy-out or sign-on awards are subject to work-back periods. In cases where the work-back period is not completed, LTIs are forfeited, and cash awards must be repaid. Peer group used for relative Total Shareholder Return (rTSR) purposes in the LTI plan The table below outlines the companies in the peer group, equally weighted, and used in respect of the rTSR target for the FY27 LTI award. JSE listed sub-group Chemicals sub-group Energy sub-group AECI Ltd Arkema S.A. Aker BP ASA African Rainbow Minerals Ltd Dow Inc Devon Energy Corp Exxaro Resources Ltd Eastman Chemicals APA Corp Glencore plc Lanxess AG Imperial Oil Ltd Impala Platinum Holdings Ltd LyondellBasell Industries N.V. Ovintiv Inc Valterra Platinum Ltd2 Evonik Industries AG Repsol S.A. Executive service contracts • Members of the GEC have permanent employment contracts with notice periods ranging from three to six months. • The contracts provide for salary and benefits as well as participation in incentive plans based on Group, Business and individual performance as approved by the Board. • GEC participants who are members of a South African Retirement Fund are required to retire from the Group and as Directors from the Board at the age of 60, unless they are requested by the Board to extend their term. • Perquisites offered to the members of the GEC are disclosed in the Implementation Report. • Executive employment contracts currently exclude restraint-of-trade provisions but do contain confidentiality obligations. No additional payments are made for loss of office or change of control of the Company. 1 Weighting in the total peer group 2 Anglo American Platinum Ltd (Amplats) post name change PART II: SECTION A – REMUNERATION POLICY CONTINUED SASOL INTEGRATED REPORT 2026 159 SUSTAINABILITY REPORT SASOL AT A GLANCE DRIVING SUSTAINABLE VALUE CREATION EXECUTING STRATEGY INTRODUCTION DELIVERING BUSINESS VALUE CORPORATE GOVERNANCE SUMMARISED FINANCIAL PERFORMANCE ASSURANCE / ADMINISTRATION REMUNERATION REPORT |
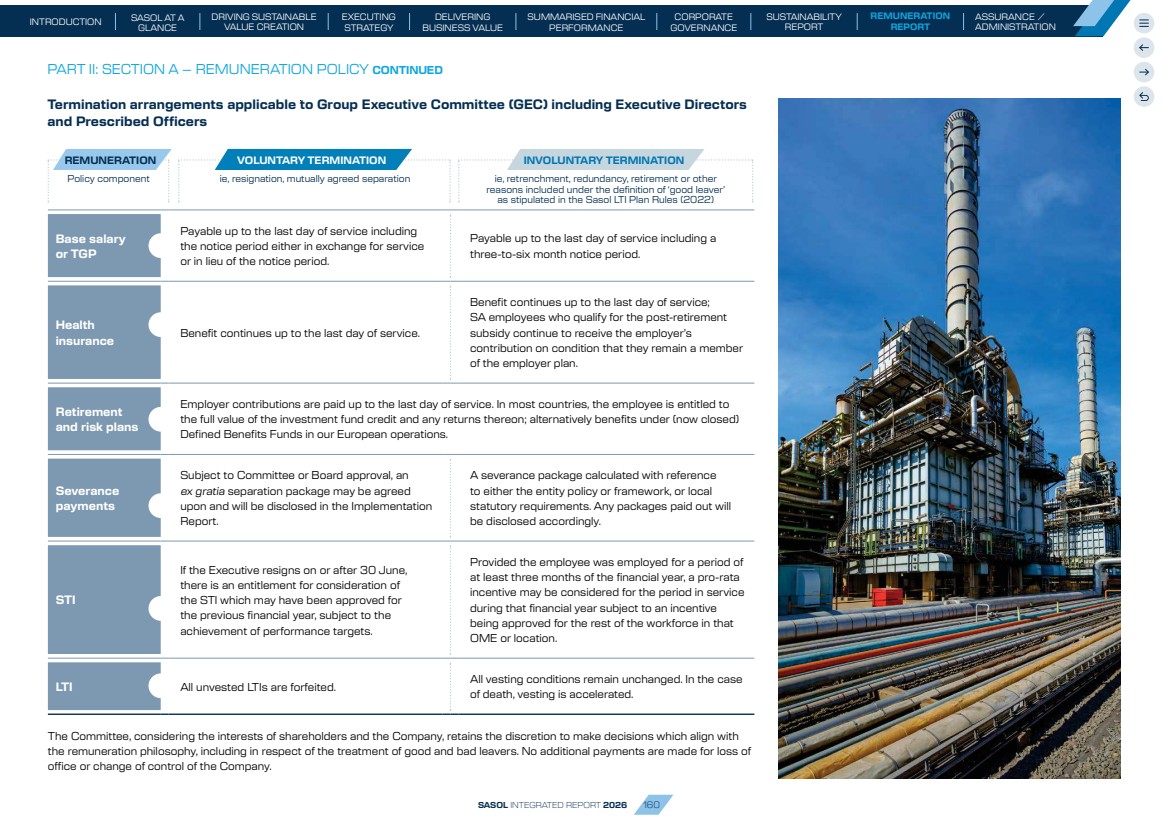
| Termination arrangements applicable to Group Executive Committee (GEC) including Executive Directors and Prescribed Officers PART II: SECTION A – REMUNERATION POLICY CONTINUED t ie, retrenchment, redundancy, retirement or other ie, resignation, mutually agreed separationPolicy componen reasons included under the definition of ‘good leaver’ as stipulated in the Sasol LTI Plan Rules (2022) REMUNERATION VOLUNTARY TERMINATION INVOLUNTARY TERMINATION Base salary or TGP Payable up to the last day of service including the notice period either in exchange for service or in lieu of the notice period. Payable up to the last day of service including a three-to-six month notice period. Health insurance Benefit continues up to the last day of service. Benefit continues up to the last day of service; SA employees who qualify for the post-retirement subsidy continue to receive the employer’s contribution on condition that they remain a member of the employer plan. Retirement and risk plans Employer contributions are paid up to the last day of service. In most countries, the employee is entitled to the full value of the investment fund credit and any returns thereon; alternatively benefits under (now closed) Defined Benefits Funds in our European operations. Severance payments Subject to Committee or Board approval, an ex gratia separation package may be agreed upon and will be disclosed in the Implementation Report. A severance package calculated with reference to either the entity policy or framework, or local statutory requirements. Any packages paid out will be disclosed accordingly. STI If the Executive resigns on or after 30 June, there is an entitlement for consideration of the STI which may have been approved for the previous financial year, subject to the achievement of performance targets. Provided the employee was employed for a period of at least three months of the financial year, a pro-rata incentive may be considered for the period in service during that financial year subject to an incentive being approved for the rest of the workforce in that OME or location. LTI All unvested LTIs are forfeited. All vesting conditions remain unchanged. In the case of death, vesting is accelerated. The Committee, considering the interests of shareholders and the Company, retains the discretion to make decisions which align with the remuneration philosophy, including in respect of the treatment of good and bad leavers. No additional payments are made for loss of office or change of control of the Company. SASOL INTEGRATED REPORT 2026 160 SUSTAINABILITY REPORT SASOL AT A GLANCE DRIVING SUSTAINABLE VALUE CREATION EXECUTING STRATEGY INTRODUCTION DELIVERING BUSINESS VALUE CORPORATE GOVERNANCE SUMMARISED FINANCIAL PERFORMANCE ASSURANCE / ADMINISTRATION REMUNERATION REPORT |
| PART II: SECTION B – KEY PRINCIPLES OF SASOL’S REMUNERATION POLICY FOR THE WIDER WORKFORCE (EXCLUDING EXECUTIVE OFFICERS) Employee Share Savings Plan (South Africa) The Employee Share Savings Plan (the Plan) in South Africa has since inception created an ongoing interest in Sasol’s performance as displayed through our share price. The Plan enables employees to acquire Sasol share fractions through monthly after-tax payroll deductions, with the company matching contributions up to R7 200 per annum (subject to tax). This plan is particularly popular among employees below senior management, who represent over 98% of participants. The members of the Group Executive Committee (who are not allowed to participate in this Plan) review this matching arrangement from time to time and an amendment to this match will not constitute a material change to the Remuneration Policy. Employee Wellbeing HC Employee wellbeing remains a strategic priority. Our Wellbeing Programme is tailored to local needs and includes financial, emotional, physical, and legal support. In South Africa, where the majority of our workforce is based, the programme is digitally enabled and widely accessible. Employees across all levels have access to: • Health and risk insurance • Retirement funds • Special provisions for employees who suffer fatal injuries while in service These offerings form a core part of our total Employee Value Proposition. In cases of employee fatalities, Sasol provides additional support to affected families, reinforcing our commitment to employee wellbeing. Sasol’s remuneration philosophy is designed to support a high-performance culture, ensure fair, responsible and competitive pay, and align employee interests with long-term shareholder value. It supports our investment in Human Capital (HC), through our People Promise. Our approach is underpinned by a structured job architecture, a commitment to fair and responsible pay and a suite of benefits and incentives tailored to the diverse needs of our global workforce as well as delivery of our strategic objectives. Job Architecture and Collective Agreements Sasol’s job architecture is structured into seven broad bands, excluding the Group Executive Committee. Roles in the first three to five bands are typically governed by collective bargaining or co-determination agreements. Employee Value Proposition HC Sasol’s Employee Value Proposition programme aims to promote and support: Meaningful work, and learning and development opportunities (How we Work) Inspirational leadership, an inclusive workplace culture, a safe workplace and a diverse workforce (How we Lead) Competitive remuneration and benefits (What we Offer) Employee safety and wellbeing (Who we Are) Safety Safety is our foremost priority in all circumstances Place safety of people first Commit to safe production Customer centricity Win with customers Enhance customer experience Innovate for sustainable solutions Care Care for our people, planet and communities Caring leaders, enabling goal delivery and a strong team spirit Values Performance Own our results Understand and deliver on drivers for performance Work together for the benefit of One Sasol, one bottom line Our Employee Value Proposition is grounded in our four cultural anchors, each deeply rooted in our Values Culture HC Our Remuneration Policy is a key enabler of the culture we seek to create and support. A culture that is performance-driven, accountable and aligned with long-term value creation. By linking reward outcomes to strategic KPIs, the Remuneration Policy reinforces behaviours that foster a values-based, performance-driven culture. It ensures that remuneration practices are fair, transparent, and competitive, while promoting ethical conduct and a shared commitment to Sasol’s purpose and values. Remuneration Principles for Leadership and Senior Management For Leadership and Senior Management, remuneration principles are closely aligned with those of the Executive Directors and other GEC members, with the exception of minimum shareholding requirements. Pay levels are benchmarked against the market median using reputable survey data, and annual increases are informed by projected market movement, inflation, and affordability. The cost of annual increases is subject to the Committee’s approval. Short-term incentives (STIs) for these levels are determined with reference to the Group STI Scorecard and individual performance, or other incentive plans as appropriate for the location and sector. Participation in the Long-term Incentive (LTI) plan is discretionary and based on role criticality, retention requirements, performance and market competitiveness. Vesting is subject to performance and time-based conditions, with no accelerated vesting except in the case of death. All variable pay awards are subject to Sasol’s Malus and Clawback policy. SASOL INTEGRATED REPORT 2026 161 SUSTAINABILITY REPORT SASOL AT A GLANCE DRIVING SUSTAINABLE VALUE CREATION EXECUTING STRATEGY INTRODUCTION DELIVERING BUSINESS VALUE CORPORATE GOVERNANCE SUMMARISED FINANCIAL PERFORMANCE ASSURANCE / ADMINISTRATION REMUNERATION REPORT |
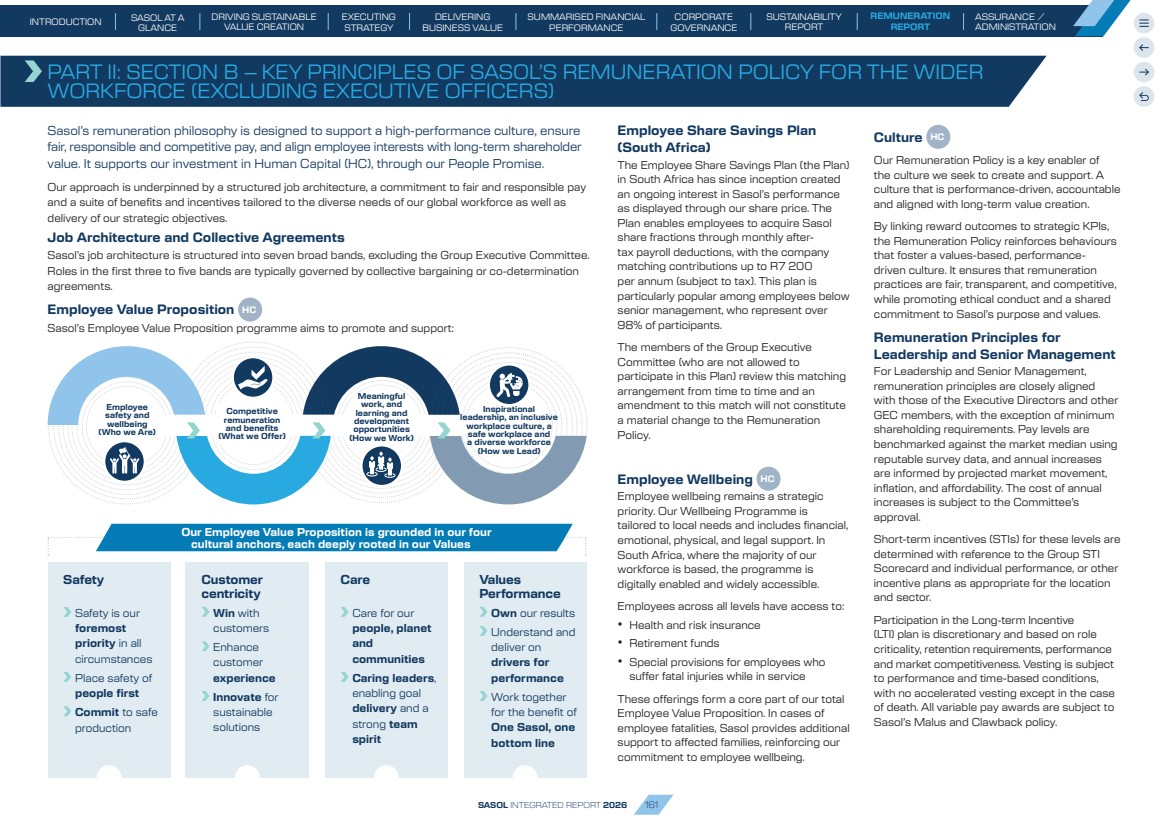
| Supervisory, Operational and General Workers Remuneration for supervisory, operational and general workers is designed to support the attraction, retention and motivation of employees while recognising the diverse industries, labour markets and operating environments in which we operate. Remuneration structures are informed by collective bargaining arrangements where applicable, as well as market competitiveness, internal equity, skills requirements, business performance and affordability. Entry-level remuneration is benchmarked with reference to living wage standards and, in South Africa, generally exceeds applicable minimum sectoral requirements. Employees may participate in a range of remuneration elements, including allowances, benefits and performance-based incentives, as appropriate to their role, operational environment and applicable employment arrangements. Non-financial benefits may vary by location and operating context. Remuneration design principles are reviewed periodically to ensure continued alignment with our remuneration philosophy and business objectives. Operations Specific Incentive Plans Production Bonus Plan Mining (non-managerial) Group STI (with fatality penalty) LTIs have a three-year vesting period, and the vesting of all LTIs is subject to a combination of performance and time conditions EMPLOYEE SHARE SAVINGS PLAN (SA) PART II: SECTION B: KEY PRINCIPLES OF SASOL’S REMUNERATION POLICY FOR THE WIDER WORKFORCE CONTINUED TGP OR BASE SALARY SHORT-TERM INCENTIVES LONG-TERM INCENTIVES Market Position 50th percentile of the market Adjustments Based on CPI, affordability and market movements Benchmarking Remchannel (SA), KornFerry and others (International) Subject to local market practice, employees may be eligible to participate in incentive plans SASOL INTEGRATED REPORT 2026 162 SUSTAINABILITY REPORT SASOL AT A GLANCE DRIVING SUSTAINABLE VALUE CREATION EXECUTING STRATEGY INTRODUCTION DELIVERING BUSINESS VALUE CORPORATE GOVERNANCE SUMMARISED FINANCIAL PERFORMANCE ASSURANCE / ADMINISTRATION REMUNERATION REPORT |
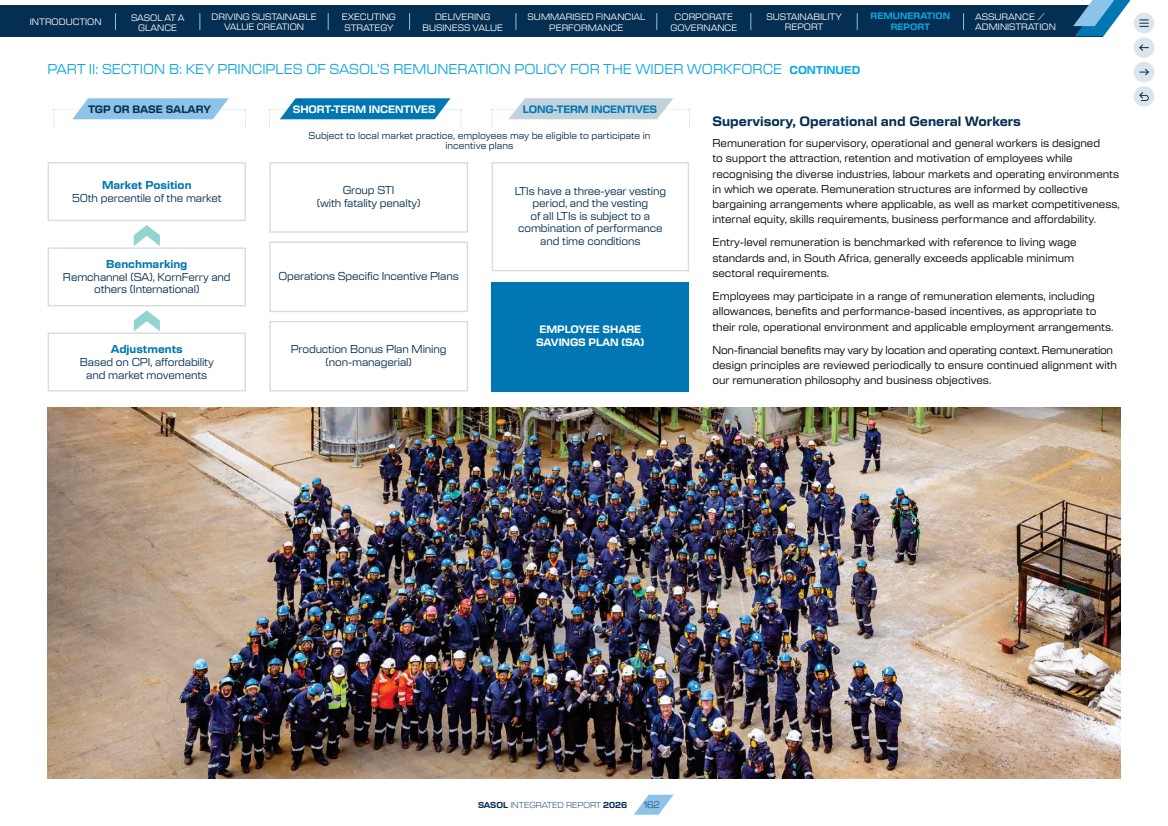
| Chairman and Non-Executive Director Fees PART II: SECTION C – NON-EXECUTIVE DIRECTOR FEE POLICY Non-Executive Directors (NEDs) are appointed to the Sasol Limited Board based on the competencies and experience required to guide the Group’s long-term direction and provide independent oversight of performance against strategic priorities. NEDs also hold executive management accountable for delivering results over the short, medium and long term. To attract and retain individuals of the calibre required for a complex multinational organisation, NED fees are set at levels that reflect the scope and responsibilities of their roles. The Company maintains a standalone non-Executive Director (NED) Fee Policy which sets out the criteria governing the determination and payment of non-Executive director fees. The NED Fee Policy addresses, amongst other things, the basis for setting and reviewing fees, the fee structure, market alignment and benchmarking methodology, the frequency and nature of fee payments, and ancillary matters such as travel, accommodation, and the reimbursement of expenses. A copy of the NED Fee Policy is made available to shareholders when voting on the quantum of NED fees in terms of section 66(9) of the Companies Act. The actual NED fees paid in the year under review are disclosed in the Implementation Report (Part III). NEDs do not participate in STI or LTI plans, and no arrangements exist for compensation in the event of loss of office. Fees are determined annually and paid pro-rata following each quarterly Board cycle. From a fairness and equality perspective, NED fees are denominated in US dollars. However, for NEDs residing outside Europe, the UK or North America, a cost-of-living (COLA) adjustment is applied to reflect differences in living costs between the country of residence and the market on which the fee structure is based, to support equitable remuneration across geographies. South African NEDs are paid in ZAR. All other NEDs are remunerated in US dollars. Sasol benchmarks NED fees against the same peer group used for executive remuneration. This group includes JSE-listed and international chemicals and energy companies with a comparable geographic footprint, organisational scale and complexity, as well as revenue and enterprise value. Fees are positioned around the 50th percentile of this peer group. Management regularly conducts a comprehensive market review and proposes any adjustments to the Committee, which evaluates the proposals for increases taking into account the scope and time commitment of the role. The Committee recommends fees to the Board for review and endorsement, after which the proposed fee structure is, in line with regulatory requirements, submitted to shareholders for approval at the Annual General Meeting (AGM). HOW FEES ARE SET1 • Benchmarked to Executive Remuneration Peer group • Target 50th percentile • COLA adjustments applied WHAT WE PAY • Fixed fees • No STI or LTI participation • No loss of office payments • Paid quarterly WHO APPROVES • Management recommends • Committee reviews and recommends • Board endorses • Shareholder approval at AGM 1 Volatility in foreign exchange rates is managed through the application of an average exchange rate calculated over a 12- or 18-month period. SASOL INTEGRATED REPORT 2026 163 SUSTAINABILITY REPORT SASOL AT A GLANCE DRIVING SUSTAINABLE VALUE CREATION EXECUTING STRATEGY INTRODUCTION DELIVERING BUSINESS VALUE CORPORATE GOVERNANCE SUMMARISED FINANCIAL PERFORMANCE ASSURANCE / ADMINISTRATION REMUNERATION REPORT |
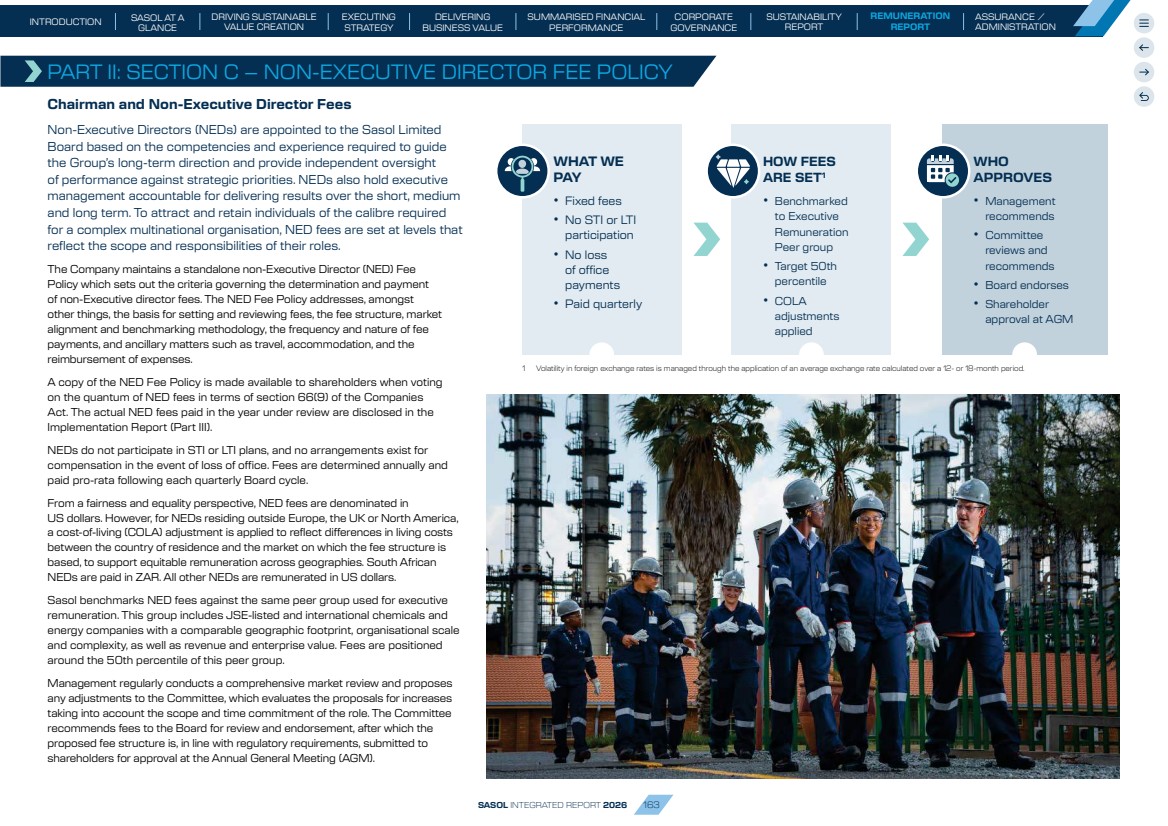
| This section presents the Implementation Report, which reflects the decisions taken by the Committee in accordance with the FY26 Remuneration Policy during the financial year ended 30 June 2026. It outlines the relationship between Company performance and the remuneration outcomes of the Executive Directors and Prescribed Officers, as well as progress against the Minimum Shareholding Requirement (MSR). The FY26 Policy parameters are included in the Remuneration at a glance section. The Committee confirms that remuneration outcomes for FY26 were determined in compliance with the Remuneration Policy approved by shareholders at the previous AGM on 14 November 2025, and there were no deviations from the policy during the period under review. The tables in this section provide details of all remuneration received or receivable by members of the Group Executive Committee (GEC) during FY26, including the President and Chief Executive Officer, Executive Directors and Prescribed Officers. PART III: REMUNERATION IMPLEMENTATION REPORT Overview of the Implementation Report Incentive Plan outcomes • Group STI targets and performance outcomes. • Performance against Corporate Performance Targets (CPTs) applicable to LTIs due to vest in FY27, based on the performance period ended 30 June 2026. • Individual Performance Scorecard outcomes for Executive Directors. Executive Directors and Prescribed Officers (tabulated separately) • Remuneration, performance and benefits paid or payable, disclosed in accordance with the Total Earned Remuneration/ Single Figure methodology. • Includes the estimated value of LTIs expected to vest in FY27 in respect of the performance period ended 30 June 2026. • Outstanding LTI holdings. • Progress against the Minimum Shareholding Requirement (MSR). Pay gap disclosure • Pay gap disclosures for South Africa, aligned with the requirements of section 30B of the Companies Act. NEDs • Fees approved for and paid in FY26. Key Remuneration Outcomes Salary/TGP adjustments The cost of bargaining unit annual salary increases was as follows: South Africa: average across the Chemicals, Petroleum and Mining Sectors: 5,5%; Germany: 0% (negotiated agreement to defer to 2027); Italy: 0,86%; Mozambique: 5,6%. Implementation dates vary in accordance with collective bargaining agreements. The cost of non-bargaining unit annual salary increases, including, market adjustments where applicable effective 1 October 2025: SA: 4,13%, US: 1,73%, Germany: 1,72%, Italy: 1,81%, Mozambique: 4,31%. The Committee reviewed the remuneration of the members of the Group Executive Committee and determined that, for certain Executive Officers, guaranteed remuneration was materially below the level typically observed for comparable roles in the relevant markets. Accordingly, the Committee approved remuneration adjustments to reposition these executives’ remuneration more appropriately within the market, taking into account the scope and complexity of their roles, individual performance and sustained contribution to the delivery of the Group’s strategic objectives. The Committee recognises that the executive salary adjustments approved during the year exceeded the average salary increase awarded across the broader organisation. These adjustments were made following a review of external market competitiveness and reflected the need to address accumulated market positioning gaps in specific executive roles. While market benchmarking remains an ongoing component of the remuneration governance framework, the Committee expects future adjustments to be more closely aligned to normal annual remuneration review practices unless material market positioning considerations arise. The Committee carefully considers internal pay relativity, affordability and shareholder expectations before approving the adjustments. Detailed information is included in the tables on page 172 STI STI outcomes in respect of the Group STI scorecard as approved by the Committee: • 95,5% out of a target of 100% and a maximum opportunity of 150%, before the application of the Fatality Penalty which for the Executive Officers was six percentage points. • STI outcomes for levels below the GEC varied between 89,5% and 93,5% (after application of the fatality penalty). LTI For the period ended 30 June 2026, performance against the applicable Corporate Performance Targets resulted in an outcome of 72% against a target of 100% and a maximum opportunity of 200%. SASOL INTEGRATED REPORT 2026 164 SUSTAINABILITY REPORT SASOL AT A GLANCE DRIVING SUSTAINABLE VALUE CREATION EXECUTING STRATEGY INTRODUCTION DELIVERING BUSINESS VALUE CORPORATE GOVERNANCE SUMMARISED FINANCIAL PERFORMANCE ASSURANCE / ADMINISTRATION REMUNERATION REPORT |
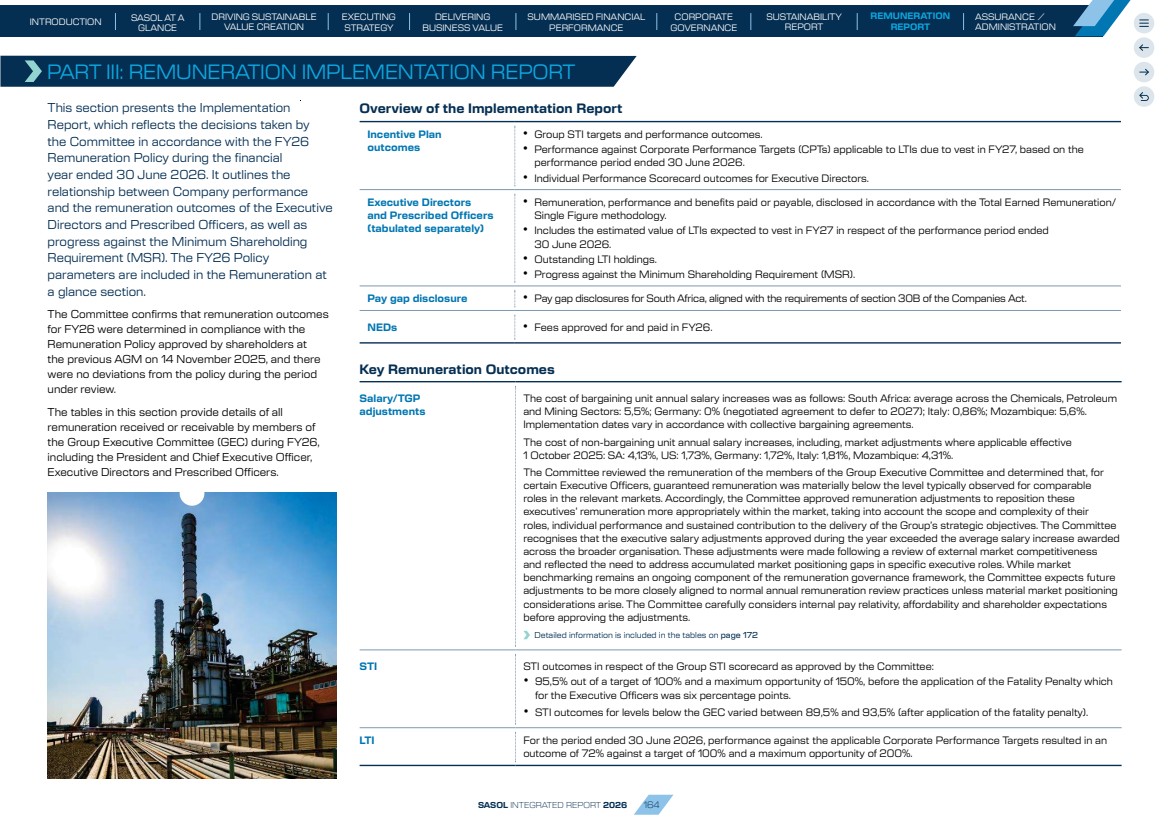
| STI Plan Outcomes The outcomes of the FY26 STI are reflected in the Group STI scorecard refer to page 166, which outlines the results achieved against each KPI. FY26 represented a year of improved overall performance for the Group, with notable progress across a number of key financial, operational and sustainability measures. Stronger production volumes, supported by improved equipment availability and coal quality, contributed to improved financial performance and enabled the Group to exceed its cash cost optimisation target. While production performance increased, there was an increase in the coal purchases due to lower own mining production, contributing to the Group not achieving 100% of the gross margin target. While free cash flow benefitted from the improved operational performance, higher than planned working capital moderated the overall outcome. The Committee was pleased with the overall improvement in process and occupational safety performance. However, the unfortunate occurrence of two fatalities during the year underscores that safety remains our highest priority. The policy provision that provides for the discretionary ability to moderate non-financial performance outcomes to target where overall financial performance has not achieved 100% of target, is intended to ensure an appropriate balance between financial and non-financial performance and to protect the Group from unaffordable incentive outcomes. The Committee considered Sasol’s overall performance, liquidity position, positive free cash flow generation and the affordability of the proposed incentive outcomes and agreed that the non-financial outcomes would not be capped at Target. Furthermore, many of the sustainability, operational and strategic outcomes achieved during FY26 are critical enablers of future value creation and reflect deliberate management actions taken to strengthen the business despite a challenging external environment. This resulted in the following final STI scores (after the application of the fatality penalty): • GEC: 89,5% • All other STI participants: Between 89,5% and 93,5%, depending on role category and employing entity. PART III: REMUNERATION IMPLEMENTATION REPORT CONTINUED Group Executive Committee (GEC) remuneration mix Annual TGP/Base Salary STI LTI %of Total Annual Reward 0 100 200 300 400 500 600 700 GEC max GEC target GEC 2026 actual GEC threshold 19% 100% 48% 33% 35% 26% 39% 23% 25% 52% 0 100 200 300 400 500 600 700 %of Total Annual Reward CFO max CFO target CFO 2026 actual CFO threshold 100% 44% 37% 31% 20% 28% 52% 29% 40% 20% 0 100 200 300 400 500 600 700 %of Total Annual Reward CEO max CEO target CEO 2026 actual CEO threshold 100% 45% 47% 8% 27% 32% 41% 18% 30% 52% Remuneration Mix Outcomes The graphs illustrate the remuneration mix approved by the Committee for the CEO, CFO and the average of the remaining GEC members together with the actual FY26 remuneration outcomes relative to these potential earnings. SASOL INTEGRATED REPORT 2026 165 SUSTAINABILITY REPORT SASOL AT A GLANCE DRIVING SUSTAINABLE VALUE CREATION EXECUTING STRATEGY INTRODUCTION DELIVERING BUSINESS VALUE CORPORATE GOVERNANCE SUMMARISED FINANCIAL PERFORMANCE ASSURANCE / ADMINISTRATION REMUNERATION REPORT |
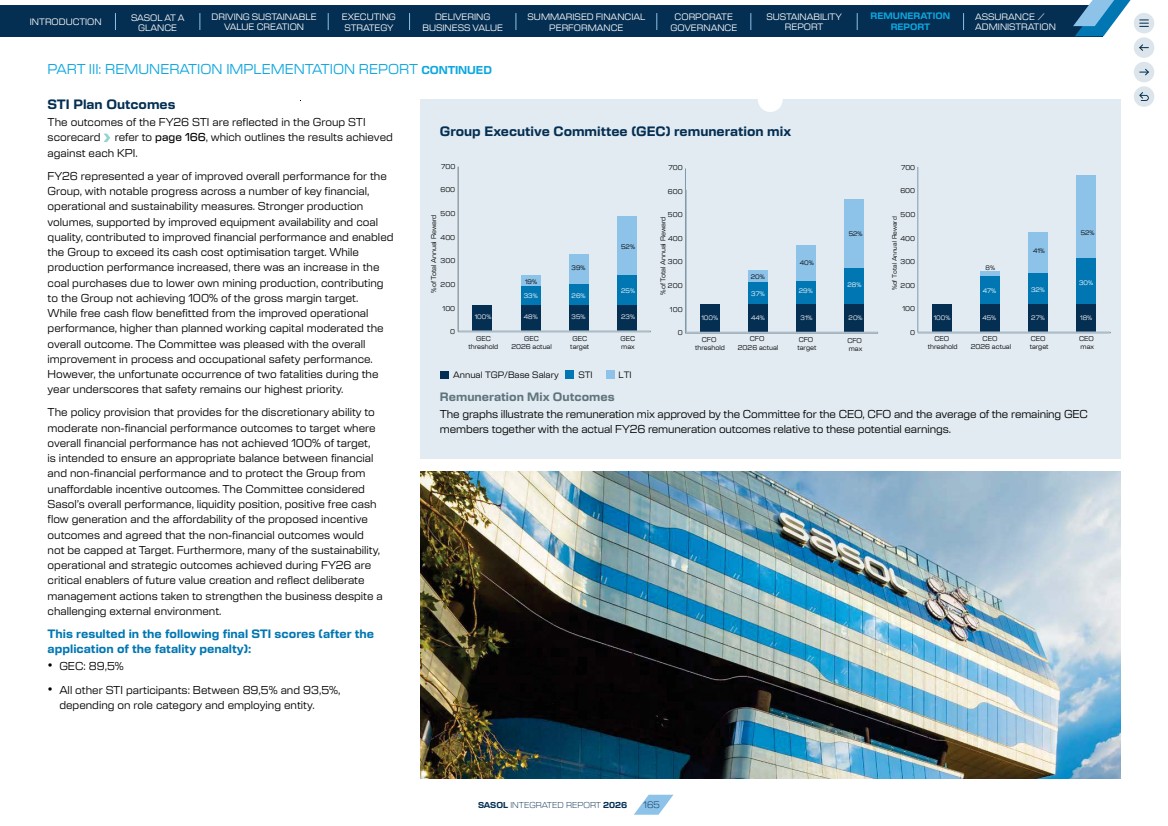
| PART III: REMUNERATION IMPLEMENTATION REPORT CONTINUED FY26 Short-term Incentive Scorecard The table below sets out the detailed performance outcomes against the FY26 performance targets approved by the Committee for the financial year. KPI – Key Performance Indicator Unit of measure Weighting Threshold (Rating = 0%) Target (Rating = 100%) Stretch (Rating = 150%) Achievement FY26 score ESG (People) (20%) Occupational Safety Occupational Safety: Number of Hospitalisations 10% Hospitalisations ≥ 71 (scoring range 0% – 9,9%) Hospitalisations = 62 (score 10%) Hospitalisations ≤ 53 (scoring range 10,1% – 15%) 40 15% Process Safety Process Safety: Number of all major and significant FERs 10% Number of FERs ≥ 25 (scoring range 0% – 9,9%) Number of FERs = 17 (score 10%) Number of FERs ≤ 11 (scoring range 10,1% – 15%) 9 15% ESG (Planet) (10%) Energy Efficiency1 % Energy efficiency improvement 10% 0% Energy efficiency improvement from the FY25 baseline (scoring range 0% – 9,9%) 1% Energy efficiency improvement from the FY25 baseline (score 10%) 1,5% Energy efficiency improvement from the FY25 baseline (scoring range 10,1% – 15%) 0,501% 5% Group Financials (70%) Gross Margin2 FY26 Gross margin 15% Gross Margin: R110,7bn (scoring range 0% – 14,9%) Gross Margin: R115,7bn (score 15%) Gross Margin: R120,7bn (scoring range 15,1% – 22,5%) R113,7bn 9,1% Secunda Operations Production Volumes Secunda Production Volumes 5% FY26 SO Production = 6 800 kt (scoring range 0% – 4,9%) FY26 SO Production = 7 100 kt (score 5%) FY26 SO Production = 7 300 kt (scoring range 5,1% – 7,5%) 7 260kt 7,0% Cash Fixed Cost Optimisation2 Absolute CFC 15% CFC of <= R68,8bn (scoring range 0% – 14,9%) FY26 CFC target = R66,8bn (score 15%) CFC of <= R64,8bn (scoring range 15,1% – 22,5%) R65,4bn 20,4% Free cash flow generation Free cash flow (before dividends paid and second-order capital) to turnover ratio 35% FY26 FCF target/ turnover ratio = 3% (scoring range 0% – 34,9%) FY26 FCF target/ turnover ratio = 5% (score 35%) FY26 FCF target/ turnover ratio = 7% (scoring range 35,1% – 52,5%) 4,4% 24,0% Total 100% 95,5% 1 The FY26 STI Energy Efficiency improvement target measures year-on-year improvement relative to FY25 performance and was assessed in accordance with the approved FY26 STI Policy. This measure differs from the Group Energy Efficiency result reported in the Sustainability Report ( page 101), which reflects cumulative performance against an FY05 baseline. As the two measures use different baselines (FY25 actual vs FY05 baseline), methodologies and weighting approaches, they are not directly comparable. The STI KPI reflects an improvement from the prior year. 2 The STI Policy permits the normalisation of certain pre-approved factors to neutralise the impact of macroeconomic variables relative to the approved budget. Consequently, both positive and negative variances arising from these factors are excluded when assessing STI performance. In FY26, Cash Fixed Cost performance was normalised for exchange rate movements only. Gross Margin performance was normalised for exchange rate movements, Brent crude oil prices, refining margins, product differentials, certain chemical product prices, US tariffs not contemplated in the approved budget and year-end inventory NRV write-downs. SASOL INTEGRATED REPORT 2026 166 SUSTAINABILITY REPORT SASOL AT A GLANCE DRIVING SUSTAINABLE VALUE CREATION EXECUTING STRATEGY INTRODUCTION DELIVERING BUSINESS VALUE CORPORATE GOVERNANCE SUMMARISED FINANCIAL PERFORMANCE ASSURANCE / ADMINISTRATION REMUNERATION REPORT |
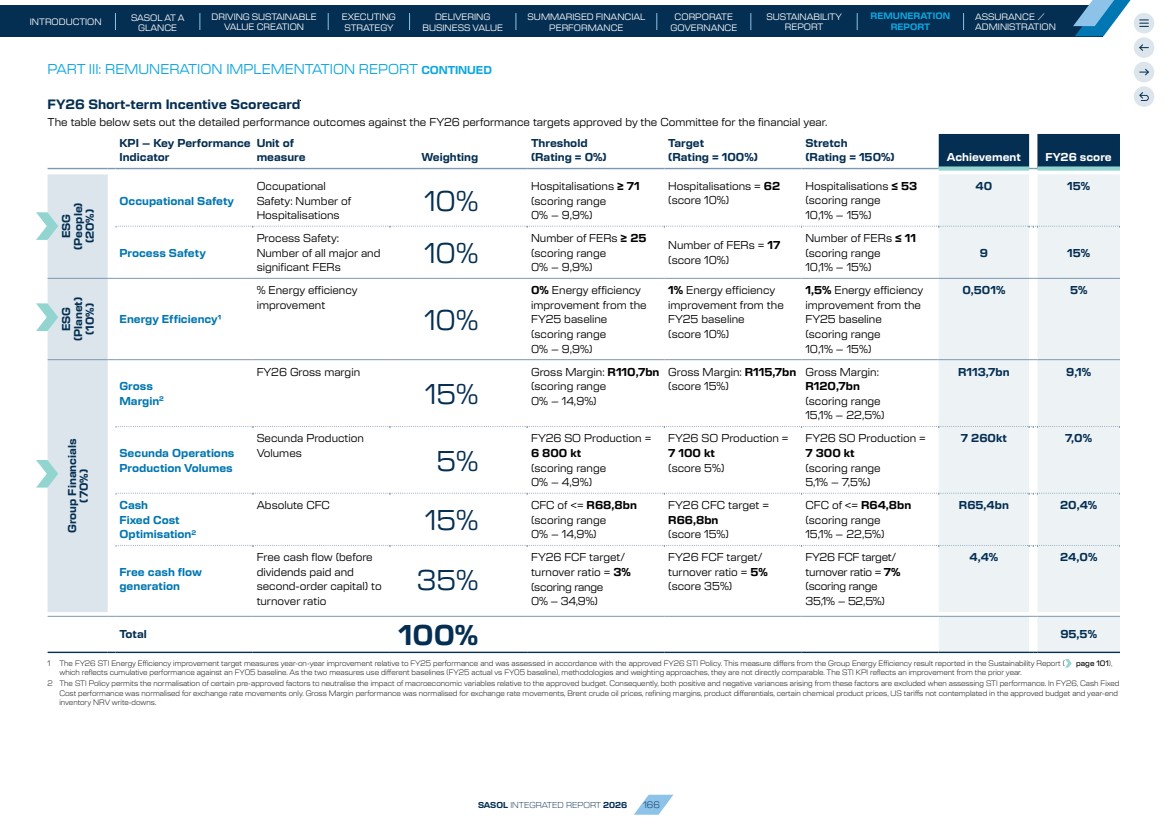
| The individual performance component contributes to the final STI amount approved for payment. The STI awards for our Executive Directors were calculated with reference to their personal performance which carried a weighting of 20% in the final calculation. A summary of the scorecard outcomes is herewith presented: SIMON BALOYI President and Chief Executive Officer WALT BRUNS Chief Financial Officer VUYO KAHLA Executive Director PART III: REMUNERATION IMPLEMENTATION REPORT CONTINUED FY26 was a defining year for Sasol, characterised by strong leadership and disciplined execution that delivered materially improved operational, financial and strategic outcomes. Under the leadership of the CEO and Group Executive Committee, the Group achieved substantially improved Secunda production results, improved customer satisfaction and employee engagement results, strengthened operational resilience and advanced several strategic initiatives critical to Sasol’s long-term competitiveness. Significant progress was made in enhancing financial resilience, including a material improvement in South African break-even performance, delivery of Chemicals earnings despite challenging market conditions, successful execution of key refinancing initiatives, and strengthened liquidity and cash management. The executive team also advanced Sasol’s strategic positioning through progress in sustainable products, decarbonisation initiatives and the development of the Group’s longer-term strategic framework. Stakeholder confidence improved materially during the year, reflected in enhanced investor engagement, a significant increase in United States shareholding and substantial share price appreciation. In addition, meaningful progress was achieved in leadership succession, organisational effectiveness, transformation and talent development. Collectively, these outcomes demonstrate leadership impact well beyond the achievement of annual operating targets and contributed to stronger business performance, enhanced strategic positioning and a more resilient platform for sustainable long-term value creation. Accordingly, the Committee concluded that the performance of the CEO and executive team warranted an outcome above target. Individual performance factor: KPI WEIGHTING OUTCOME Employee - Culture and Engagement 15% Exceeded Strategy – CMD execution plans 15% Exceeded Strategy – Emission reduction roadmap delivery 10% Partially achieved ESG – Sustainability roadmap and carbon tax 30% Achieved Strategy - Medium Term refinancing 15% Exceeded Improve Customer Centricity focus 15% Achieved Outcome1 100% 110% Individual performance factor: KPI WEIGHTING OUTCOME Employee - Culture and Engagement 15% Exceeded Strategy – Strengthen Foundation Business Delivery 20% Achieved Strategy - Grow and Transform 10% Achieved Governance - Financial Controls and Integrated Business Planning 20% Exceeded Strategy - Medium Term Refinancing 15% Exceeded Partnerships - Carbon Tax 20% Achieved Outcome1 100% 110% Individual performance factor: KPI WEIGHTING OUTCOME Employee - Culture and Engagement 15% Exceeded Strategy – CMD execution plans 25% Exceeded Sustainability – ERP roadmap 25% Achieved Sustainability – Supply chain strategy 25% Achieved Governance – Second level assurance 10% Achieved Outcome1 100% 110% 1 Individual performance includes an ‘above the line’ element relating to individual performance goals and a ‘below the line’ element relating to values and compliance. Performance assessment includes a review of Classification Achieved Partially achieved Not achieved demonstrated behaviour in line with Sasol’s values, management development, team effectiveness and ensuring a healthy succession pipeline. SASOL INTEGRATED REPORT 2026 167 SUSTAINABILITY REPORT SASOL AT A GLANCE DRIVING SUSTAINABLE VALUE CREATION EXECUTING STRATEGY INTRODUCTION DELIVERING BUSINESS VALUE CORPORATE GOVERNANCE SUMMARISED FINANCIAL PERFORMANCE ASSURANCE / ADMINISTRATION REMUNERATION REPORT |
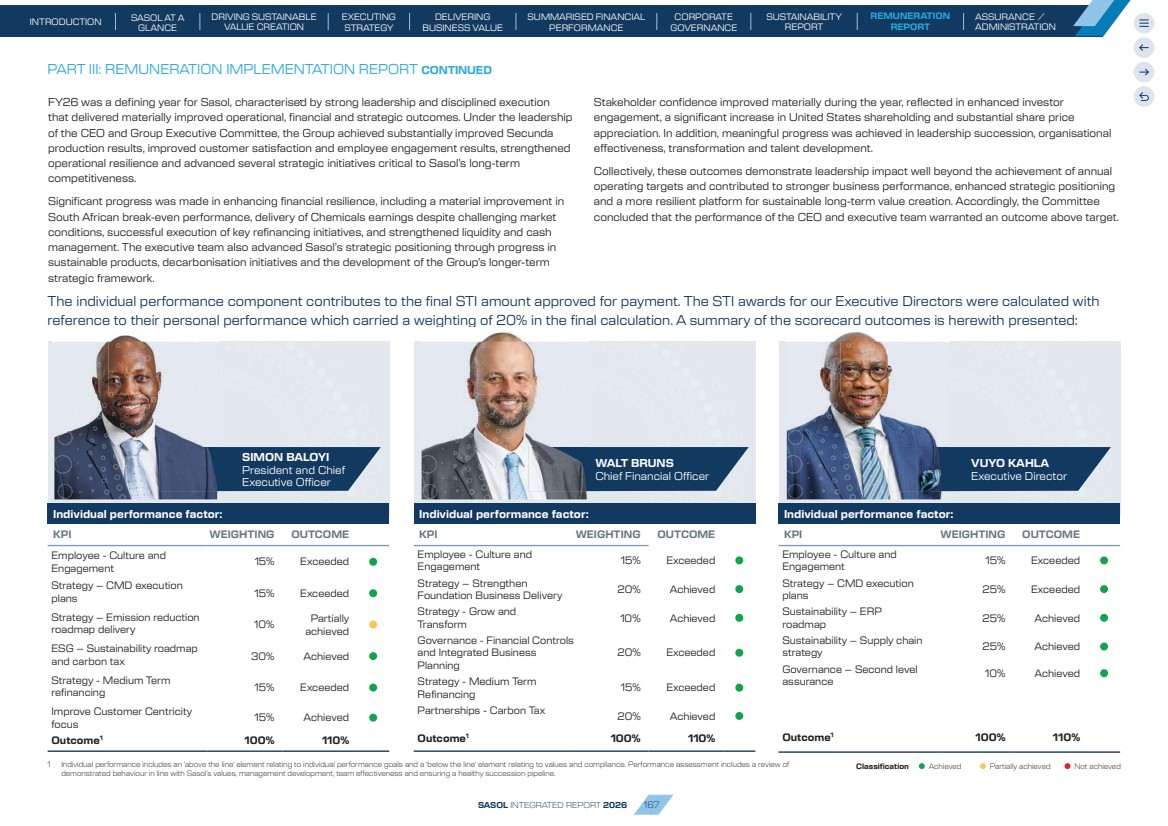
| LTI Plan Outcomes: FY24 LTI award The FY24 LTIs are due to partially vest in FY27 based on performance over the period 1 July 2023 to 30 June 2026. For members of the Group Executive Committee (GEC) and Senior Vice Presidents (SVPs), 50% of the performance-based awards are expected to vest, with the remaining 50% deferred for a further two-year period, subject to continued employment. The awards were granted during FY24 at JSE share prices of between R238,62 (28 August 2023) and R134,50 (at 22 May 2024) (ADR prices of US$12,80 and US$7,58 respectively) and will vest subject to the fulfillment of the vesting conditions on the trading day immediately preceding the vesting date. Vesting outcomes: The outcomes against the Corporate Performance Targets (CPTs) reflect a balanced performance across the targets included in the FY24 LTI scorecard. • Reducing carbon footprint: In assessing performance against the FY24 ESG targets, the Committee considered whether the outcome of any target may have been influenced by unintended consequences that were inconsistent with the Group’s broader strategic objectives. Following a review of management’s actions in relation to the International Chemicals GHG intensity target, the Committee concluded that the target outcome was not fully reflective of underlying performance and strategic value creation. Deliberate strategic decisions to optimise the decarbonisation roadmap, preserve affordability and improve capital efficiency resulted in the Committee’s decision to exclude the Chemicals Business GHG intensity reduction target from the scorecard. During the performance period, a United States Virtual Power Purchase Agreement (VPPA) with a project developer was postponed and capital was reprioritised in response to prevailing cash flow constraints and the Group’s broader capital allocation priorities. These decisions materially reduced the capital requirement associated with the decarbonisation programme from more than US$300million to approximately US$30 million, while maintaining progress toward International Chemicals’ long-term 2030 greenhouse gas reduction commitments. The revised portfolio is based on lower-capital, higher-return initiatives that are expected to generate a positive cash flow contribution and create greater long-term value for shareholders. Importantly, the underlying strategic objective remains unchanged. PART III: REMUNERATION IMPLEMENTATION REPORT CONTINUED International Chemicals continues to make progress toward its 2030 emissions reduction target through a revised portfolio of projects, including the United States VPPA concluded with Akuo in June 2025 and the biomethane purchase agreements implemented in Italy. The Committee also considered that International Chemicals only accounts for 4,4% of the Group’s total emissions and that they remain on track to achieve the 2030 roadmap. Accordingly, the Committee exercised the discretion provided for in the FY24 LTI rules to exclude this target from the overall assessment. The FY24 LTI framework specifically allowed for such discretion to be applied in respect of ESG measures where unintended consequences or external factors could distort the intended outcome, recognising the significant uncertainty that existed in this area at the time the targets were set. Consistent with its commitment to maintaining the importance of non-financial performance measures, and in line with the principles approved in FY24, the Committee reallocated the weighting to the remaining ESG targets. Southern Africa Energy delivered performance above stretch target levels, reflecting specifically the successful implementation of emission reduction initiatives and operational improvements over the performance period. • Contribution to the circular economy: Performance against the circular economy measure was underpinned by strong delivery in biosludge diversion and continued progress in recycling initiatives across the business. All biosludge was successfully diverted to gasification, resulting in no biosludge being landfilled and performance exceeding the stretch target. In addition, 40 253 tonnes of recyclable material were diverted from landfills over the performance period. The shortfall was primarily attributable to delays in the delivery of a limited number of sponsored sites. Notwithstanding these delays, waste diversion continued to be achieved across the broader programme portfolio. • Procurement spend with Black women-owned businesses: Performance against the 100% Black Women-Owned procurement spend measure exceeded target, with spend reaching 2,88% of Total Measured Procurement Spend (TMPs), above the target of 2,3%. This reflects continued progress in advancing supplier transformation and broadening participation by 100% Black woman-owned businesses in our supply chain. • Return on Invested Capital (ROIC): Offshore operations remained below threshold across the performance period, mainly due to impairments, while Sasol South Africa delivered mixed performance over the three years, resulting in an overall outcome of 20%. • Relative Total Shareholder Return (rTSR): Sasol’s shareholder return ranked below the threshold percentile of the peer group, resulting in no vesting against this target. These outcomes resulted in an overall achievement against the Corporate Performance Targets (CPTs) of 72%. The companies included in the peer group used to assess Sasol’s relative total shareholder return are listed below: JSE listed sub-group Chemicals sub-group Energy sub-group AECI BASF Continental Resources AngloGold Ashanti Dow Inc Devon Energy Corp Glencore plc Eastman Chemicals Hess Corporation MTN Group Lanxess AG Imperial Oil Ltd Sibanye Stillwater LyondellBasell Industries N.V. Origin Energy Valterra Platinum Ltd1 Solvay Repsol S.A. 1 Anglo American Platinum Ltd (Amplats) post name change SASOL INTEGRATED REPORT 2026 168 SUSTAINABILITY REPORT SASOL AT A GLANCE DRIVING SUSTAINABLE VALUE CREATION EXECUTING STRATEGY INTRODUCTION DELIVERING BUSINESS VALUE CORPORATE GOVERNANCE SUMMARISED FINANCIAL PERFORMANCE ASSURANCE / ADMINISTRATION REMUNERATION REPORT |
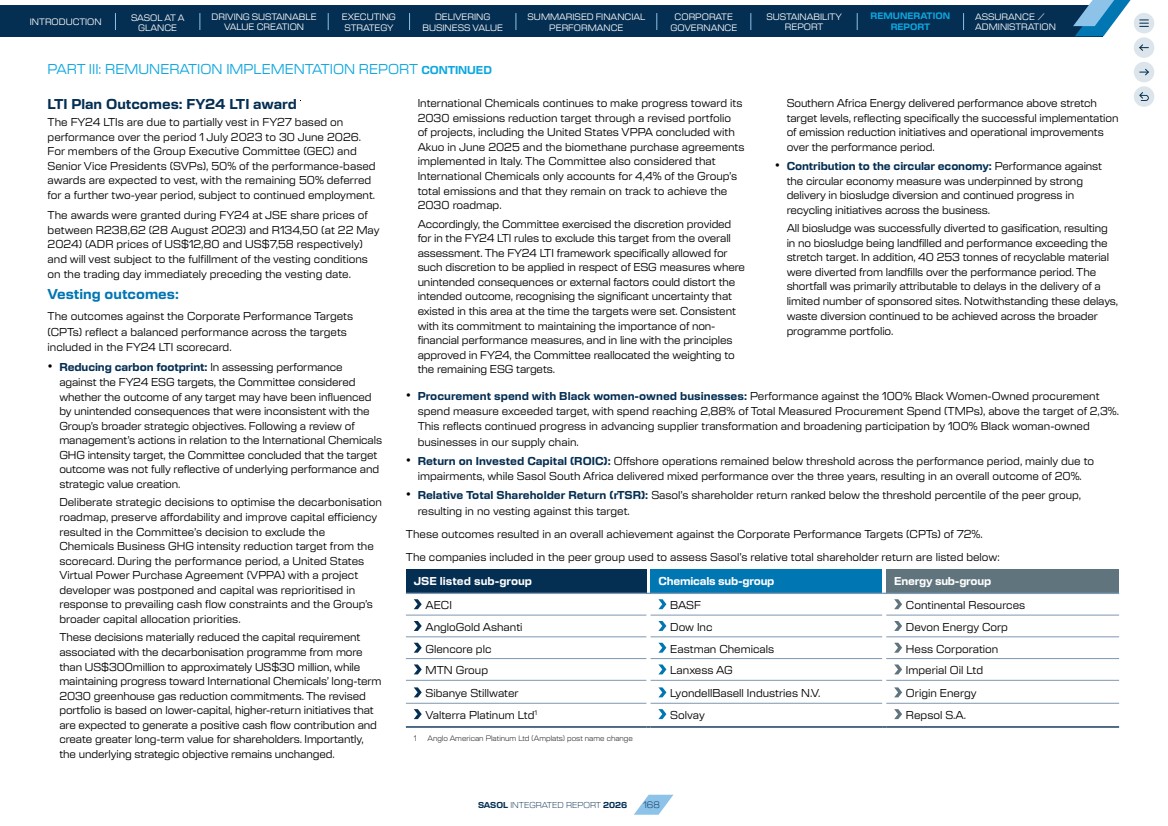
| LTI Plan Outcomes: FY24 LTI Grants For members of the GEC including Executive Directors and Prescribed Officers, 70% of the LTI awards granted at the time were subject to the achievement of the following CPTs, in addition to time-based vesting of between three and five years. The balance of the award (30%) is subject to a five-year time-based vesting criterion. KPI – Key Performance Indicator Weighting Original weighting Adjusted weighting Threshold (Rating = 0%) Target (Rating = 100%) Stretch (Rating = 200%) Achievement Approved score ESG (30%) Maintain our roadmap to reducing our carbon footprint 15% Maintain Scope 1 and 2 emission reductions achieved since FY17 baseline by FY25 of 3,55% to end FY26. Maintain Scope 1 and 2 emission reductions achieved since FY17 baseline by FY25 of 4,18% to end FY26. Reduce Scope 1 and 2 emission reductions achieved since FY17 baseline by FY25 of 4,9% to end FY26. 7,50% 10,00% Energy Business emission reduction of 3,5% for an equivalent production output of 7,6mtpa. Energy Business emission reduction of 4% maintained for an equivalent production output of 7,6mtpa.1 Energy Business emission reduction of 4,5% maintained for an equivalent production output of 7,6mtpa. 8,7% 20,00% 7,50% Chemicals Business: Advance the capital project portfolio to achieve agreed level of definition (Gate 4) to realize a 20% accumulated reduction. Chemicals Business: Advance the capital project portfolio to achieve agreed level of definition (Gate 4) to realise a 25% accumulated reduction. Chemicals Business: Advance the capital project portfolio to achieve agreed level of definition (Gate 4) to realise a 30% accumulated reduction. Not applicable Improve our contribution to the circular economy 10% Increase total recyclable material and quantity of waste activated sludge diverted from incinerators by end FY26: Increase total recyclable material and quantity of waste activated sludge diverted from incinerators by end FY26: Increase total recyclable material and quantity of waste activated sludge diverted from incinerators by end FY26: 5,00% 6,67% a) 90% of biosludge diverted from incinerators and fed to gasification, 10% landfilled offsite. a) 95% of biosludge diverted from incinerators and fed to gasification, 5% landfilled offsite. a) 100% of biosludge diverted from incinerators and fed to gasification, 0% landfilled offsite 100% 13,34% 5,00% 6,67% b) Cumulative total of 11,314 tons of recyclables1 diverted from landfill by end FY26. b) Cumulative total of 47,500 tons of recyclables diverted from landfill by end FY26. b) Cumulative total 55,000 tons of recyclables diverted from landfill by end FY26. 40 300 5,33% Focus on social responsibility through increased access to the economy for Black owned women enterprises 5% 5,00% 6,67% Increase total procurement spend by 20% on BWO percentage spend calculated as a percentage of TMPs (Total Measurable Procurement Spend) (1,8% + 20%) by end FY26. Increase total procurement spend by 25% on BWO percentage spend calculated as a percentage of TMPs (Total Measurable Procurement Spend) (1,8% + 25%) by end FY26 Increase total procurement spend by 30% on BWO percentage spend calculated as a percentage of TMPs (Total Measurable Procurement Spend) (1,8% + 30%) by end FY26. 2,88% 13,33% Group Financials (70%) Return on Invested Capital (ROIC) Sasol SA 30% 30,00% 30,00% ROIC (excl AUC) at SA WACC of 15,4% per annum ROIC (excl AUC) at SA WACC of 15,4% +1% = 16,4% per annum ROIC (excl AUC) at SA WACC of 15,4% +2% = 17,4% per annum 20% 20% Sasol offshore 10% 10,00% 10,00% ROIC (excl AUC) at US WACC of 9,1% per annum ROIC (excl AUC) at US WACC of 9,1% +0,5% = 9,6% per annum ROIC (excl AUC) at US WACC of 9,1% +1% = 10,1% per annum 0% 0,00% Relative TSR vs the peer group2 30% 30,00% 30,00% 50th percentile of the index 60th percentile of the index 75th percentile of the index 0% 0,00% 100,00% 100,00% 72% PART III: REMUNERATION IMPLEMENTATION REPORT CONTINUED 1 Planned production at the time. When normalised for actual production stretch target is still met. 2 Index is the peer group published on page 168. SASOL INTEGRATED REPORT 2026 169 SUSTAINABILITY REPORT SASOL AT A GLANCE DRIVING SUSTAINABLE VALUE CREATION EXECUTING STRATEGY INTRODUCTION DELIVERING BUSINESS VALUE CORPORATE GOVERNANCE SUMMARISED FINANCIAL PERFORMANCE ASSURANCE / ADMINISTRATION REMUNERATION REPORT |
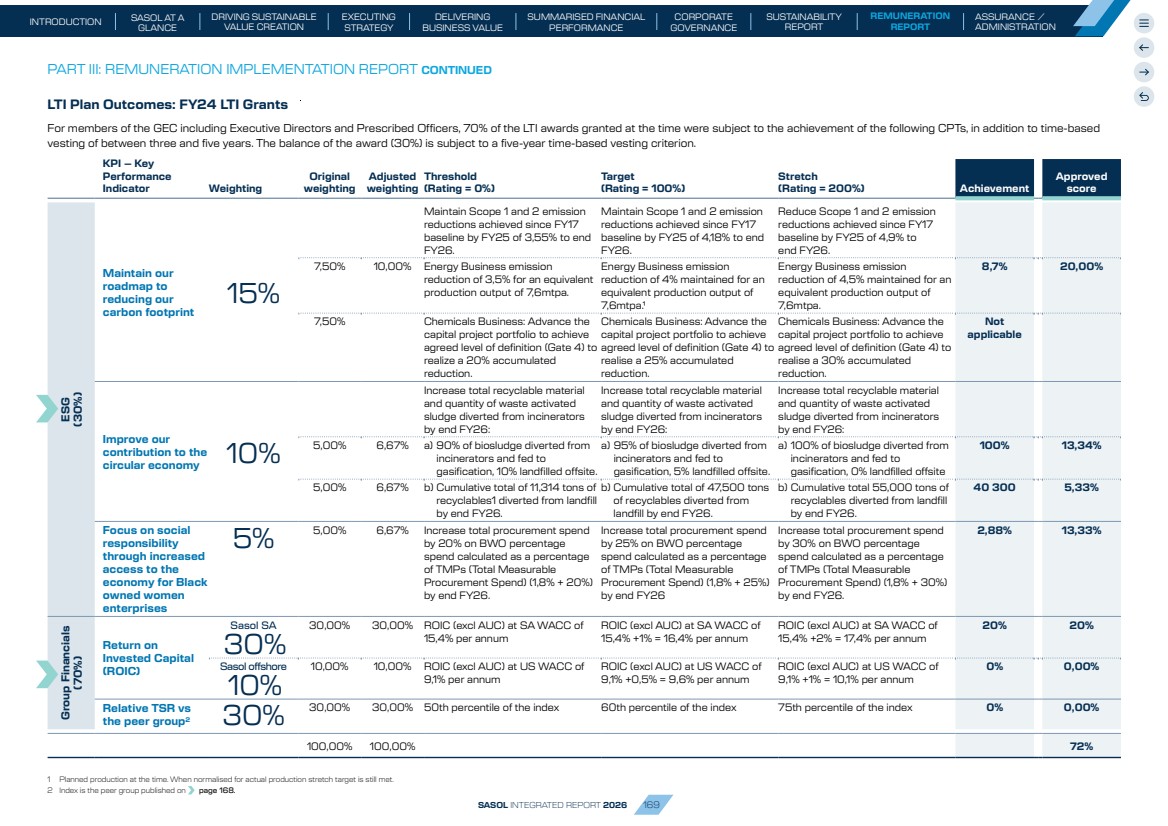
| FY25 LTI awards For members of the GEC including Executive Directors and Prescribed Officers, 70% of the LTI awards granted are subject to the achievement of the following CPTs, in addition to time-based vesting of between three and five years. The balance of the award (30%) is subject to a five-year time-based vesting criterion. KPI – Key Performance Indicator Weighting Threshold (Rating = 0%) Target (Rating = 100%) Stretch (Rating = 200%) ESG (25%) Maintain our roadmap to reducing our carbon footprint while increasing our production 25% Maintain Secunda Operations Scope 1 GHG intensity (total GHG CO2e emissions Scope 1/ total production for Secunda) against FY24 Scope 1 GHG intensity (vesting 0%) Improve on Secunda Operations FY24 Scope 1 GHG intensity (total GHG CO2e emissions Scope 1/total production for Secunda) by 0,8% (vesting 25%) Improve on Secunda Operations FY24 Scope 1 GHG intensity (total GHG CO2e emissions Scope 1/total production for Secunda) by 1,7% (vesting 50%) Group Financials (75%) ROIC Rest of Sasol 10% ROIC (excl AUC) at SA WACC of 15,4% per annum (vesting 0%) ROIC (excl AUC) at SA WACC of 15,4% + 1% = 16,4% per annum (vesting 10%) ROIC (excl AUC) at SA WACC of 15,4% + 2% = 17,4% per annum (vesting 20%) ROIC (America and Eurasia) 10% ROIC (excl AUC) at US WACC of 9,1% per annum (vesting 0%) ROIC (excl AUC) at US WACC of 9,1% + 0,5% = 9,6% per annum (vesting 10%) ROIC (excl AUC) at US WACC of 9,1% + 1% = 10,1% per annum (vesting 20%) Net debt (US$) reduction 25% FY27 Net debt (excluding leases) of US$3,00bn (vesting 0%) FY27 Net debt (excluding leases) of US$2,85bn (vesting 25%) FY27 Net debt (excluding leases) of US$2,70bn (vesting 50%) Relative TSR measured against the peer group 30% 50th percentile of the index (vesting 15%) 60th percentile of the index (vesting 30%) 75th percentile of the index (vesting 60%) Total 100% PART III: REMUNERATION IMPLEMENTATION REPORT CONTINUED SASOL INTEGRATED REPORT 2026 170 SUSTAINABILITY REPORT SASOL AT A GLANCE DRIVING SUSTAINABLE VALUE CREATION EXECUTING STRATEGY INTRODUCTION DELIVERING BUSINESS VALUE CORPORATE GOVERNANCE SUMMARISED FINANCIAL PERFORMANCE ASSURANCE / ADMINISTRATION REMUNERATION REPORT |
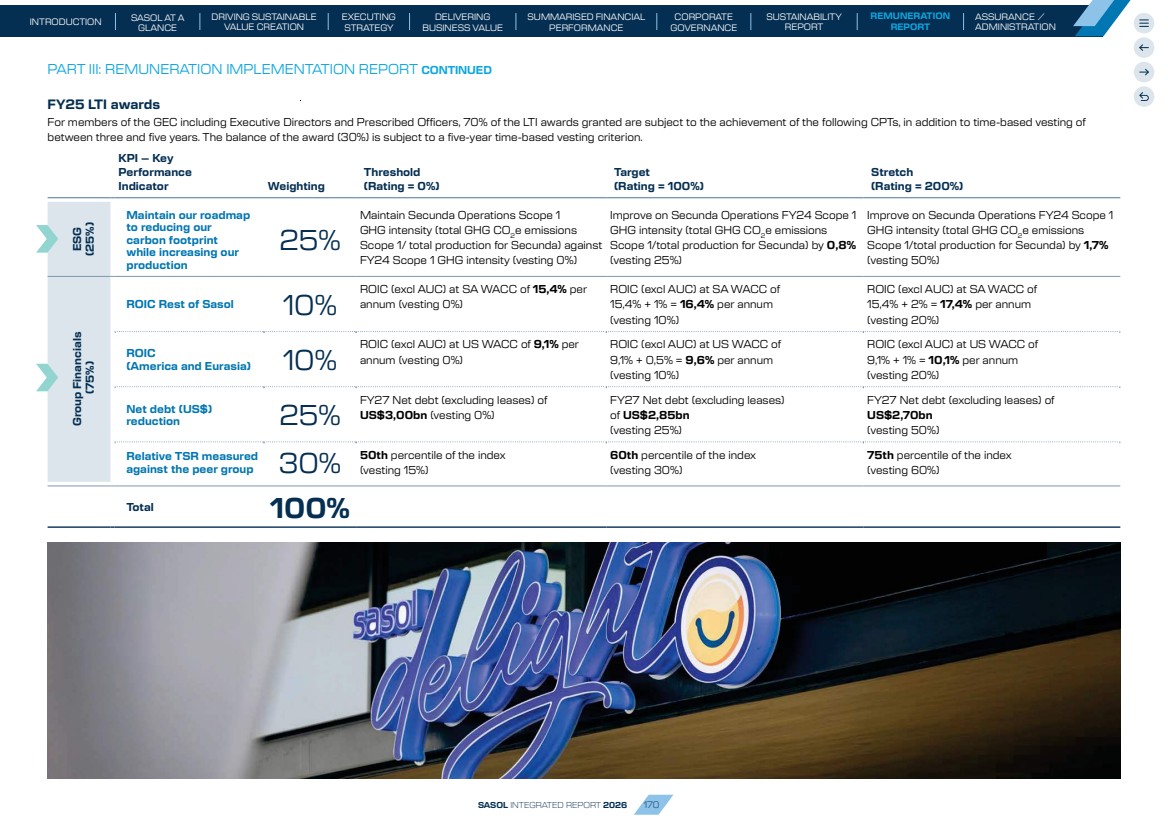
| FY26 LTI awards For members of the GEC including Executive Directors and Prescribed Officers, 100% of the LTI awards granted during FY26, are subject to the achievement of the following CPTs, vesting over three years. KPI – Key Performance Indicator Weighting Threshold (Rating = 0%) Target (Rating = 100%) Stretch (Rating = 200%) ESG (25%)Scope 1 and 2 GHG Intensity at Secunda Operations 25% Maintain Secunda Operations Scope 1 and 2 GHG intensity (total GHG CO2e emissions Scope 1 and 2/total production for Secunda) (vesting 0%) Improve Secunda Operations Scope 1 and 2 GHG intensity (total GHG CO2e emissions Scope 1 and 2/total production for Secunda) by 1% (vesting 25%) Improve Secunda Operations Scope 1 and 2 GHG intensity (total GHG CO2e emissions Scope 1 and 2/total production for Secunda) by 2% (vesting 50%) Group Financials (75%) Southern Africa breakeven oil price 20% FY28 SA breakeven oil price of US$55/bbl (vesting 0%) FY28 SA breakeven oil price of US$50/bbl (vesting 20%) FY28 SA breakeven oil price of US$45/bbl (vesting 40%) International Chemicals EBITDA margin % 10% FY28 Adjusted EBITDA margin for International Chemicals of 12,5% (vesting 0%) FY28 Adjusted EBITDA margin for International Chemicals of 15% (vesting 10%) FY28 Adjusted EBITDA margin for International Chemicals of 17,5% (vesting 20%) Net debt (US$) 15% FY28 Net debt of US$3bn (vesting 0%) FY28 Net debt of US$2,85bn (vesting 15%) FY28 Net debt of US$2,7bn (vesting 30%) Relative TSR measured against the peer group 30% 50th percentile of the index (vesting 15%) 60th percentile of the index (vesting 30%) 75th percentile of the index (vesting 60%) Total 100% PART III: REMUNERATION IMPLEMENTATION REPORT CONTINUED SASOL INTEGRATED REPORT 2026 171 SUSTAINABILITY REPORT SASOL AT A GLANCE DRIVING SUSTAINABLE VALUE CREATION EXECUTING STRATEGY INTRODUCTION DELIVERING BUSINESS VALUE CORPORATE GOVERNANCE SUMMARISED FINANCIAL PERFORMANCE ASSURANCE / ADMINISTRATION REMUNERATION REPORT |
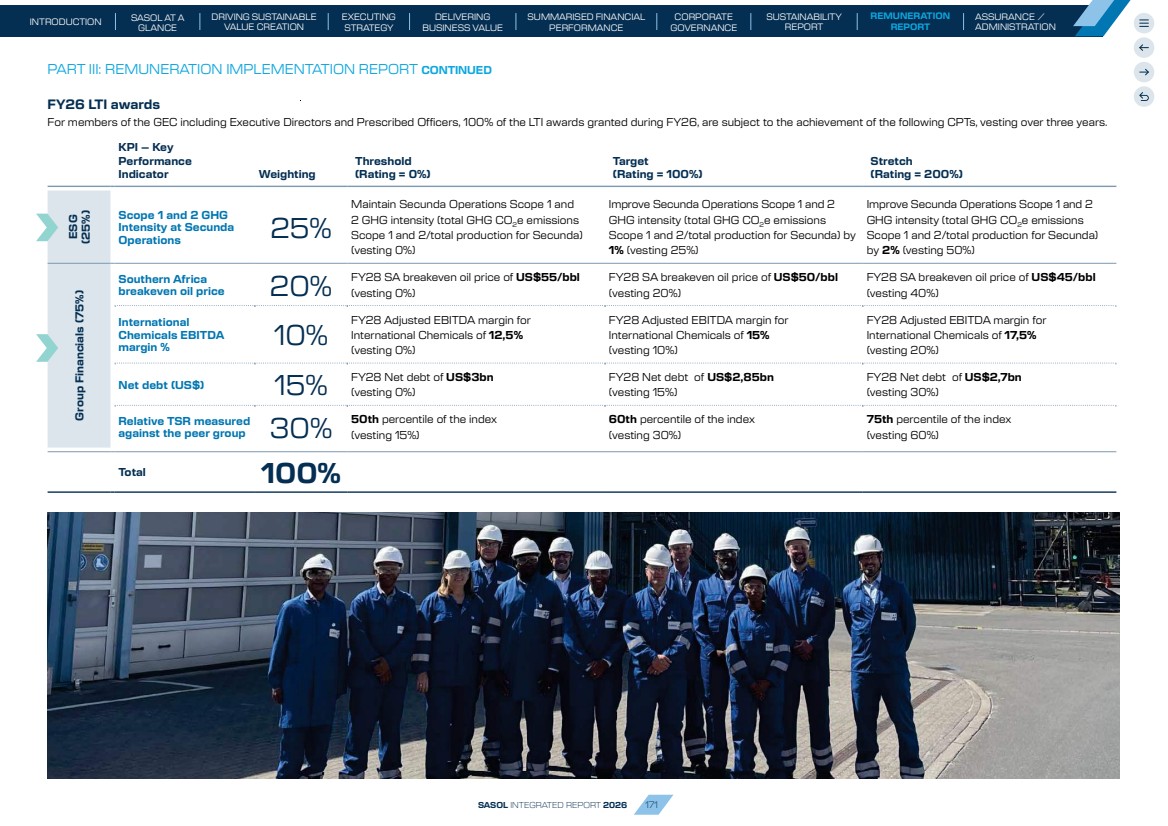
| Executive Directors A. Executive Directors’ total earned remuneration S Baloyi1 WP Bruns1,2 VD Kahla HA Rossouw3 Executive Director 2026 R’000 2025 R’000 2026 R’000 2025 Appointed 1 Sept 2024 R’000 2026 R’000 2025 R’000 2026 R’000 2025 R’000 Salary 16 293 12 514 7 608 5 982 8 793 8 499 – 1 336 Risk and retirement funding 1 590 1 276 1 002 788 404 382 – 151 Vehicle benefit 300 300 – – – – – – Healthcare 192 160 187 147 158 147 – – Other Benefits4 271 96 50 17 676 606 – – Total salary and benefits 18 646 14 346 8 847 6 934 10 031 9 634 – 1 487 Annual short-term incentive5 20 721 11 213 7 454 3 984 6 546 4 360 – – Long-term incentive gains6 3 499 353 3 990 387 11 117 3 569 – – Total annual remuneration 42 866 25 912 20 291 11 305 27 694 17 563 – 1 487 PART III: REMUNERATION IMPLEMENTATION REPORT CONTINUED B. Executive directors’ unvested LTI holdings (number & intrinsic value) for 2026 S Baloyi WP Bruns VD Kahla Number Intrinsic value2 R’000 Number Intrinsic value2 R’000 Number Intrinsic value2 R’000 Balance at beginning of the year 217 518 17 132 167 758 13 213 222 776 17 546 Awards granted1 185 812 23 275 85 680 10 732 82 511 10 335 Change in value2 – 24 162 – 16 579 – 17 933 Effect of corporate performance targets (1 116) (155) (324) (45) (3 001) (418) Dividend equivalents 1 129 157 1 821 254 9 570 1 333 Awards settled3 (11 734) (1 263) (11 323) (1 351) (66 571) (7 076) Awards forfeited – – – – – – Effect of changes in Executive Directors – – – – – – Balance at the end of the year 391 609 63 308 243 612 39 382 245 285 39 653 Notes 1 The Remuneration Committee approved market-related salary adjustments, where appropriate and in line with the Policy, in addition to annual salary increases, to support the continued competitiveness of the Group’s remuneration structure. See page 164 for more detail. 2 Mr Bruns was appointed as CFO and Executive Director from 1 September 2024. The disclosed prior year remuneration is thus apportioned. 3 Mr Rossouw stepped down as executive director and CFO effective 31 August 2024. All unvested LTIs were forfeited upon his resignation. 4 Other Benefits include security services, long service awards, private travel and other once off costs on which fringe benefit tax is levied where required. 5 Short-term incentives approved based on the Group results for FY26 and payable in the FY27 financial year. Incentives are calculated as a percentage of total guaranteed package/base salary as at 30 June 2026 X role category % X ((Group STI achievement x 80%) + (Individual performance achievement X 20%) – fatality penalty). 6 Long-term incentives gains for 2026 includes the Renewable energy (RE) grant awards made during financial year 2021 (where measurement was postponed to a day no later than 31 December 2026), the annual and retention (Mr Bruns) awards made in August 2023 and EVP Restricted (RLTI) award made in September 2021. The illustrative amount is calculated in terms of the number of LTIs x Corporate performance target achieved where relevant (RLTI and RE: 100%; CPT: 72%) x June 2026 average share price. The actual vesting date for the awards is between 28 August 2026 and 27 September 2026 subject to the company being in an open period. Dividend equivalents accrue at the end of the vesting period, to the extent that the LTIs vest. 50% of the vested LTIs and accrued dividends will be released in 2026 and the balance in 2028, subject to the rules of the LTI plan. As there are no further performance conditions attached to the balance of the 50%, the full amount is disclosed in the total earned remuneration table. Notes 1 LTIs granted on 8 September 2025. 2 Intrinsic values at the beginning and end of the year have been determined using the closing price of: 30 June 2026 R161,66 30 June 2025 R78,76 Change in intrinsic value for the year results from changes in share price. 3 Long-term incentives settled represent long-term incentives that vested with reference to the group results for 2025 that was settled in the 2026 financial year. The full amount of the remaining 50% that vested in the current year is disclosed in the total earned remuneration table. It also included the second tranche of awards which partially vested in 2023 (on which there were no further performance conditions thereafter for the balance of the award) and the restricted LTI awards, both granted in 2021. The difference between the long-term incentive gains disclosed in 2025 and the amount settled in 2026 is due to difference in actual share price at vesting date and the share price used in the previous disclosures. SASOL INTEGRATED REPORT 2026 172 SUSTAINABILITY REPORT SASOL AT A GLANCE DRIVING SUSTAINABLE VALUE CREATION EXECUTING STRATEGY INTRODUCTION DELIVERING BUSINESS VALUE CORPORATE GOVERNANCE SUMMARISED FINANCIAL PERFORMANCE ASSURANCE / ADMINISTRATION REMUNERATION REPORT |
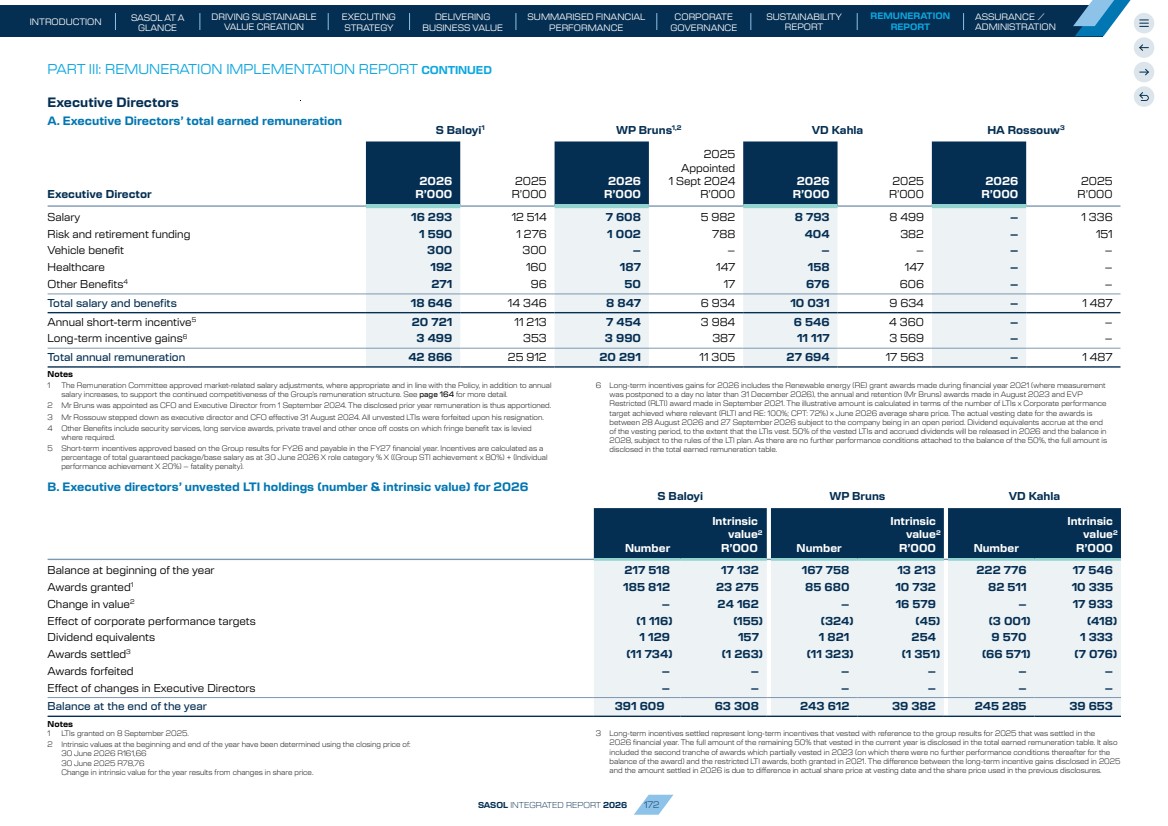
| Executive Directors continued C. Progress against Minimum Shareholding Requirement (MSR) Outstanding shares subject to continued employment only until 2029 (excluding accrued dividend equivalents, excluding performance shares) Executive Director Minimum Shareholding Requirement (MSR) Initial MSR Achievement period (CY) Shares Beneficial shareholding – 30 June 202612 Post tax vesting September – December 2026 1,2,3,4,5,13 Beneficial shareholding value (including CY2026 post tax vesting) % MSR achieved – end CY202611 Number of shares to vest in CY2027 6,7,8 Number of shares to vest CY2028- 2029 8,9,10 Total number of vested shares subject only to continued employment Pre-tax value of vested shares subject only to continued employment (up to CY2029)13 S Baloyi R40 950 000 2029 28 220 R4 545 113 R1 495 345 R6 040 458 15% 15 572 63 489 79 061 R15 467 494 WP Bruns R12 549 600 2029 18 776 R3 024 063 R2 053 046 R5 077 109 40% 9 848 44 753 54 601 R10 682 140 VD Kahla R6 612 468 2025 38 569 R6 885 657 R5 395 595 R12 281 252 186% 17 890 41 047 58 937 R11 530 435 PART III: REMUNERATION IMPLEMENTATION REPORT CONTINUED Notes 1 Includes the 1st tranche of the award made in FY24. The CPT applied to this award is 72%. 2 Includes Mr Bruns’ SVP retention award made in August 2023. 3 Includes the 2nd tranche of the award made in September 2021. The CPT applied to this award is 83,6%. 4 Includes the portion of the FY21 award linked to the Renewable Energy Target where the measurement period was deferred to 31 December 2026 but the performance condition has already been met. 5 Includes the restricted LTI award made to Mr Kahla in September 2021. This award is subject to a 5 year time based vesting period. 6 Includes the 2nd tranche and restricted portion of the EVP on-appointment award made to Mr Baloyi in May 2022. 7 Includes the 2nd tranche of the awards made in September and November 2022, (CPT% is 83,93%) as well as the restricted LTI award made in November 2022 to Messrs, Baloyi and Kahla. 8 Includes the portion of the 1st tranche of the SVP annual award made in August 2024 to Mr Bruns with a split vesting in August 2027 and 2029. 9 Includes the restricted awards made in August 2023, August 2024 (annual) and November 2024 (EVP on-appointment award). These awards are subject to 5 year time based vesting periods. 10 Includes the 2nd tranche of the award made in August 2023 to vest in August 2028 subject to time based vesting criteria. The CPT applied to this award is 72%. 11 Once the MSR has been achieved, the executive will be allowed to sell vested shares held in excess of the MSR. 12 Beneficial shareholding at 30 June 2026 is recorded at the higher of historical cost or 30 June 2026 closing price. 13 Average June 2026 share price of R195.64 (JSE) and $11,86 (NYSE). SASOL INTEGRATED REPORT 2026 173 SUSTAINABILITY REPORT SASOL AT A GLANCE DRIVING SUSTAINABLE VALUE CREATION EXECUTING STRATEGY INTRODUCTION DELIVERING BUSINESS VALUE CORPORATE GOVERNANCE SUMMARISED FINANCIAL PERFORMANCE ASSURANCE / ADMINISTRATION REMUNERATION REPORT |
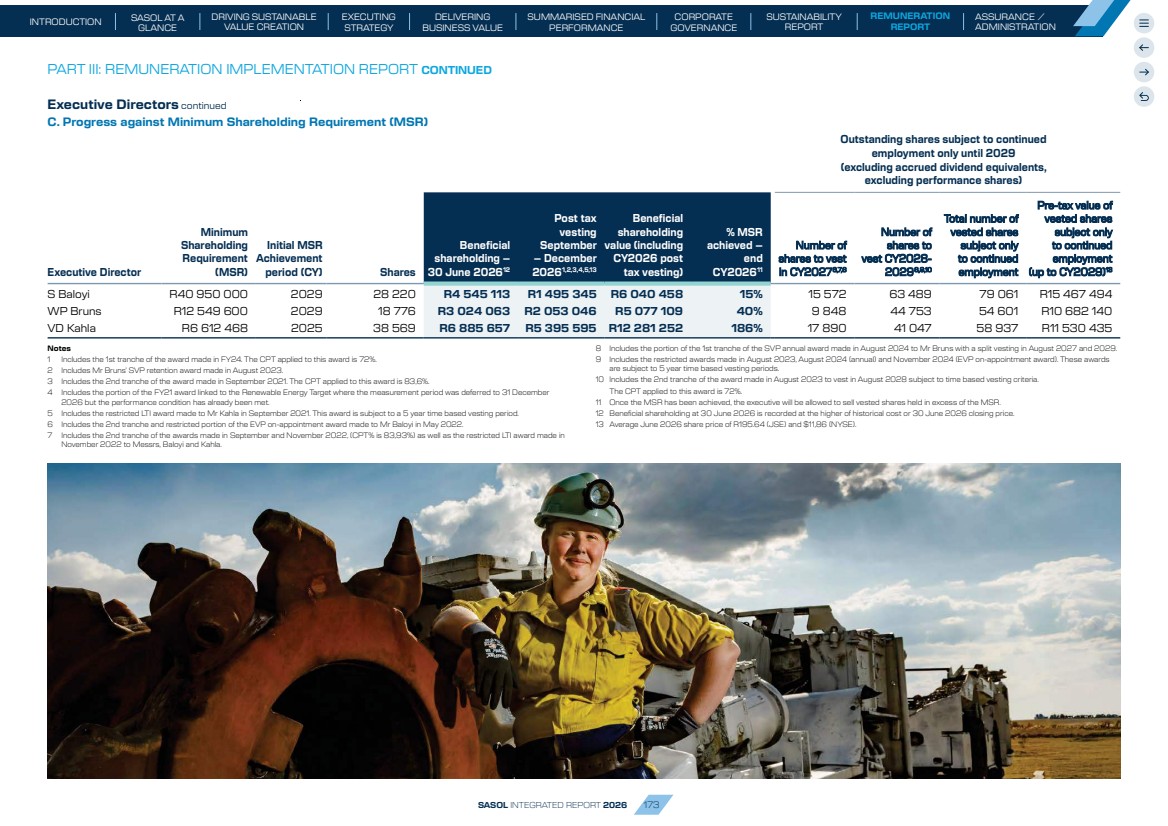
| Prescribed Officers A. Prescribed Officers’ total earned remuneration V Bester1 AGM Gerber2 C Herrmann2,3 AT Makgala4 CK Mokoena5 SD Pillay1 SL Siyaya6 H Wenhold7 Prescribed officers 2026 R’000 2025 R’000 2026 R’000 2025 R’000 2026 R’000 2025 R’000 2026 R’000 2025 R’000 2026 R’000 2025 R’000 2026 R’000 2025 R’000 2026 R’000 2025 R’000 2026 R’000 2025 R’000 Salary 7 156 6 044 10 186 9 375 8 118 7 969 4 433 – 1 821 6 915 6 011 5 039 4 598 – 1 192 6 288 Risk and retirement funding 1 086 920 796 873 645 595 762 – – 327 939 795 536 – – 824 Vehicle benefit – – 146 308 248 252 – – – – 150 150 – – – – Healthcare 130 121 115 104 230 224 55 – 45 174 130 121 158 – 21 121 Other benefits8 112 100 41 217 3 772 2 634 11 352 – 10 72 61 11 11 – 5 34 Total salary and benefits 8 484 7 185 11 284 10 877 13 013 11 674 16 602 – 1 876 7 488 7 291 6 116 5 303 – 1 218 7 267 Annual short-term incentive9 6 578 3 549 7 389 4 867 5 355 3 894 3 550 – 3 503 3 637 5 190 3 072 3 374 – 4 369 3 439 Long-term incentive gains10 2 110 119 – – 3 824 637 – – 7 168 2 931 503 947 2 642 – 6 917 671 Total annual remuneration 17 172 10 853 18 673 15 744 22 192 16 205 20 152 – 12 547 14 056 12 984 10 135 11 319 – 12 504 11 377 Notes 1 The Remuneration Committee approved market-related salary adjustments, where appropriate and in line with the Policy, in addition to annual salary increases, to support the continued competitiveness of the Group’s remuneration structure. 2 Ms Gerber and Mr Herrmann are employed on German employment contracts and paid in Euros. The conversion to ZAR has been done using the monthly average of daily closing rates. 3 Expatriate benefits in South Africa are offered and grossed up as appropriate. Other Benefits include accommodation, home leave allowance and transportation offered under the Expatriation policy. 4 Ms Makgala was appointed as EVP: People, SHE, Risk and Corporate Affairs on 1 October 2025. Other Benefits include a staggered buy-out arrangement in respect of incentives forfeited (R5,4m) when she resigned from her previous employer as well as relocation expenses (R0,4m) paid in terms of the policy. A non-taxable payment to her previous employer with respect to a work back agreement is included in the amount to the value of R5,4m. The Sasol buy-out agreement for all payments is linked to a work-back period.. 5 Ms Mokoena stepped down as prescribed officer on 30 September 2025 after reaching the Sasol retirement age for group executives. 6 Mr Siyaya was appointed as EVP: Mining on 1 September 2025. Remuneration is disclosed for the period since appointment. 7 Mr Wenhold stepped down as a prescribed officer on 31 August 2025 after reaching the Sasol retirement age for group executives. 8 Other Benefits include security services, long service awards, private travel and other once off costs on which fringe benefit tax is levied where required. 9 Short-term incentives approved based on the Group results for FY26 and payable in the FY27 financial year. Incentives are calculated as a percentage of total guaranteed package/base salary as at 30 June 2026 x role category % x [(Group STI achievement x 80%) + (Individual Performance Achievement x 20%) – fatality penalty). 10 Long-term incentives gains for 2026 includes the Renewable energy (RE) grant awards made during financial year 2021 (where measurement was postponed to 31 December 2026 but the performance condition has already been met), the annual and on-appointment awards made in 2023 and Restricted LTI award made in September 2021. The illustrative amount is calculated in terms of the number of LTIs x Corporate performance target achieved where relevant (CPT: 72%) x June 2026 average share price. The actual vesting date for the awards is between 28 August 2026 and 27 September 2026 subject to the company being in an open period. Dividend equivalents accrue at the end of the vesting period, to the extent that the LTIs vest. 50% of the vested LTIs and accrued dividends will be released in 2026 and the balance in 2028, subject to the rules of the LTI plan. As there are no further performance conditions attached to the balance of the 50%, the full amount is disclosed in the total earned remuneration table. PART III: REMUNERATION IMPLEMENTATION REPORT CONTINUED SASOL INTEGRATED REPORT 2026 174 SUSTAINABILITY REPORT SASOL AT A GLANCE DRIVING SUSTAINABLE VALUE CREATION EXECUTING STRATEGY INTRODUCTION DELIVERING BUSINESS VALUE CORPORATE GOVERNANCE SUMMARISED FINANCIAL PERFORMANCE ASSURANCE / ADMINISTRATION REMUNERATION REPORT |
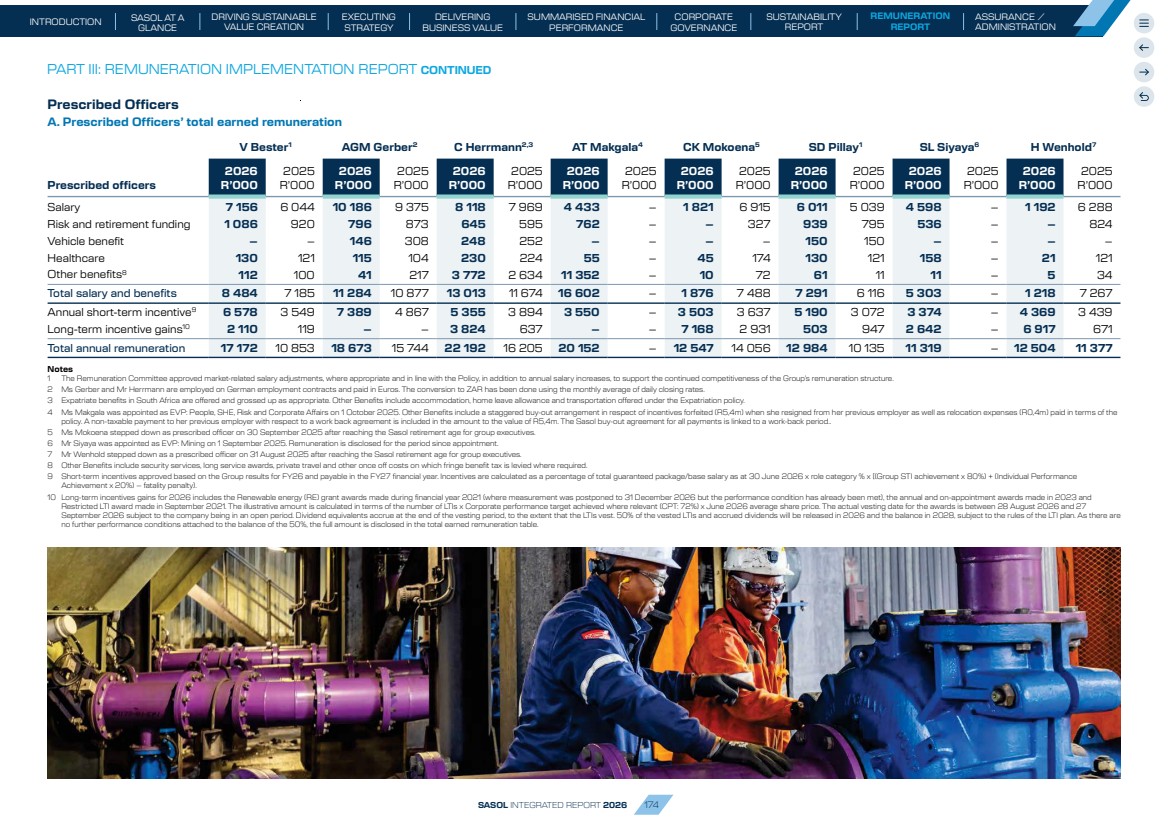
| PART III: REMUNERATION IMPLEMENTATION REPORT CONTINUED Prescribed Officers continued B. Unvested LTI holdings (number and intrinsic value) for 2026 V Bester AGM Gerber C Herrmann AT Makgala CK Mokoena5 SD Pillay SL Siyaya6 H Wenhold7 Number Intrinsic value2 R’000 Number Intrinsic value2 $’000 Number Intrinsic value2 $’000 Number Intrinsic value2 R’000 Number Intrinsic value2 R’000 Number Intrinsic value2 R’000 Number Intrinsic value2 R’000 Number Intrinsic value2 R’000 Balance at the beginning of the year 77 615 6 113 85 378 377 122 021 539 – – 162 969 12 835 69 031 5 437 – – 123 098 9 695 Awards granted1 66 132 8 284 93 110 666 74 488 533 64 863 7 219 – – 56 376 7 062 57 684 7 225 – – Change in value2 – 8 795 – 710 – 805 – 3 267 – 4 678 – 7 860 – 3 847 – 4 710 Effect of corporate performance targets (100) (14) – – (574) (5) – – – – (569) (79) (38) (5) – – Dividend equivalents 528 74 – – 2 529 21 – – – – 1 467 204 238 33 – – Awards settled3 (1 511) (189) – – (19 674) (137) – – – – (9 285) (1 567) (1 125) (141) – – Awards forfeited – – – – – – – – – – – – – – – – Effect of changes in Prescribed Officers – – – – – – – – (162 969) (17 513) – – 39 958 4 676 (123 098) (14 405) Balance at the end of the year4 142 664 23 063 178 488 1 753 178 790 1 756 64 863 10 486 – – 117 020 18 917 96 717 15 635 – – 1 LTIs granted on 8 September 2025 and 28 November 2025 (Ms Makgala). 2 Intrinsic values at the beginning and end of the year have been determined using the closing price of: 30 June 2026 R161,66 ($9,82) 30 June 2025 R78,76 ($4,42) Change in intrinsic value for the year results from changes in share price. 3 Long-term incentives settled represent long-term incentives that vested with reference to the group results for 2025 that was settled in the 2026 financial year. The full amount of the remaining 50% that vested in the current year is disclosed in the total earned remuneration table. It also included the second tranche of awards which vested in 2023 (on which there were no further performance conditions) and the restricted LTI awards, both granted in 2020. The difference between the long-term incentive gains disclosed in 2025 and the amount settled in 2026 is due to difference in actual share price at vesting date and the share price used in the previous disclosures. 4 The balance includes a total of 2 333 award issued in FY21 for which the renewable energy CPT has been deferred up to 31 December 2026. 5 Ms Mokoena stepped down as Prescribed Officer on 30 September 2025 having reached the group’s retirement age. 6 Mr Siyaya was appointed on 1 September 2025 as EVP: Mining. 7 Mr Wenhold stepped down as Prescribed Officer on 31 August 2025 having reached the group’s retirement age. . SASOL INTEGRATED REPORT 2026 175 SUSTAINABILITY REPORT SASOL AT A GLANCE DRIVING SUSTAINABLE VALUE CREATION EXECUTING STRATEGY INTRODUCTION DELIVERING BUSINESS VALUE CORPORATE GOVERNANCE SUMMARISED FINANCIAL PERFORMANCE ASSURANCE / ADMINISTRATION REMUNERATION REPORT |
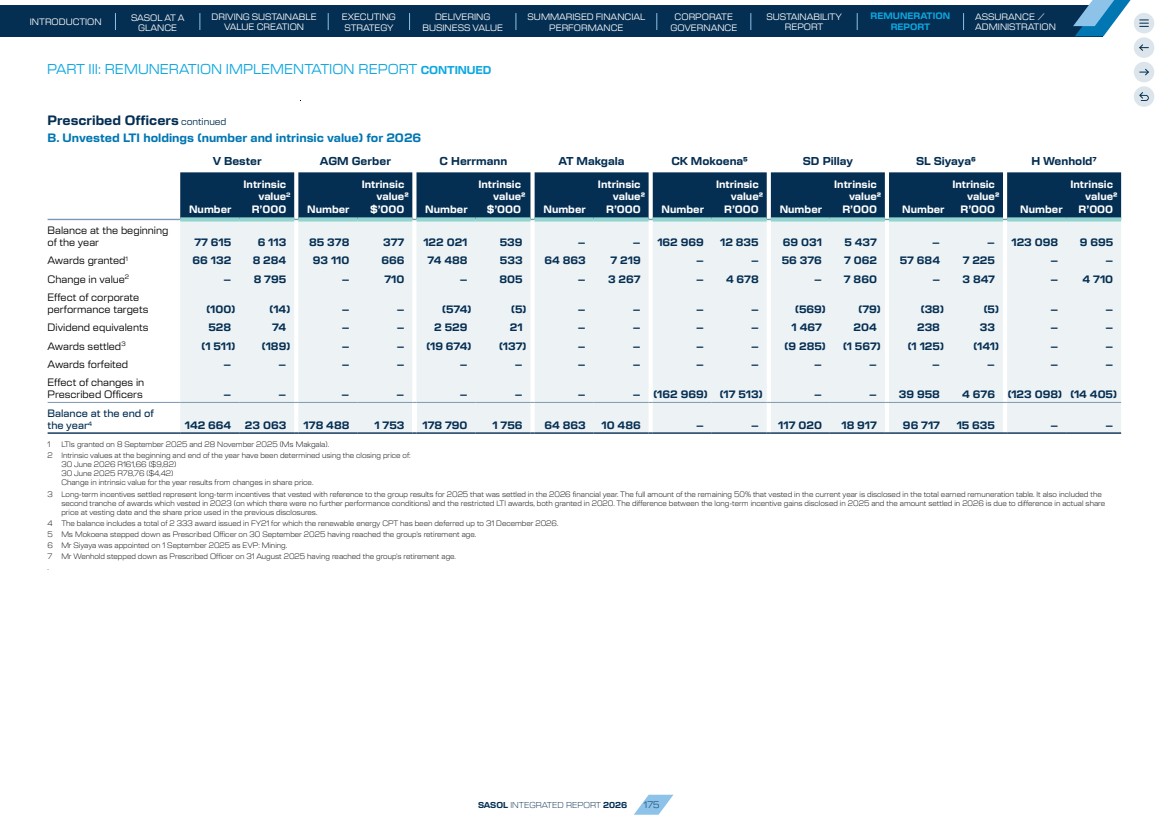
| C. Progress against Minimum Shareholding Requirement (MSR) Outstanding shares subject to continued employment only until 2029 (excluding accrued dividend equivalents, excluding performance shares) Minimum Share-holding Require-ment (MSR) Initial MSR Achievement period (CY) Shares Beneficial shareholding – 30 June 2026 Post tax vesting September-December 2026 1,2,3,4,5,15 Beneficial shareholding value (including CY2026 post tax vesting) % MSR achieved – end CY2026 Number of shares to vest in CY2027 6,7,9,10 Number of shares to vest CY2028- 2029 8,11,12,13,14 Total number of vested shares subject only to continued employment Pre-tax value of vested shares subject only to continued employment (up to CY2029)16 V Bester R6 115 200 2030 4 041 R650 843 R577 177 R1 228 021 20% 4 382 23 496 27 878 R5 454 052 AGM Gerber $602 764 2030 – – – – 0% – 25 613 25 613 $303 770 C Herrmann $479 858 2030 14 847 $145 798 $114 289 $260 087 54% 22 995 24 862 47 857 $567 584 AT Makgala R4 900 000 2031 – – – – 0% – – – – CK Mokoena R5 431 664 2026 30 266 R5 219 269 R3 513 959 R8 733 227 161% 14 696 33 717 48 413 R9 471 519 SD Pillay R5 299 924 2030 13 636 R2 196 214 R156 346 R2 352 560 44% – 21 251 21 251 R4 157 546 SL Siyaya R4 445 000 2031 768 R123 694 R1 026 631 R1 150 325 26% 8 560 12 454 21 014 R4 111 179 H Wenhold R5 298 020 2029 23 331 R3 757 691 R2 714 691 R6 472 382 122% 5 546 38 489 44 035 R8 615 007 PART III: REMUNERATION IMPLEMENTATION REPORT CONTINUED Notes 1 Includes the 1st tranche of the award made in August 2023. The CPT applied to this award is 72%. 2 Includes the 2nd tranche of the award made in August 2021. The CPT applied to this award is 83,6%. 3 Includes the portion of the FY21 award linked to the Renewable Energy Target where measurement period was deferred to 31 December 2026. 4 Includes the restricted EVP award made to Ms Mokoena in September 2021. This award is subject to a 5 year time based vesting period. 5 Includes the 1st tranche of the EVP on-appointment award made to Mr Wenhold and SVP on-appointment made to Mr Siyaya in November 2023. 6 Includes the 2nd tranche of the SVP on-appointment award made to Mr Bester in May 2022. 7 Includes the 2nd tranche and restricted portion of the awards made in September and November 2022 which is subject to a 5 year time based vesting period. The CPT applied to this award is 83,93%. 8 Includes the 2nd tranche of the restricted portion of Dr Pillay’s SVP on-appointment award made in May 2023 (which vests in 2028). 9 Includes Mr Herrmann’s SVP retention award made in August 2024. 10 Includes the portion of the 1st tranche of the SVP award made in August 2024 to Mr Siyaya. 11 Includes the 2nd tranche of the award made in August 2023. The CPT applied to this award is 72%. 12 Includes the restricted awards made in August 2024 and November 2023. These awards are subject to 5 year time based vesting periods. 13 Includes the 2nd tranche of the EVP on-appointment award made to Mr Wenhold and SVP on-appointment made to Mr Siyaya in November 2023. 14 Includes the restricted portion of the 2nd tranche of the SVP award made in August 2024 to Mr Siyaya. 15. Beneficial shareholding is recorded at the higher of historical cost or 30 June closing price. 16. Average June 2026 share price of R195.64 (JSE) and $11,86 (NYSE). SASOL INTEGRATED REPORT 2026 176 SUSTAINABILITY REPORT SASOL AT A GLANCE DRIVING SUSTAINABLE VALUE CREATION EXECUTING STRATEGY INTRODUCTION DELIVERING BUSINESS VALUE CORPORATE GOVERNANCE SUMMARISED FINANCIAL PERFORMANCE ASSURANCE / ADMINISTRATION REMUNERATION REPORT |
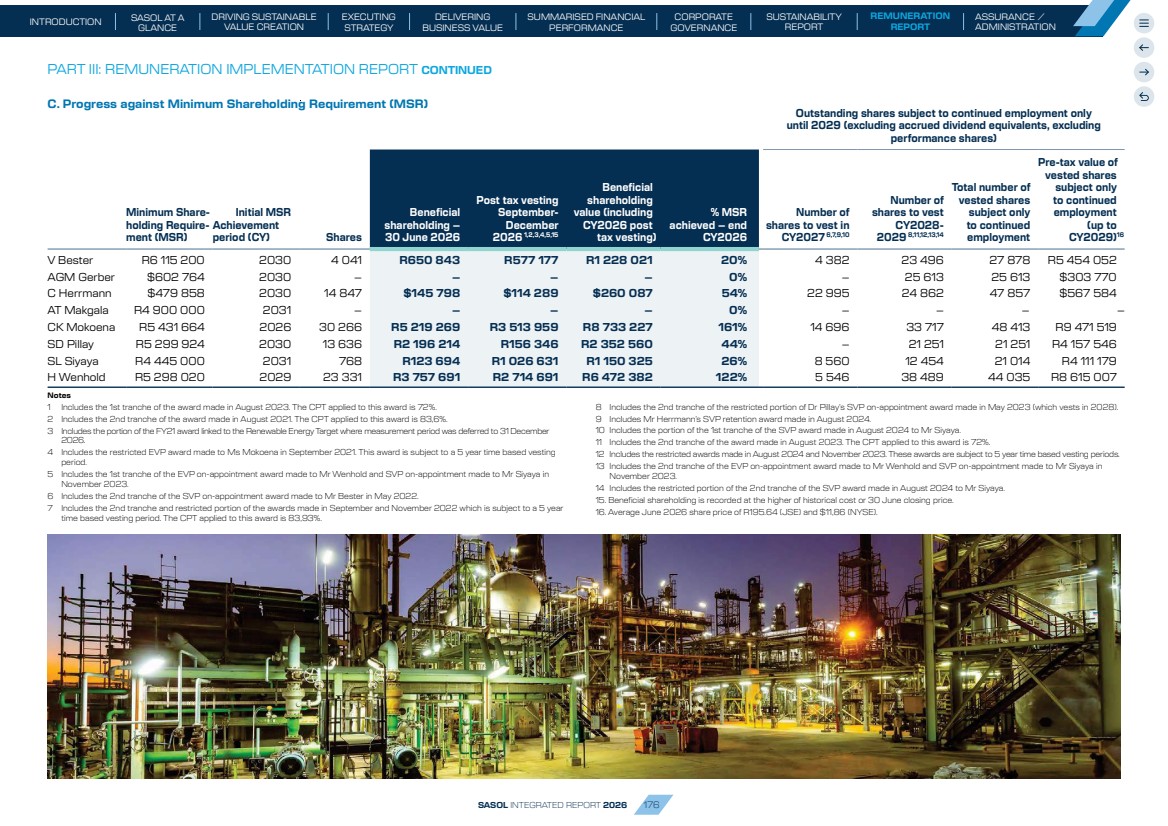
| Beneficial shareholding D. Sasol Limited Directors’ interests in securities (Beneficial shareholding including indirect holdings) as at 30 June 2026 Beneficial shareholdings 2026 2025 Executive Directors S Baloyi 28 220 20 284 WP Bruns 19 139 7 816 VD Kahla 38 569 18 489 Non-Executive Directors MBN Dube 1 024 1 024 S Subramoney 2 548 2 548 T Cumming1 – 1 950 Note 1 Resigned with effect 6 June 2025 E. Prescribed Officers interests in securities (Beneficial shareholding including indirect holdings) as at 30 June 2026 2026 2025 Beneficial shareholdings Securities ADR Securities ADR Prescribed officers V Bester 4 041 3 223 C Herrmann 14 847 4 775 CK Mokoena1 30 266 16 221 SD Pillay 13 986 3 635 SL Siyaya2 763 H Wenhold3 23 331 24 634 Notes 1 Stepped down as Prescribed Officer on 30 September 2025 having reached the Group’s retirement age. 2 Appointed with effect 1 September 2025 3 Stepped down as Prescribed Officer on 31 August 2025 having reached the Group’s retirement age. PART III: REMUNERATION IMPLEMENTATION REPORT CONTINUED SASOL INTEGRATED REPORT 2026 177 SUSTAINABILITY REPORT SASOL AT A GLANCE DRIVING SUSTAINABLE VALUE CREATION EXECUTING STRATEGY INTRODUCTION DELIVERING BUSINESS VALUE CORPORATE GOVERNANCE SUMMARISED FINANCIAL PERFORMANCE ASSURANCE / ADMINISTRATION REMUNERATION REPORT |
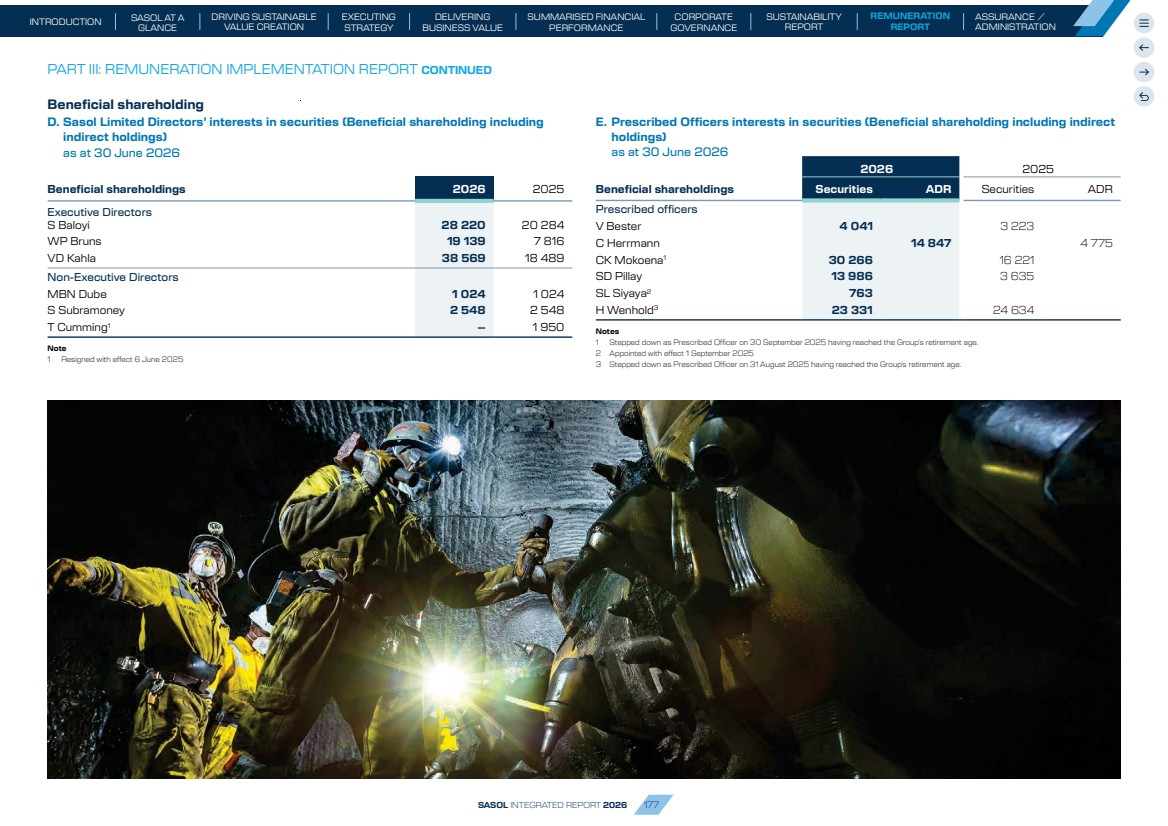
| Non-Executive Directors’ fees Non-Executive Directors Board Meeting Fees2 R’000 Lead Independent Director Fees2 R’000 Committee Fees2 R’000 Ad Hoc or special purpose Board Committee2 R’000 Total 20261 R’000 Total 20251 R’000 MBN Dube (Chairman) 6 385 6 385 6 671 M Flöel (Lead Independent Director)3 2 077 964 1 248 – 4 289 4 234 KC Harper4 1 463 458 – 1 921 3 086 DGP Eyton5 2 221 1 363 3 584 3 089 MJ Cuambe6 1 805 845 – 2 650 2 606 GMB Kennealy 1 958 1 037 – 2 995 2 982 S Subramoney 1 958 613 – 2 571 2 564 NX Maluleke7 2 101 562 – 2 663 – R Gasant8 803 51 – 854 – TJ Cumming 9 – – – – 2 917 NNA Matyumza10 – – – – 421 MEK Nkeli11 – – – – 458 Total 20 771 964 6 177 – 27 912 29 028 NED fees Aligned with clause 24 of the Company’s MOI, with effect from 1 January 2026, the fees payable to Non-Executive Directors of the Company for their services as Directors of the Company, are as listed in the table below: January 2026 – December 20261,2,3 NEDs permanently residing outside of Europe/UK/ North-America (US$) NEDs permanently residing in Europe/UK/ North-America (US$) Chairman of the Sasol Limited Board (all inclusive) 307 000 371 700 Non-Executive Director 107 700 129 300 Lead Independent Director (additional to director’s fee) 46 000 55 200 Audit Committee Chairman 32 100 37 400 Audit Committee member 21 300 25 600 Remuneration Committee Chairman 21 400 25 700 Remuneration Committee member 12 800 15 500 Other Committee Chairman4 21 400 25 700 Other Committee member4 12 800 15 500 PART III: REMUNERATION IMPLEMENTATION REPORT CONTINUED Notes: 1 Fees are exclusive of value-added tax (VAT) which is added for directors who are registered for VAT. 2 Paid in US dollar or home country currency as appropriate. 3 Exchange rate for conversion from US dollar to ZAR will be fixed for a period of 12 months to prevent exchange rate fluctuations in the actual fees paid for the ensuing 12-month period. 4 Also applies to any ad hoc Committee constituted by the Board from time to time. Notes 1 Fees exclude VAT. 2 Board and Committee fees are denominated in US dollars and are therefore subject to fluctuations in foreign exchange rates. For non-Executive Directors permanently resident outside Europe, the United Kingdom and North America, the US$/ZAR exchange rate applicable to Board and Committee fees was fixed for the first half of FY26 using the average exchange rate for the period July 2023 to December 2024. The exchange rate applicable to the second half of FY26 was fixed using the average exchange rate for the period July 2024 to December 2025. In addition, a cost-of-living adjustment is applied to the fees of these directors. To reduce the impact of currency volatility on non-Executive Directors permanently resident in Europe, the United Kingdom and North America, the US$/EUR and US$/GBP exchange rates applicable to Board and Committee fees were fixed for Q2, Q3 and Q4 using the prevailing average exchange rates at the time the fees were approved. 3 Dr Flöel was appointed as Remuneration Committee Chairman and stepped down from the Capital Investment Committee Chairman role, effective 6 June 2025 while remaining a member of Capital Investment Committee. 4 Ms Harper resigned from the Board on 16 February 2026 and received pro rated Board and Committee fees for Q3. 5 Mr Eyton stepped down as a member of the Audit Committee, effective 1 June 2026 and received pro rated committee fees for Q4. 6 Mr Cuambe was appointed as the Chairman of the Capital Investment Committee, on 6 June 2025. He stepped down as a member of the Safety, Social and Ethics Committee on 22 August 2025 and received pro rated committee fees for Q1. 7 Ms Maluleke was appointed to the Board effective 9 June 2025, and was appointed to the Audit, and Safety, Social and Ethics Committees, on 22 August 2025. 8 Mr Gasant was appointed to the Board on 1 February 2026 and received a pro-rated Board fee. He was appointed to the Audit Committee and the Remuneration Committee on 1 June 2026 and received pro rated committee fee payments. 9 Mr Cumming resigned from the Board on 6 June 2025. 10 Ms Matyumza retired from the Board on 8 September 2024. 11 Ms Nkeli retired from the Board on 31 August 2024. SASOL INTEGRATED REPORT 2026 178 SUSTAINABILITY REPORT SASOL AT A GLANCE DRIVING SUSTAINABLE VALUE CREATION EXECUTING STRATEGY INTRODUCTION DELIVERING BUSINESS VALUE CORPORATE GOVERNANCE SUMMARISED FINANCIAL PERFORMANCE ASSURANCE / ADMINISTRATION REMUNERATION REPORT |
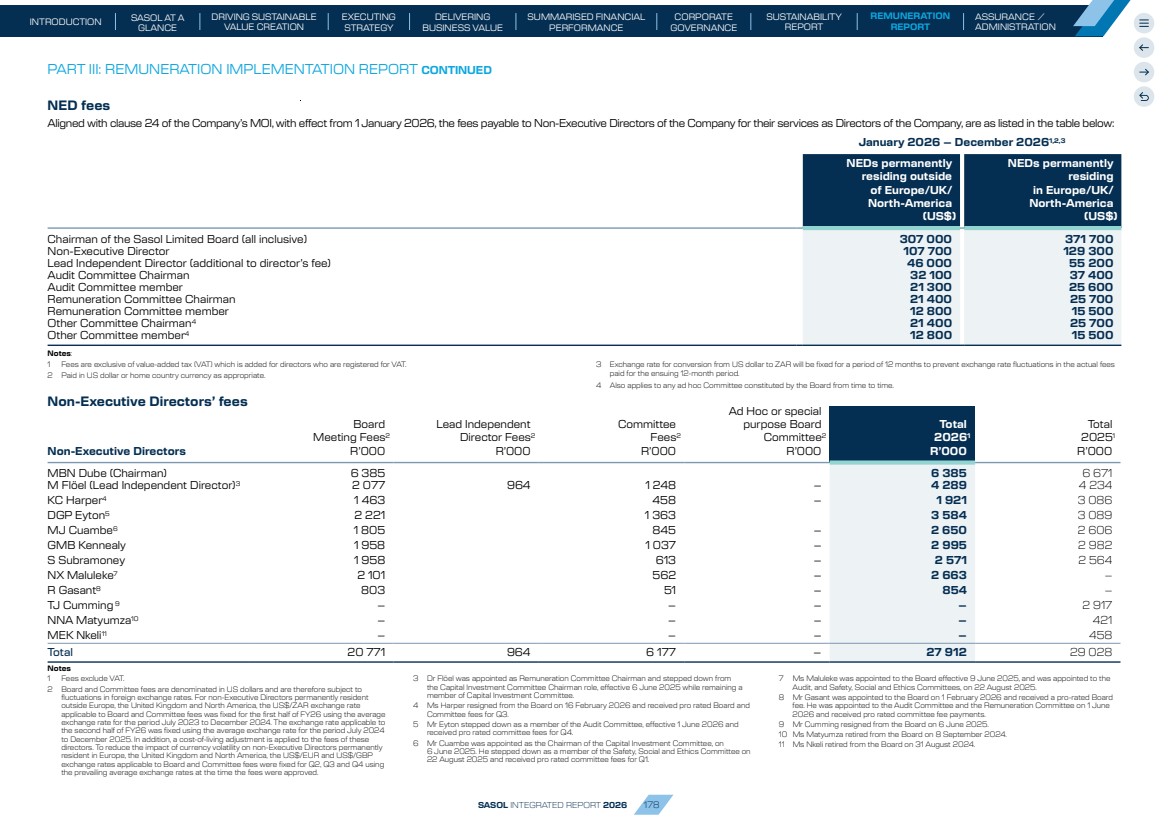
| Pay gap disclosures We believe that transparent and comparable pay information helps build trust and supports fair pay practices. In South Africa, pay transparency is particularly important because historical inequalities continue to influence employment outcomes. By reporting our pay gaps, we can identify differences, measure our progress and remain accountable for improving pay equity. PART III: REMUNERATION FAIR PAY PRINCIPLES Reporting both actual and target remuneration measures reduces the effect of year-to-year changes caused by business performance, economic conditions and the timing of incentive payments. It also provides a more consistent basis for comparing remuneration over time. Because target remuneration includes future incentive opportunities, the highest-paid employee for pay gap reporting purposes may differ from the highest-paid individual disclosed in the Executive Director and Prescribed Officer remuneration tables. The Committee oversees pay gap reporting and reviews pay outcomes in countries where we employ a significant number of employees (200+). It monitors both vertical and horizontal pay gaps, including gender and race pay gaps in South Africa, and oversees actions to address any material differences if required. We continue to refine our Global Pay Transparency Framework as regulations and leading practices evolve, including the EU Pay Transparency Directive. This helps us improve transparency, strengthen governance and promote fair and equitable remuneration across all the countries in which we operate. Average Median CENTRAL TENDENCIES Transparency and fairness in pay practices PAY EQUITY INDICATOR REMUNERATION LEVELS Highest paid Lowest paid We have adopted a Global Pay Transparency Framework to create a consistent approach to pay across Sasol. The framework reflects leading global practices and evolving legal requirements. It also strengthens how we measure, monitor and report pay equity across our workforce. We began reporting pay gap information voluntarily before the Companies Act came into effect. We will continue to strengthen our reporting as local and international standards evolve. To give a balanced view of remuneration, we disclose both actual remuneration and target remuneration. • Actual remuneration reflects what employees earned during the reporting period. • Target remuneration includes target short-term and long-term incentive opportunities, assuming all performance conditions are achieved. CATEGORY METRIC Remuneration Levels • Total remuneration of the lowest paid employee • Total remuneration of the highest paid employee Central Tendencies • Average total remuneration • Median total remuneration Pay Equity Indicator • Ratio of total remuneration of top 5% earners vs bottom 5% earners Section A: Actual earnings, in line with Section 30B of the Companies Act Section B: Total target remuneration, as per our Remuneration Policy, which smooths out fluctuations in variable pay and supports more consistent year-on-year comparisons Section C: Gender Pay Information and pay gaps Our Pay Gap Disclosure Includes three data sets: SASOL INTEGRATED REPORT 2026 179 SUSTAINABILITY REPORT SASOL AT A GLANCE DRIVING SUSTAINABLE VALUE CREATION EXECUTING STRATEGY INTRODUCTION DELIVERING BUSINESS VALUE CORPORATE GOVERNANCE SUMMARISED FINANCIAL PERFORMANCE ASSURANCE / ADMINISTRATION REMUNERATION REPORT |
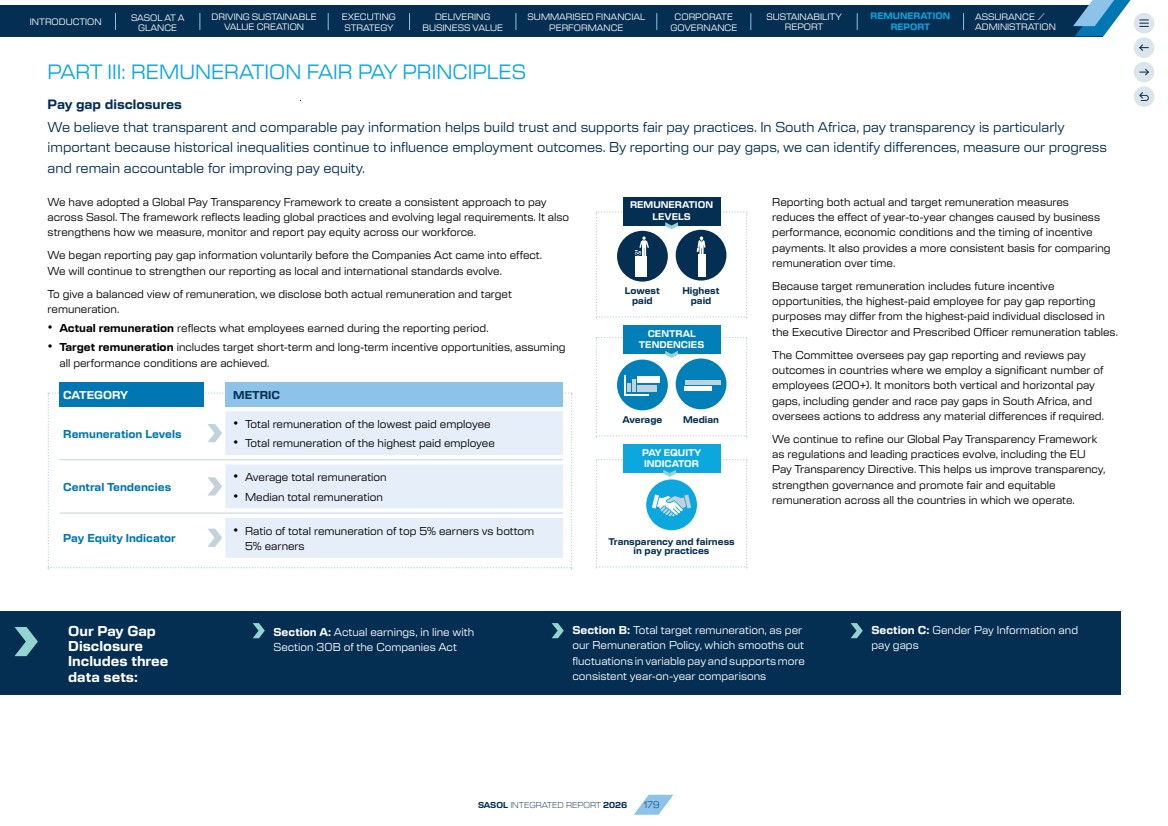
| PART III: REMUNERATION FAIR PAY PRINCIPLES CONTINUED Section A: South African Pay information and pay gap data using actual payroll data as processed in the periods 1 July 2024 – 30 June 2025 and 1 July 2025 – 30 June 2026. Data analysis includes all permanent and non-permanent employees but excludes learners who are in training and receive a stipend. The short-term incentives and long-term incentives processed through the payroll during FY25 and FY26, are included. In addition: • Payments for employees who only worked a portion of the year, are not annualised which means that where an employee was only employed for one month, we only disclose the one month’s earnings; • Employer contributions to employee benefit funds as well as leave encashments at service termination, all allowances and overtime are included; and • Benefits in kind which are not limited to transportation, uniforms, meals on site are excluded. The data is based on a headcount of 25 360 for FY25 and 25 381 for FY26. A. Actual earnings and allowances + actual STI + LTI gains R761 798 R923 102 R24 369 456 R20 270 R784 929 R931 520 R31 152 754 R20 373 FY25 FY26 Highest and lowest actual earnings Median Average Highest actual earnings Lowest actual earnings The year-on-year differences in the highest earnings are caused by variable pay awards at senior leadership and a full year’s remuneration reflected for the CEO in 2026. The year-on-year differences in the lowest earnings relate to employees only being employed for a portion (one month) of the year. The change in median and average earnings relates to a change in headcount at different levels in the organisation and reflects the annual increases applied. Ratio of Top 5% vs. Bottom 5% FY25 FY26 Bottom 5% Top 5% Bottom 5% Top 5% Sample Size 1 268 1 268 1 269 1 269 Average 201 565 3 044 955 220 709 2 943 275 Ratio 15,11 13,34 The pay gap over the past two years has narrowed (FY24 16,60) which is indicative of the lower than inflation increases at management level and above inflation increases at bargaining unit level, as well as the outcomes of targeted interventions to address pay compression which is the gap between lower paid non-bargaining unit employees versus higher paid bargaining unit employees. Section B: Pay information and pay gap data using actual payroll data fixed, and contingency pay, and target incentive amounts; for the periods 1 July 2024 – 30 June 2025 and 1 July 2025 – 30 June 2026 The following principles applied differ from those previously used: • Variable pay has been set at the target levels for different role categories and not the actual amounts processed; this approach eliminates substantial year-on-year changes in variable pay and thus provides a more accurate indicator of pay gaps; • The earnings data for non-permanent employees are excluded; and • The earnings for employees who worked for less than one year, are annualised. The data is based on a headcount of 24 941 for FY25 and 24 983 for FY26. Median Average Highest actual earnings Lowest actual earnings B. Actual earnings and allowances + target STI + target LTI FY25 FY26 R843 778 R1 056 268 R56 446 406 R165 176 R867 835 R1 063 937 R70 321 289 R196 164 Highest and lowest actual earnings Ratio of Top 5% vs. Bottom 5% FY25 FY26 Bottom 5% Top 5% Bottom 5% Top 5% Sample Size 1 247 1 247 1 249 1 249 Average 375 215 3 901 037 390 738 3 792 854 Ratio 10,40 9,71 Over two years the gap has narrowed (FY24: 10,71) due to refinements to the pay mix design, below-inflation salary increases at management level, above-inflation salary increases at bargaining unit level, and targeted interventions to address pay compression between lower-paid non-bargaining unit employees and higher-paid bargaining unit employees. SASOL INTEGRATED REPORT 2026 180 SUSTAINABILITY REPORT SASOL AT A GLANCE DRIVING SUSTAINABLE VALUE CREATION EXECUTING STRATEGY INTRODUCTION DELIVERING BUSINESS VALUE CORPORATE GOVERNANCE SUMMARISED FINANCIAL PERFORMANCE ASSURANCE / ADMINISTRATION REMUNERATION REPORT |
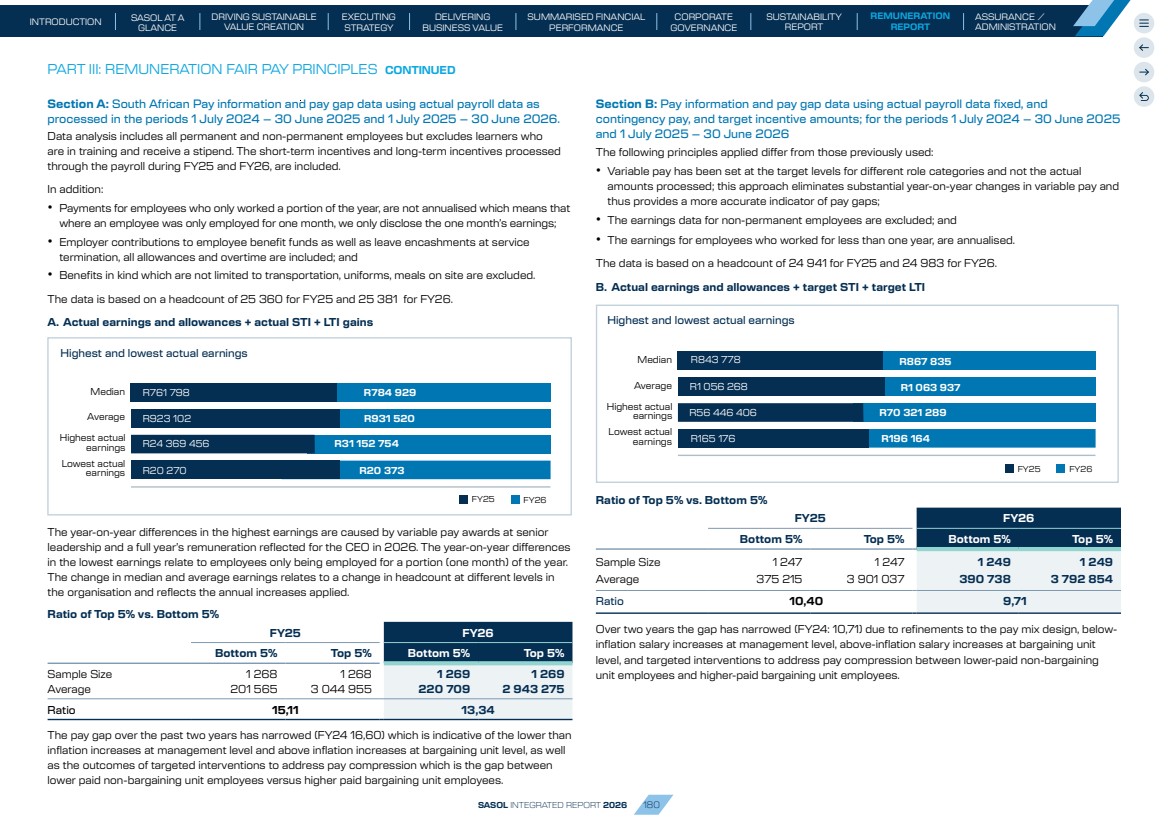
| Section C: South Africa Gender Pay information and pay gap data for the periods 1 July 2024 – 30 June 2025 and 1 July 2025 – 30 June 2026 respectively Understanding gender pay gap PART III: REMUNERATION FAIR PAY PRINCIPLES CONTINUED 27% Female 73% Male FY26 gender split The gender pay gap compares the average remuneration of male and female employees across the organisation. Gender pay gap metrics are influenced by the representation of men and women across different organisational levels and occupations. Gender representation Our gender representation remained broadly stable over the reporting period. Although the workforce continues to be predominantly male, the data indicates a gradual improvement in female representation over a three-year period, as a result of targeted and deliberate initiatives to increase female representation. Representation across the pay quartiles Pay quartile disclosures show the proportion of male and female employees within each quartile of the organisation's pay structure, from the lowest to the highest paid employees. These disclosures illustrate workforce representation across pay levels. In FY26, females represented 27% of the overall workforce, 29,3% of employees in the lower pay quartile and 24,4% in the upper pay quartile. While females remain modestly under-represented in the highest-paid quartile, the variation across the pay quartiles is limited, indicating a relatively balanced distribution of female representation across organisational levels. Female representation is broadly consistent across the pay structure. Upper Lower Upper middle Lower middle FY26 FY25 FY24 24,40% 23,69% 24,07% 75,60% 76,31% 75,93% FY26 FY25 FY24 32,07% 30,63% 32,56% 67,93% 69,37% 67,44% FY26 FY25 FY24 22,99% 22,39% 21,63% 77,01% 77,61% 78,37% FY26 FY25 FY24 29,30% 29,57% 26,67% 70,70% 70,43% 73,33% Female Male SASOL INTEGRATED REPORT 2026 181 SUSTAINABILITY REPORT SASOL AT A GLANCE DRIVING SUSTAINABLE VALUE CREATION EXECUTING STRATEGY INTRODUCTION DELIVERING BUSINESS VALUE CORPORATE GOVERNANCE SUMMARISED FINANCIAL PERFORMANCE ASSURANCE / ADMINISTRATION REMUNERATION REPORT |
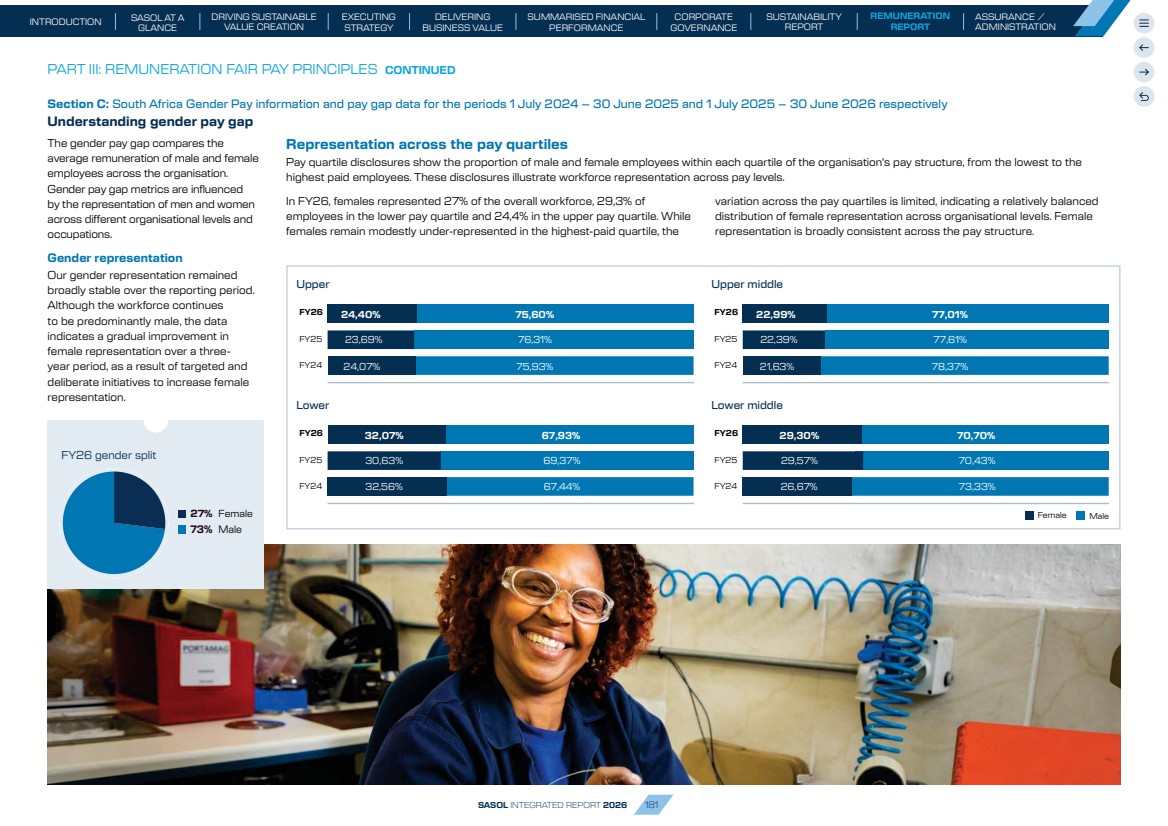
| PART III: REMUNERATION FAIR PAY PRINCIPLES CONTINUED Average and median remuneration The average and median remuneration disclosures compare the remuneration of male and female employees across the organisation. Remuneration is the same definition as used for the pay gap ‘actual’ remuneration calculation which includes actual remuneration earned during the period, inclusive of benefits, allowances, overtime and incentives calculated on the “target” as stated in the policy and not the actual incentives earned for the period. Average and median remuneration for both male and female employees increased over the reporting period in line with annual remuneration adjustments. Differences between the average and median remuneration of male and female employees reflect the overall composition of the workforce across roles and organisational levels. Average Median FY26 FY25 FY24 1 035 129 1 011 291 978 120 1 074 696 1 072 469 1 017 493 FY26 FY25 FY24 779 135 756 324 720 771 901 606 877 719 833 594 Female Male Taken together, the gender representation, pay quartile and remuneration data indicate that female representation has improved over the reporting period and remains relatively consistent across the organisation's pay structure. While differences remain in average and median remuneration, these measures should be considered in the context of workforce composition and the distribution of employees across organisational levels. We continue to monitor these indicators as part of our broader remuneration governance and talent management framework. SASOL INTEGRATED REPORT 2026 182 SUSTAINABILITY REPORT SASOL AT A GLANCE DRIVING SUSTAINABLE VALUE CREATION EXECUTING STRATEGY INTRODUCTION DELIVERING BUSINESS VALUE CORPORATE GOVERNANCE SUMMARISED FINANCIAL PERFORMANCE ASSURANCE / ADMINISTRATION REMUNERATION REPORT |
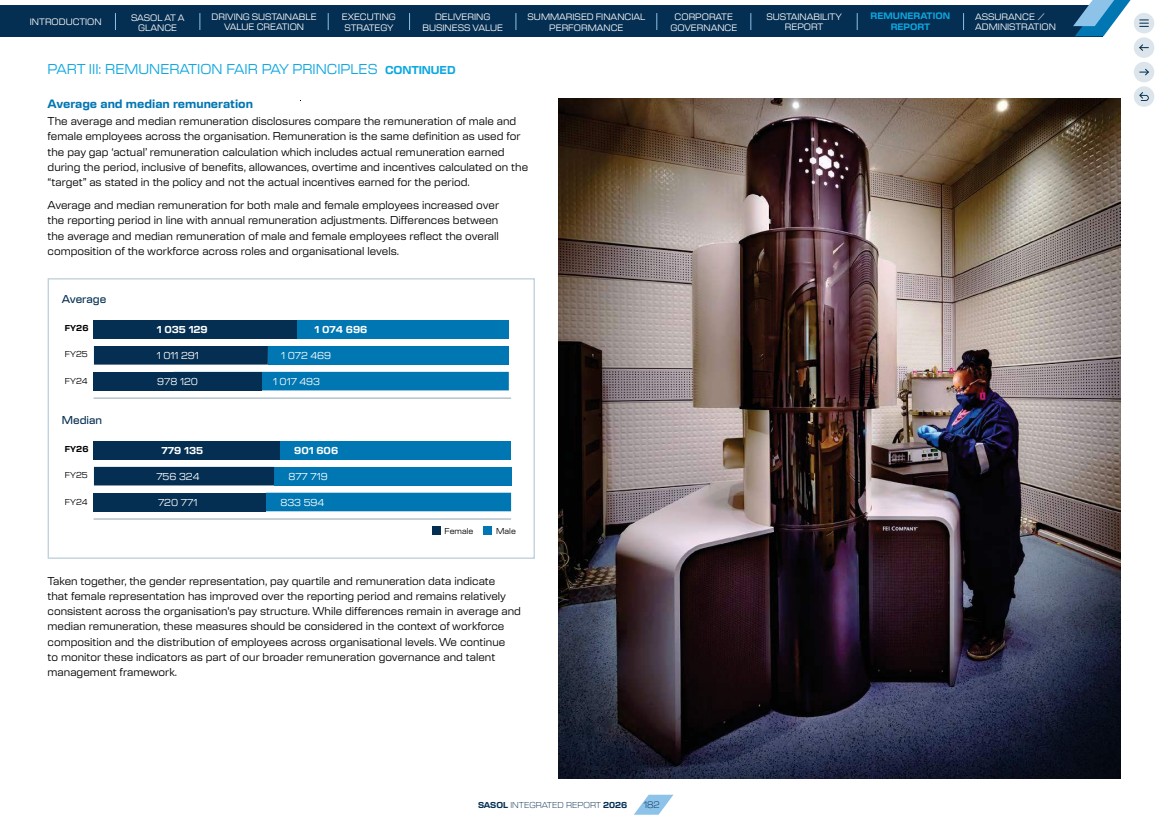
| PART III: LOOKING FORWARD – FY27 August Committee Decisions At the 27 August 2026 Committee meeting the following items were approved with respect to FY27, in line with the policy outlined in this report. Long-term Incentive KPIs The FY27 Long-term Incentive (LTI) KPI framework was reviewed to ensure continued alignment with 2025 Capital Markets Day commitments and long-term value creation objectives. The Committee concluded that the FY26 measures remain appropriate and therefore retained a largely unchanged KPI framework for FY27. KPI – Key Performance Indicator FY27 Weighting (FY27) Unit of measure ESG (25%)Scope 1 and 2 GHG Intensity at Secunda Operations 25% Improve on Scope 1 and 2 GHG intensity for Secunda Operations Group Financials (75%) Southern Africa breakeven oil price 20% FY29 SA breakeven oil price International Chemicals EBITDA margin % 10% FY29 Adjusted EBITDA margin % for International Chemicals Net debt (US$)1 15% FY29 Net debt Relative TSR measured against the peer group 30% 60th percentile of the FY27 peer group 1 Excluding leases, before second-order capital expenditure and dividends Annual salary review The cost of non-bargaining unit annual salary increases, including market adjustments where applicable effective 1 October 2026: SA: 4,00%, US: 2,50%, Germany: 1,90%, Italy: 1,90%, Mozambique: 4,50%. FY27 Incentive KPIs Short-term Incentive KPIs We have retained most of the Incentive Plan KPIs included in the FY26 STI scorecard in order to support the delivery of the Group’s strategic priorities for FY27. KPI – Key Performance Indicator FY27 Weighting (FY27) Unit of measure ESG (People) (20%)Occupational Safety1 10% # Hospitalisations Process Safety 10% # FERs ESG (Climate) (5%) Energy Efficiency 5% Energy Efficiency improvement % Group Financials (75%) Gross Margin2 15% Normalised Gross Margin Cash Fixed Cost Optimisation2 15% Normalised absolute CFC before short term incentives Production Volumes 10% Secunda Operations Production Volumes Free cash flow generation2 35% Free cash flow (before second-order capital expenditure and dividends paid) to Turnover ratio 1 To be moderated for injury severity using the ISS methodology. 2 Normalised for macroeconomic conditions and other factors outside of management’s control, as approved by the Committee SASOL INTEGRATED REPORT 2026 183 SUSTAINABILITY REPORT SASOL AT A GLANCE DRIVING SUSTAINABLE VALUE CREATION EXECUTING STRATEGY INTRODUCTION DELIVERING BUSINESS VALUE CORPORATE GOVERNANCE SUMMARISED FINANCIAL PERFORMANCE ASSURANCE / ADMINISTRATION REMUNERATION REPORT |
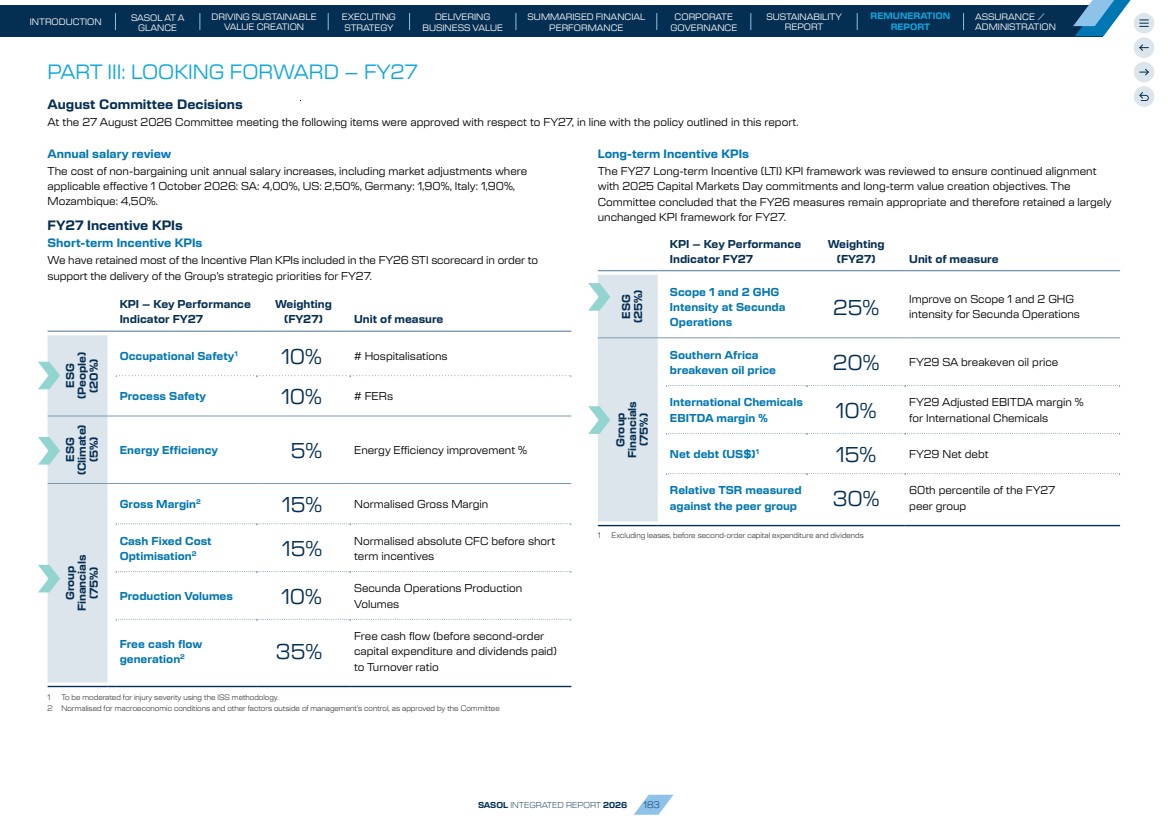
| DATA AND ASSURANCE / ADMINISTRATION Trusted data underpins credible reporting. By strengthening data assurance and maintaining well-governed collection methodologies, we unlock the value of data to support transparent, reliable and decision-useful disclosure Assurance indicators 185 Independent Auditor’s Assurance Report on selected key performance indicators 186 Contact details 188 Forward-looking statements 188 Glossary and abbreviations 189 SASOL INTEGRATED REPORT 2026 184 SUSTAINABILITY REPORT SASOL AT A GLANCE DRIVING SUSTAINABLE VALUE CREATION EXECUTING STRATEGY INTRODUCTION DELIVERING BUSINESS VALUE CORPORATE GOVERNANCE SUMMARISED FINANCIAL PERFORMANCE ASSURANCE/ ADMINISTRATION REMUNERATION REPORT |