INCOME STATEMENT
for the year ended 30 June
2026 | 2025 | 2024 | ||||||||
| Note | | Rm | | Rm | | Rm |
| ||
Turnover |
| 2 |
| |
| |
| | ||
Materials, energy and consumables used |
| 3 |
| ( |
| ( |
| ( | ||
Selling and distribution costs |
| |
| ( |
| ( |
| ( | ||
Maintenance expenditure |
| |
| ( |
| ( |
| ( | ||
Employee-related expenditure |
| 4 |
| ( |
| ( |
| ( | ||
Depreciation and amortisation |
| |
| ( |
| ( |
| ( | ||
Other expenses and income |
| 5 |
| ( |
| ( |
| ( | ||
Equity accounted profits, net of tax |
| |
| |
| | ||||
Operating profit before remeasurement items |
| |
| |
| |
| | ||
Remeasurement items affecting operating profit |
| 8 |
| ( |
| ( |
| ( | ||
Earnings/(loss) before interest and tax (EBIT/(LBIT)) |
|
| |
| |
| ( | |||
Finance income |
| 6 |
| |
| |
| | ||
Finance costs |
| 6 |
| ( |
| ( |
| ( | ||
Earnings/(loss) before tax |
| |
| |
| |
| ( | ||
Taxation |
| 9 |
| ( |
| ( |
| ( | ||
Earnings/(loss) for the year |
| |
| |
| |
| ( | ||
Attributable to |
| |
|
|
| |||||
Owners of Sasol Limited |
|
| |
| |
| ( | |||
Non-controlling interests in subsidiaries |
| |
| |
| |
| | ||
| |
| |
| ( | |||||
| Rand |
| Rand |
| Rand | |||||
Per share information |
| |
| |
| |
| | ||
Basic earnings/(loss) per share |
| 7 |
| |
| |
| ( | ||
Diluted earnings/(loss) per share |
| 7 |
| |
| |
| ( | ||
The notes on pages 7 to 124 are an integral part of these Consolidated Financial Statements.
Sasol Annual Financial Statements 2026 2
STATEMENT OF COMPREHENSIVE INCOME
for the year ended 30 June
| | 2026 | | 2025 | | 2024 | ||||
Rm | Rm | Rm |
| |||||||
Earnings/(loss) for the year |
| |
| |
| ( | ||||
Other comprehensive (loss)/income, net of tax |
|
|
| |||||||
Items that can be subsequently reclassified to the income statement |
| ( |
| |
| ( | ||||
Effect of translation of foreign operations |
| ( |
| |
| ( | ||||
Share of other comprehensive income in equity accounted investments |
| ( |
| |
| | ||||
Foreign currency translation reserve on disposal of business reclassified to the income statement |
| — |
| — |
| ( | ||||
Items that cannot be subsequently reclassified to the income statement |
| |
| |
| | ||||
Remeasurement of post-retirement benefit obligation |
| |
| |
| | ||||
Fair value of investments through other comprehensive income |
| |
| ( |
| ( | ||||
Tax on items that cannot be subsequently reclassified to the income statement |
| ( |
| ( |
| ( | ||||
Total comprehensive income/(loss) for the year |
| |
| |
| ( | ||||
Attributable to |
|
|
| |||||||
Owners of Sasol Limited |
| |
| |
| ( | ||||
Non-controlling interests in subsidiaries |
| |
| |
| | ||||
| |
| |
| ( | |||||
The notes on pages 7 to 124 are an integral part of these Consolidated Financial Statements.
Sasol Annual Financial Statements 2026 3
STATEMENT OF FINANCIAL POSITION
at 30 June
| | | ||||
2026 | 2025 | |||||
Note | Rm | Rm | ||||
Assets |
| |
| |
| |
Property, plant and equipment |
| 16 |
| |
| |
Right of use assets |
| 14 |
| |
| |
Goodwill and other intangible assets |
| |
| |
| |
Equity accounted investments |
| 18 |
| |
| |
Other long-term investments |
| |
| |
| |
Post-retirement benefit assets |
| 31 |
| |
| |
Long-term receivables and prepaid expenses |
| 17 |
| |
| |
Long-term financial assets |
| 35 |
| |
| |
Deferred tax assets |
| 11 |
| |
| |
Non-current assets |
|
| |
| | |
Inventories |
| 21 |
| |
| |
Tax receivable |
| 10 |
| |
| |
Trade and other receivables |
| 22 |
| |
| |
Short-term financial assets |
|
| |
| | |
Cash and cash equivalents |
| 25 |
| |
| |
Current assets |
|
| |
| | |
Assets in disposal groups held for sale |
|
| |
| | |
Total assets |
|
| |
| | |
Equity and liabilities |
|
|
| |||
Shareholders’ equity |
|
| |
| | |
Non-controlling interests |
|
| |
| | |
Total equity |
|
| |
| | |
Long-term debt |
| 13 |
| |
| |
Lease liabilities |
| 14 |
| |
| |
Long-term provisions |
| 29 |
| |
| |
Post-retirement benefit obligations |
| 31 |
| |
| |
Long-term deferred income |
|
| |
| | |
Deferred tax liabilities |
| 11 |
| |
| |
Non-current liabilities |
|
| |
| | |
Short-term debt |
| 15 |
| |
| |
Short-term provisions |
| 30 |
| |
| |
Tax payable |
| 10 |
| |
| |
Trade and other payables |
| 23 |
| |
| |
Short-term deferred income |
|
| |
| | |
Short-term financial liabilities |
| 35 |
| |
| |
Bank overdraft |
| 25 |
| |
| |
Current liabilities |
| |
| |
| |
Total equity and liabilities |
| |
| |
| |
The notes on pages 7 to 124 are an integral part of these Consolidated Financial Statements.
Sasol Annual Financial Statements 2026 4
STATEMENT OF CHANGES IN EQUITY
for the year ended 30 June
Share- | Foreign | Remeasurement | ||||||||||||||||||
Share | based | currency | on post- | Non- | ||||||||||||||||
capital | payment | translation | Other | retirement | Retained | Shareholders’ | controlling | Total | ||||||||||||
Note 12 | reserve | reserve | reserves* | benefits | earnings | equity | interests | equity | ||||||||||||
Rm | Rm | Rm | Rm | Rm | Rm | Rm | Rm | Rm | ||||||||||||
Balance at 30 June 2023 | |
| |
| |
| |
| |
| |
| |
| |
| | |||
Other movements | — | | ( | ( | — | | ( | | | |||||||||||
Movement in share-based payment reserve | — |
| |
| — |
| — |
| — |
| — |
| |
| — |
| | |||
Share-based payment expense (refer note 32) | — |
| |
| — |
| — |
| — |
| — |
| |
| — |
| | |||
Deferred tax | — |
| ( |
| — |
| — |
| — |
| — |
| ( |
| — |
| ( | |||
Long-term incentives vested and settled | — |
| ( |
| — |
| — |
| — |
| |
| — |
| — |
| — | |||
Total comprehensive (loss)/ income for the year | — |
| — |
| ( |
| |
| |
| ( |
| ( |
| |
| ( | |||
(loss)/profit | — |
| — |
| — |
| — |
| — |
| ( |
| ( |
| |
| ( | |||
other comprehensive (loss)/income for the year | — |
| — |
| ( |
| |
| |
| — |
| ( |
| ( |
| ( | |||
Dividends paid (refer note 28) | — |
| — |
| — |
| — |
| — |
| ( |
| ( |
| ( |
| ( | |||
Balance at 30 June 2024 | |
| |
| |
| |
| |
| |
| |
| |
| | |||
Other movements | — | — | — | — | — | ( | ( | — | ( | |||||||||||
Movement in share-based payment reserve | — |
| |
| — |
| — |
| — |
| — |
| |
| — |
| | |||
Share-based payment expense (refer note 32) | — |
| |
| — |
| — |
| — |
| — |
| |
| — |
| | |||
Deferred tax | — |
| ( |
| — |
| — |
| — |
| — |
| ( |
| — |
| ( | |||
Long-term incentives vested and settled | — |
| ( |
| — |
| — |
| — |
| |
| — |
| — |
| — | |||
Total comprehensive income for the year | — |
| — |
| |
| |
| |
| |
| |
| |
| | |||
profit | — |
| — |
| — |
| — |
| — |
| |
| |
| |
| | |||
other comprehensive income for the year | — |
| — |
| |
| |
| |
| — |
| |
| |
| | |||
Dividends paid (refer note 28) | — |
| — |
| — |
| — |
| — |
| ( |
| ( |
| ( |
| ( | |||
Balance at 30 June 2025 | |
| |
| |
| |
| |
| |
| |
| |
| | |||
Movement in share-based payment reserve | — |
| |
| — |
| — |
| — |
| — |
| |
| — |
| | |||
Share-based payment expense (refer note 32) | — |
| |
| — |
| — |
| — |
| — |
| |
| — |
| | |||
Deferred tax | — |
| |
| — |
| — |
| — |
| — |
| |
| — |
| | |||
Long-term incentives vested and settled | — | ( | — | — | — | | — | — | — | |||||||||||
Transfer to cash-settled liability¹ | — | ( | — | — | — | — | ( | — | ( | |||||||||||
Transfer of gain realised on payment of cash-settled liability¹ | — |
| ( |
| — |
| — |
| — |
| |
| — |
| — |
| — | |||
Total comprehensive (loss)/income for the year | — | — | ( | ( | | | | | | |||||||||||
profit | — | — | — | — | — | | | | | |||||||||||
other comprehensive (loss)/income for the year | — |
| — |
| ( |
| ( |
| |
| — |
| ( |
| ( |
| ( | |||
Dividends paid (refer note 28) | — |
| — |
| — |
| — |
| — |
| — |
| — |
| ( |
| ( | |||
Balance at 30 June 2026 | |
| |
| |
| ( |
| |
| |
| |
| |
| | |||
*
1 |
The notes on pages 7 to 124 are an integral part of these Consolidated Financial Statements.
Sasol Annual Financial Statements 2026 5
STATEMENT OF CASH FLOWS
for the year ended 30 June
| | | 2026 | | 2025 | | 2024 |
| ||
| Note | | Rm | | Rm | | Rm |
| ||
Cash receipts from customers |
| |
| |
| |
| | ||
Cash paid to suppliers and employees1 |
| |
| ( |
| ( |
| ( | ||
Cash generated by operating activities |
| 26 |
| |
| |
| | ||
Dividends received from equity accounted investments |
|
| |
| |
| | |||
Finance income received |
| 6 |
| |
| |
| | ||
Finance costs paid2 |
| 6 |
| ( |
| ( |
| ( | ||
Tax paid |
| 10 |
| ( |
| ( |
| ( | ||
Cash available from operating activities |
| |
| |
| |
| | ||
Dividends paid3 |
| 28 |
| — |
| ( |
| ( | ||
Dividends paid to non-controlling shareholders in subsidiaries |
| |
| ( |
| ( |
| ( | ||
Cash retained from operating activities |
| |
| |
| |
| | ||
Additions to non-current assets |
| |
| ( |
| ( |
| ( | ||
additions to property, plant and equipment |
| 16 |
| ( |
| ( |
| ( | ||
additions to other intangible assets |
| |
| ( |
| ( |
| ( | ||
decrease in capital project related payables |
| |
| ( |
| ( |
| ( | ||
Cash contribution to equity accounted investments |
| |
| ( |
| ( |
| ( | ||
Proceeds on disposals of equity accounted investments⁴ | | — | — | |||||||
Proceeds on disposals and scrappings |
|
| |
| |
| | |||
Proceeds from assets held for sale | | | | |||||||
Purchase of investments |
|
| ( |
| ( |
| ( | |||
Proceeds from sale of investments |
| |
| |
| |
| | ||
Long-term receivables repaid | | | | |||||||
Long-term receivables granted |
| |
| ( |
| ( |
| ( | ||
Increase in long-term restricted cash |
| |
| ( |
| ( |
| ( | ||
Cash used in investing activities |
| |
| ( |
| ( |
| ( | ||
Proceeds from long-term debt |
| 13 |
| |
| |
| | ||
Repayment of long-term debt |
| 13 |
| ( |
| ( |
| ( | ||
Payment of lease liabilities |
| 14 |
| ( |
| ( |
| ( | ||
Proceeds from short-term debt |
|
| |
| |
| | |||
Repayment of short-term debt |
|
| ( |
| ( |
| ( | |||
Cash used in financing activities |
| |
| ( |
| ( |
| ( | ||
Translation effects on cash and cash equivalents |
| |
| ( |
| ( |
| ( | ||
Increase/(decrease) in cash and cash equivalents |
| |
| |
| ( |
| ( | ||
Cash and cash equivalents at the beginning of year |
| |
| |
| |
| | ||
Cash and cash equivalents at the end of the year |
| 25 |
| |
| |
| | ||
| 1 |
| 2 |
| 3 |
| 4 |
The notes on pages 7 to 124 are an integral part of these Consolidated Financial Statements.
Sasol Annual Financial Statements 2026 6
Sasol Annual Financial Statements 2026 7
57 | ||
57 | ||
60 | ||
61 | ||
66 | ||
68 | ||
70 | ||
70 | ||
71 | ||
72 | ||
72 | ||
73 | ||
73 | ||
73 | ||
74 | ||
74 |
76 | ||
76 | ||
79 | ||
80 | ||
90 | ||
90 |
96 | ||
98 | ||
107 | ||
124 |
Sasol Annual Financial Statements 2026 8
SEGMENT INFORMATION
| Southern Africa | International | | | | | | | ||||||||||
Energy and Chemicals | Chemicals | Business | Consolidation | |||||||||||||||
Mining | Gas | Fuels | Chemicals Africa | America | Eurasia | support | Adjustments | Total | ||||||||||
Rm | | Rm | | Rm | | Rm | | Rm | | Rm | | Rm | | Rm | | Rm | ||
2026 |
| |
| |
| |
| |
| |
| |
| |
| |
| |
Income statement |
| |
| |
| |
| |
| |
| |
| |
| |
| |
External turnover1 |
| |
| |
| |
| |
| |
| |
| — |
| — | | |
Segment turnover |
| |
| |
| |
| |
| |
| |
| — |
| ( |
| |
Intersegmental turnover |
| ( |
| ( |
| ( |
| ( |
| ( |
| ( |
| — |
| |
| — |
Materials, energy and consumables used2 |
| ( |
| ( |
| ( |
| ( |
| ( |
| ( |
| ( |
| |
| ( |
Selling and distribution costs |
| — |
| — |
| ( |
| ( |
| ( |
| ( |
| — |
| |
| ( |
Maintenance expenditure |
| ( |
| ( |
| ( |
| ( |
| ( |
| ( |
| ( |
| |
| ( |
Employee-related expenditure |
| ( |
| ( |
| ( |
| ( |
| ( |
| ( |
| ( |
| |
| ( |
Depreciation and amortisation |
| ( |
| ( |
| ( |
| ( |
| ( |
| ( |
| ( |
| — |
| ( |
Other expenses and income |
| ( |
| ( |
| ( |
| ( |
| ( |
| ( |
| |
| ( |
| ( |
Equity accounted profits/(losses), net of tax |
| |
| |
| ( |
| |
| — |
| — |
| ( |
| — |
| |
Remeasurement items affecting operating profit (refer note 8) |
| ( |
| ( |
| ( |
| ( |
| |
| ( |
| |
| — |
| ( |
Earnings/(loss) before interest and tax (EBIT/(LBIT)) |
| |
| |
| |
| ( |
| |
| |
| ( |
| — |
| |
Statement of Financial Position |
| |||||||||||||||||
Additions to non-current assets3 |
| |
| |
| |
| |
| |
| |
| |
| — |
| |
1 | Mining’s external turnover is net of royalties paid on both external and intersegmental sales. |
2 | An amount of R |
The current year consists of Mining (R
3Excludes capital project related payables, equity accounted investments and deferred tax assets.
Sasol Annual Financial Statements 2026 9
| Southern Africa | International | | | | | | | ||||||||||
Energy and Chemicals | Chemicals | Business | Consolidation | |||||||||||||||
Mining | Gas | Fuels | Chemicals Africa | America | Eurasia | support | Adjustments | Total | ||||||||||
Rm | | Rm | | Rm | | Rm | | Rm | | Rm | | Rm | | Rm | | Rm | ||
2025 |
| |
| |
| |
| |
| |
| |
| |
| |
| |
Income statement |
| |
| |
| |
| |
| |
| |
| |
| |
| |
External turnover | |
| |
| |
| |
| |
| |
| — |
| — |
| | |
Segment turnover | |
| |
| |
| |
| |
| |
| — |
| ( |
| | |
Intersegmental turnover | ( |
| ( |
| ( |
| ( |
| ( |
| ( |
| — |
| |
| — | |
Materials, energy and consumables used¹ | ( |
| ( |
| ( |
| ( |
| ( |
| ( |
| ( |
| |
| ( | |
Selling and distribution costs | — |
| — |
| ( |
| ( |
| ( |
| ( |
| – |
| |
| ( | |
Maintenance expenditure | ( |
| ( |
| ( |
| ( |
| ( |
| ( |
| ( |
| |
| ( | |
Employee-related expenditure | ( |
| ( |
| ( |
| ( |
| ( |
| ( |
| ( |
| |
| ( | |
Depreciation and amortisation | ( |
| ( |
| ( |
| ( |
| ( |
| ( |
| ( |
| — |
| ( | |
Other expenses and income | ( |
| ( |
| ( |
| ( |
| ( |
| ( |
| |
| ( |
| ( | |
Equity accounted (losses)/profits, net of tax | |
| |
| |
| |
| — |
| — |
| ( |
| — |
| | |
Remeasurement items affecting operating profit (refer note 8) | ( |
| ( |
| ( |
| ( |
| ( |
| ( |
| |
| — |
| ( | |
Earnings/(loss) before interest and tax (EBIT/(LBIT)) | |
| |
| |
| |
| |
| ( |
| |
| — |
| | |
Statement of Financial Position | ||||||||||||||||||
Additions to non-current assets² | |
| |
| |
| |
| |
| |
| |
| — |
| | |
1 | An amount of R |
The current year consists of Mining (R
2Excludes capital project related payables and equity accounted investments.
Sasol Annual Financial Statements 2026 10
Southern Africa | International |
|
| |||||||||||||||
Energy and Chemicals | Chemicals |
| Business |
| Consolidation | |||||||||||||
Mining | Gas | Fuels | Chemicals Africa | America | Eurasia | support |
| Adjustments | Total | |||||||||
Rm |
| Rm |
| Rm | Rm |
| Rm |
| Rm |
| Rm |
| Rm |
| Rm | |||
2024 | ||||||||||||||||||
Income statement | |
| |
| | |
| |
| |
| |
| |
| | ||
External turnover | |
| |
| |
| |
| |
| |
| — |
| — |
| | |
Segment turnover | |
| |
| |
| |
| |
| |
| — |
| ( |
| ||
Intersegmental turnover | ( |
| ( |
| ( |
| ( |
| ( |
| ( |
| — |
| |
| — | |
Materials, energy and consumables used¹ | ( |
| ( |
| ( |
| ( |
| ( |
| ( |
| ( |
| |
| ( | |
Selling and distribution costs | — |
| — |
| ( |
| ( |
| ( |
| ( |
| — |
| |
| ( | |
Maintenance expenditure | ( |
| ( |
| ( |
| ( |
| ( |
| ( |
| ( |
| |
| ( | |
Employee-related expenditure | ( |
| ( |
| ( |
| ( |
| ( |
| ( |
| ( |
| |
| ( | |
Depreciation and amortisation | ( |
| ( |
| ( |
| ( |
| ( |
| ( |
| ( |
| — |
| ( | |
Other expenses and income | ( |
| ( |
| ( |
| ( |
| ( |
| ( |
| |
| ( |
| ( | |
Equity accounted profits, net of tax | ( |
| |
| |
| |
| — |
| — |
| ( |
| — |
| | |
Remeasurement items affecting operating profit (refer note 8) | |
| |
| ( |
| ( |
| ( |
| ( |
| |
| — |
| ( | |
Earnings/(loss) before interest and tax (EBIT/(LBIT)) | |
| |
| |
| |
| ( |
| ( |
| |
| — |
| ( | |
Statement of Financial Position | ||||||||||||||||||
Additions to non-current assets² | |
| |
| |
| |
| |
| |
| |
| — |
| | |
1 | An amount of R |
The current year consists of Mining (R
2 | Excludes capital project related payables and equity accounted investments. |
Sasol Annual Financial Statements 2026 11
GEOGRAPHIC REGION INFORMATION
| South | | | | | | ||||||
Africa | Mozambique | United States | Europe | Rest of World | Total | |||||||
Rm | Rm | Rm | Rm | Rm | Rm | |||||||
2026 |
| |
| |
| |
| |
| |
| |
External turnover¹ |
| |
| |
| |
| |
| |
| |
Earnings/(loss) before interest and tax (EBIT/(LBIT))² |
| |
| ( |
| |
| |
| ( |
| |
Tax paid |
| |
| |
| |
| |
| |
| |
Non-current assets³ |
| |
| |
| |
| |
| |
| |
2025 |
| |
| |
| |
| |
| |
| |
External turnover¹ |
| |
| |
| |
| |
| |
| |
Earnings/(loss) before interest and tax (EBIT/(LBIT))² |
| |
| ( |
| |
| ( |
| |
| |
Tax paid |
| |
| |
| |
| |
| |
| |
Non-current assets³ |
| |
| |
| |
| |
| |
| |
2024 |
| |
| |
| |
| |
| |
| |
External turnover¹ |
| |
| |
| |
| |
| |
| |
(Loss)/earnings before interest and tax ((LBIT)/EBIT)² |
| |
| |
| ( |
| ( |
| |
| ( |
Tax paid |
| |
| |
| |
| |
| |
| |
Non-current assets³ |
| |
| |
| |
| |
| |
| |
1 | The analysis of turnover is based on the location of the customer. |
2 | Includes equity accounted profits and remeasurement items. |
3 | Excludes deferred tax assets, post-retirement benefit assets and other items not separately disclosed. |
Sasol Annual Financial Statements 2026 12
REPORTING SEGMENTS
The Group’s operating model comprises of

Southern Africa business
The Southern Africa business operates integrated value chains with feedstock sourced from the Mining and Gas operating segments and processed at our operations in Secunda, Sasolburg and National Petroleum Refiners of South Africa (Pty) Ltd (Natref). There are also associated assets outside South Africa which include the Pande-Temane Petroleum Production Agreement and the Production Sharing Agreement in Mozambique and ORYX GTL (gas to liquids) in Qatar.
MINING
Mining is responsible for securing coal feedstock for the Southern African value chain, mainly for gasification, but also to generate electricity and steam. Coal is sold for gasification and utilities generation to Secunda Operations (SO) and for utilities generation to Sasolburg Operations. Coal is supplied to SO and to Sasolburg Operations based on long-term supply contracts. Following the repurposing of the existing export beneficiation plant as a destoning solution, Sasol Mining ceased export production on 30 June 2025 and concluded its final export sales in quarter 1 of 2026. Accordingly, coal sales are now exclusively directed to the Southern African value chain.
The date of delivery related to Mining is determined in accordance with the contractual agreements entered into with customers. These are summarised as follows:
Delivery terms | | Control passes to the customer |
On delivery | At the point in time when the coal is delivered to the customer. |
GAS
The Gas segment reflects the upstream feedstock, transport of gas through the Republic of Mozambique Pipeline Investments Company (ROMPCO) pipeline, and external natural methane rich gas (MRG) and liquefied petroleum gas (LPG) sales.
Sasol Annual Financial Statements 2026 13
Mozambican gas is sold under long-term contracts to the Sasol operations and to external customers. Condensate is sold on short-term contracts. In South Africa, gas is sold under long-term contracts at a price determinable from the supply agreements in accordance with the pricing methodology used by the National Energy Regulator of South Africa (NERSA). Analysis of gas and tests of the specifications and content are performed prior to delivery. Turnover from all gas sales is recognised on delivery.
Delivery terms | | Control passes to the customer |
On-delivery | At the point in time when the: | |
· Gas reaches the inlet coupling of the customer’s pipeline. | ||
· Condensate is loaded onto the customer’s truck. | ||
These are the points when the customer controls the gas, condensate or oil, or directs the use of it. The customer is responsible for transportation and handling costs in terms of gas, condensate and oil. |
FUELS
The Fuels segment comprises the sales and marketing of liquid fuels produced in South Africa. Sasol supplies a significant portion of South Africa’s domestic fuel needs through retail and wholesale channels. Liquid fuels are blended from fuel components produced by SO, crude oil refined at Natref, as well as some products purchased from other oil companies including fuel imports. Liquid fuel products are sold under both short- and long-term agreements for retail sales and commercial sales, including sales to other oil companies.
Liquid fuel prices are mainly driven by the Basic Fuel Price (BFP). Sales through wholesale is at BFP plus costs such as transportation and storage. For commercial sales and sales to other oil companies, the prices are fixed and determinable according to the specific contract, with periodic price adjustments.
Turnover is recognised as follows:
Delivery terms | | Control passes to the customer: |
On-delivery/Ex-gate | At the point in time when the fuel is delivered onto the rail tank car, road tank truck or into the customer pipeline. | |
In-tank | At the point in time when the buyer obtains legal title, physical access or the ability to direct the use of the product and assumes responsibility for any financial losses and is entitled to any profits from the sale. | |
Free Carrier | At the point in time when the goods are unloaded to the port of shipment; Sasol is not responsible for the freight and insurance. | |
Carriage Paid To | Products: At the point in time when the product is delivered to a specified location or main carrier. Freight: Over the period of transporting the goods to the customer’s nominated place – where the seller is responsible for freight costs, which are included in the contract. | |
Consignment Sales | As and when products are consumed by the customer. |
The Fuels segment includes Sasol’s ORYX GTL operations in Qatar, a joint venture with Qatar Petroleum.
Chemicals Africa and International Chemicals business
The Chemicals Business has a strong diversified, global presence which has been organised into
Sasol Annual Financial Statements 2026 14
The Chemicals businesses sell the majority of their products under contracts at prices determinable from such agreements. Turnover is recognised in accordance with the related contract terms, at the point at which control transfers to the customer and prices are determinable and collectability is probable.
The point of delivery is determined in accordance with the contractual agreements entered into with customers which are as follows:
Delivery terms | | Control passes to the customer: |
Ex-tank sales | At the point in time when products are loaded into the customer’s vehicle or unloaded from the seller’s storage tanks. | |
Ex-works | At the point in time when products are loaded into the customer’s vehicle or unloaded at the seller’s premises. | |
Carriage Paid To (CPT); Cost Insurance Freight (CIF); Carriage and Insurance Paid (CIP); and Cost Freight Railage (CFR) | Products – CPT: At the point in time when the product is delivered to a specified location or main carrier. | |
Products – CIF, CIP and CFR: At the point in time when the products are loaded into the transport vehicle. | ||
Free on Board | At the point in time when products are loaded into the transport vehicle; the customer is responsible for shipping and handling costs. | |
Delivered at Place | At the point in time when products are delivered to and signed for by the customer. | |
Consignment Sales | As and when products are consumed by the customer. |
Business Support
Business Support consists of support to the Southern Africa and International Chemicals Businesses, as well as the Corporate Office including treasury companies.
Sasol Annual Financial Statements 2026 15
1 | Statement of compliance |
The consolidated annual financial statements for the year ended 30 June 2026 have been prepared in accordance with IFRS® Accounting Standards, the Financial Pronouncements as issued by the Financial Reporting Standards Council and SAICA Financial Reporting Guides as issued by the Accounting Practices Committee, the JSE Listings Requirements and the South African Companies Act. The consolidated financial statements were approved for issue by the Board on 1 September 2026 and will be presented to shareholders at the Company’s annual general meeting on 13 November 2026.
Basis of preparation of financial results
The consolidated financial statements are prepared using the historic cost convention except that, certain items, including derivative instruments, plan assets for defined benefit pension plans, financial assets at fair value through profit or loss and financial assets designated at fair value through other comprehensive income, are stated at fair value. The consolidated financial statements are presented in South African rand, which is Sasol Limited’s presentation currency, rounded to the nearest million, unless indicated otherwise.
Going concern
The consolidated financial statements are prepared on the going concern basis. Based on forecasts and available cash resources, the Group and Company have adequate resources to continue normal operations into the foreseeable future.
Climate change
Climate considerations are central to our strategy, guiding decisions and value creation. We are committed to our 2030 greenhouse gas (GHG) reduction target and are progressing the optimisation of our energy and feedstock mix to lower carbon intensity. Aligned with our ’Grow and Transform‘ strategic pillar, we are focused on developing lower carbon intensity revenue streams that deliver strong, sustainable cash flows and competitive returns. Our long-term ambition is clear: to achieve net zero emissions, while creating value for our stakeholders and supporting South Africa’s energy transition in a manner that delivers accretive shared value.
As part of our commitment to climate action and the transition to a lower-carbon economy, Sasol has set short-term GHG emission reduction targets that are aligned with our long-term decarbonisation pathway. We aim to reduce Scope 1 and 2 emissions by
Where reasonable and supportable, management has considered the impact of these 2030 targets on a number of key estimates within the financial statements including the estimates of future cash flows used in impairment assessments of non-current assets (refer to note 8), useful lives of property, plant and equipment (refer to note 16), purchase and capital commitments (refer to note 3 and 16), the estimates of future profitability used in our assessment of the recoverability of deferred tax assets (refer to note 11) and the timing and amount of environmental obligations (refer to note 29), and the determination of targets for the Group’s long-term incentive plan (refer note 32).
Sasol Annual Financial Statements 2026 16
1 | Statement of compliance continued |
IBOR reform
Nature and extent of risk arising from interest rate benchmark reform.
The Group has limited remaining exposure to financial instruments and arrangements that reference the Johannesburg Interbank Average Rate (JIBAR), which will cease on 31 December 2026 and be replaced by the South African Rand Overnight Index Average (ZARONIA). Remaining exposures primarily relate to certain debt instruments, agreements and valuations. While uncertainties remain regarding certain aspects of the market-wide transition, the Group's overall exposure to benchmark reform is not considered significant.
Progress of transition to alternate benchmark interest rates
Management continues to actively monitor developments relating to the cessation of JIBAR and the transition to ZARONIA. Key actions undertaken include:
| ● | The inclusion of transitional provisions relating to ZARONIA in relevant financing documentation. |
| ● | A legal review to identify existing agreements or arrangements containing JIBAR-linked provisions in order to replace or amend as required. |
| ● | The Group has conducted an initial assessment and confirmed limited systems dependencies relating to JIBAR. |
| ● | Ongoing monitoring of the Group's Domestic Medium Term Note (DMTN) programme listed on the JSE, with final guidance regarding benchmark transition still awaited from the South African Reserve Bank (SARB) (refer to note 13). |
| ● | Assessment of the impact of benchmark reform on the valuation of certain derivative instruments, including zero-cost collars. |
Based on work performed to date, the Group expects the transition from JIBAR to ZARONIA to be completed in accordance with applicable market practice and does not anticipate material economic impact from the transition.
Judgements and estimates relating to interest rate benchmark reform
Management has assessed that the transition from JIBAR to ZARONIA is not expected to result in significant liquidity risk, covenant breaches, operational disruption or material changes to future cash flows. This assessment reflects the Group's limited residual exposure to JIBAR, the progress made in transitioning contracts and systems, and current expectations regarding market implementation of ZARONIA. The assessment of any valuation impacts on derivative instruments remains ongoing and will be finalised as additional information becomes available.
Accounting policies
The accounting policies applied in the preparation of these consolidated financial statements are consistent with those applied in the consolidated annual financial statements for the year ended 30 June 2025.
Sasol Annual Financial Statements 2026 17
1 | Statement of compliance continued |
Accounting standards, amendments and interpretations issued which are relevant to the Group, but not yet effective
The Group continuously evaluates the impact of new accounting standards, amendments to accounting standards and interpretations. It is expected that where applicable, these standards and amendments will be adopted on each respective effective date as indicated below. The new accounting standards and amendments to accounting standards issued which are relevant to the Group, but not yet effective on 30 June 2026, include:
Amendment to IFRS 9 and IFRS 7 – ‘Classification and Measurement of Financial Instruments’
These amendments:
| ● | clarify the requirements for the timing of recognition and derecognition of some financial assets and liabilities, with a new exception for some financial liabilities settled through an electronic cash transfer system; |
| ● | clarify and add further guidance for assessing whether a financial asset meets the solely payments of principal and interest (SPPI) criterion; |
| ● | add new disclosures for certain instruments with contractual terms that can change cash flows (such as some instruments with features linked to the achievement of environment, social and governance (ESG) targets); and |
| ● | make updates to the disclosures for equity instruments designated at Fair Value through Other Comprehensive Income (FVOCI). |
The Group continues to assess the impact of these amendments which are effective for the Group’s annual reporting period beginning on 1 July 2026.
Amendments to IFRS 9 and IFRS 7 – ‘Contracts referencing nature-dependent electricity’
These amendments:
| ● | allow a company to apply the own-use exemptions to contracts referencing nature-dependent electricity if the company has, and expects to be, a net purchaser of electricity for the contract period. This amendment will apply retrospectively using facts and circumstances at the beginning of the reporting period of initial application (without requiring prior periods to be restated); |
| ● | permit hedge accounting if the contracts are used as hedging instruments. Applying hedge accounting could help companies to reduce profit or loss volatility by reflecting how these contracts hedge the price of future electricity purchases or sales. This amendment will apply prospectively to new hedging relationships designated on or after the date of initial application. It will also allow companies to discontinue an existing hedging relationship, if the same hedging instrument (i.e., nature-dependent electricity contract) is designated in a new hedging relationship applying the amendment; and |
| ● | include additional disclosures required where a company may apply the own-use exemption to certain contracts under the amendments and therefore would not recognise these contracts in its statement of financial position (only recognise if executory contract is onerous). |
The Group is assessing the impact of these amendments which are effective for the Group’s annual reporting period beginning on 1 July 2026.
Sasol Annual Financial Statements 2026 18
1 | Statement of compliance continued |
Amendments to IFRS 9 ‘Financial instruments’ – Transaction Price
This amendment removes the conflict between IFRS 9 and IFRS 15 over the amount at which the trade receivable is initially measured. Under IFRS 15, a trade receivable may be recognised at an amount that differs from the transaction price e.g., when the transaction price is variable. Conversely, IFRS 9 requires that companies initially measure trade receivables without a significant financing component at the transaction price. IFRS 9 has been amended to require companies to initially measure a trade receivable without a significant financing component at the amount determined by applying IFRS 15.
The Group is assessing the impact of these amendments which are effective for the Group’s annual reporting period beginning on 1 July 2026.
Amendments to IFRS 16 ‘Leases’ – Lessee derecognition of lease liabilities
The amendment states that when lease liabilities are derecognised under IFRS 9, the difference between the carrying amount and the consideration paid is recognised in profit or loss. However, the amendment does not address how to distinguish between derecognition and modification of a lease liability.
The Group is assessing the impact of these amendments which are effective for the Group’s annual reporting period beginning on 1 July 2026.
IFRS 18 ‘Presentation and Disclosure in Financial Statements’
This standard will replace IAS 1 Presentation of Financial Statements and applies for annual reporting periods beginning on or after 1 January 2027. The standard will be effective for the Group’s annual reporting period beginning on 1 July 2027. The Group has not early adopted the new accounting standard in preparing these financial statements; however earlier application is permitted.
IFRS 18 requires a more structured statement of profit or loss and greater disaggregation of information. The Group is in the process of assessing the estimated impact that the initial application of IFRS 18 will have on its consolidated financial statements.
The expected impacts in the period of initial application are described below. The actual impacts of adopting the accounting standard on 1 July 2027 may change because:
| ● | the Group has not finalised the assessment and implementation of changes to processes and controls; and |
| ● | the new accounting policies are subject to change until the Group presents its first consolidated financial statements that include the date of initial application. |
Sasol Annual Financial Statements 2026 19
1 | Statement of compliance continued |
Structure of the income statement
IFRS 18 requires entities to classify all income and expenses into five categories in the income statement, namely operating, investing, financing, income tax and discontinued operations. Classification of income and expenses depends on the main business activities of an entity. The Group has determined that it does not have a specified main business activity of investing in assets and/or providing financing to customers.
Neither net profit nor net assets will change as a result of the Group’s adoption of IFRS 18. However, the Group will be required to present two newly defined subtotals, which are ‘operating profit’ and ‘profit or loss before financing and income taxes’. The ‘operating profit’ subtotal differs from the current ‘operating profit before remeasurement items’ subtotal presented by the Group. Based on the information currently available, the Group expects significant changes to the current structure of the income statement to result from the following:
| ● | share of profit (loss) of equity-accounted investees is currently presented above operating profit before remeasurement items subtotal. Income and expenses from equity-accounted investments are always classified in the investing category under IFRS 18, including any remeasurement items. Accordingly, the Group’s share of profit of equity-accounted investees and any remeasurement items on equity-accounted investees will be classified and presented in the investing category. |
| ● | interest income and expenses are generally included in finance income and finance costs under the Group’s current accounting policy and are presented as separate line items above the (loss)/earnings before tax subtotal. IFRS 18 provides specific guidance on the interest income and expenses that will be classified in the investing and financing categories. |
| o | interest income on certain financial assets held by the Group (e.g., interest income on cash and cash equivalents) will be classified and presented in the investing category |
| o | interest expense on ‘financing’ and ‘other’ liabilities as defined in IFRS 18 will continue to be classified and presented in the financing category (e.g., interest expense on financial liabilities not measured at FVTPL and unwind of discount on environmental provisions) |
| ● | Net foreign exchange differences are currently included in the other expenses and income line item presented above the operating profit before remeasurement items subtotal. Under IFRS 18, foreign exchange differences are required to be presented in the same category as the income and expenses from the items that gave rise to the differences unless such classification will result in undue cost and effort in which case it will all be classified in the operating category. The Group is in the process of determining in which categories its foreign exchange differences will be classified and whether such determination can be made without undue cost and effort. For example, foreign exchange differences on trade payables will be classified in the operating category. |
Under IFRS 18, operating expenses are classified and presented by nature, function or using a mixed presentation. The Group has determined that continued classification and presentation on a by nature basis will provide the most useful structured summary of operating expenses.
Sasol Annual Financial Statements 2026 20
1 | Statement of compliance continued |
Management-defined performance measures
Management-defined performance measures (MPMs) are subtotals of income and expenses used in public communications outside of the financial statements that communicate to users management’s view of an aspect of the financial performance of the entity as a whole. The Group will be required to disclose specific information about MPMs in a single note in the financial statements.
The Group has developed a process to determine public communications relevant when identifying MPMs. MPMs relate to the same reporting period as the financial statements. Therefore, MPMs disclosed by the Group following adoption of IFRS 18 will be determined based on public communications issued by the Group relating to the 2028 reporting period.
Principles of aggregation and disaggregation
IFRS 18 provides enhanced principles on how to group information in the financial statements. It also introduces guidance on labelling and describing items presented in the primary financial statements or disclosed in the notes.
The Group is assessing the grouping of items on the basis of similar and dissimilar characteristics. Based on this assessment, it will present line items in the primary financial statements that provide useful structured summaries and disclose additional material information in the notes.
The Group is also assessing line items currently labelled as ‘other’ and will use more informative labels.
Consequential amendments
IFRS 18 introduces consequential amendments to IAS 7 Statement of Cash Flows, which require entities to use the newly defined operating profit subtotal as a starting point for the statement of cash flows when presenting operating cash flows under the indirect method. The Group currently used earnings/(loss) before interest and tax as the starting point of the reconciliation to cash flows from operating activities. Certain adjusting items included in the reconciliation will change as a result of the new starting point. For example, the Group’s share of profit(loss) of equity-accounted investees will no longer be an adjusting item, as this amount will not be included in the operating profit starting point. Cash distributions from these investees will be included in cash flows from investing activities.
The consequential amendments also provide specific guidance on the classification of interest and dividend cash flows. The Group will classify cash flows from interest paid as financing activities rather than operating activities under this guidance. Cash flows from interest and dividends received and from dividends paid will be classified as investing activities and financing activities, respectively.
Amendments to IFRS 20 ‘Regulatory Assets and Regulatory Liabilities’
IFRS 20 requires a company subject to a specific type of rate regulation to provide information about its regulatory assets and liabilities as well as regulatory income and expenses. This information will help investors understand specific effects of that regulation on a company’s financial performance and financial position.
The Group will assess the impact of this new standard which will be effective for the Group's annual reporting period beginning on 1 July 2029.
Sasol Annual Financial Statements 2026 21
OPERATING AND OTHER ACTIVITIES
2 | Turnover |
| 2026 | | 2025 | | 2024 | |||
for the period ended | | Rm | Rm | Rm |
| |||
Revenue by major product line | ||||||||
Southern Africa business |
|
|
| |||||
Energy | | | | |||||
Coal¹ |
| |
| |
| | ||
Liquid fuels² |
| |
| |
| | ||
Gas (methane rich gas, natural gas and liquified petroleum gas) and condensate³ |
| |
| |
| | ||
Chemicals Africa | | | | |||||
Base chemicals | | | | |||||
Differentiated chemicals | | | | |||||
International Chemicals business | ||||||||
Chemicals America | | | | |||||
Base chemicals | | | | |||||
Differentiated chemicals | | | | |||||
Chemicals Eurasia | | | | |||||
Differentiated chemicals | | | | |||||
Other (Mainly technology, refinery services)⁴ |
| |
| |
| | ||
Revenue from contracts with customers |
| |
| |
| | ||
Revenue from other contracts⁵ |
| |
| |
| | ||
Total external turnover |
| |
| |
| | ||
1 | Discontinuation of export coal sales in 2026 – due to repurposing of the existing export beneficiation plant as a destoning solution, Sasol Mining concluded the last of the export production on 30 June 2025 and the last export sales in the first quarter of 2026. |
2 | Derived from Fuels segment. |
3 | Derived primarily from Gas segment. |
4 | Relates primarily to the Gas and Fuels segments. |
5 | Relates mainly to the Fuels, Mining, and Chemicals America segments and includes franchise rentals, use of fuel tanks, fuel storage and Sasol Oil Slate offset by Mining Royalties. The Slate mechanism is the fuel price balancing mechanism within South Africa’s regulated fuel pricing framework, through which industry over-recoveries and under-recoveries are accounted for. |
Accounting policies:
Revenue from contracts with customers is recognised when the control of goods or services has transferred to the customer through the satisfaction of a performance obligation. Group performance obligations are satisfied at a point in time and over time, however the Group mainly satisfies its performance obligations at a point in time. For further information on revenue recognition, refer to Segment information on pages 9 to 9.
Revenue recognised reflects the consideration that the Group expects to be entitled to for each distinct performance obligation after deducting indirect taxes, rebates and trade discounts and consists primarily of the sale of fuels, oil, natural gas and chemical products, services rendered, license fees and royalties. The Group allocates revenue based on stand-alone selling prices.
Purchases and sales of inventory with the same counterparty, that are entered into in contemplation of one another to facilitate sales to customers, are combined and recorded on a net basis when the items exchanged are similar in nature.
Sasol Annual Financial Statements 2026 23
2 | Turnover continued |
Revenue from arrangements that are not considered contracts with customers, mainly pertaining to rate regulated activities, franchise rentals, use of fuel tanks and fuel storage, is presented as revenue from other contracts. Where the Group is subject to rate regulation, it includes in revenue any over or under recoveries relating to goods supplied during the period.
The period between the transfer of the goods and services to the customer and the payment by the customer does not exceed 12 months and therefore the Group does not adjust for time value of money as it applies the financing component practical expedient.
3 | Materials, energy and consumables used |
| 2026 | | 2025 | | 2024 | |
for the year ended 30 June | Rm | Rm | Rm | |||
Cost of raw materials* |
| |
| |
| |
Cost of energy and other consumables used in production process |
| |
| |
| |
| |
| |
| |
*Includes R
Materials, energy and consumables used relate to items that are consumed in the manufacturing process, including changes in inventories and distribution costs up until the point of sale.
Included in materials, energy and consumables used is net carbon taxes of R
Purchase commitments
The Group enters into off-take agreements as part of its normal operations which have minimum volume requirements (i.e. take or pay contracts). These purchase commitments consist primarily of agreements for procuring raw materials such as coal, gas and electricity.
The most significant commitment relates to minimum off-take oxygen supply agreements for Secunda Operations of approximately R
| ● | The Oxygen Train 17 oxygen supply agreement runs to 2037, with an option to renew the contract to 2050. The renewal option is not taken into account in the calculation of the commitments. |
| ● | The Oxygen Trains 1 – 16 arrangement is managed through various agreements, including the Gas Sales Agreement, Utilities Agreement and a suite of other contracts. In terms of the Utilities Agreement, Sasol is contractually bound to buy oxygen and other derivative gasses from Air Liquide annually, while Air Liquide is bound to buy utilities from Sasol for the same amount for |
Sasol Annual Financial Statements 2026 24
3Materials, energy and consumables used continued
Sasol has established a renewable energy portfolio exceeding
Furthermore, Sasol is party to long-term gas purchase agreements of approximately R
Contractual purchase commitments are taken into account in testing the recoverability of the carrying amounts of property, plant and equipment. At 30 June 2026 and 30 June 2025, there were no onerous contracts relating to these off-take commitments.
4 | Employee-related expenditure |
2026 | 2025 | 2024 |
| |||||||
for the year ended 30 June | | Note | | Rm | | Rm | | Rm |
| |
Analysis of employee costs |
| |||||||||
Labour |
|
| |
| |
| | |||
salaries, wages and other employee-related expenditure |
|
| |
| |
| | |||
post-retirement benefits1 |
| 31 |
| |
| |
| | ||
Share-based payment expenses |
|
| |
| |
| | |||
equity-settled2 |
| 32 |
| |
| |
| | ||
Total employee-related expenditure |
|
| |
| |
| | |||
Less: costs capitalised to projects |
|
| ( |
| ( |
| ( | |||
Per income statement |
|
| |
| |
| | |||
| 1 | Included in the post-retirement benefits costs are past service costs resulting from a current year amendment of the US post-retirement medical plan. |
| 2 | No additional expense was incurred with regards to the cash settled share-based payment as the fair value at both modification and settlement date was less than the expense already accrued over the vesting period (Refer to note 32.1). |
The total number of permanent and non-permanent employees, in approved positions, including the Group’s share of employees within joint operation entities and excluding contractors, joint ventures’ and associates’ employees, is analysed below:
2026 | 2025 | 2024 | ||||
for the year ended 30 June | | Number | | Number | | Number |
Permanent employees | | | | |||
Non-permanent employees |
| |
| |
| |
| |
| |
| |
Sasol Annual Financial Statements 2026 25
5 | Other expenses and income |
| 2026 | | 2025 | | 2024 | ||
for the year ended 30 June | Rm | Rm | Rm | ||||
Includes: | | | | ||||
Derivative gains¹ | ( | ( | ( | ||||
Translation losses/(gains) | | | | ||||
Trade and other receivables |
| |
| |
| | |
Trade and other payables |
| |
| |
| | |
Foreign currency loans |
| |
| ( |
| | |
Other² | | | ( | ||||
Exploration expenditure and feasibility costs | | | | ||||
Professional fees | | | | ||||
Provision for rehabilitation | | ( | ( | ||||
Expected credit losses (released)/raised |
| ( |
| ( |
| | |
Other income3 | ( | ( | ( | ||||
1 | Relates mainly to the Group’s hedging activities and embedded derivatives (refer to note 35). |
2 | Relates mainly to the effect of the strengthening of the Rand on the translation of foreign operations and intergroup exposure on foreign currency loans. |
3 | During the prior year, Sasol and Transnet concluded a settlement agreement, resulting in a net receipt of R |
Research and development expenditure amounting to R
Sasol Annual Financial Statements 2026 26
6 | Net finance costs |
| 2026 | 2025 | 2024 |
| ||||||
for the year ended 30 June | | Note | | Rm | | Rm | | Rm |
| |
Finance income | |
| |
| |
| | |||
Notional interest | |
| — |
| |
| — | |||
Interest received on | |
| |
| |
| | |||
other long-term investments | |
| |
| |
| | |||
loans and receivables | |
| |
| |
| | |||
cash and cash equivalents | |
| |
| |
| | |||
Per income statement | |
| |
| |
| | |||
Less: notional interest | |
| — |
| ( |
| — | |||
Less: interest received on tax | |
| ( |
| ( |
| ( | |||
Per the statement of cash flows | |
| |
| |
| | |||
Finance costs | |
|
|
| ||||||
Debt | |
| |
| |
| | |||
Interest on lease liabilities | 14 |
| |
| |
| | |||
Other | |
| |
| |
| | |||
| |
| |
| | |||||
Amortisation of loan costs | 13 |
| |
| |
| | |||
Notional interest |
| |
| |
| | ||||
Total finance costs | |
| |
| |
| | |||
Amounts capitalised to assets under construction, a class of property, plant and equipment | 16 |
| ( |
| ( |
| ( | |||
Per income statement | |
| |
| |
| | |||
Total finance costs before amortisation of loan costs and notional interest | |
| |
| |
| | |||
Deduct: amortisation of modification gain | ( | ( | — | |||||||
Less: interest accrued on long-term debt and lease liabilities |
| ( |
| ( |
| ( | ||||
Less: interest raised on tax payable | |
| ( |
| ( |
| ( | |||
Per the statement of cash flows | |
| |
| |
| | |||
Sasol Annual Financial Statements 2026 27
7 | Earnings and dividends per share |
2026 | 2025 | 2024 |
| |||||
for the year ended 30 June | | | Rand | | Rand | | Rand |
|
Attributable to owners of Sasol Limited | ||||||||
Basic earnings/(loss) per share |
| |
| |
| ( | ||
Headline earnings per share |
| |
| |
| | ||
Diluted earnings/(loss) per share |
| |
| |
| ( | ||
Diluted headline earnings per share |
| |
| |
| | ||
Dividends per share |
| — |
| — |
| | ||
interim |
| — |
| — |
| | ||
final* |
| — |
| — |
| — |
* |
Basic earnings per share (EPS) and headline earnings per share (HEPS)
EPS is derived by dividing earnings attributable to owners of Sasol Limited by the weighted average number of shares outstanding during the period. HEPS is derived by dividing the headline earnings attributable to the owners of Sasol Limited by the weighted average number of Sasol ordinary shares and Sasol BEE ordinary shares outstanding during the period.
Diluted earnings per share (DEPS) and diluted headline earnings per share (DHEPS)
DEPS and DHEPS are calculated by dividing the diluted earnings and diluted headline earnings attributable to owners of Sasol Limited by the diluted weighted average number of Sasol ordinary shares and Sasol BEE ordinary shares in issue during the year. DEPS and DHEPS are calculated considering the potentially dilutive ordinary shares that could be issued as a result of share options granted to employees under the Sasol Long-term incentive (LTI) and Sasol Khanyisa Tier 2 plans (refer to note 32) and as a result of the potential conversion of the US$750 million Convertible Bond (refer to note 13).
The Sasol Khanyisa Tier 2 potential shares are anti-dilutive for DEPS and DHEPS purposes in all years presented.
The convertible bond remained anti-dilutive in 2026, despite a partial recovery in the fair value of the instrument in 2026 driven by the improvement in Sasol’s share price and credit spreads at the valuation date (refer to note 35.1).
| 2026 | | 2025 | | 2024 |
| |
for the year ended 30 June |
| Rm |
| Rm |
| Rm | |
Earnings/(loss) and headline earnings |
| |
| |
| | |
Earnings/(loss) attributable to owners of Sasol Limited |
| |
| |
| ( | |
Total remeasurement items for the Group, net of tax* |
| |
| |
| | |
Headline earnings attributable to owners of Sasol Limited | | | |
* | The net profit on disposal of business includes a gain on remeasurement of contingent consideration from Uzbekistan GTL LLC disposal of R |
Number of shares | ||||||
2026 | 2025 | 2024 | ||||
for the year ended 30 June | million | million | million | |||
Basic weighted average number of shares | | | | | | |
Issued shares |
| |
| |
| |
Effect of treasury shares held |
| ( |
| ( |
| ( |
Effect of long-term incentives exercised |
| ( |
| ( |
| ( |
Basic weighted average number of shares for EPS and HEPS |
| |
| |
| |
Sasol Annual Financial Statements 2026 28
7 | Earnings and dividends per share continued |
| 2026 | | 2025 | | 2024 | |
for the year ended 30 June |
| Rm |
| Rm |
| Rm |
Diluted earnings/(loss) |
| |
| |
| |
Earnings/(loss) attributable to owners of Sasol Limited |
| |
| |
| ( |
Impact of convertible bond* |
| — |
| — |
| ( |
Diluted earnings/(loss) attributable to owners of Sasol Limited |
| |
| |
| ( |
* | For 2026 and 2025 the convertible bond is anti-dilutive and therefore not assumed to be exercised in diluted earnings. |
| 2026 | | 2025 | | 2024 | |
for the year ended 30 June | Rm | Rm | Rm | |||
Diluted headline earnings | | | | |||
Headline earnings attributable to owners of Sasol Limited |
| |
| |
| |
Impact of convertible bond* |
| — |
| — |
| ( |
Diluted headline earnings attributable to owners of Sasol Limited |
| |
| |
| |
*For 2026 and 2025 the convertible bond is anti-dilutive and therefore not assumed to be exercised in diluted earnings.
Number of shares | ||||||
2026 | 2025 | 2024 | ||||
for the year ended 30 June | | million | | million | | million |
Diluted weighted average number of shares | ||||||
Weighted average number of shares |
| |
| |
| |
Potential dilutive effect of convertible bond* | — | — | | |||
Potential dilutive effect of long-term incentive scheme |
| |
| |
| |
Diluted weighted average number of shares for DEPS and DHEPS |
| |
| |
| |
* | For 2026 and 2025 the convertible bond is anti-dilutive and therefore contingently issuable ordinary shares are not included. |
Sasol Annual Financial Statements 2026 29
8 | Remeasurement items affecting operating profit |
2026 | 2025 | 2024 |
| |||||||
for the year ended 30 June | | Note | | Rm | | Rm | | Rm |
| |
Effect of remeasurement items for subsidiaries, equity accounted investments and joint operations | ||||||||||
Impairment of assets |
|
| |
| |
| ||||
property, plant and equipment |
| 16 |
| |
| |
| |||
right of use assets |
| 14 |
| |
| |
| |||
other intangible assets and goodwill |
|
| |
| |
| ||||
equity accounted investment | 18 | | — | — | ||||||
Reversal of impairment of assets |
|
| ( |
| ( |
| ( | |||
property, plant and equipment |
| 16 |
| ( |
| ( |
| ( | ||
right of use assets | 14 | — | ( | — | ||||||
Loss/(profit) on |
|
| |
| ( |
| ||||
disposal of property, plant and equipment |
|
| ( |
| ( |
| ( | |||
disposal of other intangible assets |
|
| ( |
| — |
| — | |||
disposal of other assets |
|
| — |
| ( |
| ( | |||
disposal of businesses* |
|
| |
| ( |
| ( | |||
scrapping of property, plant and equipment |
| 16 |
| |
| |
| |||
Write-off of unsuccessful exploration wells |
|
| |
| |
| ||||
Remeasurement items per income statement |
|
| |
| |
| ||||
Tax impact |
|
| ( |
| ( |
| ( | |||
impairment of assets | ( | ( | ( | |||||||
reversal of impairment of assets | | | — | |||||||
loss on disposals and scrapping | ( | ( | ( | |||||||
tax impact of write-off of unsuccessful exploration wells | — | ( | — | |||||||
Non-controlling interest effect | ( | ( | ( | |||||||
Effect of remeasurement items for equity accounted investments |
|
| |
| |
| ( | |||
Total remeasurement items for the Group, net of tax |
|
| |
| |
| ||||
* | The year ended 30 June 2025 includes a gain on remeasurement of contingent consideration from the Uzbekistan GTL LLC disposal of R |
Impairment/reversal of impairments
The Group’s non-financial assets, other than inventories and deferred tax assets, are assessed for impairment indicators, as well as reversal of impairment indicators at each reporting date or whenever events or changes in circumstances indicate that the carrying amount may not be recoverable or a previous impairment should be reversed. Recoverable amounts are estimated for individual assets or, where an individual asset cannot generate cash inflows independently, the recoverable amount is determined for the larger cash generating unit to which it belongs. At 30 June 2026, the Group’s net asset value exceeding its market capitalisation was identified as an impairment indicator and consequently all of the Group’s CGUs and equity-accounted investments were tested for impairment. Other than the CGUs specifically mentioned, all of the Group’s remaining CGUs have adequate headroom and reasonable changes in assumptions applied would not result in any impairment.
Sasol Annual Financial Statements 2026 30
8 | Remeasurement items affecting operating profit continued |
Impairment calculations
The recoverable amount of the assets reviewed for impairment is determined based on the higher of the fair value less costs to sell or value-in-use (VIU) calculations. The impairments disclosed below were all based on VIU calculations, except where indicated otherwise. Key assumptions relating to this valuation include the discount rate and cash flows used to determine the recoverable amount. Future cash flows are estimated based on approved financial budgets covering a five year period and extrapolated over the useful life of the assets to reflect the long term plans for the Group using the estimated growth rate for the specific business or project. Where reliable cash flow projections are available for a period longer than
Main long-term average macroeconomic assumptions used for impairment calculations
| 2026 | | 2025 | | 2024 | | CGU Reference3 | |||
Crude oil price (Brent)1 | US$/bbl | | | | a, b, h | |||||
Ethane price1 |
| US$c/gal |
| |
| |
| |
| 4 |
Ethylene price (International Chemicals)1 | US$/ton | | | | 6 | |||||
Linear low density polyethylene (LLDPE) price (Chemicals Africa)1 |
| US$/ton |
| |
| |
| |
| 5,f |
Polyvinyl Chloride (PVC) price1 | US$/ton | | | | d | |||||
Southern African gas purchase price (real)2 |
| US$/Gj |
| — |
| — |
|
| a,d,e | |
Oil Product Differentials | US$/bbl | | | | a | |||||
Refining margin1 |
| US$/bbl |
| |
| |
| |
| a |
Exchange rate1 |
| Rand/US$ |
| |
| |
| |
| All |
1 | Assumptions are provided on a long-term average basis in nominal terms, unless indicated otherwise and are calculated based on a |
2 | Aligned to our optimised transition plan and South African Emission Reduction Roadmap (ERR), LNG as an alternative gas feedstock is no longer feasible and has been excluded from future cash flow projections. |
3 | Refer to page 48. |
4 | Relevant to 2024 impairment of Ethane value chain (Alc/Alu/EO/EG) in Chemicals America. |
5 | Relevant to the impairment of Polyethylene in Chemicals Africa. |
6 | Relevant to the 2025 impairment of Sasol China Care Chemicals. |
Sasol’s long-term price outlook is based on a set of, as far as possible, internally consistent assumptions and data which is validated against external benchmarks. Over the long-term, we assume that the average Rand/US$ will depreciate in line with the South African and US inflation differential, and inflation outcomes will be broadly in line with key central bank targets. For additional information purposes, our latest assumptions indicate an average exchange rate of R
Sasol Annual Financial Statements 2026 31
8 | Remeasurement items affecting operating profit continued |
Oil price assumptions take account of global supply and demand factors, which include production costs, inventories, and the evolution of structural factors in the underlying product demand categories that are derived from crude oil. The underlying assumptions on refined products demand, are informed by independent research and assumptions on, for example, the evolution of the vehicle parc, engine efficiency, refinery economics, aviation trends and the feedstock needs within the petrochemicals sector. Following the completion of price sets, these are benchmarked against the views of reputable global consulting firms, organisations, and local and domestic investment and commercial banks. For additional information purposes, our latest assumptions indicate an average Brent crude oil price of US$
For chemicals, our projections are developed using a combination of fundamental market analysis and long-term value chain economics. Assumptions incorporate expected changes in global supply and demand balances, feedstock costs while also considering trends in industrial output, regulatory developments, and shifts in end-user markets. The approach ensures that both cyclical market dynamics and longer-term structural changes are reflected in the projections. Following the completion of price sets, these are benchmarked against the views of reputable global consulting firms and organisations. For additional information purposes, our latest assumptions indicate an average North East Asia LLDPE price of US$
During the 2026 financial year, the conflict involving the United States, Israel and Iran increased volatility in global energy markets and introduced additional uncertainty regarding future commodity price outcomes. In developing its long-term assumptions, Sasol considered the potential impact of disruptions to Middle East oil and product supply chains, including risks associated with regional production, export infrastructure, and shipping routes. The approved price outlook incorporates management's assessment of these risks through scenario analysis and probabilities, while continuing to be grounded in long-term supply and demand fundamentals and benchmarked against external market views. Although the conflict contributed to higher near-term uncertainty and risk premiums in energy and chemicals markets, management's long-term assumptions reflect its view of the most likely market outcomes over the forecast horizon and the expected normalisation of market conditions over time.
| | | United | | ||||||||
South | States of | |||||||||||
Africa | America | Europe | Mozambique | |||||||||
% | % | % | | % | ||||||||
Growth rate – Producer Price Index |
| 2026 |
| |
| |
| | | |||
Weighted average cost of capital* |
| 2026 |
| |
| |
| | – | | | |
Growth rate – Producer Price Index |
| 2025 |
| |
| |
| | | |||
Weighted average cost of capital* |
| 2025 |
| |
| |
| | – | | | |
Growth rate – Producer Price Index |
| 2024 |
| |
| |
| | | |||
Weighted average cost of capital* |
| 2024 |
| |
| |
| | – | | | |
* | Calculated using spot market factors on 30 June and 31 December. The decrease in the 2026 WACC discount rates primarily reflects lower costs of debt and favourable changes in market factors including country risk premiums. |
Sasol Annual Financial Statements 2026 32
8 | Remeasurement items affecting operating profit continued |
Impairment/(reversal of impairment) of assets
| Property, | | | Other | Equity | | ||||
plant and | Right of | intangible | Accounted | |||||||
equipment | use assets | assets | Investment | Total | ||||||
2026 | 2026 | 2026 | 2026 | 2026 | ||||||
Segment and Cash-generating unit (CGU) | Rm | Rm | Rm | Rm | Rm | |||||
Fuels segment |
| |
| |
| | |
| | |
Secunda liquid fuels refinery |
| |
| |
| | — |
| | |
Gas | ||||||||||
Production Sharing Agreement (PSA) | | — | — | — | | |||||
Central Térmica de Temane (CTT) | — | — | — | | | |||||
Chemicals Africa |
| |
| |
| | |
| | |
Sasolburg Chlor-Alkali and PVC | | — | — | — | | |||||
Sasolburg Wax |
| |
| |
| | — |
| | |
Polyethylene | | | | — | | |||||
Chemicals America |
| |
| |
| | |
| | |
US Phenolics |
| ( |
| — |
| — | — |
| ( | |
Chemicals Eurasia |
|
|
|
| ||||||
Sasol Italy Care Chemicals (CC) |
| |
| |
| ( | — |
| | |
Other (net) |
| |
| |
| | — |
| | |
| |
| |
| | |
| |
Sasol Annual Financial Statements 2026 33
8 | Remeasurement items affecting operating profit continued |
Description of impairment and sensitivity to changes in assumptions:
Key sources of estimation uncertainty include discount rates and cash flow forecasts which are impacted by commodity prices, exchange rates and carbon tax (and related allowances). Management has considered the sensitivity of the recoverable amount calculations to these key assumptions and these sensitivities have been taken into consideration in determining the required impairments and reversals of impairments in the current period.
| 2026 | |
Cash-generating unit (CGU) | Rm | |
a)Secunda liquid fuels refinery | ||
The Secunda liquid fuels refinery CGU remains fully impaired. At 30 June 2026, the recoverable amount of the refinery improved compared to 30 June 2025, mainly as a result of ongoing cost, capital and volume optimisation initiatives across the value chain. Aligned to our broader transition plan, LNG as an alternative gas feedstock remains infeasible at current and forecast prices. Our focus remains on maintaining continuous supply of good quality and cost effective coal. The South African ERR assumes production volumes of > Management considered multiple cash flow scenarios in quantifying the recoverable amount of the CGU which is highly sensitive to changes in Brent crude oil prices, the Rand/US$ exchange rate and production volumes. A | | |
b)Production Sharing Agreement (PSA) | ||
The impairment of the Production Sharing Agreement (PSA) development at 31 December 2025 was mainly due to a revision of the expected production profile, resulting in some delayed monetisation, as well as the strengthening of the Rand against the US dollar. The total quantum of gas remains unchanged, and whilst the delay of the CTT gas-to-power project in Mozambique has also been considered, its impact is largely mitigated through swap gas arrangements to South Africa. Optimisation of the production profile is subject to ongoing technical evaluation, informed by early production performance and performance test runs, as well as infrastructure optimisation opportunities under consideration. No further impairment was required at 30 June 2026. A | |
Sasol Annual Financial Statements 2026 34
8 | Remeasurement items affecting operating profit continued |
2026 | ||
Cash-generating unit (CGU) | | Rm |
c)Central Térmica de Temane (CTT) | ||
The impairment of the CTT investment at 31 December 2025 is mainly due to the confirmed deferral of the CTT project schedule and a significant increase in the projected end-of-job cost, resulting in the full impairment of Sasol’s equity accounted investment in CTT. The investment remains fully impaired at 30 June 2026. | | |
d)Sasolburg Chlor-Alkali and PVC | ||
The CGU remains fully impaired, resulting in the full amount of costs capitalised during the period being impaired at 31 December 2025. The additional impairment in the current period is mainly as a result of the continued low PVC prices and strengthening of exchange rates. No further impairment was required at 30 June 2026. A South African WACC rate of | | |
e)Sasolburg Wax | ||
The CGU remains fully impaired, resulting in the full amount of costs capitalised during the year also being impaired. The additional impairment in the current year is mainly as a result of the continued low Wax prices and strengthening of exchange rates. A South African WACC rate of | | |
f)Polyethylene | ||
The impairment of the Polyethylene CGU at 30 June 2026 is primarily due to a stronger Rand/US$ exchange rate and lower longer term US$ price assumptions. The lower longer-term US$ price assumptions reflect a weaker medium to long-term polyethylene market outlook compared with 2025. While current polyethylene prices remain relatively resilient (given the Middle East conflict), continued capacity additions, particularly in North East Asia (NEA), are expected to outpace demand growth and sustain global supply-demand imbalances. This is expected to place pressure on future polyethylene prices and margins, with the anticipated market recovery now expected to be more gradual than previously anticipated | ||
A | ||
g)US Phenolics | ||
The asset has been fully impaired previously and in May 2026 Sasol Chemicals USA signed an agreement to sell a portion of the Phenolics business, resulting in the reassessment of the recoverable amount to fair value less cost to sell. | ( | |
h)Sasol Italy Care Chemicals (CC) | ||
The CGU remains fully impaired, with the additional impairment of the Italy CC CGU at 30 June 2026 resulting from continued lower forecasted sales margins, due to slower recovery of demand and additional global production capacity that became operational. The CGU remains fully impaired. A WACC rate of | | |
i)Other (net)¹ | ||
Sasol Annual Financial Statements 2026 35
8 | Remeasurement items affecting operating profit continued |
Significant impairment/(reversal of impairment) of assets in prior period
Segment and Cash-generating unit | | | 2025 | |
(CGU) | Description | Rm | ||
Fuels segment | ||||
Secunda liquid fuels refinery | The Liquid fuels component of the Secunda refinery remains fully impaired. At 30 June 2025, the recoverable amount of the refinery improved compared to 30 June 2024, as a result of the optimisation of the South African ERR leveraging an extended range of levers to maximise production for as long as possible, reducing capital, feedstock and electricity cost. Aligned to our broader transition plan, LNG as an alternative gas feedstock is no longer considered feasible at current and forecast prices. Our focus remains on maintaining continuous supply of quality and cost-effective coal. The South African ERR assumes production of | | ||
Sasolburg liquid fuels refinery | The Sasolburg liquid fuels refinery remains fully impaired at 30 June 2025 mainly as result of decrease in refining margins. The full amount of costs capitalised during the year on this CGU was impaired. A South African WACC rate of | | ||
Gas | ||||
Production Sharing Agreement (PSA) | The impairment of the PSA at 30 June 2025 is mainly due to a higher WACC rate (derived from the Mozambican WACC rate), a | | ||
Exploration Block PT5-C | Exploration block PT5-C is an onshore exploration license in the Inhambane province of Mozambique, adjacent to Sasol’s Petroleum Production Area (PPA) and the PSA acreage. The full impairment of exploration block PT5-C at 30 June 2025 was primarily driven by a decision to pause further development activities associated with the asset and explore alternative opportunities to unlock value. A final investment decision has not been taken on this license. | | ||
Chemicals Africa | ||||
Sasolburg Chlor-Alkali and PVC | The CGU remains fully impaired, resulting in the full amount of costs capitalised during the year being impaired. | |||
Sasolburg Wax |
| The CGU remains fully impaired, resulting in the full amount of costs capitalised during the year also being impaired. |
| |
Chemicals Eurasia | ||||
Sasol Italy Care Chemicals (CC) | The additional impairment of the CGU results from continued lower forecasted sales margins, especially in the short-term due to slower recovery of demand and additional global capacity that came online. The CGU is now fully impaired. | | ||
Sasol China Care Chemicals (CC) | The full impairment on the CGU in 2023 was driven by a combination of lower unit margins and higher costs resulting from the prolonged impact of COVID-19 on China’s economy. Results have increased steadily since 2023 following a reset of the business, volume and earnings projections for the last | ( | ||
Other (net)1 |
| | ||
| |
1Relates largely to Chemicals America (Phenolics CGU) and Chemicals Eurasia.
Sasol Annual Financial Statements 2026 36
8 | Remeasurement items affecting operating profit continued |
Significant impairment/(reversal of impairment) of assets in prior period continued
Segment and Cash-generating unit |
| 2024 | ||
(CGU) | | Description | | Rm |
Fuels segment | ||||
Secunda liquid fuels refinery | The liquid fuels component of the Secunda refinery was fully impaired at 30 June 2023 mainly as a result of the Group's ERR roadmap to achieve a | | ||
Sasolburg liquid fuels refinery | The Sasolburg liquid fuels refinery was further impaired and is fully impaired, mainly as a result of the decrease in refining margins. | | ||
Gas | ||||
Production Sharing Agreement (PSA) | At 30 June 2018 an impairment of R | ( | ||
Chemicals Africa | ||||
Polyethylene | The CGU was further impaired at 30 June 2024 by R | | ||
Chlor-Alkali and PVC | The CGU remains fully impaired, resulting in the full amount of costs capitalised during the year to be impaired. An updated impairment assessment performed at 30 June 2024 did not indicate any further impairments on the CGU. | | ||
Wax | The CGU remains fully impaired, resulting in the full amount of costs capitalised during the year to be impaired. | | ||
Chemicals America | ||||
Ethane value chain (Alc/Alu/EO/EG) | The impairment was driven mainly by the decrease in Ethylene over Ethane margin assumptions and the impact thereof on the downstream ethane value chain (Alcohols, Alumina, Ethylene Oxide, Ethylene Glycols and associated shared assets), in both the short and long term, in addition to the impact of the increase in the WACC rate. Ethylene/ethane margins were lower than previously anticipated since the Ethylene price outlook declined more than the Ethane price outlook. Ethylene prices were lower due to a combination of weak supply/demand fundamentals as well as lower feedstock costs. | | ||
Chemicals Eurasia | ||||
Sasol Italy Care Chemicals | The impairment resulted from an increase in WACC rate as well as lower forecasted sales margins, especially in the short-term due to slower recovery of demand. | | ||
Other (net)1 | | |||
|
1Relates largely to the Chemicals America and Energy segments.
Sasol Annual Financial Statements 2026 37
8 | Remeasurement items affecting operating profit continued |
Areas of judgement:
Determination as to whether, and by how much, an asset, CGU, or group of CGUs is impaired, or whether a previous impairment should be reversed, involves management estimates on highly uncertain matters such as the effects of inflation on operating expenses, discount rates, capital expenditure, carbon tax and related allowances, production profiles and future commodity prices, including the outlook for global or regional market supply-and-demand conditions for crude oil, natural gas and refined products. Judgement is also required when determining the appropriate grouping of assets into a CGU or the appropriate grouping of CGUs for impairment testing purposes.
The future cash flows were determined using the assumptions included in the latest budget as approved by the Board, which included forecast sales volumes and gross margins. If necessary, these cash flows were then adjusted to take into account any changes in assumptions or operating conditions that have been identified subsequent to the preparation of the budgets.
When determining VIU, management also applies judgement when assessing whether future capital projects to achieve sustainability and decarbonisation targets are deemed to maintain the same level of economic benefits or whether they enhance the asset’s performance. Generally, the costs incurred relating to the Group’s ERR are considered costs to maintain the current level of economic benefits. Costs incurred to enhance the asset’s performance are not considered in the VIU calculations.
The weighted average cost of capital rate (WACC) is derived from a pricing model. The variables used in the model are established on the basis of management judgement and current market conditions. Management judgement is also applied in estimating future cash flows and defining of CGUs. These values are sensitive to the cash flows projected for the periods for which detailed forecasts are not available and to the assumptions regarding the long-term sustainability of the cash flows thereafter.
In support of global efforts to address climate change, South Africa made commitments under the Paris Agreement to further reduce GHG emissions and to contribute to limiting global warming to well below 2°c above pre-industrial levels and to pursue efforts to achieve the 1,5°c temperature goal. The Group is targeting a
In South Africa, the Carbon Tax Act, 2019 came into effect on 1 June 2019. Phase 1 of the carbon tax was extended to 31 December 2025, with Phase 2 applicable from 1 January 2026 to 31 December 2030. The South African government has published carbon tax rates up to 2030 for Scope 1 greenhouse gas emissions. Post 2030, management assumes escalation to US$
Sasol Annual Financial Statements 2026 38
8Remeasurement items affecting operating profit continued
The implementation of the Climate Change Bill proposed a carbon tax penalty of R640 per ton of CO₂ payable for emissions exceeding carbon budgets. The Climate Change Bill was signed into law by President Cyril Ramaphosa on 18 July 2024 and published as the Climate Change Act, 2022 (Act) on 23 July 2024. However, in terms of section 35 of the Act, it will only come into operation on a date fixed by the President by proclamation in the Government Gazette. The Climate Change Act includes Nationally Determined Contributions (NDCs) – scope 1 CO2e emission reduction ranges for South African for 2025 and 2030. The Department of Fisheries, Forestry and Environment (DFFE) are in the process of rolling out these NDCs to Sectoral Emissions Targets (SETs), which will form the basis for company level carbon budgets. Sasol has participated in a voluntary carbon budget process with the DFFE for the periods 2016-2020 and 2021-2025. The period 2026-2030 will be the first mandatory period for carbon budget reporting. A penalty is included in the impairment assessment to the extent that the Group expects its scope 1 GHG emissions to exceed its estimated carbon budget from calendar year 2026, The expected carbon tax penalty rate was subsequently escalated by CPI from a pricing perspective. However, based on the assumed budget allowance and company scope 1 GHG emissions pathway, penalties are likely to start from financial year 2038. This assumption will be monitored and updated when the carbon budget process and relevant legislation are finalised and implemented.
Climate change and the transition to a lower carbon economy are also likely to impact the future prices of commodities such as oil and natural gas which in turn may affect the recoverable amount of the Group’s property, plant and equipment and other non-current assets. Management has updated its best estimate of oil price assumptions used in determining the recoverable amounts of its CGUs in June 2026. The revised estimates reflect lower real oil price in the longer term as demand is expected to decrease as the transition to a lower carbon economy progresses. The energy transition may impact demand for certain refined products in the future.
Management will continue to review price assumptions as the energy transition progresses and this may result in impairment charges or reversals in the future.
Accounting policies:
Remeasurement items are amounts recognised in profit or loss relating to any change (whether realised or unrealised) in the carrying amount of non-current assets or liabilities that are less closely aligned to the normal operating or trading activities of the Group such as the impairment of non-current assets, profit or loss on disposal of non-current assets including businesses and equity accounted investments, and scrapping of assets.
The Group’s non-financial assets, other than inventories and deferred tax assets, are reviewed at each reporting date or whenever events or changes in circumstances indicate that the carrying amount may not be recoverable, to determine whether there is any indication of impairment. An impairment test is performed on all goodwill, intangible assets not yet in use and intangible assets with indefinite useful lives at each reporting date.
The recoverable amount of an asset or CGU is defined as the amount that reflects the greater of the fair value less costs of disposal and VIU that can be attributed to an asset as a result of its ongoing use by the entity. VIU is estimated using a discounted cash flow model. The future cash flows are adjusted for risks specific to the asset and are adjusted where applicable to take into account any specific risks relating to the country where the asset or CGU is located. The rate applied in each country is reassessed each year. The recoverable amount may be adjusted to take into account recent market transactions for a similar asset.
Some assets are an integral part of the value chain but are not capable of generating independent cash flows because there is no active market for the product streams produced from these assets, or the market does not have the ability to absorb the product streams produced from these assets or it is not practically possible to access the market due to infrastructure constraints that would be costly to construct. Product streams produced by these assets form an input into another process and accordingly do not have an active market. These assets are classified as corporate assets in terms of IAS 36 when their output supports the production of multiple product streams that are ultimately sold into an active market.
Sasol Annual Financial Statements 2026 39
8Remeasurement items affecting operating profit continued
The Group’s corporate assets are allocated to the relevant CGU based on a cost or volume contribution metric. Costs incurred by the corporate asset are allocated to the appropriate CGU at cost. If there is an indication that a corporate asset may be impaired, then the recoverable amount is determined for the CGU to which the corporate asset belongs.
In Southern Africa, the coal value chain starts with feedstock mined in Secunda and Sasolburg and continues along the integrated processes of the operating business units, ultimately resulting in fuels and chemicals-based product lines. Similarly, the gas value chain starts with the feedstock obtained in Mozambique and continues along the conversion processes in Secunda and Sasolburg, ultimately resulting in fuels and chemicals-based product lines.
The groups of assets which support the different product lines, including corporate asset allocations, are considered to be separate CGUs.
In the US, the ethylene value chain results in various chemicals-based product lines, sold into active markets. The assets which support the different chemicals-based product lines, including corporate asset allocations, are considered to be separate CGUs.
In Europe, the identification of separate CGUs is based on the various product streams that have the ability to be sold into active markets by the European business units.
Certain products are sometimes produced incidentally from the main conversion processes and can be sold into active markets. When this is the case, the assets that are directly attributable to the production of these products, are classified as separate CGUs. The cost of conversion of these products is compared against the revenue when assessing the asset for impairment.
Exploration assets are tested for impairment when development of the property commences or whenever facts and circumstances indicate impairment. An impairment loss is recognised for the amount by which the exploration assets carrying amount exceeds their recoverable amount.
When the Group loses control over a subsidiary, it derecognises the assets and liabilities of the subsidiary, and any related non-controlling interest and other components of equity. Any resulting gain or loss, including any FCTR reclassified, is recognised in profit or loss. Any interest retained in the former subsidiary is measured at fair value when control is lost. Any gain or loss on disposal will comprise that attributed to the portion disposed of and the remeasurement of the portion retained.
Sasol Annual Financial Statements 2026 40
TAXATION
9 | Taxation |
| | 2026 | | 2025 | | 2024 |
| |||
for the year ended 30 June | Note | Rm | Rm | Rm |
| |||||
South African normal tax |
| |
| |
| |
| | ||
current year |
| |
| |
| |
| | ||
prior years1 |
| |
| ( |
| ( |
| ( | ||
Foreign tax |
| |
| |
| |
| | ||
current year |
| |
| |
| |
| | ||
global minimum top-up tax2 | | | — | |||||||
prior years |
| |
| ( |
| ( |
| ( | ||
Income tax |
| 10 |
| |
| |
| | ||
Deferred tax – South Africa |
| 11 |
| ( |
| ( |
| | ||
current year3 |
| |
| |
| ( |
| | ||
prior years4 |
| |
| ( |
| ( |
| | ||
Deferred tax – foreign |
| 11 |
| ( |
| ( |
| ( | ||
current year⁵ |
| |
| ( |
| ( |
| ( | ||
prior years |
| |
| |
| ( |
| ( | ||
tax rate change⁶ |
| |
| ( |
| ( |
| | ||
| |
| |
| | |||||
| 1 | Relates to Section 12L (South African income tax incentive for energy-efficiency) allowances refer footnote 4. |
| 2 | In respect of Pillar Two that introduced a 15% global minimum effective tax rate for large multi-national entities. The Group has applied a temporary mandatory relief from deferred tax accounting for the impacts of the top-up tax and accounts for it as a current tax. |
| 3 | Mainly due to the assessed loss utilised in Sasol South Africa Limited (SSA) in 2026. |
| 4 | Mainly attributable to the R |
| 5 | The increase relates mainly to tax losses in the US, unwinding of deferred tax liability on Mozambique assets and current year impairments. |
| 6 | 2026 mainly relates to the effect of future tax rate change in Germany on the realisation of deferred tax balance. 2025 relates mainly to Louisiana (US) tax rate reduction that was enacted. |
Uncertain tax positions
Sasol companies are involved in tax litigation and tax disputes with various tax authorities in the normal course of business. A detailed assessment is performed regularly on each matter and a provision is recognised where appropriate. Although the outcome of these claims and disputes cannot be predicted with certainty, Sasol believes that open engagement and transparency will enable appropriate resolution thereof.
Sasol Financing International (SFI)/South African Revenue Services (SARS)
As reported previously, SARS conducted an audit over a number of years on SFI, which performs an offshore treasury function for Sasol. The audit culminated in the issue by SARS of revised tax assessments, based on the interpretation of the place of effective management of SFI. A contingent liability of R
Sasol Annual Financial Statements 2026 41
9 | Taxation continued |
SARS dismissed Sasol’s objection to the revised assessments and Sasol appealed this decision to the Tax Court. In parallel Sasol launched a review application in respect of certain elements of the revised assessments in respect of which the Tax Court does not have jurisdiction. Sasol also brought a review application against the SARS decision to register SFI as a South African taxpayer. SFI and SARS have agreed that the Tax Court related processes will be held in abeyance, pending the outcome of the judicial review applications. The two review applications were heard in the High Court in November 2022 and on 1 August 2023, the High Court handed down its decision dismissing both the SFI review applications. SFI filed an application for leave to appeal the High Court decision. On 20 September 2024 the High Court granted SFI’s application for leave to appeal the High Court decision to the Supreme Court of Appeal. The matter was heard at the Supreme Court of Appeal on 25 November 2025 and the judgment is currently pending. The review applications relate to the challenge by SFI of certain administrative decisions of SARS and the Supreme Court of Appeal decision does not directly affect the merits of the substantive dispute before the Tax Court, which remains in abeyance while the appeal of the review applications continues.
| 2026 |
| 2025 |
| 2024 | |
% | % | % | ||||
Reconciliation of effective tax rate |
| |
| |
| |
The table below shows the difference between the South African enacted tax rate compared to the effective tax rate in the income statement. Total income tax expense differs from the amount computed by applying the South African normal tax rate to profit before tax. The reasons for these differences are: |
| |
| |
| |
South African normal tax rate |
| |
| |
| |
Increase/(decrease) in rate of tax due to: |
| |
| |
| |
disallowed expenditure¹ |
| |
| |
| ( |
disallowed share-based payment expenses |
| |
| |
| ( |
different tax rates |
| |
| |
| ( |
tax losses not recognised2 |
| |
| |
| ( |
translation differences | | — | — | |||
other adjustments |
| |
| |
| — |
(Decrease)/increase in rate of tax due to: |
| |||||
exempt income3 |
| ( |
| ( |
| |
share of profits of equity accounted investments |
| ( |
| ( |
| |
utilisation of tax losses |
| — |
| ( |
| |
investment incentive allowances |
| ( |
| ( |
| |
translation differences |
| — |
| ( |
| |
capital gains and losses |
| ( |
| ( |
| — |
change in corporate income tax rate | ( | ( | — | |||
prior year adjustments4 | ( | ( | — | |||
other adjustments | — | — | | |||
Effective tax rate |
| |
| |
| ( |
| 1 | Includes non-deductible expenses incurred not deemed to be in the production of taxable income mainly relating to non-productive interest, project costs, as well as non-deductible impairments. The decrease from 2025 is mainly due to the lower Italy impairment recognised in 2026. |
| 2 | Mainly relates to Sasol Italy tax losses incurred for which no deferred tax assets are recognised (in 2025 relates to the reversal deferred tax asset previously recognised) as it is no longer considered probable that sufficient future taxable income will be available in the foreseeable future to fully utilise these losses. |
| 3 | 2025 mainly relates to contingent consideration from the Uzbekistan GTL LLC disposal. |
| 4 | Mainly related to Section 12L allowances claimed in South Africa relating to prior years. |
Sasol Annual Financial Statements 2026 42
10 | Tax paid |
| | | 2026 | | 2025 | | 2024 |
| ||
for the year ended 30 June | Note | Rm | Rm | Rm |
| |||||
Net amounts payable at beginning of year |
|
| ( |
| |
| | |||
Net interest and penalties on tax |
|
| ( |
| ( |
| ( | |||
Income tax per income statement |
| 9 |
| |
| |
| | ||
Foreign exchange differences recognised in income statement |
|
| ( |
| ( |
| ( | |||
Translation of foreign operations |
|
| ( |
| |
| ( | |||
| |
| |
| | |||||
Net tax (payable)/receivable per statement of financial position¹ |
|
| ( |
| |
| ( | |||
tax payable |
|
| ( |
| ( |
| ( | |||
tax receivable |
|
| |
| |
| | |||
Per the statement of cash flows |
|
| |
| |
| | |||
Comprising |
|
|
|
| ||||||
Normal tax |
|
|
|
| ||||||
South Africa |
|
| |
| |
| | |||
Foreign |
|
| |
| |
| | |||
| |
| |
| | |||||
1 | Decrease mainly due to tax refund received in 2026 of R |
11 | Deferred tax |
|
| 2026 | | 2025 |
| |||
for the year ended 30 June | Note | Rm | Rm |
| ||||
Reconciliation |
| |
| |
| | ||
Balance at beginning of year |
| ( |
| ( | ||||
Current year charge |
| ( |
| ( | ||||
per the income statement |
| 9 |
| ( |
| ( | ||
per the statement of comprehensive income |
| |
| | ||||
Foreign exchange differences recognised in income statement |
| |
| | ||||
Translation of foreign operations |
| |
| | ||||
Balance at end of year |
| ( |
| ( | ||||
Comprising |
|
| ||||||
Deferred tax assets |
| ( |
| ( | ||||
Deferred tax liabilities |
| |
| | ||||
| ( |
| ( | |||||
Sasol Annual Financial Statements 2026 43
11Deferred tax continued
Deferred tax assets and liabilities are determined based on the tax status and rates of the underlying entities. We anticipate sufficient taxable profits to be generated in future to recover the deferred tax asset against. The US and SA tax losses do not expire. The deferred tax asset mainly relate to the US and it is probable that taxable profits will be available against which the deductible temporary difference can be utilised. This is supported by approved financial forecasts.
| 2026 | | 2025 | |
for the year ended 30 June | Rm | Rm | ||
Attributable to the following tax jurisdictions |
| | ||
South Africa | ( |
| ( | |
United States of America | ( |
| ( | |
Germany | |
| | |
Mozambique | ( |
| ( | |
Other | ( |
| ( | |
( |
| ( | ||
Deferred tax is attributable to temporary differences on the following: |
| |||
Net deferred tax assets: |
| |||
Property, plant and equipment | |
| | |
Right of use assets | |
| | |
Current assets | ( | ( | ||
Short- and long-term provisions | ( |
| ( | |
Calculated tax losses | ( |
| ( | |
Financial liabilities | |
| | |
Lease liabilities | ( | ( | ||
Other¹ | ( |
| ( | |
( |
| ( | ||
Net deferred tax liabilities: |
| |||
Property, plant and equipment | |
| | |
Right of use assets | |
| | |
Current assets | |
| | |
Short- and long-term provisions | ( |
| ( | |
Calculated tax losses | ( |
| ( | |
Financial liabilities | |
| | |
Lease liabilities | ( | ( | ||
Other | |
| | |
|
| |
1Other mainly relates to the US interest expense limitation carry forward of R
Sasol Annual Financial Statements 2026 44
11Deferred tax continued
Deferred tax assets have been recognised for the carry forward amount of unutilised tax losses relating to the Group’s operations where, among other things, some taxation losses can be carried forward indefinitely and there is compelling evidence that it is probable that sufficient taxable profits will be available in the future to utilise all tax losses carried forward.
| 2026 | | 2025 | |
for the year ended 30 June | Rm | Rm | ||
Calculated tax losses |
| |
| |
(before applying the applicable tax rate) |
| |
| |
Available for offset against future taxable income |
| |
| |
Utilised against taxable income |
| ( |
| ( |
Not recognised as a deferred tax asset |
| |
| |
Calculated tax losses carried forward that have not been recognised:* |
| |
| |
Expiry between one and five years |
| |
| |
Expiry thereafter |
| |
| |
Indefinite life |
| |
| |
| |
| |
* | Mainly US tax losses partially not recognised as deferred tax assets, as it was no longer considered probable that sufficient future taxable income will be available in the foreseeable future to fully recover the deferred tax asset (refer to note 9). |
Areas of judgement:
A deferred tax asset is recognised to the extent that it is probable that future taxable profits will be available against which the deferred tax asset can be utilised. This includes the significant tax losses incurred at our US operations and Sasol Financing International Limited. These losses do not expire. The assumptions used in estimating future taxable profits are consistent with the main assumptions disclosed in note 8. Where appropriate, the expected impact of climate change was considered in estimating the future taxable profits. The provision of deferred tax assets and liabilities reflects the tax consequences that would follow from the expected recovery or settlement of the carrying amount of its assets and liabilities.
Unremitted earnings at end of year that would be subject to foreign dividend withholding tax and after tax effect if remitted
Deferred tax liabilities are not recognised for the income tax effect that may arise on the remittance of unremitted earnings by foreign subsidiaries, joint operations and incorporated joint ventures. It is management’s intention that, where there is no double taxation relief, these earnings will be permanently re-invested in the Group.
| 2026 | | 2025 |
| ||
for the year ended 30 June | Rm | Rm |
| |||
Unremitted earnings at end of year that would be subject to dividend withholding tax |
| |
| | ||
Europe |
| |
| | ||
Rest of Africa |
| |
| | ||
Other |
| |
| | ||
Tax effect if remitted |
| |
| | ||
Europe |
| |
| | ||
Rest of Africa |
| |
| | ||
Other |
| |
| | ||
Sasol Annual Financial Statements 2026 45
11Deferred tax continued
Dividend withholding tax
Dividend withholding tax is payable at a rate of
On receipt of a dividend, the company includes the dividend withholding tax in its computation of the income tax expense.
2026 | | 2025 | | ||
for the year ended 30 June | Rm | Rm | |||
Undistributed earnings at end of year that would be subjected to dividend withholding tax withheld by the company on behalf of Sasol Limited shareholders | |
| |
| |
Maximum withholding tax payable by shareholders if distributed to individuals | |
| |
|
Accounting policies:
The income tax charge is determined based on net income before tax for the year and includes current tax, deferred tax and dividend withholding tax payable by Sasol.
The current tax charge is the tax payable on the taxable income for the financial year applying enacted or substantively enacted tax rates and includes any adjustments to tax payable in respect of prior years.
Deferred tax is provided for using the liability method, on all temporary differences between the carrying amount of assets and liabilities for accounting purposes and the amounts used for tax purposes and on any tax losses using enacted or substantively enacted tax rates at the reporting date that are expected to apply when the asset is realised or liability settled.
Deferred tax assets and liabilities are offset when the related income taxes are levied by the same taxation authority, there is a legally enforceable right to offset and there is an intention to settle the balances on a net basis.
Sasol Annual Financial Statements 2026 46
EQUITY
12 | Share capital |
| 2026 | | 2025 | | 2024 | |
for the year ended 30 June | Rm | Rm | Rm | |||
Issued share capital (as per statement of changes in equity)¹ |
| |
| |
| |
Number of shares | ||||||
for the year ended 30 June | | 2026 | | 2025 | | 2024 |
Authorised | ||||||
Sasol ordinary shares of no par value² | |
| |
| | |
Sasol BEE ordinary shares of no par value³ | |
| |
| | |
|
| |
| | ||
Issued |
|
| ||||
Shares issued at beginning of year | |
| |
| | |
Issued in terms of the employee share schemes | |
| |
| | |
Shares issued at end of year | |
| |
| | |
Comprising |
|
| ||||
Sasol ordinary shares of no par value | |
| |
| ||
Sasol BEE ordinary shares of no par value | |
| |
| | |
|
| |
| | ||
Unissued shares |
|
| ||||
Sasol ordinary shares of no par value | |
| |
| | |
Sasol BEE ordinary shares of no par value | |
| |
| | |
|
| |
| | ||
| 1 | At 30 June 2026, treasury shares amounted to |
| 2 | At Sasol’s General meeting held on 17 November 2023 a special resolution was passed authorising management to issue up to a maximum of |
| 3 | A Sasol BEE Ordinary Share (SOLBE1) is a Sasol ordinary share that trades on the Empowerment Segment of the JSE. The SOLBE1 shares may only be sold to and bought by “BEE Compliant Persons” as defined by the DTI codes. SOLBE1 shareholders are entitled to the same dividends as Sasol Ordinary Shareholders. |
Accounting policies:
When Sasol Limited’s shares are repurchased by a subsidiary, the amount of consideration paid, including directly attributable costs, is recognised as a deduction from shareholders’ equity.
Sasol Annual Financial Statements 2026 48
FUNDING ACTIVITIES AND FACILITIES
13 | Long-term debt |
| 2026 | | 2025 | |
for the year ended 30 June | Rm | Rm | ||
Total long-term debt | |
| | |
Short-term portion1 | ( |
| ( | |
Long-term portion | |
| | |
Analysis of long-term debt |
| |||
At amortised cost | ||||
Unsecured debt | |
| | |
Unamortised loan costs | ( |
| ( | |
|
| | ||
Reconciliation |
| |||
Balance at beginning of year | |
| | |
Loans raised2 | |
| | |
Loans repaid3 | ( |
| ( | |
Interest accrued | |
| | |
Amortisation of loan costs | |
| | |
Translation of foreign operations | ( |
| ( | |
Foreign exchange differences recognised in income statement | | — | ||
Balance at end of year | |
| | |
Interest-bearing status |
| |||
Interest-bearing debt | |
| | |
Maturity profile |
| |||
Within one year | |
| | |
One to five years | |
| | |
More than five years | |
| | |
|
| |
| 1 | Current period short-term portion relates to the US$ |
| 2 | Relates mainly to a 2033 bond of US$ |
| 3 | Relates mainly to partial repayments on 2028 and 2029 US$ bonds (R |
Sasol Annual Financial Statements 2026 49
13 | Long-term debt continued |
2026 | 2025 | ||||||||||||||||
Total | |||||||||||||||||
Interest | Contract | Rand | Available | Utilised | Utilised | ||||||||||||
rate | amount | equivalent | facilities | facilities | facilities | ||||||||||||
for the year ended 30 June | | Expiry date | | Currency | | % | | million | | Rm | | Rm | | Rm | | Rm | |
Banking facilities and debt arrangements | | | | | | | | ||||||||||
Group treasury facilities | |||||||||||||||||
Commercial paper (uncommitted) |
| None |
| Rand |
| 3 month | |
| |
| | |
| | |||
Commercial banking facilities |
| None |
| Rand |
| * | |
| |
| | — |
| — | |||
Revolving credit facility¹ |
| April 2030 |
| US dollar |
| SOFR+ Credit | |
| |
| | — |
| | |||
Debt arrangements |
|
|
|
|
| ||||||||||||
US Dollar Bond |
| September 2026 |
| US dollar |
| | | — | |
| | ||||||
US Dollar Convertible Bond2 | November 2027 | US dollar | |
| |
| — | | | ||||||||
US Dollar Bond4 | September 2028 | US dollar | | | — | | | ||||||||||
US Dollar Bond4 |
| May 2029 |
| US dollar |
| | | — | |
| | ||||||
US Dollar term loan |
| April 2030 |
| US dollar |
| SOFR+ Credit | | | — | |
| | |||||
Rand Bond3 | July 2030 | Rand | 3 month Jibar + | | | — | | — | |||||||||
US Dollar Bond | March 2031 | US dollar | | | — | | | ||||||||||
US Dollar Bond⁴ | April 2033 | US dollar | | | — | | — | ||||||||||
Other Sasol businesses |
| |
| |
| |
| |
| | |
| | ||||
Specific project asset finance |
| |
| |
| |
| |
| | |
| | ||||
Energy – Natref |
| Various |
| Rand |
| Various | |
| |
| | |
| | |||
Other |
|
| Various | Various | — |
| — |
| — | |
| | |||||
| | |
| | |||||||||||||
Available cash excluding restricted cash |
|
| |
| |
| |
| | |
| ||||||
Total funds available for use |
|
| |
| |
| |
| | |
| ||||||
Accrued interest |
|
| |
| |
| |
| |
| | ||||||
Unamortised loan cost |
|
| |
| |
| |
| ( |
| ( | ||||||
Cumulative fair value gains and foreign exchange movements on convertible bond and embedded derivative financial liability | ( | ( | |||||||||||||||
Total debt including accrued interest and unamortised loan cost |
|
| |
| |
| |
| |
| | ||||||
Comprising |
|
| |
| |
| |
| |
| | ||||||
Long-term debt |
|
| |
| |
| |
| |
| | ||||||
Short-term debt |
|
| |
| |
| |
| |
| | ||||||
Short-term debt |
|
| |
| |
| |
| |
| | ||||||
Short-term portion of long-term debt |
|
| |
| |
| |
| |
| | ||||||
Bank overdraft |
|
| |
| |
| |
| |
| | ||||||
Convertible bond derivative financial liability | | | |||||||||||||||
| | | |||||||||||||||
Sasol Annual Financial Statements 2026 50
13 | Long-term debt continued |
*Interest rate only available when funds are utilised.
| 1 | Sasol repaid R |
| 2 | The convertible bond has a principal amount of US$ |
| 3 | On 23 July 2025, SFIL issued a floating rate bond of R |
| 4 | A 2033 US$ bond of US$ |
Accounting policies:
Debt, which constitutes a financial liability, includes short-term and long-term debt. Debt is initially recognised at fair value, net of transaction costs incurred and is subsequently stated at amortised cost using the effective interest rate method. Debt is classified as short-term unless the borrowing entity has a right to defer settlement of the liability for at least 12 months after the reporting date.
Debt is derecognised when the obligation in the contract is discharged, cancelled or has expired. Premiums or discounts arising from the difference between the fair value of debt raised and the amount repayable at maturity date are charged to the income statement as finance expenses based on the effective interest rate method. A debt modification gain or loss is recognised immediately when a debt measured at amortised cost has been modified. The convertible bond is a hybrid financial instrument consisting of a non-derivative host representing the obligation to make interest payments and to deliver cash to the holder on redemption of the bond (‘the bond component’); and a conversion feature which is accounted for as an embedded derivative financial liability. The bond component was recognised at fair value at inception date. The fair value was determined by subtracting the fair value attributable to the embedded derivative from the fair value of the combined instrument. The bond component is measured subsequently at amortised cost using the effective interest rate of
The bond component and related embedded derivative are classified as current liabilities as the holders may convert at any time.
Refer to note 35 for the accounting policies relating to embedded derivatives.
Sasol Annual Financial Statements 2026 51
14 | Leases |
| | | Plant, | |
| ||||
equipment |
| ||||||||
Land | Buildings | and vehicles | Total |
| |||||
for the year ended 30 June |
| Rm |
| Rm |
| Rm |
| Rm | |
Right of use assets |
| |
| |
| |
| | |
Carrying amount at 30 June 2024 |
| |
| |
| |
| | |
Cost | |
| |
| |
| | ||
Accumulated depreciation and impairment | ( |
| ( |
| ( |
| ( | ||
Additions |
| |
| |
| |
| | |
Modifications and reassessments |
| — |
| |
| |
| | |
Reclassification to assets |
| — |
| — |
| ( |
| ( | |
Translation of foreign operations |
| |
| |
| ( |
| | |
Terminations |
| ( |
| ( |
| ( |
| ( | |
Current year depreciation charge |
| ( |
| ( |
| ( |
| ( | |
Net (impairment)/reversal of right of use assets (note 8) |
| |
| ( |
| ( |
| ( | |
Carrying amount at 30 June 2025 |
| | | | | ||||
Cost |
| | | | | ||||
Accumulated depreciation and impairment |
| ( | ( | ( | ( | ||||
Additions |
| |
| |
| |
| | |
Modifications and reassessments |
| — |
| ( |
| |
| | |
Translation of foreign operations |
| ( |
| ( |
| ( |
| ( | |
Terminations |
| — |
| ( |
| ( |
| ( | |
Current year depreciation charge |
| ( |
| ( |
| ( |
| ( | |
Net impairment of right of use assets (note 8) |
| — |
| ( |
| ( |
| ( | |
Carrying amount at 30 June 2026 | | | | | |||||
Cost | | | | | |||||
Accumulated depreciation and impairment | ( | ( | ( | ( |
| | 2026 | | 2025 | ||
for the year ended 30 June | | Note | | Rm | | Rm |
Lease liabilities |
| |
| |
| |
Total long-term lease liabilities |
| |
| |
| |
Short-term portion (included in short-term debt) |
| 15 |
| |
| |
| |
| | |||
Reconciliation |
| |
| |
| |
Balance at beginning of year |
| |
| |
| |
New lease contracts | | | ||||
Payments made on lease liabilities | ( | ( | ||||
Modifications and reassessments | | | ||||
Interest accrued | | | ||||
Termination of lease liability | ( | ( | ||||
Translation of foreign operations |
| ( |
| | ||
Balance at end of year |
| |
| |
| |
Sasol Annual Financial Statements 2026 52
14Leases continued
2026 | 2025 | 2024 | ||||
for the year ended 30 June | | Rm | | Rm | | Rm |
Amounts recognised in income statement |
| |
| |
| |
Interest expense (included in net finance cost) | |
| |
| | |
Expense relating to short-term leases* |
| |
| |
| |
Expense relating to leases of low-value assets that are not shown above as short-term leases* |
| |
| |
| |
Expense relating to variable lease payments not included in lease liabilities (included in other operating expenses and income)* |
| |
| |
| |
Amounts recognised in statement of cash flows |
|
|
| |||
Total cash outflow on leases |
| |
| |
| |
* | Included in cash paid to suppliers and employees in the statement of cash flows. |
The Group leases a number of assets as part of its activities. These primarily include corporate office buildings in Sandton and Houston, rail yard, rail cars, retail convenience centres and storage facilities. Lease terms are negotiated on an individual basis and contain a wide range of different terms and conditions.
Areas of judgement:
Various factors are considered in assessing whether an arrangement contains a lease including whether a service contract includes the implicit right to substantially all of the economic benefits from assets used in providing the service and whether the Group directs how and for what purpose such assets are used. In performing this assessment, the Group considers decision-making rights that will affect the economic benefits that will be derived from the use of the asset such as changing the type, timing, or quantity of output that is produced by the asset.
Incorporating optional lease periods where there is reasonable certainty that the option will be extended is subject to judgement and has an impact on the measurement of the lease liability and related right of use asset. Management considers all facts and circumstances that create an economic incentive to exercise an extension option, or not exercise a termination option, including consideration of the significance of the underlying asset to the operations and the expected remaining useful life of the operation where the leased asset is used.
The incremental borrowing rate that the Group applies is the rate that the Group would have to pay to borrow the funds necessary to obtain an asset of similar value to the right of use asset in a similar economic environment with similar terms, security and conditions. The estimation of the incremental borrowing rate is determined for each lease contract using the risk-free rate over a term matching that of the lease, adjusted for other factors such as the credit rating of the lessee, a country risk premium and the borrowing currency. A higher incremental borrowing rate would lead to the recognition of a lower lease liability and corresponding right of use asset.
The range of incremental borrowing rates of lease contracts entered into during the year are as follows:
Southern Africa | | |
North America |
| |
Eurasia |
|
Sasol Annual Financial Statements 2026 53
14 | Leases continued |
Accounting policies:
At contract inception all arrangements are assessed to determine whether it is, or contains, a lease. At the commencement date of the lease, the Group recognises lease liabilities measured at the present value of lease payments to be made over the lease term. The lease payments include:
| ● | fixed payments (including in-substance fixed payments) less any lease incentives receivable; |
| ● | variable lease payments that depend on an index or a rate; |
| ● | amounts expected to be paid under residual value guarantees; |
| ● | the exercise price of a purchase option reasonably certain to be exercised; |
| ● | payments of penalties for terminating the lease, if the lease term reflects the Group exercising the option to terminate; and |
| ● | lease payments to be made under reasonably certain extension options. |
Variable lease payments that do not depend on an index or a rate are recognised as expenses (unless they are capitalised as part of the cost of inventories or assets under construction) in the period in which the event or condition that triggers the payment occurs.
In calculating the present value of lease payments, the Group uses its incremental borrowing rate at the lease commencement date because the interest rate implicit in the lease is generally not readily determinable. The incremental borrowing rate is the rate that the Group would have to pay to borrow the funds necessary to obtain an asset of similar value to the right of use asset in a similar economic environment with similar terms, security and conditions.
After the commencement date, finance cost is charged to profit or loss over the lease period so as to produce a constant periodic rate of interest on the remaining balance of the liability for each period.
The carrying amount of lease liabilities is remeasured if there is a modification, a change in the lease term, a change in the lease payments (e.g., changes to future payments resulting from a change in an index or rate used to determine such lease payments) or a change in the assessment of an option to purchase the underlying asset.
The Group applies the recognition exemptions to short-term leases (i.e., those leases that have a lease term of 12 months or less from the commencement date and do not contain a purchase option) and leases of assets that are considered to be low value. Lease payments on short-term leases and leases of low-value assets are recognised as expenses over the lease term.
Sasol Annual Financial Statements 2026 54
14 | Leases continued |
Right of use assets are measured at cost, less any accumulated depreciation and impairment losses, and adjusted for any remeasurement of lease liabilities. The cost of right of use assets includes:
| ● | the amount of the initial measurement of lease liability; |
| ● | any lease payments made at or before the commencement date less any lease incentives received; |
| ● | any initial direct costs; and |
| ● | restoration costs. |
Right of use assets are generally depreciated over the shorter of the asset’s useful life and the lease term on a straight-line basis. If the Group is reasonably certain to exercise a purchase option, the right of use asset is depreciated over the underlying asset’s useful life. The depreciation charge is recognised in the income statement unless it is capitalised as part of the cost of inventories or assets under construction.
The right of use assets are also subject to impairment. Refer to the accounting policies in note 8 on Remeasurement items affecting profit or loss.
Where the Group transfers control of an asset to another entity (buyer-lessor) and leases that same asset back from the buyer-lessor, the Group derecognises the underlying asset and recognises a right-of-use asset at the proportion of the previous carrying amount of the transferred asset that relates to the right of use retained by the Group. The Group also recognises a lease liability measured at the present value of all expected future lease payments with the resulting gain or loss being included in remeasurement items.
15 | Short-term debt |
| | | 2026 | | 2025 | |
for the year ended 30 June | Note | Rm | Rm | |||
Short-term debt | |
| |
| | |
Short-term portion of |
|
| ||||
long-term debt¹ | 13 |
| |
| | |
lease liabilities | 14 |
| |
| | |
| |
| 1 | In addition to the US$ |
Sasol Annual Financial Statements 2026 55
Sasol Annual Financial Statements 2026 56
INVESTING ACTIVITIES
16 | Property, plant and equipment |
| | | Building | | Plant, | | | Assets |
| |||||
and | equipment | Mineral | under | |||||||||||
Land | improvements | and vehicles | assets | construction* | Total | |||||||||
for the year ended 30 June | Rm | Rm | Rm | Rm | Rm | | Rm | |||||||
Carrying amount at 30 June 2024 | |
| |
| |
| |
| | | ||||
Cost |
| | | | | | | |||||||
Accumulated depreciation and impairment |
| ( | ( | ( | ( | — | ( | |||||||
Additions |
| — | | | | | | |||||||
to sustain existing operations |
| — | | | | | | |||||||
to expand operations |
| — | — | | | | | |||||||
Reduction in rehabilitation provisions capitalised |
| — | — | — | — | ( | ( | |||||||
Finance costs capitalised | — | — | — | — | | | ||||||||
Assets capitalised or reclassified |
| — | | | | ( | | |||||||
Reclassification to held for sale |
| | ( | ( | — | — | | |||||||
Translation of foreign operations |
| ( | ( | ( | — | | ( | |||||||
Disposals and scrapping |
| ( | ( | ( | ( | ( | ( | |||||||
Current year depreciation charge |
| — | ( | ( | ( | — | ( | |||||||
Net impairment of property, plant and equipment (note 8) |
| ( | | ( | ( | ( | ( | |||||||
Carrying amount at 30 June 2025 |
| | | | | | | |||||||
Cost | |
| |
| |
| |
| | | ||||
Accumulated depreciation and impairment | ( |
| ( |
| ( |
| ( |
| — | ( | ||||
Additions | — | | | | | | ||||||||
to sustain existing operations | — | | | | | | ||||||||
to expand operations | — | — | | — | | | ||||||||
Reduction in rehabilitation provisions capitalised (note 29) | — | — | ( | — | ( | ( | ||||||||
Finance costs capitalised | — | — | — | — | | | ||||||||
Assets capitalised or reclassified | — | | | | ( | ( | ||||||||
Reclassification to held for sale | — | ( | ( | — | — | ( | ||||||||
Translation of foreign operations | ( | ( | ( | — | ( | ( | ||||||||
Disposals and scrapping | ( | ( | ( | ( | ( | ( | ||||||||
Current year depreciation charge | — | ( | ( | ( | — | ( | ||||||||
Net impairment of property, plant and equipment (note 8) | — | ( | ( | ( | ( | ( | ||||||||
Carrying amount at 30 June 2026 | | | | | | | ||||||||
Cost |
| |
| |
| |
| |
| | | |||
Accumulated depreciation and impairment |
| ( |
| ( |
| ( |
| ( |
| — | ( | |||
*Includes intangible assets and exploration and evaluation assets under construction.
Sasol Annual Financial Statements 2026 57
16 | Property, plant and equipment continued |
| 2026 | | 2025 | | 2024 | ||
for the year ended 30 June | Rm | Rm | Rm |
| |||
Additions to property, plant and equipment (cash flow) | |||||||
Current year additions | |
| |
| | ||
Adjustments for non-cash items | ( |
| ( |
| ( | ||
movement in environmental provisions capitalised | ( |
| ( |
| ( | ||
Reduction in capital project pre-payment | ( | ( | — | ||||
Rig leases | ( | ( | — | ||||
Area A5-A receivable | — | | ( | ||||
Per the statement of cash flows | |
| |
| |
| 2026 | | 2025 | | |
for the year ended 30 June | Rm | Rm | |||
Capital commitments (excluding equity accounted investments) | |||||
Capital commitments, excluding capitalised interest, include all projects for which relevant Board approval has been obtained. Projects still under investigation for which specific Board approvals have not yet been obtained are excluded from the following: |
| |
| |
|
Authorised and contracted for |
| |
| |
|
Authorised but not yet contracted for |
| |
| |
|
Less expenditure to the end of year |
| ( |
| ( |
|
| |
| | ||
to sustain existing operations |
| |
| |
|
to expand operations |
| |
| |
|
Estimated expenditure |
|
| |
| |
Within one year |
| |
| |
|
One to five years |
| |
| |
|
| |
| |
Significant capital commitments and expenditure at 30 June comprise mainly of:
Capital commitments | Capital expenditure | |||||||||||
| | | 2026 | | 2025 | | 2026 | | 2025 | |||
Project | Project location | Business segment | Rm | Rm | Rm | Rm | ||||||
Projects to sustain operations | ||||||||||||
Shutdown and major statutory maintenance | Various | Various | | | | | ||||||
Environmental projects | Various |
| Various |
| | |
| | | |||
Clean fuels II |
| Various |
| Fuels |
| | |
| | | ||
Projects to expand operations | ||||||||||||
Exploration and development1 |
| Mozambique |
| Gas |
| — | |
| | | ||
1PSA reached beneficial operation in 2026.
Capital commitments and expenditure not separately disclosed relates to ordinary sustenance capital.
Areas of judgement:
The depreciation methods, estimated remaining useful lives and residual values are reviewed at least annually. The estimation of the useful lives of property, plant and equipment is based on historic performance as well as expectations about future use and the impact of climate change and therefore requires a significant degree of judgement to be applied by management. The remaining useful lives of property, plant and equipment have been reassessed considering the Group’s targeted reduction in GHG emissions and remain appropriate.
Sasol Annual Financial Statements 2026 58
16Property, plant and equipment continued
The following depreciation rates apply in the Group:
| |
| |
Buildings and improvements |
| ||
Retail convenience centres (included in buildings and improvements) | % | ||
Plant | % | ||
Equipment |
| % | |
Vehicles |
| % | |
Mineral assets |
| Units of production over life of related reserve base | |
Life-of-mine coal assets (included in mineral assets) |
| Units of production over life of related reserve base |
Accounting policies:
Property, plant and equipment
Property, plant and equipment is stated at cost less accumulated depreciation and accumulated impairment losses. Land is not depreciated.
When plant and equipment comprises major components with different useful lives, these components are accounted for as separate items.
Depreciation of mineral assets on producing oil and gas properties is based on the units-of-production method calculated using estimated proved developed reserves. The natural oil and gas reserves are calculated using a methodology designed to be compliant with SEC Regulations S-K.
Life-of-mine coal assets are depreciated using the units-of-production method and are based on proved and probable reserves assigned to that specific mine (accessible reserves) or complex which benefits from the utilisation of those assets. The proved and probable reserves are determined using the SAMREC code. Other coal mining assets are depreciated on the straight-line method over their estimated useful lives.
Depreciation of property acquisition costs, capitalised as part of mineral assets in property, plant and equipment, is based on the units-of-production method calculated using estimated proved reserves.
Property, plant and equipment, other than mineral assets, is depreciated to its estimated residual value on a straight-line basis over its expected useful life.
Sasol Annual Financial Statements 2026 59
16Property, plant and equipment continued
Assets under construction
Assets under construction include land and expenditure capitalised for work in progress in respect of activities to develop, expand or enhance items of property, plant and equipment. The cost of self-constructed assets includes expenditure on materials, direct labour and an allocated proportion of project overheads. Cost also includes the estimated costs of dismantling and removing the assets and site rehabilitation costs to the extent that they relate to the construction of the asset as well as gains or losses on qualifying cash flow hedges attributable to that asset. When regular major inspections are a condition of continuing to operate an item of property, plant and equipment, and plant shutdown costs will be incurred, an estimate of these shutdown costs are included in the carrying value of the asset at initial recognition. Land acquired, as well as costs capitalised for work in progress in respect of activities to develop, expand or enhance items of property, plant and equipment are classified as part of assets under construction.
Finance expenses in respect of specific and general borrowings are capitalised against qualifying assets as part of assets under construction. Where funds are borrowed specifically for the purpose of acquiring or constructing a qualifying asset, the amount of finance expenses eligible for capitalisation on that asset is the actual finance expenses incurred on the borrowing during the period less any investment income on the temporary investment of those borrowings.
Where funds are made available from general borrowings and used for the purpose of acquiring or constructing qualifying assets, the amount of finance expenses eligible for capitalisation is determined by applying a capitalisation rate to the expenditures on these assets. The capitalisation rate of
17 | Long-term receivables and prepaid expenses |
| 2026 | | 2025 | |
for the year ended 30 June | Rm | Rm | ||
Total long-term receivables | | | ||
Impairment of long-term receivables* |
| ( |
| ( |
Short-term portion |
| ( |
| ( |
| |
| | |
Long-term prepaid expenses¹ |
| |
| |
| |
| | |
Comprising: |
|
| ||
Long-term receivables (interest-bearing) - joint operations |
| |
| |
Long-term loans |
| |
| |
| |
| |
| 1 | Includes non-cash movement of R |
The majority of movements in long-term receivables are cash movements including loans granted of R
* | Impairment of long-term loans and receivables |
Long-term loans and receivables are considered for impairment under the expected credit loss model. Refer to note 35.2 for detail on the impairments recognised.
Sasol Annual Financial Statements 2026 60
18 | Equity accounted investments |
At 30 June, the Group’s interest in equity accounted investments and the total carrying values were:
| Country of | | | | Interest | | 2026 | | 2025 | |
Name | incorporation | Nature of activities | % | Rm | Rm | |||||
Joint ventures | | | | | | |||||
ORYX GTL Limited |
| Qatar |
| GTL plant |
| |
| |
| |
Sasol Dyno Nobel (Pty) Ltd |
| South Africa |
| Manufacturing and distribution of explosives |
| |
| |
| |
Associates |
|
| |
|
|
| ||||
Enaex Africa (Pty) Ltd |
| South Africa |
| Manufacturing and distribution of explosives |
| |
| |
| |
The Republic of Mozambique Pipeline Investment Company (Pty) Ltd (ROMPCO) | South Africa | Owning and operating of the natural gas transmission pipeline between Temane in Mozambique and Secunda in South Africa for the transportation of natural gas produced in Mozambique to markets in Mozambique and South Africa | | | | |||||
Other equity accounted investments |
|
|
| Various* |
| |
| | ||
Carrying value of investments |
| |
| |
| |
| |
| |
* | Decrease in Other equity accounted investment relates mainly to the impairment of Central Térmica de Temane (CTT) (refer to note 8). |
There are no significant restrictions on the ability of the joint ventures or associates to transfer funds to Sasol Limited in the form of cash dividends or repayment of loans or advances.
Sasol Annual Financial Statements 2026 61
18 | Equity accounted investments continued |
Impairment testing of equity accounted investments
Based on impairment indicators at each reporting date, impairment tests in respect of investments in joint ventures and associates are performed. The recoverable amount of the investment is compared to the carrying amount, as described in note 8, to calculate the impairment.
| 2026 | | 2025 | |
for the year ended 30 June | Rm | Rm | ||
Summarised financial information for the Group’s share of equity accounted investments which are not material* | ||||
Operating profit |
| |
| |
Profit before tax |
| |
| |
Taxation |
| ( |
| ( |
Profit for the year* | | | ||
Other comprehensive (loss)/income |
| ( |
| |
* | The financial information provided represents the Group's share of the results of the equity accounted investments. The impairment of CTT is not included the results above and is separately disclosed (refer to note 8). |
| 2026 | | 2025 | |
Capital commitments relating to equity accounted investments | | Rm | | Rm |
Capital commitments, excluding capitalised interest, include all projects for which specific Board approval has been obtained up to the reporting date. Projects still under investigation for which specific Board approvals have not yet been obtained are excluded from the following: | | | ||
Authorised and contracted for |
| |
| |
Authorised but not yet contracted for |
| |
| |
Less: expenditure to the end of year |
| ( |
| ( |
| |
| |
Areas of judgement:
Joint ventures and associates are assessed for materiality in relation to the Group using a number of factors such as investment value, strategic importance and monitoring by those charged with governance.
ORYX GTL and ROMPCO are considered to be material as they are closely monitored by and reported on to the decision makers and are considered to be strategically material investments.
Sasol Annual Financial Statements 2026 62
18 | Equity accounted investments continued |
Summarised financial information for the Group’s material equity accounted investments
In accordance with the Group’s accounting policy, the results of joint ventures and associates are equity accounted. The information provided below represents the Group’s material joint venture and associate. The financial information presented includes the full financial position and results of the joint venture and includes intercompany transactions and balances.
| Joint venture |
| ||||
| ORYX GTL Limited*** |
| ||||
| 2026 | | 2025 |
| ||
for the year ended 30 June | | Rm | | Rm | | |
Summarised statement of financial position |
| | ||||
Non-current assets* | | | ||||
Deferred tax asset | | | ||||
Cash and cash equivalents | | | ||||
Other current assets | | | ||||
Total assets | | | ||||
Non-current liabilities | | | ||||
Current liabilities | | | ||||
Tax payable | — | | ||||
Total liabilities | | | ||||
Net assets | | | ||||
Summarised income statement | ||||||
Turnover | | | ||||
Depreciation and amortisation | ( | ( | ||||
Other operating expenses | ( | ( | ||||
Operating (loss)/profit before interest and tax | ( | | ||||
Finance income | | | ||||
Finance cost | ( | ( | ||||
(Loss)/profit before tax | ( | | ||||
Taxation | ( | ( | ||||
(Loss)/profit and total comprehensive income for the year | ( | | ||||
The Group’s share of (loss)/profits of equity accounted investment | ( | | ||||
( | | |||||
Taxation | ( | ( | ||||
Reconciliation of summarised financial information | | |||||
Net assets at the beginning of the year | | | ||||
(Loss)/earnings before tax for the year | ( | | ||||
Taxation | ( | ( | ||||
Foreign exchange differences | ( | ( | ||||
Dividends paid** | ( | ( | ||||
Net assets at the end of the year | | | ||||
Carrying value of equity accounted investment | | | ||||
* | Non-current assets mainly include property plant and equipment. |
** | In 2026 ORYX GTL Limited declared a dividend of R |
***The year-end for ORYX GTL Limited is 31 December, the Group uses the financial information based on management accounts at 30 June.
The carrying value of the investment represents the Group’s interest in the net assets thereof.
Sasol Annual Financial Statements 2026 63
18 | Equity accounted investments continued |
Early in March 2026, a military conflict in the Middle East escalated which affected several Gulf countries including Qatar, resulting in the temporary shutdown of Oryx’s GTL facility and the suspension of all product shipments following the closure of the Strait of Hormuz, resulting in the inability to export products. The facility has remained offline and only recently has been able to sell some product which was stored in tanks, into the local market. The facility is back online and ramped up in 2027 but only operating at
The carrying value of the investment represents the Group’s interest in the net assets thereof.
Associate | ||||
The Republic of | ||||
Mozambique Pipeline | ||||
Investment Company | ||||
(Pty) Ltd (ROMPCO)** | ||||
2026 | 2025 | |||
for the year ended 30 June | | Rm | | Rm |
Summarised statement of financial position |
| |
| |
Non-current assets* |
| |
| |
Cash and cash equivalents |
| |
| |
Other current assets |
| |
| |
Total assets |
| |
| |
Non-current liabilities |
| |
| |
Current liabilities |
| |
| |
Tax payable |
| |
| |
Total liabilities |
| |
| |
Net assets |
| |
| |
Summarised income statement |
| |||
Turnover |
| |
| |
Depreciation and amortisation | ( | ( | ||
Other operating expenses | ( | ( | ||
Operating profit before interest and tax | | | ||
Finance income | | | ||
Finance cost | ( | ( | ||
Profit before tax | | | ||
Taxation | ( | ( | ||
Profit and total comprehensive income for the period | | | ||
The Group’s share of profits of equity accounted investment | ||||
| | |||
Taxation | ( | ( | ||
| | |||
Amortisation of fair value adjustment on acquisition of investment | ( | ( | ||
Share of profits of equity accounted investment | | | ||
Reconciliation of summarised financial information | ||||
Net assets at the beginning of the year | | | ||
Earnings before tax for the year | | | ||
Taxation | ( | ( | ||
Dividends paid | ( | ( | ||
Net assets at the end of the year | | | ||
Carrying value of equity accounted investment | | | ||
Historical net asset value | | | ||
Group’s share of fair value adjustment on acquisition of investment | | | ||
Sasol Annual Financial Statements 2026 64
18Equity accounted investments continued
* | Non-current assets mainly include property plant and equipment. |
** | Based on management accounts. |
The carrying value of the investment represents the Group’s interest in the net assets thereof.
| 2026 | | 2025 | | 2024 | |
for the year ended 30 June | Rm | Rm | Rm | |||
Transactions with joint ventures |
| |
| |
| |
Total sales and services rendered from subsidiaries to joint ventures |
| |
| |
| |
Total purchases by subsidiaries from joint ventures | | | | |||
Transactions with associates | ||||||
Total sales and services rendered from subsidiaries to associates | | | | |||
Total purchases by subsidiaries from associates |
| |
| |
| |
The amounts have been disaggregated and reported separately between joint ventures and associates.
Accounting policies:
The financial results of associates and joint ventures are included in the Group’s results according to the equity method from acquisition date until the disposal date. Associates and joint ventures whose financial year-ends are within three months of 30 June are included in the consolidated financial statements using their most recently audited financial results. Adjustments are made to the associates’ and joint ventures financial results for material transactions and events in the intervening period.
Sasol Annual Financial Statements 2026 65
19 | Interest in joint operations |
At 30 June, the Group’s interest in material joint operations were:
| | | | | % of equity owned | |||
2026 | 2025 | |||||||
Name | | Country of incorporation | | Nature of activities | | % | | % |
Louisiana Integrated Polyethylene JV LLC (LIP JV) | United States of America | Manufactures ethylene and polyethylene chemicals. The joint operation with LyondellBasell operates as a tolling arrangement. Sasol retains control of our portion of the goods during the toll processing, for which a fee is paid, and only recognises revenue when the finished goods are transferred to a final customer. Equistar, a subsidiary of LyondellBasell, acts as an independent agent, for a fee, to exclusively market and sell all of Sasol’s Linear low-density polyethylene and Low-density polyethylene produced by the joint operation to customers. | | | ||||
National Petroleum Refiners of South Africa (Pty) Ltd (Natref) |
| South Africa |
| Inland refinery that uses crude oil to produce liquid fuels. Natref is a joint operation between Sasol and Prax South Africa (Pty) Ltd. Prax remains in business rescue. Sasol continues to operate Natref and utilise available Prax capacity in accordance with arrangements agreed with the business rescue practitioners, with operations and product supply remaining uninterrupted. |
| |
| |
Sasol Annual Financial Statements 2026 66
19 | Interest in joint operations continued |
The information provided is Sasol’s share of joint operations (excluding unincorporated joint operations) and includes intercompany transactions and balances.
| | | | Total | Total | |||
| LIP JV | | Natref | | 2026 | 2025 | ||
for the year ended 30 June | | Rm | | Rm | | Rm | | Rm |
Statement of financial position | ||||||||
External non-current assets | | | | | ||||
External current assets | | | | | ||||
Intercompany current assets | — | | | | ||||
Total assets | | | | | ||||
Shareholders’ equity | | ( | | | ||||
Long-term liabilities | | | | | ||||
Interest-bearing current liabilities | | — | | | ||||
Non-interest-bearing current liabilities | | | | | ||||
Intercompany current liabilities | | | | | ||||
Total equity and liabilities | | | | |
At 30 June 2026, the Group’s share of the total capital commitments of joint operations amounted to R
Accounting policies:
The Group recognises its share of any jointly held or incurred assets, liabilities, revenues and expenses along with the Group’s income from the sale of its share of the output and any liabilities and expenses that the Group has incurred in relation to the joint operation. These have been incorporated in the financial statements under the appropriate headings.
Sasol Annual Financial Statements 2026 67
20 | Interest in significant operating subsidiaries |
Sasol Limited is the ultimate parent of the Sasol Group of companies. Our wholly-owned subsidiary, Sasol Investment Company (Pty) Ltd, a company incorporated in the Republic of South Africa, primarily holds our interests in companies incorporated outside of South Africa. The following table presents each of the Group’s significant subsidiaries (including direct and indirect holdings), the nature of activities, the percentage of shares of each subsidiary owned and the country of incorporation at 30 June 2026.
There are
| Country of | | | | % of equity owned | |||
Name | | incorporation | | Nature of activities | | 2026 | | 2025 |
Significant operating subsidiaries | ||||||||
Direct | ||||||||
Sasol Mining Holdings (Pty) Ltd | South Africa | Holding company of the Group’s mining interests | | | ||||
Sasol Technology (Pty) Ltd |
| South Africa |
| Engineering services, research and development and technology transfer |
| |
| |
Sasol Financing Limited |
| South Africa |
| Management of cash resources, investments and procurement of loans (for South African operations) |
| |
| |
Sasol Investment Company (Pty) Ltd |
| South Africa |
| Holding company for foreign investments |
| |
| |
Sasol South Africa Limited1 |
| South Africa |
| Integrated petrochemicals and energy company |
| |
| |
Sasol Middle East and India (Pty) Ltd |
| South Africa |
| Develop and implement international GTL and CTL ventures |
| |
| |
Sasol Africa (Pty) Ltd |
| South Africa |
| Exploration, development, production, marketing and distribution of natural oil and gas and associated products |
| |
| |
Sasol Oil (Pty) Ltd |
| South Africa |
| Marketing of fuels and lubricants |
| |
| |
| 1 | Sasol Khanyisa shareholders indirectly have an |
| Country of | |
| | % of equity owned | |||
Name | | incorporation | | Nature of activities | | 2026 | | 2025 |
Significant operating subsidiaries | | | | | ||||
Indirect | ||||||||
Sasol Financing International Limited |
| South Africa |
| Management of cash resources, investment and procurement of loans (for our foreign operations) |
| |
| |
Sasol Germany GmbH |
| Germany |
| Production, marketing and distribution of chemical products |
| |
| |
Sasol Italy SpA |
| Italy |
| Production, trading and transportation of oil products, petrochemicals and chemical products and derivatives |
| |
| |
Sasol Mining (Pty) Ltd |
| South Africa |
| Coal mining activities |
| |
| |
Sasol Chemicals (USA) LLC |
| United States of America |
| Production, marketing and distribution of chemical products |
| |
| |
Sasol Financing USA LLC |
| United States of America |
| Management of cash resources, investment and procurement of loans (for our North American operations) |
| |
| |
Our other interests in subsidiaries are not considered significant.
Sasol Annual Financial Statements 2026 68
20 | Interest in significant operating subsidiaries continued |
Non-controlling interests
The Group subsidiaries with non-controlling interests, Sasol Oil (Pty) Ltd and Sasol Mining (Pty) Ltd, however none of them were material to the Statement of financial position.
Areas of judgement:
The disclosure of subsidiaries is based on materiality taking into account the contribution to turnover, assets of the Group, and the way the business is managed and reported on.
Control is obtained when Sasol is exposed, or has rights, to variable returns from its involvement with the subsidiary and has the ability to affect those returns through our power over the subsidiary.
The financial results of all entities that have a functional currency different from the presentation currency of their parent entity are translated into the presentation currency. Income and expenditure transactions of foreign operations are translated at the average rate of exchange for the year except for significant individual transactions which are translated at the exchange rate ruling at that date. All assets and liabilities, including fair value adjustments and goodwill arising on acquisition, are translated at the rate of exchange ruling at the reporting date. Differences arising on translation are recognised as other comprehensive income and are included in the foreign currency translation reserve until there is a disposal of the foreign operation. When a foreign operation is disposed of in its entirety or partially such that control, significant influence or joint control is lost, the cumulative amount in the translation reserve related to that foreign operation is reclassified to profit or loss as part of the gain or loss on disposal and included in remeasurement items.
Sasol Annual Financial Statements 2026 69
WORKING CAPITAL
21 | Inventories |
| 2026 | | 2025 | |
for the year ended 30 June | Rm | Rm | ||
Carrying value | ||||
Crude oil and other raw materials* |
| |
| |
Process material |
| |
| |
Maintenance materials |
| |
| |
Work in progress* |
| |
| |
Manufactured products |
| |
| |
Consignment inventory |
| |
| |
| |
| |
*Includes inventory at Natref as part of Sasol utilising Prax’s share of the Natref processing facility.
A net realisable value write-down of R
Inventory of R
Accounting policies:
Inventories are stated at the lower of cost and net realisable value. Cost includes expenditure incurred in acquiring, manufacturing and transporting the inventory to its present location. Manufacturing costs include an allocated portion of production overheads which are directly attributable to the cost of manufacturing such inventory. The allocation is determined based on the greater of normal production capacity and actual production. The costs attributable to any inefficiencies in the production process are charged to the income statement as incurred.
By-products are incidental to the manufacturing processes, are usually produced as a consequence of the main product stream, and are immaterial to the group. Revenue from sale of by-products is offset against the cost of the main products.
Cost is determined as follows:
Crude oil and other raw materials | First-in-first-out valuation method (FIFO) |
Process, maintenance and other materials | Weighted average purchase price |
Work-in-progress | Manufacturing costs incurred according to FIFO |
Manufactured products including consignment inventory | Manufacturing costs according to FIFO |
Sasol Annual Financial Statements 2026 70
22 | Trade and other receivables |
| 2026 | | 2025 | |
for the year ended 30 June | | Rm | | Rm |
Trade receivables |
| |
| |
Other receivables (financial assets)1 |
| |
| |
Related party receivables |
| |
| |
third parties | | | ||
equity accounted investments | | | ||
Impairment of trade and other receivables* |
| ( |
| ( |
| |
| | |
Other receivables (non-financial assets) | | | ||
Duties recoverable from customers |
| |
| |
Prepaid expenses and other |
| |
| |
Value added tax |
| |
| |
| |
| |
1 | Other receivables include a receivable of R |
*Impairment of trade and other receivables
Trade receivables are considered for impairment under the expected credit loss model. Trade receivables are written off when there is no reasonable prospect that the customer will pay. Refer to note 35 for detail on the impairments recognised.
Collateral
The Group holds
Accounting policies:
Trade and other receivables are recognised initially at transaction price and subsequently stated at amortised cost using the effective interest rate method, less impairment losses. Other receivables that fail the business model and solely payments of principal and interest tests are classified at fair value through profit or loss. A simplified expected credit loss model is applied for recognition and measurement of impairments in trade receivables, where expected lifetime credit losses are recognised from initial recognition, with changes in loss allowances recognised in profit or loss. The group did not use a provisional matrix. Trade and other receivables are written off where there is no reasonable expectation of recovering amounts due. The trade receivables do not contain a significant financing component.
Sasol Annual Financial Statements 2026 71
23 | Trade and other payables |
| 2026 | | 2025 |
| ||
for the year ended 30 June | | Rm | | Rm |
| |
Trade payables |
| |
| | ||
Capital project related payables1 |
| |
| | ||
Accrued expenses |
| |
| | ||
Other payables (financial liabilities) | | | ||||
Related party payables |
| |
| | ||
third parties |
| |
| | ||
equity accounted investments |
| |
| | ||
| |
| | |||
Other payables (non-financial liabilities)2 |
| |
| | ||
Duties payable to revenue authorities |
| |
| | ||
Value added tax |
| |
| | ||
| |
| | |||
| 1 | Decrease mainly due to the development cost on the completion of the Production Sharing Agreement project in Mozambique. |
| 2 | Other payables (non-financial liabilities) include employee-related payables. |
Accounting policies:
Trade and other payables are initially recognised at fair value and subsequently stated at amortised cost. Capital project related payables are excluded from working capital, as the nature and risks of these payables are not considered to be aligned to operational trade payables.
24 | (Increase)/decrease in working capital |
| 2026 | | 2025 | | 2024 | |
| Rm | | Rm | | Rm | |
Increase in inventories1 |
| ( |
| ( |
| ( |
Increase in trade receivables |
| ( |
| ( |
| ( |
Increase/(decrease) in trade payables |
| |
| |
| ( |
(Increase)/decrease in working capital |
| ( |
| |
| ( |
1 | The increase in inventory during the year was primarily attributable to higher inventory values resulting from higher prices in the last quarter, the impact of Prax’s working capital in Natref and higher fuel inventory volumes held at year end. |
Movements exclude non-cash movements and translation effects.
Sasol Annual Financial Statements 2026 72
CASH MANAGEMENT
25 | Cash and cash equivalents |
2026 | 2025 | |||
for the year ended 30 June | | Rm | | Rm |
Cash and cash equivalents | | | ||
Restricted cash and cash equivalents | | | ||
| | |||
Bank overdraft |
| ( |
| ( |
Per the statement of cash flows |
| |
| |
Cash by currency |
|
| ||
Rand |
| |
| |
Euro |
| |
| |
US dollar |
| |
| |
Other currencies |
| |
| |
| |
| |
Included in restricted cash and cash equivalents are cash in respect of various special purpose entities and joint operations in the Group for use within those entities.
Accounting policies:
Cash includes cash on hand and demand deposits that can be withdrawn at any time without prior notice or penalty.
Cash equivalents include short-term highly liquid investments with a maturity period of three months or less at date of purchase and money market funds that are readily convertible to a known amount of cash and are subject to an insignificant risk of changes in value.
Cash restricted for use comprises cash and cash equivalents which are not available for general use by the Group, including amounts held in escrow, trust or other separate bank accounts.
Cash, cash equivalents and cash restricted for use are stated at carrying amount which is deemed to be fair value.
Bank overdrafts that are repayable on demand and that are integral to the Group’s cash management are offset against cash and cash equivalents in the statement of cash flows.
The Statement of cash flows is presented on the direct method. Notes are supplied as supplemental information to the Statement of cash flows. Finance income received, finance costs paid and dividends received and paid are presented under operating activities in the Statement of cash flows.
26 | Cash generated by operating activities |
2026 | 2025 | 2024 | ||||||
for the year ended 30 June | | Note | | Rm | | Rm | | Rm |
Cash flow from operations |
| 27 |
| |
| |
| |
(Increase)/decrease in working capital |
| 24 |
| ( |
| |
| ( |
| |
| |
| |
Sasol Annual Financial Statements 2026 73
27 | Cash flow from operations |
2026 | 2025 | 2024 | ||||||
for the year ended 30 June | | Note | | Rm | | Rm | | Rm |
Earnings/(loss) before interest and tax (EBIT/(LBIT)) | | | ( | |||||
Adjusted for |
| |
|
|
| |||
share of profits of equity accounted investments |
|
| ( |
| ( |
| ( | |
equity-settled share-based payment |
| 32 |
| |
| |
| |
depreciation and amortisation |
| |
| |
| | ||
effect of remeasurement items |
| 8 |
| |
| |
| |
movement in long-term provisions |
|
|
| |||||
income statement charge |
| 29 |
| ( |
| ( |
| ( |
utilisation |
| 29 |
| ( |
| ( |
| ( |
movement in short-term provisions |
| ( |
| |
| | ||
movement in post-retirement benefits |
| |
| |
| | ||
translation effects | | | | |||||
write-down of inventories to net realisable value |
| |
| |
| | ||
movement in financial assets and liabilities |
| ( |
| ( |
| ( | ||
movement in other receivables and payables |
| ( |
| |
| ( | ||
other non-cash movements1 |
| ( |
| ( |
| ( | ||
| |
| |
| |
1 | Other non-cash movements include movements in deferred income, expected credit losses and long-term prepaid expenses. |
28 | Dividends paid |
2026 | | 2025 | | 2024 | ||
for the year ended 30 June | | Rm | | Rm | | Rm |
Final dividend – prior year | — | | | |||
Interim dividend – current year |
| — |
| — |
| |
| — |
| |
| |
The Board did not declare a dividend for the current year.
Sasol Annual Financial Statements 2026 74
PROVISIONS
29 | Long-term provisions |
Environmental | Other | Total | ||||||
2026 | 2026 | 2026 | ||||||
for the year ended 30 June | | | Rm | | Rm | | Rm | |
Balance at beginning of year | | | |
| ||||
Capitalised to property, plant and equipment | | — | |
| ||||
Reduction in rehabilitation provision capitalised |
| ( |
| — |
| ( | ||
Per the income statement |
| |
| ( |
| ( | ||
additional provisions and changes to existing provisions |
| ( |
| |
| ( | ||
reversal of unutilised amounts |
| ( |
| ( |
| ( | ||
effect of change in discount rate |
| |
| ( |
| | ||
Notional interest |
| |
| |
| | ||
Utilised during year (cash flow) |
| ( |
| ( |
| ( | ||
Translation of foreign operations |
| ( |
| ( |
| ( | ||
Foreign exchange differences recognised in income statement |
| ( |
| ( |
| ( | ||
Balance at end of year |
| |
| |
| |
Environmental provisions
The environmental obligation includes estimated costs for the rehabilitation of coal mining, oil, gas and petrochemical sites, mainly in South Africa and Mozambique.
The present value of the environmental provisions is determined by discounting the estimated future cash outflows using interest rates of high-quality government bonds that are denominated in the currency in which the amounts will be paid, and that have terms approximating the terms of the related obligation.
Sasol Annual Financial Statements 2026 76
29 | Long-term provisions continued |
The following discount rates were applied:
2026 | 2025 | |||
for the year ended 30 June | | % | | % |
South Africa |
|
| ||
Europe |
|
| ||
United States of America (for US$ denominated provisions) |
|
|
2026 | 2025 | ||||
for the year ended 30 June | | Rm | | Rm | |
A |
| |
| | |
Increase in the discount rate |
| ( |
| ( | |
amount capitalised to property, plant and equipment |
| ( |
| ( | |
income recognised in income statement |
| ( |
| ( | |
Decrease in the discount rate |
| |
| | |
amount capitalised to property, plant and equipment |
| |
| | |
expense recognised in income statement |
| |
| | |
The time at which the operations cease to produce economically viable returns and the pace of transition to a low carbon economy will impact the anticipated time period over which decommissioning liabilities are expected to be incurred in future.
| | | 2026 | | 2025 | |
for the year ended 30 June | Note | Rm | Rm | |||
Expected timing of future cash flows | ||||||
Within one year |
| |
| | ||
One to five years |
|
| |
| ||
Five to ten years¹ |
|
| |
| ||
More than ten years | | |||||
| ||||||
Short-term portion | 30 | ( | ( | |||
Long-term provisions | | |||||
Estimated undiscounted obligation* |
| |
|
| 1 | Relates largely to the rehabilitation of coal mining, oil and gas sites in South Africa and Mozambique. |
* | The decrease is mainly attributable to changes in the long-term macroeconomic assumptions, specifically the downward revision of the long-term South African PPI assumption from |
In line with the requirements of the legislation of South Africa, the utilisation of certain investments is restricted for mining rehabilitation purposes. These investments amounted to R
Sasol Annual Financial Statements 2026 77
29 | Long-term provisions continued |
Accounting policies:
Estimated long-term environmental provisions, comprising pollution control, rehabilitation and mine closure, are based on the Group’s environmental policy taking into account current technological, environmental and regulatory requirements. The provision for rehabilitation is recognised as and when the environmental liability arises. To the extent that the obligations relate to the construction of an asset, they are capitalised as part of the cost of those assets. The effect of subsequent changes to assumptions in estimating an obligation for which the provision was recognised as part of the cost of the asset is adjusted against the asset. Any subsequent changes to an obligation which did not relate to the initial construction of a related asset are charged to the income statement. The increase in discounted long-term provisions as a result of the passage of time is recognised as a finance expense in the income statement.
The estimated present value of future decommissioning costs, taking into account current environmental and regulatory requirements, is capitalised as part of property, plant and equipment, to the extent that they relate to the construction of the asset, and the related provisions are raised. These estimates are reviewed at least annually.
Deferred tax is recognised on the temporary differences in relation to both the asset to which the obligation relates to and rehabilitation provision.
Areas of judgement:
The determination of long-term provisions, in particular environmental provisions, remains a key area where management’s judgement is required. Estimating the amount and timing of the future cost of these obligations is complex and requires management to make estimates and judgements because most of the obligations will only be fulfilled in the future and contracts and laws are often not clear regarding what is required. The resulting provisions could also be influenced by changing technologies and political, environmental, safety, business and statutory considerations as well as the period in which it will be settled. The pace of transition to a low carbon economy will impact the anticipated time period over which decommissioning liabilities are expected to be incurred.
Provisions are based on estimates of unscheduled closure cost at reporting date, applicable inflation and discount rates, and the expected date of mine closure, in order to determine the present value of the long-term environmental provisions.
Closure cost estimates are determined through the application of appropriate rehabilitation methods, using updated volumes and quantities at reporting date together with the latest unit rates for all activities included in the rehabilitation plan for each site. Unit rates, including plugging and abandonment of gas wells, are sourced both internally and from external consultants. Internal reviews incorporate these rates, adjusted for inflation and any necessary technical updates in line with changes in operational conditions or the passage of time.
Sasol Annual Financial Statements 2026 78
29 | Long-term provisions continued |
The obligation to ensure that water management and treatment, remediation of soil and ground water contamination meet statutory requirements are incorporated in both the internal and external closure cost reviews. Costs relating to water treatments from expected date of decanting, where estimable, are discounted to the present value, and included in the environmental rehabilitation provisions.
To manage the risk of understatement of the environmental rehabilitation provisions, the undiscounted rehabilitation cost estimate is adjusted for;
| ● | Preliminaries and Generals (P&Gs): Indirect, project-support costs required to manage and execute rehabilitation activities, and |
| ● | Contingencies: Allowances for uncertain, unforeseen, or variable cost elements that cannot be estimated with precision at reporting date. |
30 | Short-term provisions |
| | 2026 | | 2025 | ||
for the year ended 30 June | Note | Rm | Rm | |||
Emission rights |
| |
| |
| |
Other provisions |
| |
| |
| |
Short-term portion of |
| |
|
| ||
long-term provisions |
| 29 |
| |
| |
post-retirement benefit obligations |
| 31 |
| |
| |
| |
| |
Accounting policies:
In emission schemes where a cap is set for emissions, the associated emission rights granted are recognised at fair value and classified under intangible assets. An emission liability is recognised under short-term provisions when actual emissions occur that give rise to an obligation. To the extent the liability is covered by emission rights held, the liability is measured with reference to the value of these emission rights held and for the remaining uncovered portion at current market value. The associated expense is presented under Materials, energy and consumables used. Both the emission rights intangible asset and the emission liability are derecognised upon settling the liability with the respective regulator.
Sasol Annual Financial Statements 2026 79
31 | Post-retirement benefit obligations |
Non-current | Current | Total | ||||||||||||
| 2026 | 2025 | | 2026 | 2025 | 2026 | 2025 | |||||||
for the year ended 30 June | Note | | Rm | | Rm | | Rm | | Rm | | Rm | | Rm | |
Post-retirement healthcare obligations |
| 31.1 |
| |
| | ||||||||
South Africa |
|
| | |
| | | | | |||||
United States of America |
|
| | |
| | | | | |||||
| | |
| | | | | |||||||
Pension obligations |
| 31.2 |
| |||||||||||
Foreign – post-retirement benefit obligation |
|
| | |
| | | | | |||||
Total post-retirement benefit obligations |
|
| | |
| | | | | |||||
Pension assets |
| 31.2 |
|
| ||||||||||
South Africa – post-retirement benefit asset |
|
| ( | ( |
| — | — | ( | ( | |||||
Foreign – post-retirement benefit asset |
|
| ( | ( |
| — | — | ( | ( | |||||
Total post-retirement benefit assets |
|
| ( | ( |
| — | — | ( | ( | |||||
Net pension obligations |
|
| | |
| | | | | |||||
| | Loss/(gain) recognised in the income | | Loss/(gain) recognised in other | ||||||||||
statement | comprehensive income | |||||||||||||
2026 | 2025 | 2024 | 2026 | 2025 | 2024 | |||||||||
for the year ended 30 June | | Note | | Rm | | Rm | | Rm | | Rm | | Rm | | Rm |
Post-retirement benefit obligations |
| |
| |
| |
| |
| |
| |
| |
Post-retirement healthcare obligations |
| 31.1 |
| |
| |
| |
| |
| |
| |
Pension benefits – projected benefit obligation |
| 31.2 |
| |
| |
| |
| |
| |
| |
Pension benefits – plan asset of funded obligation |
| 31.2 |
| ( |
| ( |
| ( |
| ( |
| ( |
| ( |
Interest on asset limitation | | | | — | — | — | ||||||||
Net movement on asset limitation and reimbursive right* |
| — |
| — |
| — |
| ( |
| ( |
| | ||
| |
| |
| |
| ( |
| ( |
| ( | |||
*Refer to note 31.2 for the asset not recognised due to asset limitation.
Sasol Annual Financial Statements 2026 80
31 | Post-retirement benefit obligations continued |
The Group provides post-retirement medical and pension benefits to certain of its retirees, principally in South Africa, Europe and the United States of America. Generally, medical cover provides for a specified percentage of most medical expenses, subject to pre-set rules and maximum amounts. Pension benefits are payable in the form of retirement, disability and surviving dependent pensions. The medical benefits are unfunded. The pension benefits in South Africa are funded. In the United States of America certain of our Pension Funds are funded.
| Healthcare benefits | | Pension benefits | |
Last actuarial valuation – South Africa |
| 30 June 2026 |
| 31 March 2026 |
Last actuarial valuation – United States of America |
| 30 June 2026 |
| 30 June 2026 |
Last actuarial valuation – Europe |
| n/a* |
| 30 April 2026 |
Full/interim valuation |
| Full |
| Full |
Valuation method adopted |
| Projected unit credit |
| Projected unit credit |
*Not applicable as there is no post-retirement healthcare obligation in Europe.
The plans have been assessed by the actuaries and have been found to be in sound financial positions.
Principal actuarial assumptions
Weighted average assumptions used in performing actuarial valuations determined in consultation with independent actuaries.
United States of | ||||||||||||
South Africa | America | Europe | ||||||||||
| 2026 | | 2025 | | 2026 | | 2025 | | 2026 | | 2025 | |
at valuation date | % | % | % | % | % | % | ||||||
Healthcare cost inflation | |
|
| n/a | * | n/a | * | n/a |
| n/a | ||
Discount rate – post-retirement medical benefits |
|
|
|
|
| n/a |
| n/a | ||||
Discount rate – pension benefits |
|
|
|
|
| |||||||
Pension increase assumption |
|
|
| n/a | ** | n/a | ** |
| ||||
Average salary increases |
|
|
|
| ||||||||
Weighted average duration of the obligation – post-retirement medical obligation |
|
|
|
|
| n/a |
| n/a | ||||
Weighted average duration of the obligation – pension obligation |
|
|
|
|
| |||||||
| ||||||||||||
* | The healthcare cost inflation rate in respect of the plans for the United States of America is capped. All additional future increases due to the healthcare cost inflation will be borne by the participants. |
** | There are no automatic pension increases for the United States of America pension plan. |
Assumptions regarding future mortality are based on published statistics and mortality tables.
Sasol Annual Financial Statements 2026 81
31 | Post-retirement benefit obligations continued |
31.1 | Post-retirement healthcare obligations |
In South Africa, certain healthcare and life assurance benefits are provided to South African employees hired prior to 1 January 1998, who retire and satisfy the necessary requirements of the medical fund.
Reconciliation of the total post-retirement healthcare obligation recognised in the statement of financial position
| | South Africa | | United States of America | | Total | |||||||
2026 | | 2025 | 2026 | | 2025 | 2026 | | 2025 | |||||
for the year ended 30 June | Rm | Rm | Rm | Rm | Rm | Rm | |||||||
Total post-retirement healthcare obligation at beginning of year |
| |
| |
| |
| |
| |
| | |
Movements recognised in the income statement: |
| |
| |
| ( |
| |
| |
| | |
current service cost |
| |
| |
| |
| |
| |
| | |
past service cost* | — | — | ( | — | ( | — | |||||||
interest cost |
| |
| |
| |
| |
| |
| | |
Actuarial losses/(gains) recognised in other comprehensive income: |
| |
| |
| ( |
| ( |
| |
| | |
arising from changes in financial assumptions |
| |
| |
| ( |
| — |
| |
| | |
arising from changes in actuarial experience |
| ( |
| ( |
| |
| ( |
| ( |
| ( | |
Benefits paid |
| ( |
| ( |
| ( |
| ( |
| ( |
| ( | |
Translation of foreign operations |
| — |
| — |
| ( |
| ( |
| ( |
| ( | |
Total post-retirement healthcare obligation at end of year |
| |
| |
| |
| |
| |
| | |
* | During the year, the Group amended the US post-retirement medical plan. The amendment resulted in a past service credit (negative past service cost) which was recognised in the income statement. |
The sensitivity analysis is performed in order to assess how the post-retirement healthcare obligation would be affected by changes in the key actuarial assumptions underpinning the calculation.
| South Africa | | United States of America |
| |||||
2026 | | 2025 | 2026 | | 2025 |
| |||
for the year ended 30 June | Rm | Rm | Rm | Rm |
| ||||
1% point change in actuarial assumptions: |
| |
| |
| |
| | |
Increase in the healthcare cost inflation |
| |
| |
| — | * | — | * |
Decrease in the healthcare cost inflation |
| ( |
| ( |
| — | * | — | * |
Increase in the discount rate |
| ( |
| ( |
| ( |
| ( | |
Decrease in the discount rate |
| |
| |
| |
| | |
* | A change in the healthcare cost inflation for the United States of America will not have an effect on the above components or the obligation as the employer’s cost is capped and all future increases due to the healthcare cost inflation are borne by the participants. There are no automatic pension increases for the United States of America pension plan. |
A change in the pension increase assumption will not have an effect on the above obligation. In South Africa the post-retirement benefit contributions are linked to medical aid inflation and based on a percentage of income or pension. Where pension increases differ from medical aid inflation, the difference will need to be allowed for in a change in the percentage of income or pension charged.
The sensitivities may not be representative of the actual change in the post-retirement healthcare obligation, as it is unlikely that the changes would occur in isolation of one another, and some of the assumptions may be correlated.
Sasol Annual Financial Statements 2026 82
31 | Post-retirement benefit obligations continued |
31.1 | Post-retirement healthcare obligations continued |
Healthcare cost inflation risk
Healthcare cost inflation is consumer price index inflation plus
Discount rate risk
The discount rate is derived from prevailing bond yields. A decrease in the discount rate will increase the obligation of the plan.
Pension increase risk
The South African healthcare plan is linked to pension benefits paid, which are to some extent linked to inflation. Accordingly, increased inflation levels represent a risk that could increase the cost of paying the funds committed to benefits.
Other
Changes in other assumptions used could also affect the measured liabilities. There is also a regulatory risk as well as foreign funds under the jurisdiction of other countries. To the extent that governments can change the regulatory frameworks, there may be a risk that minimum benefits or minimum pension increases may be instituted, increasing the associated cost for the fund.
31.2 | Pension benefits |
South African operations
Background
In 1994, all members were given the choice to voluntarily transfer to the newly established defined contribution section of the pension fund and approximately
Defined benefit option for defined contribution members
In terms of the rules of the fund, on retirement, employees employed before 1 January 2009 have an option to purchase a defined benefit pension with their member share. Should a member elect this option, the Group is exposed to actuarial risk. In terms of IAS 19, the classification requirements stipulate that where an employer is exposed to any actuarial risk, the fund must be classified as a defined benefit plan.
Fund assets
The assets of the fund are held separately from those of the Company in a trustee administered fund, registered in terms of the South African Pension Funds Act, 1956. Included in the fund assets at 31 March 2026 are
Membership
A significant number of employees are covered by union sponsored, collectively bargained, and in some cases, multi-employer defined contribution pension plans. Information from the administrators of these plans offering defined benefits is not sufficient to permit the Company to determine its share, if any, of any unfunded vested benefits.
Sasol Annual Financial Statements 2026 83
31 | Post-retirement benefit obligations continued |
31.2 | Pension benefits continued |
Pension fund assets
The assets of the pension funds are invested as follows:
South Africa | United States of America | ||||||||
| 2026 | 2025 | 2026 | 2025 | |||||
at 30 June | | % | | % | | % | | % | |
Equities | | | | | |||||
resources |
| |
| |
| |
| | |
industrials |
| |
| |
| |
| | |
consumer discretionary |
| |
| |
| |
| | |
consumer staples |
| |
| |
| |
| | |
healthcare |
| |
| |
| |
| | |
information technologies |
| |
| |
| |
| | |
telecommunications |
| |
| |
| |
| | |
utilities | | | — | — | |||||
financials (ex real estate) |
| |
| |
| |
| | |
Fixed interest |
| |
| |
| |
| | |
Direct property |
| |
| |
| |
| | |
Listed property |
| |
| |
| — |
| — | |
Cash and cash equivalents |
| |
| |
| — |
| — | |
Third party managed assets |
| |
| |
| — |
| — | |
Other |
| |
| |
| |
| | |
Total |
| |
| |
| |
| | |
The pension fund assets are measured at fair value at valuation date. The fair value of equity has been calculated by reference to quoted prices in an active market. The fair value of property and other assets has been determined by performing market valuations and using other valuation techniques at the end of each reporting period.
Sasol Annual Financial Statements 2026 84
31 | Post-retirement benefit obligations continued |
31.2 | Pension benefits continued |
Investment strategy
The trustees target the plans’ asset allocation within the following ranges within each asset class:
South Africa¹ | United States of America | |||||||
Minimum | Maximum | Minimum | Maximum | |||||
Asset classes | | % | | % | | % | | % |
Equities |
| |
| |
| |
| |
local |
| |
| |
| — |
| |
foreign |
| |
| |
| — |
| |
Fixed interest |
| |
| |
| — |
| |
Property |
| |
| |
| — |
| |
Other |
| — |
| |
| — |
| |
| 1 | Members of the defined contribution scheme have a choice of |
The trustees of the respective funds monitor investment performance and portfolio characteristics on a regular basis to ensure that managers are meeting expectations with respect to their investment approach. There are restrictions and controls placed on managers in this regard.
Reconciliation of the projected net pension liability/(asset) recognised in the statement of financial position
South Africa | Foreign | Total |
| |||||||||||
| 2026 | | 2025 | | 2026 | | 2025 | | 2026 | | 2025 | |||
for the year ended 30 June | Rm | Rm | Rm | Rm | Rm | Rm | ||||||||
Projected benefit obligation (funded) | | | | | | | ||||||||
defined benefit portion |
| |
| |
| |
| |
| |
| | ||
defined benefit option for defined contribution members |
| |
| |
| — |
| — |
| |
| | ||
Plan assets |
| ( |
| ( |
| ( |
| ( |
| ( |
| ( | ||
defined benefit portion |
| ( |
| ( |
| ( |
| ( |
| ( |
| ( | ||
defined benefit option for defined contribution members |
| |
| ( |
| — |
| — |
| |
| ( | ||
Projected benefit obligation (unfunded) |
| — |
| — |
| |
| |
| |
| | ||
Asset not recognised due to asset limitation |
| |
| |
| — |
| — |
| |
| | ||
Net liability/(asset) recognised |
| ( |
| ( |
| |
| |
| |
| | ||
Sasol Annual Financial Statements 2026 85
31 | Post-retirement benefit obligations continued |
31.2 | Pension benefits continued |
The obligation which arises for the defined contribution members with the option to purchase into the defined benefit fund is limited to the assets that they have accumulated until retirement date. However, after retirement date, there is actuarial risk associated with the members as full defined benefit members.
Based on the latest actuarial valuation of the fund and the approval of the trustees of the surplus allocation, the Group has an unconditional entitlement to only the funds in the employer surplus account and the contribution reserve. The remaining estimated surplus due to the Company amounts to approximately R
Investment risk
The actuarial valuation assumes certain asset returns on invested assets. If actual returns on plan assets are below the assumption, this may lead to a strain on the fund, which, over time, may lead to a plan deficit. In order to mitigate the concentration risk, the fund assets are invested across equity securities, property securities and debt securities. Given the long-term nature of the obligations, it is considered appropriate that investment is made in equities and real estate to improve the return generated by the fund. These may result in improved pension benefits to members.
Pension increase risk
Benefits in these plans are to some extent linked to inflation so increased inflation levels represent a risk that could increase the cost of paying the funds committed to benefits. This risk is mitigated as pension benefits are subject to affordability.
Discount rate risk
The discount rate is derived from prevailing bond yields. A decrease in the discount rate used will increase the obligation of the plan.
Other
Changes in other assumptions used could also affect the measured liabilities. There is also a regulatory risk as well as foreign funds under the jurisdiction of other countries. To the extent that governments can change the regulatory frameworks, there may be a risk that minimum benefits or minimum pension increases may be instituted, increasing the associated cost for the fund.
Sasol Annual Financial Statements 2026 86
31 | Post-retirement benefit obligations continued |
31.2 | Pension benefits continued |
Reconciliation of projected benefit obligation
South Africa | Foreign | Total |
| |||||||||||
2026 | 2025 | 2026 | 2025 | 2026 | 2025 |
| ||||||||
for the year ended 30 June | | Rm | | Rm | | Rm | | Rm | | Rm | | Rm |
| |
Projected benefit obligation at beginning of year |
| |
| |
| |
| |
| |
| | ||
Movements recognised in income statement: |
| |
| |
| |
| |
| |
| | ||
current service cost |
| |
| |
| |
| |
| |
| | ||
interest cost |
| |
| |
| |
| |
| |
| | ||
Actuarial losses/(gains) recognised in other comprehensive income: |
| |
| |
| ( |
| ( |
| |
| | ||
arising from changes in financial assumptions |
| |
| |
| ( |
| ( |
| |
| | ||
arising from change in actuarial experience |
| |
| ( |
| ( |
| ( |
| |
| ( | ||
Member contributions |
| |
| |
| — |
| — |
| |
| | ||
Benefits paid |
| ( |
| ( |
| ( |
| ( |
| ( |
| ( | ||
Translation of foreign operations |
| — |
| — |
| ( |
| |
| ( |
| | ||
Projected benefit obligation at end of year |
| |
| |
| |
| |
| |
| | ||
unfunded obligation¹ |
| — |
| — |
| |
| |
| |
| | ||
funded obligation |
| |
| |
| |
| |
| |
| | ||
| 1 | Certain of the foreign defined benefit plans have reimbursement rights under contractually agreed legal binding terms that match the amount and timing of some of the benefits payable under the plan. This reimbursive right has been recognised in long-term receivables at fair value of R |
Sasol Annual Financial Statements 2026 87
31 | Post-retirement benefit obligations continued |
31.2 | Pension benefits continued |
Reconciliation of plan assets of funded obligation
South Africa | Foreign | Total |
| |||||||||||
2026 | 2025 | 2026 | 2025 | 2026 | 2025 |
| ||||||||
for the year ended 30 June | | Rm | | Rm | | Rm | | Rm | | Rm | | Rm |
| |
Fair value of plan assets at beginning of year |
| |
| |
| |
| |
| |
| | ||
Movements recognised in income statement: |
| |
| |
| |
| |
| |
| | ||
interest income |
| |
| |
| |
| |
| |
| | ||
Actuarial (losses)/gains recognised in other comprehensive income: |
| |
| |
| |
| |
| |
| | ||
arising from return on plan assets (excluding interest income) |
| |
| |
| |
| |
| |
| | ||
Plan participant contributions¹ |
| |
| |
| — |
| — |
| |
| | ||
Employer contributions¹ |
| |
| |
| |
| |
| |
| | ||
Benefit payments |
| ( |
| ( |
| ( |
| ( |
| ( |
| ( | ||
Translation of foreign operations |
| — |
| — |
| ( |
| ( |
| ( |
| ( | ||
Fair value of plan assets at end of year |
| |
| |
| |
| |
| |
| | ||
Actual return on plan assets |
| |
| |
| |
| |
| |
| | ||
1 | Contributions, for the defined contribution section, are paid by the members and Sasol at fixed rates. |
Contributions
Funding is based on actuarially determined contributions. The following table sets forth the projected pension contributions of funded obligations for the 2027 financial year.
| South Africa | | Foreign | |
Rm | Rm | |||
Pension contributions |
| | |
Sensitivity analysis
A sensitivity analysis is performed in order to assess how the post-retirement pension obligation would be affected by changes in the key actuarial assumptions underpinning the calculation.
South Africa | Foreign |
| |||||||
2026 | 2025 | 2026 | 2025 |
| |||||
for the year ended 30 June | | Rm | | Rm | | Rm | | Rm |
|
1% point change in actuarial assumptions |
| |
| |
| |
| | |
Increase in average salaries increase assumption |
| |
| |
| |
| | |
Decrease in average salaries increase assumption |
| ( |
| ( |
| ( |
| ( | |
Increase in the discount rate |
| ( |
| ( |
| ( |
| ( | |
Decrease in the discount rate |
| |
| |
| |
| | |
Increase in the pension increase assumption |
| |
| |
| | * | | * |
Decrease in the pension increase assumption |
| ( |
| ( |
| ( | * | ( | * |
* | This sensitivity analysis relates only to the Europe obligations as there are no automatic pension increases for the United States of America pension plan, and thus it is not one of the inputs utilised in calculating the obligation. |
The sensitivities may not be representative of the actual change in the post-retirement pension obligation, as it is unlikely that the changes would occur in isolation of one another, and some of the assumptions may be correlated.
Sasol Annual Financial Statements 2026 88
31 | Post-retirement benefit obligations continued |
31.2 | Pension benefits continued |
Accounting policies:
The Group contributes to defined contribution pension plans and defined benefit pension plans for its employees in certain of the countries in which it operates. These plans are generally funded through payments to trustee-administered funds as determined by annual actuarial calculations.
Defined contribution pension plans are plans under which the Group pays fixed contributions into a separate legal entity and has no legal or constructive obligation to pay further amounts. Contributions to defined contribution pension plans are charged to the income statement as an employee expense in the period in which the related services are rendered by the employee.
The Group’s net obligation in respect of defined benefit pension plans is actuarially calculated separately for each plan by deducting the fair value of plan assets from the gross obligation for post-retirement benefits. The gross obligation is determined by estimating the future benefit attributable to members in return for services rendered to date.
This future benefit is discounted to determine its present value, using discount rates based on government bonds for South African obligations, and corporate bonds in Europe and the US, that have maturity dates approximating the terms of the Group’s obligations and which are denominated in the currency in which the benefits are expected to be paid. Independent actuaries perform this calculation annually using the projected unit credit method.
Defined contribution members employed before 2009 have an option to purchase a defined benefit pension with their member share. This option gives rise to actuarial risk, and as such, these members are accounted for as part of the defined benefit fund and are disclosed as such.
Past service costs are charged to the income statement at the earlier of the following dates:
| ● | when the plan amendment or curtailment occurs; or |
| ● | when the Group recognises related restructuring costs or termination benefits. |
Actuarial gains and losses arising from experience adjustments and changes to actuarial assumptions, the return on plan assets (excluding amounts included in net interest on the defined benefit liability/(asset)) and any changes in the effect of the asset ceiling (excluding amounts included in net interest on the defined benefit liability/(asset)) are remeasurements that are recognised in other comprehensive income in the period in which they arise.
Where the plan assets exceed the gross obligation, the asset recognised is limited to the lower of the surplus in the defined benefit plan and the asset ceiling, determined using a discount rate based on government bonds.
Surpluses and deficits in the various plans are not offset.
The entitlement to healthcare benefits is usually based on the employee remaining in service up to retirement age and the completion of a minimum service period. The expected costs of these benefits are accrued on a systematic basis over the expected remaining period of employment, using the accounting methodology described in respect of defined benefit pension plans above. Independent actuaries perform the calculation of this obligation annually.
Sasol Annual Financial Statements 2026 89
RESERVES
32 | Share-based payment reserve |
2026 | 2025 | 2024 | |||||||
for the year ended 30 June | | Note | | Rm | | Rm | | Rm | |
During the year, the following share-based payment expense was recognised in the income statement relating to the equity-settled share-based payment schemes: |
| |
| |
| |
| | |
Long-term incentives |
| 32.1 |
| |
| |
| | |
Sasol Khanyisa Employee Share Ownership Plan (ESOP): Tier 2 – Qualifying employees | 32.2 | | | | |||||
Equity-settled – recognised directly in equity |
|
| |
| |
| | ||
32.1 | Sasol 2022 Long-term incentive plan |
The objective of the Sasol Long-term Incentive (LTI) plans is to provide qualifying senior employees the opportunity of receiving an incentive linked to the value of Sasol Limited ordinary shares and to align the interest of participants with the interest of shareholders. The LTI plans allow certain senior employees to earn variable pay in the form of a long-term incentive amount subject to the achievement of vesting conditions. Vesting conditions include a service period and targets relating to return on invested capital, the Southern African breakeven oil price, the International Chemicals EBITDA margin, net debt reduction and a holistic focus on ESG matters and relative total shareholder return measured against a defined peer group. Allocation of the LTI award is linked to the role category of the individual and performance of the Group and subject to line manager discretion. Participants earn dividend equivalent LTI awards over the vesting period on the awarded LTI units after adjusting for corporate performance targets (CPTs).
LTIs which have not yet vested will lapse on resignation. On death, unvested LTIs vest immediately. There is no service penalty or early vesting under the latest (2022) LTI plan rules in respect of good leavers who have been employed for more than
Sasol Annual Financial Statements 2026 90
32 | Share-based payment reserve continued |
32.1 | Sasol 2022 Long-term incentive plan continued |
The maximum number of shares issued under the 2022 plan may not exceed
On 20 August 2025, the Remuneration Committee approved the once-off settlement to a maximum of R
| 2026 | | 2025 | | 2024 | |
for the year ended 30 June | Rm | Rm | Rm | |||
Cash settled share-based payment liability | ||||||
During the year, the following share-based payment expense was reclassified from an equity-settled to a cash-settled share-based payment scheme: |
| |
| |
| |
Liability raised¹ |
| |
| — |
| — |
Liability paid |
| ( |
| — |
| — |
Closing Balance of cash-settled share-based payment liability |
| — |
| — |
| — |
| 1 | The final number of shares to be settled in cash could only be determined once employees had elected whether to sell their shares upon vesting. Accordingly, at the modification date of 20 August 2025, the cash-settled portion was estimated based on the expected elections, subject to the R |
Weighted average | ||||
Number of | fair value | |||
Movements in the number of cash settled incentives | | incentives | | Rand |
Balance at 30 June 2025 | — | — | ||
LTIs reclassified to a cash-settled share-based payment** | | |||
LTIs exercised |
| ( |
| |
Effect of CPTs and LTIs forfeited |
| ( |
| |
Balance at 30 June 2026* |
| — |
| — |
| * |
**Weighted average fair value at modification date on 20 August 2025.
Sasol Annual Financial Statements 2026 91
32 | Share-based payment reserve continued |
32.1 | Sasol 2022 Long-term incentive plan continued |
| | Weighted average | ||
Number of | fair value | |||
Movements in the number of equity incentives outstanding | incentives | Rand | ||
Balance at 30 June 2024* |
| |
| |
LTIs granted |
| |
| |
LTIs exercised |
| ( |
| |
Effect of CPTs and LTIs forfeited |
| ( |
| |
Balance at 30 June 2025* |
| |
| |
LTIs granted |
| |
| |
LTIs exercised | ( | |||
LTIs reclassified to a cash-settled share-based payment** |
| ( |
| |
Effect of CPTs and LTIs forfeited |
| ( |
| |
Balance at 30 June 2026* |
| |
|
* | The incentives outstanding as at 30 June 2026 have a weighted average remaining vesting period of years (30 June 2025: years). The exercise price of these options is R |
** | Weighted average fair value at grant date on 6 September 2022. |
2026 | 2025 | |||
for year ended 30 June | | Rand | | Rand |
Average weighted market price of Equity Settled LTIs vested |
|
|
Average fair value of incentives granted | | | 2026 | | 2025 | |
Model |
| Monte-Carlo |
| Monte-Carlo | ||
Risk-free interest rate – Rand |
| (%) |
|
| ||
Risk-free interest rate – US$ |
| (%) |
|
| ||
Expected volatility |
| (%) |
|
| ||
Expected dividend yield |
| (%) |
|
| ||
Expected forfeiture rate |
| (%) |
|
| ||
Expected vesting percentage | (%) | |||||
Vesting period – top management |
|
| ||||
Vesting period – all other participants |
|
|
Accounting policies:
The equity-settled schemes allow certain employees the right to receive ordinary shares in Sasol Limited after a prescribed period. Such equity-settled share-based payments are measured at fair value at the date of the grant. The fair value determined at the grant date of the equity-settled share-based payments is charged as employee costs, with a corresponding increase in the share-based payment reserve, on a straight-line basis over the period that the employees become unconditionally entitled to the shares, based on management’s estimate of the shares that will vest and adjusted for the effect of non-market-based vesting conditions. These equity-settled share-based payments are not subsequently revalued.
Areas of judgement:
The valuation of the share-based payment expense requires a significant degree of judgement to be applied by management.
The risk-free rate for periods within the contractual term of the rights is based on the Rand and US$ swap curve in effect at the time of the valuation of the grant.
The expected volatility in the value of the rights granted is determined using the historical volatility of the Sasol share price.
Sasol Annual Financial Statements 2026 92
32 | Share-based payment reserve continued |
32.1 | Sasol 2022 Long-term incentive plan continued |
The expected dividend yield of the rights granted is determined using expected dividend payments of the Sasol ordinary shares.
The overall expected vesting percentage takes into consideration service, market and non-market conditions.
32.2 | The Sasol Khanyisa share transaction |
Sasol Khanyisa was implemented on 1 June 2018. Sasol Khanyisa has been designed to comply with the revised B-BBEE legislation in South Africa and seeks to ensure ongoing and sustainable B-BBEE ownership credentials for Sasol Limited.
Sasol Khanyisa contains a number of elements structured at both a Sasol Limited and at a subsidiary level, Sasol South Africa Limited (SSA) which is a wholly-owned subsidiary of Sasol Limited and houses the majority of the Group’s South African operations. Sasol Khanyisa Tier 1 was concluded in 2021.
At the end of
Sasol BEE ordinary shares can only be traded between Black Persons on the Empowerment Segment of the JSE. This transaction will therefore ensure evergreen B-BBEE ownership credentials for Sasol Limited.
Remaining component of the transaction: Tier 2 — SSA qualifying employees
Qualifying Black employees participate via the Khanyisa Employee Share Ownership plan (Khanyisa ESOP) through a beneficial interest, funded wholly by Sasol (vendor funding), in approximately
The Tier 2 options have a staggered vesting period with portions vesting from
Accounting policies:
To the extent that an entity grants shares or share options in a BEE transaction and the fair value of the cash and other assets received is less than the fair value of the shares or share options granted, such difference is charged to the income statement in the period in which the transaction becomes effective. Where the BEE transaction includes service conditions, the difference will be charged to the income statement over the period of these service conditions. Trickle dividends paid to participants during the transaction term are taken into account in measuring the fair value of the award.
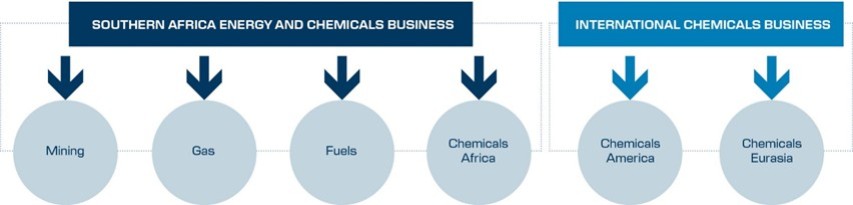
Sasol Annual Financial Statements 2026 93
32 | Share-based payment reserve continued |
32.2 | The Sasol Khanyisa share transaction continued |
Areas of judgement:
The measurement of the Khanyisa SSA share based payment is subject to estimation and judgement, as there are a number of variables affecting the Monte-Carlo option pricing model used in the calculation of the share based payment. The value of the share based payment is determined with reference to the extent the fair value of SSA and any dividends declared by SSA are expected to exceed any outstanding vendor financing at the end of the transaction period.
| ● | Equity value attributable to participants: |
The value attributable to the participants by virtue of their shareholding in SSA was calculated with reference to the expected future cash flows and budgets of the SSA Group. The underlying macroeconomic assumptions utilised for this valuation are based on latest forecast and estimates and include brent crude oil prices, Rand/US$ exchange rates and pricing assumptions.
| ● | Forecasted dividend yield: |
The forecasted dividend yield of the SSA Group was calculated based on a benchmarked EBITDA multiple, and the available free cash flow anticipated over the term of the transaction of
| ● | Other assumptions: |
Impacts of non-transferability and appropriate minority and liquidity discounts have also been taken into account. Discount rates applied incorporate the relevant debt and equity costs of the Group, and are aligned to the WACC rates for the entity.
| ● | A zero-coupon Rand interest rate swap curve was constructed and utilised as an appropriate representation of a risk-free interest rate curve. |
| ● | A Rand prime interest rate curve was estimated utilising the historical Rand Prime Index and the 3 month Johannesburg Interbank Agreed Rate. |
Sasol Annual Financial Statements 2026 94
OTHER DISCLOSURES
33 | Contingent liabilities |
33.1 | Litigation |
Sasol Oil (Pty) Ltd/SFT Energy (Pty) Ltd Claim
Sasol Oil entered into an agreement for the supply of various product grades with SFT Energy. The duration of the agreement was 6 months, from July 2023 to December 2023. Sasol Oil agreed to supply ULP95, ULP93, Diesel and Illuminating Paraffin to SFT Energy. However, the claim from SFT Energy is only in relation to the supply of Diesel. As part of the agreement, a particular volume of Diesel to be supplied by Sasol Oil was agreed with SFT Energy.
SFT Energy has served two summonses on Sasol Oil, each with their distinct cause of action:
Claim 1
SFT Energy alleges that Sasol Oil breached the agreement in that for each month during the duration of the agreement, they placed Diesel orders and Sasol Oil reduced the volumes of supply without prior notice to them. In addition SFT Energy alleges that Sasol Oil failed to formally notify SFT Energy of the events which resulted in Sasol Oil’s inability to supply the Diesel as required in terms of the agreement.
Based on the alleged breach of the supply agreement SFT Energy is claiming damages of R
Sasol Oil is defending the claim and the matter is ongoing.
Claim 2
In terms of the second claim, SFT Energy is claiming damages of R
Sasol Oil is defending the matter and is challenging the adequacy of SFT’s particulars of claim on the basis that they do not disclose a cause of action. SFT opposed the application. The matter is ongoing.
It should be noted that the claims from SFT Energy are consequential/indirect in nature and the agreement has a limitation of liability clause which limits all claims in terms of the agreement only to direct damages.
Sasol Annual Financial Statements 2026 96
33 | Contingent liabilities continued |
33.1 | Litigation continued |
Legal review of Sasol Gas National Energy Regulator of South Africa (NERSA) maximum price decision (March 2013, November 2017 and July 2021)
Following the legal review applications in terms of which the 2013 and 2017 NERSA Maximum Gas Price (MGP) decisions were overturned, NERSA in 2020 adopted a MGP Methodology in terms of which MGP for Sasol Gas is determined with reference to international benchmark prices. Pursuant to the Sasol Gas price application submitted to NERSA in December 2020, NERSA, on 6 July 2021 published its MGP decision in which it approved MGPs for Sasol Gas for the period from 2014 up to 2021 and determined how the maximum gas prices are to be determined for 2022 and 2023. With effect from 1 September 2021 Sasol Gas adopted a revised actual gas price methodology in terms of its supply agreements with customers in order to comply with the 2021 NERSA MGP decision.
In December 2021 the Industrial Gas Users Association of Southern Africa (IGUA-SA) launched a legal review application in which it seeks to overturn the 2021 NERSA MGP decision that approved MGPs for Sasol Gas for the period from 2014 – 2023. Both NERSA and Sasol Gas opposed this further litigation. The matter was heard by the High Court in May 2023. On 20 June 2024 the court handed down its decision to grant the review application. In its order the court overturned the 2021 NERSA MGP decision and remitted the matter back to NERSA to take a new MGP decision. Sasol Gas brought an application for leave to appeal the decision by the High Court, which application was granted on 2 June 2025. The appeal will now proceed to the Supreme Court of Appeal and a hearing date for the appeal will be set in due course. An adverse outcome in this litigation could potentially lead to liability on the part of Sasol Gas, the extent of which is undeterminable as at 30 June 2026.
Competition Commission referral to Competition Tribunal of Gas Price complaints
During 2022 certain customers of Sasol Gas submitted complaints to the Competition Commission relating to alleged pricing conduct prohibited by the South African Competition Act, 1998 (Act No 89 of 1998). Sasol Gas launched a review application in the Competition Appeal Court to overturn the decisions by the Competition Commission relating to its investigation of the complaints as it relates to the gas prices because in terms of the Gas Act, NERSA is the industry regulator with the applicable jurisdiction for the regulation of gas prices in the South African piped gas market as long as there is inadequate competition in the market. This application was dismissed by the Competition Appeal Court (CAC) and the Constitutional Court dismissed the Sasol Gas application for leave to appeal the decision of the CAC. The referral on 10 July 2023 by the Competition Commission of the price complaints will proceed before the Competition Tribunal. The exchange of pleadings in the referral has closed. The parties are exchanging pleadings in relation to NERSA’s application to intervene in the referral. No hearing date has been set for the intervention application or the referral.
Other litigation matters
From time to time, Sasol companies are involved in other litigation and similar proceedings in the normal course of business.
A detailed assessment is performed on each matter and a provision is recognised where appropriate. Although the outcome of these proceedings and claims cannot be predicted with certainty, the Company does not believe that the outcome of any of these cases would have a material effect on the Group’s financial results.
Sasol Annual Financial Statements 2026 97
33 | Contingent liabilities continued |
33.2Competition matters
Sasol continuously evaluates its compliance programmes and controls in general, including its competition law compliance programmes and controls. As a consequence of these compliance programmes and controls, including monitoring and review activities, Sasol has adopted appropriate remedial and/or mitigating steps, where necessary or advisable, lodged leniency applications and made disclosures on material findings as and when appropriate. These ongoing compliance activities have already revealed, and may still reveal, competition law contraventions or potential contraventions in respect of which we have taken, or will take, appropriate remedial and/or mitigating steps including lodging leniency applications.
33.3Environmental orders
Sasol’s environmental obligation accrued at 30 June 2026 was R
34 | Related parties |
34.1 | Transactions with related parties |
Group companies, in the ordinary course of business, entered into various purchase and sale transactions with associates and joint ventures. The effect of these transactions is included in the financial performance and results of the Group. Amounts owing (after eliminating intercompany balances) to related parties are disclosed in the respective notes to the financial statements for those statement of financial position items.
Except for the Group’s interests in joint ventures and associates, there are
Sasol Annual Financial Statements 2026 98
34 | Related party continued |
34.2 | Key management remuneration |
Key management comprises Directors and members of the Group Executive Committee (GEC), who have been determined to be Prescribed Officers of Sasol Limited.
Executive directors’ remuneration and benefits
| S Baloyi4 |
| WP Bruns4,5 |
| VD Kahla |
| HA Rossouw6 | |||||||||
| 2026 |
| 2025 |
| 2026 |
| 2025 |
| 2026 |
| 2025 |
| 2026 |
| 2025 | |
Executive Directors | | R’000 | | R’000 | | R’000 | | R’000 | | R’000 | | R’000 | | R’000 | | R’000 |
Salary |
| |
| |
| | |
| |
| |
| — |
| | |
Risk and Retirement funding |
| |
| |
| | |
| |
| |
| — |
| | |
Vehicle benefit |
| |
| |
| — | — |
| — |
| — |
| — |
| — | |
Healthcare |
| |
| |
| | |
| |
| |
| — |
| — | |
Other benefits1 |
| |
| |
| | |
| |
| |
| — |
| — | |
Total salary and benefits |
| |
| |
| | |
| |
| |
| — |
| | |
Annual short-term incentive2 | | | | | | | — | — | ||||||||
Long-term incentive gains3 |
| |
| |
| | |
| |
| |
| — |
| — | |
Total annual remuneration* |
| |
| |
| | |
| |
| |
| — |
| | |
*The total annual remuneration of the executive directors for 2024 was R
| 1 | Other Benefits include security services, long service awards, private travel and other once off costs on which fringe benefit tax is levied where required. |
| 2 | Short-term incentives approved based on the Group results for 2026 and payable in the 2027 financial year. Incentives are calculated as a percentage of total guaranteed package/base salary as at 30 June 2026 x role category % x [(Group STI achievement x |
| 3 | Long-term incentives gains for 2026 includes the Renewable energy (RE) grant awards made during financial year 2021 (where measurement was postponed to a day no later than 31 December 2026), the annual and retention (Mr Bruns) awards made in August 2023 and EVP Restricted (RLTI) award made in September 2021. The illustrative amount is calculated in terms of the number of LTIs x Corporate performance target achieved where relevant (RLTI and RE: |
| 4 | The Remuneration Committee approved market-related salary adjustments, where appropriate and in line with the Policy, in addition to annual salary increases, to support the continued competitiveness of the Group’s remuneration structure. |
| 5 | Mr Bruns was appointed as CFO from 1 September 2024. The disclosed prior year remuneration is thus apportioned. |
| 6 | Mr Rossouw stepped down as executive director and CFO effective 31 August 2024. All unvested LTIs were forfeited upon his resignation. |
Sasol Annual Financial Statements 2026 99
34 | Related party continued |
34.2Key management remuneration continued
Executive directors’ unvested LTI holdings (number and intrinsic value) for 2026 | ||||||||||||
| S Baloyi |
| WP Bruns | VD Kahla | ||||||||
|
| Intrinsic |
| Intrinsic |
| Intrinsic | ||||||
Number | value1 | Number | | value1 | | Number | | value1 | ||||
Executive Directors | | | R’000 | | R’000 | | R’000 | |||||
Balance at beginning of the year* |
| |
| |
| | | |
| | ||
Awards granted2 |
| |
| |
| | | |
| | ||
Change in value1 |
| — |
| |
| — | | — |
| | ||
Effect of corporate performance targets |
| ( |
| ( |
| ( | ( | ( |
| ( | ||
Dividend equivalents |
| |
| |
| | | |
| | ||
Awards settled3 |
| ( |
| ( |
| ( | ( | ( |
| ( | ||
Balance at the end of the year4 |
| |
| |
| | | |
| | ||
*The total intrinsic value of the executive directors' unvested LTI holdings for 2024 was R
| 1 | Intrinsic values at the beginning and end of the year have been determined using the closing price of: |
30 June 2026 R
30 June 2025 R
Change in intrinsic value for the year results from changes in the share price.
| 2 | LTIs granted on 8 September 2025. |
| 3 | Long-term incentives settled represent long-term incentives that vested with reference to the group results for 2025 that was settled in the 2026 financial year. The full amount of the remaining |
| 4 | The balance includes |
Sasol Annual Financial Statements 2026 100
34 | Related party continued |
34.2Key management remuneration continued
Prescribed Officers’ remuneration and benefits
V Bester4 | AGM Gerber5 | C Herrmann5,6 | AT Makgala7 | |||||||||||||
2026 | 2025 | 2026 | 2025 | 2026 | 2025 | 2026 | 2025 | |||||||||
Prescribed Officers | | R’000 | | R’000 | | R’000 | | R’000 | | R’000 | | R’000 | | R’000 | | R’000 |
Salary |
| |
| |
| |
| |
| |
| |
| |
| — |
Risk and Retirement funding |
| |
| |
| |
| |
| |
| |
| |
| — |
Vehicle benefit |
| — |
| — |
| |
| |
| |
| |
| — |
| — |
Healthcare |
| |
| |
| |
| |
| |
| |
| |
| — |
Other benefits1 |
| |
| |
| |
| |
| |
| |
| |
| — |
Total salary and benefits |
| |
| |
| |
| |
| |
| |
| |
| — |
Annual short-term incentive2 |
| |
| |
| |
| |
| |
| |
| |
| — |
Long-term incentive gains3 |
| |
| |
| — |
| — |
| |
| |
| — |
| — |
Total annual remuneration* |
| |
| |
| |
| |
| |
| |
| |
| — |
*The total annual remuneration of the prescribed officers for 2024 was R
| 1 | Other Benefits include security services, long service awards, private travel and other once off costs on which fringe benefit tax is levied where required. |
| 2 | Short-term incentives approved based on the Group results for 2026 and payable in the 2027 financial year. Incentives are calculated as a percentage of total guaranteed package/base salary as at 30 June 2026 x role category % x [(Group STI achievement x |
| 3 | Long-term incentives gains for 2026 includes the Renewable energy (RE) grant awards made during financial year 2021 (where measurement was postponed to a day no later than 31 December 2026), the annual and on-appointment awards made in 2023 and EVP Restricted (RLTI) award made in September 2021. The illustrative amount is calculated in terms of the number of LTIs x Corporate performance target achieved where relevant (RLTI and RE: |
| 4 | The Remuneration Committee approved market-related salary adjustments, where appropriate and in line with the Policy, in addition to annual salary increases, to support the continued competitiveness of the Group's remuneration structure. |
| 5 | Ms Gerber and Mr Herrmann are employed on German employment contracts and paid in Euros. The conversion to Rand has been done using the monthly average of daily closing rates. |
| 6 | Expatriate benefits in South Africa are offered and grossed up as appropriate. Other Benefits include accommodation, home leave allowance and transportation offered under the Expatriation policy. |
| 7 | Ms Makgala was appointed as EVP: People, SHE, Risk and Corporate Affairs on 1 October 2025. Other Benefits include a staggered buy-out arrangement in respect of incentives forfeited (R |
Sasol Annual Financial Statements 2026 101
34 | Related party continued |
34.2Key management remuneration continued
CK Mokoena4 | SD Pillay5 | S Siyaya6 | H Wenhold7 | |||||||||||||
2026 | 2025 | 2026 | 2025 | 2026 | 2025 | 2026 | 2025 | |||||||||
Prescribed Officers | | R'000 | | R'000 | | R’000 | | R’000 | | R’000 | | R’000 | | R’000 | | R’000 |
Salary |
| |
| |
| |
| |
| |
| — |
| |
| |
Risk and Retirement funding |
| — |
| |
| |
| |
| |
| — |
| — |
| |
Vehicle benefit |
| — |
| — |
| |
| |
| — |
| — |
| — |
| — |
Healthcare |
| |
| |
| |
| |
| |
| — |
| |
| |
Other benefits1 |
| |
| |
| |
| |
| |
| — |
| |
| |
Total salary and benefits |
| |
| |
| |
| |
| |
| — |
| |
| |
Annual short-term incentive2 |
| |
| |
| |
| |
| |
| — |
| |
| |
Long-term incentive gains3 |
| |
| |
| |
| |
| |
| — |
| |
| |
Total annual remuneration* |
| |
| |
| |
| |
| |
| — |
| |
| |
*The total annual remuneration of the prescribed officers for 2024 was R
| 1 | Other Benefits include security services, long service awards, private travel and other once off costs on which fringe benefit tax is levied where required. |
| 2 | Short-term incentives approved based on the Group results for 2026 and payable in the 2027 financial year. Incentives are calculated as a percentage of total guaranteed package/base salary as at 30 June 2026 x role category % x [(Group STI achievement x |
| 3 | Long-term incentives gains for 2026 includes the Renewable energy (RE) grant awards made during financial year 2021 (where measurement was postponed to a day no later than 31 December 2026), the annual and on-appointment awards made in 2023 and EVP Restricted (RLTI) award made in September 2021. The illustrative amount is calculated in terms of the number of LTIs x Corporate performance target achieved where relevant (RLTI and RE: |
| 4 | Ms Mokoena stepped down as prescribed officer on 30 September 2025 after reaching the Sasol retirement age for group executives. |
| 5 | The Remuneration Committee approved market-related salary adjustments, where appropriate and in line with the Policy, in addition to annual salary increases, to support the continued competitiveness of the Group's remuneration structure. |
| 6 | Mr Siyaya was appointed as EVP: Mining on 1 September 2025. Remuneration is disclosed for the period since appointment. |
| 7 | Mr Wenhold stepped down as a prescribed officer on 31 August 2025 after reaching the Sasol retirement age for group executives. |
Sasol Annual Financial Statements 2026 102
34 | Related party continued |
34.2Key management remuneration continued
Prescribed Officers’ unvested LTI holdings (number and intrinsic value) for 2026
V Bester | AGM Gerber | C Herrmann | AT Makgala5 | |||||||||||||
Intrinsic | Intrinsic | Intrinsic | Intrinsic | |||||||||||||
Number | value1 | Number | value1 | Number | value1 | Number | value1 | |||||||||
Prescribed Officers | | | R'000 | | | US$’000 | | | US$'000 | | | R’000 | ||||
Balance at beginning of the year* |
| |
| |
| |
| |
| |
| |
| — |
| — |
Awards granted2 |
| |
| |
| |
| |
| |
| |
| |
| |
Change in value1 |
| — |
| |
| — |
| |
| — |
| |
| — |
| |
Effect of corporate performance targets |
| ( |
| ( |
| — |
| — |
| ( |
| ( |
| — |
| — |
Dividend equivalents |
| |
| |
| — |
| — |
| |
| |
| — |
| — |
Awards settled3 |
| ( |
| ( |
| — |
| — |
| ( |
| ( |
| — |
| — |
Balance at the end of the year4 |
| |
| |
| |
| |
| |
| |
| |
| |
*The total intrinsic value of the prescribed officers' unvested LTI holdings for 2024 was R
| 1 | Intrinsic values at the beginning and end of the year have been determined using the closing price of: |
30 June 2026 R
30 June 2025 R
Change in intrinsic value for the year results from changes in the share price.
| 2 | LTIs granted on 8 September 2025 and 28 November 2025. |
| 3 | Long-term incentives settled represent long-term incentives that vested with reference to the group results for 2025 that was settled in the 2026 financial year. The full amount of the remaining |
| 4 | The balance includes |
| 5 | Ms Makgala was appointed on 1 October 2025 as EVP: People, SHE, Risk and Corporate Affairs. |
Sasol Annual Financial Statements 2026 103
34 | Related party continued |
34.2Key management remuneration continued
| CK Mokoena5 | | S Pillay | S Siyaya6 | | H Wenhold7 | ||||||||||
| Number | | Intrinsic value1 | | Number | | Intrinsic value1 | | Number | | Intrinsic value1 | | Number | | Intrinsic value1 | |
Prescribed Officers | R’000 | R’000 | | | R’000 | | | R’000 | ||||||||
Balance at beginning of the year* |
| |
| |
| | | — |
| — |
| |
| | ||
Awards granted2 |
| — |
| — |
| | | |
| |
| — |
| — | ||
Change in value1 |
| — |
| |
| — | | — |
| |
| — |
| | ||
Effect of corporate performance targets |
| — |
| — |
| ( | ( | ( |
| ( |
| — |
| — | ||
Dividend equivalents |
| — |
| — |
| | | |
| |
| — |
| — | ||
Awards settled3 |
| — |
| — |
| ( | ( | ( |
| ( |
| — |
| — | ||
Effect of changes in Prescribed Officers | ( | ( | — | — | | | ( | ( | ||||||||
Balance at the end of the year4 |
| — |
| — |
| | | |
| |
| — |
| — | ||
*The total intrinsic value of the prescribed officers' unvested LTI holdings for 2024 was R
| 1 | Intrinsic values at the beginning and end of the year have been determined using the closing price of: |
30 June 2026 R
30 June 2025 R
Change in intrinsic value for the year results from changes in the share price.
| 2 | LTIs granted on 8 September 2025 and 28 November 2025. |
| 3 | Long-term incentives settled represent long-term incentives that vested with reference to the group results for 2025 that was settled in the 2026 financial year. The full amount of the remaining |
| 4 | The balance includes |
| 5 | Ms Mokoena resigned from Sasol on 30 September 2025. |
| 6 | Mr Siyaya was appointed on 1 September 2025 as EVP: Mining. |
| 7 | Mr Wenhold resigned from Sasol on 30 August 2025. |
Sasol Annual Financial Statements 2026 104
34 | Related party continued |
34.2Key management remuneration continued
The total IFRS 2 charge for the year for LTI’s awarded to the Executive Directors and the Prescribed Officers in 2026 amounted to R
Non-executive Directors’ remuneration
| | | | | | | | | | |
Lead | ||||||||||
Board | independent | |||||||||
meeting | Director | Committee | Total1 | Total1 | ||||||
fees2 | fees2 | fees2 | 2026 | 2025 | ||||||
Non-executive Directors | R'000 | R'000 | R'000 | R'000 | R'000 | |||||
MBN Dube (Chairman) |
| |
| — |
| — |
| |
| |
M Flöel (Lead Independent Director)3 |
| |
| |
| |
| |
| |
KC Harper4 |
| |
| — |
| |
| |
| |
DGP Eyton5 |
| |
| — |
| |
| |
| |
MJ Cuambe6 |
| |
| — |
| |
| |
| |
GMB Kennealy |
| |
| — |
| |
| |
| |
S Subramoney |
| |
| — |
| |
| |
| |
NX Maluleke7 | | — | | | — | |||||
R Gasant8 | | — | | | — | |||||
TJ Cumming9 | — | — | — | — | | |||||
NNA Matyumza10 | — | — | — | — | | |||||
MEK Nkeli11 |
| — |
| — |
| — |
| — |
| |
Total |
| |
| |
| |
| |
| |
| 1 | Fees exclude VAT. |
| 2 | Board and Committee fees are denominated in US dollars and are therefore subject to fluctuations in foreign exchange rates. For Non-Executive Directors permanently resident outside Europe, the United Kingdom and North America, the Rand/US$ exchange rate applicable to Board and Committee fees was fixed for the first half of 2026 using the average exchange rate for the period July 2023 to December 2024. The exchange rate applicable to the second half of 2026 was fixed using the average exchange rate for the period July 2024 to December 2025. In addition, a cost-of-living adjustment is applied to the fees of these directors. |
To reduce the impact of currency volatility on Non-Executive Directors permanently resident in Europe, the United Kingdom and North America, the US$/EUR and US$/GBP exchange rates applicable to Board and Committee fees were fixed for quarter 2, quarter 3 and quarter 4 using the prevailing average exchange rates at the time the fees were approved. The approved fee values were thereafter converted to US dollars for payment.
| 3 | Dr Flöel was appointed as Remuneration Committee Chairman and stepped down from the Capital Investment Committee Chairman role, effective 6 June 2025 while remaining a member of Capital Investment Committee. |
Sasol Annual Financial Statements 2026 105
34 | Related party continued |
34.2Key management remuneration continued
| 4 | Ms Harper resigned from the Board on 16 February 2026 and received pro rated Board and Committee fees for quarter 3. |
| 5 | Mr Eyton stepped down as a member of the Audit and Risk Committee, effective 1 June 2026 and received pro rated committee fees for quarter 4. |
| 6 | Mr Cuambe was appointed as the Chairman of the Capital Investment Committee, on 6 June 2025. He stepped down as a member of the Safety, Social and Ethics Committee on 22 August 2025 and received pro rated committee fees for quarter 1. |
| 7 | Ms Maluleke was appointed to the Board effective 9 June 2025, received Sasol Limited Board fees from 1 July 2025, and was appointed to the Audit and Risk, and Safety, Social and Ethics Committees, on 22 August 2025. |
| 8 | Mr Gasant was appointed to the Board on 1 February 2026 and received a pro-rated Board fee. He was appointed to the Audit and Risk Committee and the Remuneration Committee on 1 June 2026 and received pro rated committee fee payments. |
| 9 | Mr Cumming resigned from the Board on 6 June 2025. |
| 10 | Ms Matyumza retired from the Board on 8 September 2024. |
| 11 | Ms Nkeli retired from the Board on 31 August 2024. |
Sasol Annual Financial Statements 2026 106
35 | Financial risk management and financial instruments |
35.1Financial instruments classification and fair value measurement
The following table shows the classification, carrying amounts and fair values of financial assets and financial liabilities, including their levels in the fair value hierarchy. When measuring the fair value of an asset or a liability, the Group uses observable market data as far as possible. Fair values are categorised into different levels in a fair value hierarchy based on the inputs used in the valuation techniques as follows:
Level 1Quoted prices in active markets for identical assets or liabilities.
Level 2Inputs other than quoted prices that are observable for the asset or liability (directly or indirectly).
Level 3Inputs for the asset or liability that are unobservable.
The carrying values of the long-term restricted cash, cash and cash equivalents, trade and other receivables, short-term debt and bank overdrafts, and trade and other payables are considered to be a reasonable approximation of their fair values.
| | Carrying | | | Carrying | | | |||||
value | Fair value | value | Fair value | Fair value | ||||||||
2026 | 2026 | 2025 | 2025 | hierarchy | ||||||||
Financial instrument | Note | Rm | Rm | Rm | Rm | of inputs | ||||||
Financial assets |
| |
| |
| |
| |
| |
| |
At amortised cost |
| |
| |
| |
| |
| |
| |
Long-term restricted cash4 |
| |
| |
| |
| |
| |
| |
Long-term receivables |
| 17 |
| |
| |
| |
| |
| Level 31 |
Trade and other receivables |
| 22 |
| |
| |
|
|
| |||
Cash and cash equivalents |
| 25 |
| |
| |
| |
| |
| |
At fair value through profit or loss |
| |
|
|
|
|
| | ||||
Long-term and short-term financial assets |
| |
| |
| |
| |
| |
| |
Commodity and currency derivative assets |
| |
| |
| |
| |
| |
| Level 2 |
Oxygen supply contract embedded derivative assets |
| |
| |
| |
| |
| |
| Level 3 |
Other short-term investments | | | | | Level 1 | |||||||
Other long-term investments4 | | | | | Level 12 | |||||||
Other receivables | 22 | | | | | Level 37 | ||||||
Designated at fair value through other comprehensive income |
| |
|
|
|
|
| | ||||
Investments in unlisted securities4 |
|
| |
| |
| |
| |
| Level 33 | |
Financial liabilities |
| |
| |
|
| |
| |
| | |
At amortised cost |
| |
| |
| |
| |
| |
| |
Total long-term debt |
| 13 |
| |
| |
| |
| |
| |
Listed long-term debt (US$ bonds)8 |
| |
| |
| |
| |
| |
| Level 12 |
Listed long-term debt (Rand bonds)5 | | | | | Level 22 | |||||||
Listed convertible bonds | | | | | Level 36 | |||||||
Unlisted long-term debt5 |
| |
| |
| |
| |
| |
| Level 31 |
Short-term debt and bank overdraft |
| |
| |
| |
| |
| |
| |
Trade and other payables |
| 23 |
| |
| |
| |
| |
| |
At fair value through profit or loss |
| |
|
|
|
|
| | ||||
Long-term and short-term financial liabilities |
| |
| |
| |
| |
| |
| |
Commodity and currency derivative liabilities |
| |
| |
| |
| |
| |
| Level 2 |
Convertible bond embedded derivative liability |
| |
| |
| |
| |
| |
| Level 3 |
Oxygen supply contract embedded derivative liabilities |
| |
| — |
| — |
| |
| |
| Level 3 |
| 1 | Determined with a discounted cash flow model using market related interest rates and credit risk spreads where applicable. |
Sasol Annual Financial Statements 2026 107
35 | Financial risk management and financial instruments continued |
35.1Financial instruments classification and fair value measurement continued
| 2 | Based on quoted market price for the same instrument. The Rand bonds have been classified as a level 2 fair value measurement due to the relatively low level of liquidity in the debt market. |
| 3 | Determined using discounted cash flows modelling forecasted earnings, capital expenditure and debt cash flows of the underlying business, based on the forecasted assumptions of inflation, exchange rates, commodity prices and an appropriate discount rate. |
| 4 | Presented as part of Other long-term investments in the Statement of financial position. |
| 5 | Carrying value includes unamortised loan costs. |
| 6 | The fair value of the amortised cost component of the US$ Convertible Bond is based on the quoted price of the instrument after separating the fair value of the derivative component. |
| 7 | The fair value of the contingent consideration receivable was determined by calculating the present value of the expected cash flows using a WACC rate that was adjusted for the Uzbekistan country risk premium. |
| 8 | A 2033 US$ bond of US$ |
There were no transfers between levels for recurring fair value measurements during the period. There was no change in valuation techniques compared to the previous financial period. For all other financial instruments, fair value approximates carrying value.
Other receivable - Contingent consideration from disposal of Uzbekistan GTL LLC
The other receivable is measured at fair value through profit or loss. The fair value at 30 June 2026 was R
| 2026 | | 2025 | |
for the year ended 30 June |
| Rm |
| Rm |
Balance at the beginning of the year | |
| — | |
Amounts recognised in remeasurement items affecting operating income | — | | ||
Proceeds on disposals of equity accounted investments* | ( | — | ||
Translation losses recognised in other operating expenses and income | ( |
| — | |
Balance at the end of the year |
| |
| |
*Payment received on 30 June 2026 relating to contingent consideration from the Uzbekistan GTL LLC disposal.
Sasol Annual Financial Statements 2026 108
35 | Financial risk management and financial instruments continued |
35.1Financial instruments classification and fair value measurement continued
Commodity and currency derivative assets and liabilities
Valued using forward rate interpolator model, appropriate currency specific discount curve, discounted expected cash flows and numerical approximation as appropriate. Significant inputs include forward exchange contracted rates, market foreign exchange rates, forward contract rates and market commodity prices such as crude oil prices.
Oxygen supply contract embedded derivative assets and liabilities
Relates to the US labour and inflation index and Rand/US$ exchange rate embedded derivatives contained in the SO long-term gas supply agreements. The following table reconciles the opening and closing balance of the net embedded derivative asset:
| 2026 | | 2025 | |
for the year ended 30 June | Rm | Rm | ||
Balance at the beginning of the year |
| |
| ( |
Amounts settled during the year | ( | ( | ||
Realised fair value gain recognised in other operating expenses and income | | — | ||
Unrealised fair value gain recognised in other expenses and income in operating profit | | | ||
Balance at the end of the year |
| |
| |
The fair value of the embedded derivative financial instrument contained in a long-term oxygen supply contract to our SO is impacted by a number of observable and unobservable variables at valuation date. The embedded derivative was valued using a forward rate interpolator model, discounted expected cash flows and numerical approximation, as appropriate. The table below provides a summary of the significant unobservable inputs applied in the valuation together with the expected impact on profit or loss as a result of reasonably possible changes thereto at reporting date, holding other inputs constant:
Increase/(decrease) in | ||||||||
profit or loss | ||||||||
Inputs | Change | 2026 | 2025 | |||||
Input | | applied | | in input | | Rm | | Rm |
Rand/US$ Spot price | R | +R | ( | ( | ||||
| (2025: R | -R1/US$ |
| |
| | ||
US$ Swap curve |
| + | |
| | |||
| (2025: | - | ( |
| ( | |||
Rand Swap curve |
| + | ( |
| ( | |||
| (2025: | - | |
| | |||
Convertible bond embedded derivative liability
Relates to the embedded derivative contained in the US$
| 2026 | | 2025 | |
for the year ended 30 June | Rm | Rm | ||
Balance at the beginning of the year |
| |
| |
Unrealised fair value loss/(gain) recognised in other expenses and income in operating profit |
| |
| ( |
Translation of foreign operations |
| ( |
| — |
Balance at the end of the year |
| |
| |
Sasol Annual Financial Statements 2026 109
35 | Financial risk management and financial instruments continued |
35.1Financial instruments classification and fair value measurement continued
The embedded derivative was valued using quoted bond market prices and binomial tree approach. Significant inputs include conversion price (US$
Increase/(decrease) in | ||||||||
profit or loss | ||||||||
Inputs | Change | 2026 | 2025 | |||||
Input | | applied | | in input | | Rm | | Rm |
Credit spread |
| + | ( |
| ( | |||
| (2025: | - | |
| | |||
Calibrated volatility | + | % | ( | ( | ||||
(2025: | - | % | | | ||||
* | A |
For purposes of the sensitivity analysis, the market value of the overall instrument was kept stable and so the actively changed variable (e.g., volatility) results in an offsetting change to the other (e.g. credit spread).
35.2 | Financial risk management |
The group is exposed in varying degrees to a number of financial instrument related risks. The Group Executive Committee (GEC) has the overall responsibility for the establishment and oversight of the Group’s risk management framework. The GEC established the Safety Committee, which is responsible for providing the GEC with the assurance that significant business risks are systematically identified, assessed and reduced to acceptable levels. A comprehensive risk management process has been developed to continuously monitor and assess these risks. Based on the risk management process Sasol refined its hedging policy and the Sasol Limited Board appointed a subcommittee, the Audit Committee, that meets regularly to review and, if appropriate, approve the implementation of hedging strategies for the effective management of financial market related risks.
The Group has a central treasury function that manages the financial risks relating to the Group’s operations.
Sasol Annual Financial Statements 2026 110
35 | Financial risk management and financial instruments continued |
35.2 | Financial risk management continued |
Capital allocation
The Group’s objectives when managing capital (which includes share capital, borrowings, working capital and cash and cash equivalents) is to maintain a flexible capital structure that reduces the cost of capital to an acceptable level of risk and to safeguard the Group’s ability to continue as a going concern while taking advantage of strategic opportunities in order to grow shareholder value sustainably.
The Group manages the capital structure and makes adjustments to it in light of changes in economic conditions and the risk characteristics of the underlying assets. In order to maintain the capital structure, the Group may adjust the amount of dividends paid to shareholders, return capital to shareholders, repurchase shares currently issued, issue new shares, issue new debt, issue new debt to replace existing debt with different characteristics and/or sell assets to reduce debt.
The Group monitors capital utilising a number of measures, including the gearing ratio (net debt to shareholders’ equity). Gearing takes into account the Group’s substantial capital investment and susceptibility to external market factors such as crude oil prices, exchange rates and commodity chemical prices. The Group’s gearing level for 2026 decreased to
Financing risk
Financing risk refers to the risk that financing of the Group’s debt requirements and refinancing of existing debt could become more difficult or more costly in the future. This risk can be decreased by managing the Group within tolerable debt levels measured by key ratios and the available capacity of the market for Sasol, maintaining an appropriate spread of maturities, and managing short-term borrowings within acceptable levels. Due to the Group's reliance on international Debt Capital Markets, the risk is impacted by non-controllable factors such as global geopolitical developments that impact, or restrict access to, international Debt Capital Markets.
Credit rating
Credit rating | ||||
Agency | 2026 | 2025 | ||
S&P | | BB+ (Negative) | | BB+ (stable) |
Moody’s |
| Ba1 (Negative) |
| Ba1 (Negative) |
On 14 October 2025, S&P affirmed Sasol’s rating at BB+ however changed the outlook from stable to negative. The outlook revision reflected S&P Global’ s expectation that Sasol's EBITDA will likely remain constrained, primarily due to persistently low oil and chemical prices driven by sustained supply-demand imbalances. On 5 March 2026, Moody’s affirmed Sasol’s rating at Ba1 and maintained the negative outlook, citing ongoing challenge in profitability and difficult market conditions. While Sasol benefits from its leading position in South Africa, integrated business model, prudent financial policies, and strong liquidity, it faces significant headwinds including weak industry performance, exposure to volatile oil and commodity prices, and high carbon transition risks.
Sasol Annual Financial Statements 2026 111
35 | Financial risk management and financial instruments continued |
35.2 | Financial risk management continued |
Risk profile
Risk management and measurement relating to each of these risks is discussed under the headings below (sub-categorised into credit risk, liquidity risk, and market risk) which entails an analysis of the types of risk exposure, the way in which such exposure is managed and quantification of the level of exposure in the statement of financial position.
Credit risk
Credit risk is the risk of financial loss due to counterparties not meeting their contractual obligations. Credit risk is deemed to be low when, based on the forward available information, it is highly probable that the customer will service its debt in accordance with the agreement throughout the period.
How we manage the risk
The risk is managed by the application of credit approvals, limits and monitoring procedures. All credit applications undergo a comprehensive assessment which includes an analysis of financial strength, country and industry risks as well as historic payment performance. Where appropriate, the group obtains security in the form of guarantees to mitigate risk, meaning that these receivables do not carry significant credit risk. Counterparty credit limits are in place and are reviewed and approved by the respective subsidiary credit management committees to manage our exposure to counterparty credit risk. The central treasury function provides credit risk management for the group-wide exposure in respect of a diversified group of banks and other financial institutions. These are evaluated regularly for financial robustness especially in the current global economic environment. Management has evaluated treasury counterparty risk and does not expect any treasury counterparties to fail in meeting their obligations. The group maximum exposure is the outstanding carrying amount of the financial asset. The credit risk is considered to be low as it is mitigated through various security types ranging from high-quality insurance and guarantees to lower-quality shareholder or director guarantees.
For all financial assets measured at amortised cost, the Group calculates the expected credit loss based on contractual payment terms of the asset. The exposure to credit risk is influenced by the individual characteristics, the industry and geographical area of the counterparty with whom we have transacted. Financial assets at amortised cost are carefully monitored and reviewed on a regular basis for expected credit loss and impairment based on our credit risk policy. Any provision for expected credit losses is considered to be immaterial as the credit risk is considered to be low.
Expected Credit Loss (ECL) is calculated as a function of probability of default, loss given default and exposure at default.
| ● | The group allocates probability of default based on external and internal information. The major portion of the financial assets at amortised cost consists of externally rated customers and the group uses the average of Moody’s, Fitch and S&P Corporate and Sovereign probability of defaults, depending on whether the customer or holder of the financial asset is corporate or government related. For customers or debtors that are not rated by a formal rating agency, the group allocates internal credit ratings and default rates taking into account forward looking information, based on the debtors profile, security or surety obtained and financial status. |
| ● | Loss given default (LGD) is based on the Basel model. World-wide, and especially in South Africa, economies have faced a series of global and local disruptions, including price volatility, elevated energy costs, high inflation, higher cost of debt, etc. As a result, the Group applied the Board of Governors of the Federal Reserve System’s formula to derive a downturn LGD to be used for 2026, namely |
Sasol Annual Financial Statements 2026 112
35 | Financial risk management and financial instruments continued |
35.2 | Financial risk management continued |
Trade receivables expected credit loss is calculated over lifetime. Lifetime ECLs are the ECLs that result from all possible default events over the expected life of the trade receivable. Other financial assets expected credit loss is measured over 12 months when the credit risk is low and over lifetime where the credit risk has increased significantly. The Group considers credit risk to have increased significantly when the customer’s credit rating has been downgraded to a lower grade (e.g. from Investment grade to Speculative grade). The group considers customers to be in default when the receivable is past due its standard credit terms. The contractual payment terms for receivables vary from
No single customer represents more than 10% of the Group’s total turnover or more than 10% of total trade receivables for the years ended 30 June 2026, 2025 and 2024. The majority of the Group’s turnover is generated from sales within South Africa, Europe, and the United States – refer to the Segment information. The geographical concentration of credit risk is largely aligned with the regions in which the turnover was earned.
A summary of the Group’s exposure to credit risk for trade, other and long-term receivables is as follows:
Trade receivables
Lifetime ECL | ||||||||||
Simplified | Simplified | Simplified | Credit- | |||||||
approach¹ | approach² | approach | impaired | Total | ||||||
Low risk | Medium risk | Total | High risk | lifetime ECL | ||||||
| Rm | | Rm | | Rm | | Rm | | Rm | |
2026 |
| |
| |
| |
| |
| |
Gross carrying amount |
| |
| |
| |
| |
| |
Expected credit loss | ( | ( | ( | ( | ( | |||||
2025 | ||||||||||
Gross carrying amount | |
| |
| |
| |
| | |
Expected credit loss |
| ( | ( | ( | ( | ( | ||||
1 | Simplified approach – low risk for trade receivables with no significant increase in credit risk since initial recognition. |
2 | Simplified approach – medium risk for trade receivables with significant increase in credit risk but not credit impaired. |
Sasol Annual Financial Statements 2026 113
35 | Financial risk management and financial instruments continued |
35.2 | Financial risk management continued |
Other receivables
| | 12-month | | | ||||||
Lifetime ECL | ECL | | ||||||||
No | ||||||||||
Significant | significant | |||||||||
increase in | increase in | |||||||||
credit risk | credit risk | |||||||||
since initial | Credit- | since initial | ||||||||
recognition1 | impaired2 | Total lifetime | recognition | |||||||
Medium risk | High risk | ECL | Low risk | Total | ||||||
| Rm | | Rm | | Rm | | Rm | | Rm | |
2026 |
| |
| |
| |
| |
| |
Gross carrying amount3 |
| |
| |
| |
| |
| |
Expected credit loss |
| ( |
| ( |
| ( |
| ( |
| ( |
2025 |
| |
| |
| |
| |
| |
Gross carrying amount |
| |
| |
| |
| |
| |
Expected credit loss |
| ( |
| ( |
| ( |
| ( |
| ( |
| 1 | Significant increase in credit risk since initial recognition but not credit impaired. |
| 2 | A significant balance has been fully provided for and this reflects management’s assessment that there is no reasonable expectation of recovery. |
| 3 | This gross carrying amount excludes financial assets classified as measured at fair value through profit or loss. |
Long-term receivables
12-month | ||||||||||
Lifetime ECL | ECL | |||||||||
No | ||||||||||
Significant | significant | |||||||||
increase in | increase in | |||||||||
credit risk | credit risk | |||||||||
since initial | Credit- | since initial | ||||||||
recognition | impaired | Total lifetime | recognition | |||||||
Medium risk | High risk | ECL | Low risk | Total | ||||||
| Rm | | Rm | | Rm | | Rm | | Rm | |
2026 |
| |
| |
| |
| |
| |
Gross carrying amount |
| |
| |
| |
| |
| |
Expected credit loss | ( | ( | ( | — | ( | |||||
2025 | ||||||||||
Gross carrying amount | | | | | | |||||
Expected credit loss |
| ( |
| ( |
| ( |
| ( |
| ( |
| 1 | Significant increase in credit risk since initial recognition but not credit impaired. |
The significant changes in the gross carrying amounts of trade, other and long term receivables that contributed to the changes in the expected credit loss during 2026 were mainly driven by the
| ● | substantial increase in product pricing following the Middle East conflict and its impact on global markets; |
| ● | higher sales activity and higher average days sales outstanding. |
Sasol Annual Financial Statements 2026 114
35 | Financial risk management and financial instruments continued |
35.2 | Financial risk management continued |
Liquidity risk
Liquidity risk is the risk that an entity in the Group will be unable to meet its obligations as they become due.
The global economic landscape remains volatile, including fluctuating oil and petrochemical prices, an unstable product demand environment and inflationary pressure. In South Africa, the underperformance of state-owned enterprises and socio-economic challenges continues to impact volumes, margins and resultant profitability.
How we manage the risk
The Group manages liquidity risk by effectively managing its working capital, capital expenditure and cash flows, making use of a central treasury function to manage pooled business unit cash investments and borrowing requirements. Currently the Group has a positive liquidity position, conserving the Group’s cash resources through continued focus on working capital improvement, cost savings and capital allocation (refer to note 13).
The Group meets its financing requirements through a mixture of cash generated from its operations and, short and long-term borrowings, and strives to maintains adequate banking facilities and reserve unutilised borrowing capacity. Adequate banking facilities and reserve borrowing capacities are maintained. The Group is in compliance with all of the financial covenants per its loan agreements, none of which are expected to present a material restriction on funding or its investment policy in the near future. The net debt to EBITDA (Sasol definition as defined in the debt agreements) at 30 June 2026 was
Protection of downside risk for the balance sheet was a key priority for the Group during volatile times, resulting in the execution of our hedging programme to address oil price and the Rand/US$ currency exposure.
Available facilities amounted to R
Sasol Annual Financial Statements 2026 115
35 | Financial risk management and financial instruments continued |
35.2 | Financial risk management continued |
Our exposure to and assessment of the risk
The maturity profile of the undiscounted contractual cash flows of financial instruments at 30 June were as follows:
| | Carrying | | Contractual | | Within one | | One to | | Three to | | More than | ||
amount | cash flows1 | year | three years | five years | five years | |||||||||
Note | Rm | Rm | Rm | Rm | Rm | Rm | ||||||||
2026 |
| |
| |
| |
| | |
| | |||
Financial assets |
| |
| |
| |
| | |
| | |||
Non-derivative instruments |
| |
| |
| |
| | |
| | |||
Long-term receivables |
| 17 |
| |
| |
| | | |
| | ||
Trade and other receivables |
| 22 |
| |
| |
| | — | — |
| — | ||
Cash and cash equivalents |
| 25 |
| |
| |
| | — | — |
| — | ||
Investments through other comprehensive income |
| |
| |
| |
| | — | — |
| — | ||
Long-term and short-term investments through profit or loss | | | | — | — | — | ||||||||
| |
| |
| | | |
| | |||||
Derivative instruments |
| |
| |||||||||||
Forward exchange contracts |
| |
| |||||||||||
Inflows |
| |
| | | | — | — |
| — | ||||
Outflows | — | ( | ( | — | — | — | ||||||||
Crude oil futures2 | | | | — | — | — | ||||||||
Foreign exchange zero cost collars |
| |
| | | | — | — |
| — | ||||
Put options – Rand/US$ currency |
| |
| | | | — | — |
| — | ||||
Put spread options – Brent crude oil | | | | — | — | — | ||||||||
Other commodity derivatives | | | | — | — | — | ||||||||
Oxygen supply contract embedded derivative | | | | | | | ||||||||
| |
| |
| | | |
| | |||||
Financial liabilities |
| |
| |||||||||||
Non-derivative instruments |
| |
| |||||||||||
Long-term debt3 |
| 13 |
| ( |
| ( |
| ( | ( | ( |
| ( | ||
Lease liabilities |
| 14 |
| ( |
| ( |
| ( | ( | ( |
| ( | ||
Short-term debt |
| 15 |
| ( |
| ( |
| ( | — | — |
| — | ||
Trade and other payables |
| 23 |
| ( |
| ( |
| ( | — | — |
| — | ||
Bank overdraft |
| 25 |
| ( |
| ( |
| ( | — | — |
| — | ||
| ( |
| ( |
| ( | ( | ( |
| ( | |||||
Derivative instruments |
| |
| |||||||||||
Forward exchange contracts |
| |
|
| ||||||||||
Outflows | ( | ( | ( | — | — | — | ||||||||
Inflows |
| |
| — |
| |
| | — | — |
| — | ||
Other commodity derivatives |
| |
| ( |
| ( |
| ( | — | — |
| — | ||
Put with a call spread option – Brent crude oil |
| |
| ( |
| ( |
| ( | — | — |
| — | ||
Convertible bond embedded derivative | ( | ( | ( | — | — | — | ||||||||
| ( |
| ( |
| ( | ( | ( |
| ( |
| 1 | Contractual cash flows include interest payments. |
| 2 | The crude oil futures generate cash inflows in respect of margin calls only once the related crude oil is processed. Accordingly, the future inflows relate to the open lots associated with the outstanding margin calls. |
3 | The repayment of the notional amount of the convertible bonds is included in the one to three years category, in line with the contractual maturity date, based on obtaining the requisite shareholder approval for the convertible bonds to be settled in Sasol ordinary shares. |
Sasol Annual Financial Statements 2026 116
35 | Financial risk management and financial instruments continued |
35.2 | Financial risk management continued |
Current financial assets are sufficient to cover financial liabilities for the next year. The shortfall beyond one year will be funded through cash generated from operations, utilisation of available facilities and the refinancing of existing debt.
| Carrying | | Contractual | | Within one | One to | | Three to | More than | |||
amount | cash flows1 | year | three years | five years | five years | |||||||
Rm | Rm | Rm | | Rm | Rm | Rm | ||||||
2025 |
| |
| |
| |
| | ||||
Financial assets |
| |
| |
| |
| | ||||
Non-derivative instruments |
| |
| |
| |
| | ||||
Long-term receivables |
| |
| |
| | | |
| | ||
Trade and other receivables |
| |
| |
| | — | — |
| — | ||
Cash and cash equivalents |
| |
| |
| | — | — |
| — | ||
Investments through other comprehensive income |
| |
| |
| | — | — |
| — | ||
Investments through profit or loss |
| | | | — | — | — | |||||
|
| |
| | |
| | | ||||
Derivative instruments |
|
|
|
| | |||||||
Forward exchange contracts |
| |||||||||||
Inflow2 | | | | — | — | — | ||||||
Outflow2 | — | ( | ( | — | — | — | ||||||
Crude oil put options |
| | | | — | — |
| — | ||||
Foreign exchange zero cost collars |
| | | | — | — | — | |||||
Oxygen supply contract embedded derivative | | ( | | | | ( | ||||||
|
| |
| | |
| | | ||||
Financial liabilities |
|
|
|
| | |||||||
Non-derivative instruments |
|
|
|
| | |||||||
Long-term debt3 |
| ( |
| ( |
| ( | ( | ( |
| ( | ||
Lease liabilities |
| ( |
| ( |
| ( | ( | ( |
| ( | ||
Short-term debt |
| ( |
| ( |
| ( | — | — |
| — | ||
Trade and other payables |
| ( |
| ( |
| ( | — | — |
| — | ||
Bank overdraft |
| ( |
| ( |
| ( | — | — |
| — | ||
( |
| ( |
| ( | ( |
| ( | ( | ||||
Derivative instruments |
| |
| |
| |
| | ||||
Forward exchange contracts |
| |||||||||||
Outflow2 | ( | ( | ( | — | — | — | ||||||
Inflow2 | — | | | — | — | — | ||||||
Other commodity derivatives | ( | ( | ( | — | — | — | ||||||
Oxygen supply contract embedded derivative |
| ( |
| |
| | — |
| — | — | ||
( |
| ( |
| ( | ( |
| ( | ( |
| 1 | Contractual cash flows include interest payments. |
| 2 | In the prior year, certain contractual cash flows relating to FECs were presented on a net basis. The comparative information has been revised to present these cash flows on a gross basis for FEC financial assets and financial liabilities. The revision is presentation-related only and has no impact on the Group's statement of financial position, income statement, statement of comprehensive income, statement of changes in equity or statement of cash flows. |
| 3 | The repayment of the notional amount of the convertible bonds is included in the one to three years category, in line with the contractual maturity date. The conversion rights are exercisable at any time. |
Sasol Annual Financial Statements 2026 117
35 | Financial risk management and financial instruments continued |
35.2 | Financial risk management continued |
Market risk
Market risk is the risk arising from possible market price movements and their impact on the future cash flows of the business. The Group’s financial market risk management objectives, which inform the hedging philosophy of the Group, are:
| ● | To prudently manage the Group’s financial market risks in order to reduce the financial impact due to adverse movements in market rates/prices (i.e. protect cash flows), contributing to Sasol meeting its strategic financial objectives and remaining within Sasol Ltd Board’s approved risk appetite and risk tolerance levels; and |
| ● | To reduce earnings and cash flow volatility in order to increase certainty and predictability for planning purposes. |
The Group is exposed to the following market price movements:
Foreign currency risk
Foreign currency risk is a risk that earnings and cash flows will be affected due to changes in exchange rates.
How we manage the risk
The Audit Committee sets broad guidelines in terms of tenor and hedge cover ratios specifically to assess future currency exposure, which have the potential to materially affect our financial position. These guidelines and our hedging policy are reviewed from time to time. This hedging strategy enables us to better forecast cash flows and thus manage our liquidity and key financial metrics more effectively. Foreign currency risks are managed through the Group’s hedging policy and financing policies and the selective use of various derivatives.
Our exposure to and assessment of the risk
The Group’s transactions are predominantly entered into in the respective functional currency of the individual operations. A large portion of our turnover and capital investments are significantly impacted by the Rand/US$ and Rand/EUR exchange rates. Some of our fuel products are governed by the Basic Fuel Price (BFP), of which a significant variable is the Rand/US$ exchange rate. Our export chemical products are mostly commodity products whose prices are largely based on global commodity and benchmark prices quoted in US dollars and consequently are exposed to exchange rate fluctuations that have an impact on cash flows. These operations are exposed to foreign currency risk in connection with contracted payments in currencies that are not in their individual functional currency. The most significant exposure for the Group exists in relation to the US dollar and the Euro. The translation of foreign operations to the presentation currency of the Group is not taken into account when considering foreign currency risk.
Zero-cost collars and Put options
In line with the risk mitigation strategy, the Group hedges a portion of its estimated foreign currency exposure in respect of forecast sales and purchases. The Group mainly uses zero-cost collars and put to hedge its currency risk, most of the current hedges mature within
Forward exchange contracts
Forward exchange contracts (FECs) are utilised throughout the Group to economically hedge the risk of currency depreciation on committed and highly probable forecast transactions. Transactions hedged with FECs include capital and goods purchases (imports) and sales (exports).
Refer to the summary of our derivatives below.
Sasol Annual Financial Statements 2026 118
35 | Financial risk management and financial instruments continued |
35.2Financial risk management continued
The following significant exchange rates were applied during the year:
Average rate | Closing rate | |||||||
| 2026 | | 2025 | | 2026 | | 2025 | |
Rand | Rand | Rand | Rand | |||||
Rand/EUR | | |
| |
| |
| |
Rand/US$ |
| |
| |
| |
| |
The table below shows the significant currency exposure where entities within the group have monetary assets or liabilities that are not in their functional currency, have exposure to the US dollar or the Euro. The amounts have been presented in rand by converting the foreign currency amount at the closing rate at the reporting date.
2026 | 2025 | |||||||
| Euro | | US dollar | | Euro | | US dollar | |
| Rm | Rm | | Rm | Rm | |||
Long-term receivables |
| |
| |
| |
| |
Trade and other receivables |
| |
| |
| |
| |
Cash and cash equivalents |
| |
| |
| |
| |
Net exposure on assets |
| |
| |
| |
| |
Trade and other payables |
| ( |
| ( |
| ( |
| ( |
Net exposure on liabilities |
| ( |
| ( |
| ( |
| ( |
Exposure on external balances |
| |
| ( |
| |
| |
Net exposure on balances between Group companies |
| ( |
| |
| ( |
| |
Total net exposure |
| ( |
| |
| |
| |
Sensitivity analysis
The following sensitivity analysis is provided to show the foreign currency exposure of the Group at the end of the reporting period. This analysis is prepared based on the statement of financial position balances that exist at year-end, for which there is currency risk, and exist at that point in time. The effect on equity is calculated as the effect on profit and loss. The effect of translation of results into presentation currency of the Group is excluded from the information provided.
Sasol Annual Financial Statements 2026 119
35 | Financial risk management and financial instruments continued |
35.2 | Financial risk management continued |
A
2026 | 2025 | 2024 | ||||||||||
Euro | US dollar | Euro | US dollar | Euro | US dollar | |||||||
| Rm | | Rm | | Rm | | Rm | | Rm | | Rm | |
Equity |
| ( |
| |
| |
| | |
| | |
Income statement |
| ( |
| |
| |
| | |
| | |
A
Interest rate risk
Interest rate risk is the risk that the value of short-term investments and financial activities will change as a result of fluctuations in the interest rates.
Fluctuations in interest rates impact on the value of short-term investments and financing activities, giving rise to interest rate risk. The Group has exposure to interest rate risk due to the volatility in South African, European and US interest rates.
How we manage the risk
Our debt is comprised of different instrument notes, which by their nature either bear interest at a floating or a fixed rate. We monitor the ratio of floating and fixed interest in our loan portfolio and manage this ratio, by electing to incur either bank loans, bearing a floating interest rate, or bonds, which bear a fixed interest rate. We may also use interest rate swaps, where appropriate, to convert some of our debt into either floating or fixed rate debt to manage the composition of our portfolio. There were
Sasol Annual Financial Statements 2026 120
35 | Financial risk management and financial instruments continued |
35.2 | Financial risk management continued |
In respect of financial assets, the Group’s policy is to invest cash at floating rates of interest and cash reserves are to be maintained in short-term investments (less than one year) in order to maintain liquidity, while achieving a satisfactory return for shareholders.
Carrying value | ||||
2026 | 2025 | |||
| Rm | | Rm | |
Variable rate instruments |
| |
| |
Financial assets |
| |
| |
Financial liabilities* |
| ( |
| ( |
| |
| | |
Fixed rate instruments |
|
| ||
Financial assets |
| |
| |
Financial liabilities |
| ( |
| ( |
| ( |
| ( | |
Interest profile (variable: fixed rate as a percentage of total financial assets) |
|
| | |
Interest profile (variable: fixed rate as a percentage of total financial liabilities) |
|
| ||
* | The decrease in variable exposure is mainly due to the repayments made on the RCF (refer to note 13). |
Cash flow sensitivity for variable rate instruments
Financial instruments affected by interest rate risk include borrowings, deposits, trade receivables and trade payables. A change of
Income statement and equity— 1% increase | ||||||||
| | | United States | | ||||
South Africa | Europe | of America | Other | |||||
| Rm | | Rm | | Rm | | Rm | |
30 June 2026 |
| |
| |
| ( |
| |
30 June 2025 |
| |
| |
| ( |
| |
30 June 2024 |
| |
| |
| ( |
| |
A
The Group’s remaining exposure to IBORs relate mainly to loans denominated in JIBAR (refer to note 1).
Commodity price risk
Commodity price risk is the risk of fluctuations in our earnings as a result of fluctuation in the price of commodities.
How we manage the risk
The Group makes use of derivative instruments, including options and commodity swaps as a means of mitigating price movements and timing risks on crude oil purchases and sales. The Group entered into hedging contracts which provide downside protection while retaining upside participation. Refer to the summary of our derivatives below.
Sasol Annual Financial Statements 2026 121
35. | Financial risk management and financial instruments continued |
35.2Financial risk management continued
Our exposure to and assessment of the risk
A substantial proportion of our turnover is derived from sales of petroleum and petrochemical products. Market prices for crude fluctuate because they are subject to international supply and demand and geopolitical factors. Our exposure to the crude oil price centres primarily around the selling price of fuel marketed by our Energy business, as the BFP formula is significantly influenced by international crude oil prices. Additional exposure stems from crude oil processed in our Natref refinery, and from certain of our international operations where chemical prices are linked to crude oil-derived feedstocks. Key factors in the BFP are the Mediterranean and Singapore or Mediterranean and Arab Gulf product prices for petrol and diesel, respectively.
Dated Brent crude oil prices applied during the year:
| Dated Brent Crude | |||
2026 | 2025 | |||
US$ | US$ | |||
High | | | ||
Average |
| |
| |
Low |
| |
| |
Summary of our derivatives
In the normal course of business, the Group enters into various derivative transactions to mitigate our exposure to foreign exchange rates, interest rates and commodity prices. Derivative instruments used by the Group in hedging activities include swaps, options, forwards and other similar types of instruments.
Financial | Financial | Financial | Financial | |||||||||||
asset | liability | asset | liability | Income statement gain/(loss) | ||||||||||
| 2026 | | 2026 | | 2025 |
| 2025 | 2026 | 2025 | 2024 | ||||
| Rm | | Rm | | Rm | | Rm | | Rm | | Rm | | Rm | |
Commodity and currency derivatives | ||||||||||||||
Crude oil put options | — | — | | — | ( | ( | ( | |||||||
Crude oil futures | | — | — | — | ( | — | ( | |||||||
Ethane swap options | — | — | — | — | — | — | ( | |||||||
Other commodity derivatives | | ( | — | ( | | ( | ( | |||||||
Forward exchange contracts | | ( | | ( | | | | |||||||
Foreign exchange zero cost collars |
| |
| — |
| |
| — | | | | |||
Put options – Rand/US dollar currency | | — | — | — | | — | — | |||||||
Put spread options – Brent crude oil | | — | — | — | ( | — | — | |||||||
Put with a call spread option – Brent crude oil | — | ( | — | — | ( | — | — | |||||||
Embedded derivatives | ||||||||||||||
Convertible bond embedded derivative | — | ( | — | ( | ( | | | |||||||
Oxygen supply contract embedded derivatives* | | — | | ( | | | | |||||||
Non-derivative financial instruments |
| |||||||||||||
Investments at fair value through profit or loss** | | — | | — | — | — | — | |||||||
| ( | | ( | | | | ||||||||
* | Relates to a US dollar derivative that is embedded in long-term oxygen supply contracts to our Secunda Operations. |
** | Fair value gains and losses are presented in other operating income and expenses, separately from derivative gains and losses. |
Sasol Annual Financial Statements 2026 122
35 | Financial risk management and financial instruments continued |
35.2 | Financial risk management continued |
Contract/Nominal amount* | Average price** | |||||||||||||||
Open | Settled | Open | Settled | Open | Open | |||||||||||
| 2026 | 2026 | 2025 | 2025 | 2026 | 2025 | ||||||||||
| Million | | Million | | Million | | Million | | | | ||||||
Crude oil put options purchased | barrels | — | | | | US$/bbl | — | | ||||||||
Forward exchange contracts | US$ |
| |
| — | |
| — | R/US$ | | | |||||
Forward exchange contracts | EUR | | — | | — | US$/EUR | | | ||||||||
Foreign exchange zero cost collars | US$ |
| |
| | |
| | R/US$ Floor | | | |||||
R/US$ Cap | | | ||||||||||||||
Put options purchased – Rand/US$ currency*** | US$ | | — | — | — | US$/EUR | | — | ||||||||
Put spread options purchased – Brent crude oil*** | US$ | | — | — | — | R/US$ Floor | | — | ||||||||
R/US$ Cap | | — | ||||||||||||||
Put with a call spread option purchased – Brent crude oil*** | US$ | | — | — | — | R/US$ Floor | | — | ||||||||
R/US$ Cap | | — | ||||||||||||||
|
| R/US$ Upper Cap | | — | ||||||||||||
* | The nominal amount is the sum of the absolute value of all contracts for both derivative assets and liabilities. |
** | For open positions. |
*** | During the year, the 2026 hedging programme was completed by securing downside protection while retaining upside participation. Total premium paid for contracts entered into in the year US$ |
Accounting policies:
Derivative financial instruments and hedging activities
The Group is exposed to market risks from changes in interest rates, foreign exchange rates and commodity prices. The Group uses derivative instruments to hedge its exposure to these risks. Additionally, there are embedded derivatives that have been bifurcated in certain of the Group’s long-term supply agreements and borrowings.
All derivative financial instruments are initially recognised at fair value and are subsequently stated at fair value at the reporting date. Attributable transaction costs are recognised in the income statement when incurred. Resulting gains or losses on derivative instruments, excluding designated and effective hedging instruments, are recognised in the income statement.
To the extent that a derivative instrument has a maturity period of longer than one year, the fair value of these instruments will be reflected as a non-current asset or liability.
Contracts to buy or sell non-financial items (e.g. gas or electricity) that were entered into and continue to be held for the purpose of the receipt of the non‑financial items in accordance with the Group’s expected purchase or usage requirements are not accounted for as derivative financial instruments. Purchase commitments relating to these contracts are disclosed in note 3.
Sasol Annual Financial Statements 2026 123
35 | Financial risk management and financial instruments continued |
35.2 | Financial risk management continued |
Hedge accounting
The Group continues to apply the hedge accounting requirements of IAS 39 ‘Financial Instruments: Recognition and Measurement’.
Where a derivative instrument is designated as a cash flow hedge of an asset, liability or highly probable forecast transaction that could affect the income statement, the effective part of any gain or loss arising on the derivative instrument is recognised as other comprehensive income and is classified as a cash flow hedge accounting reserve until the underlying transaction occurs. The ineffective part of any gain or loss is recognised in the income statement. If the hedging instrument no longer meets the criteria for cash flow hedge accounting, expires or is sold, terminated, exercised, or the designation is revoked, then hedge accounting is discontinued prospectively.
If the forecast transaction results in the recognition of a non-financial asset or non-financial liability, the associated gain or loss is transferred from the cash flow hedge accounting reserve, as other comprehensive income, to the underlying asset or liability on the transaction date. If the forecast transaction is no longer expected to occur, then the cumulative balance in other comprehensive income is recognised immediately in the income statement as reclassification adjustments. Other cash flow hedge gains or losses are recognised in the income statement at the same time as the hedged transaction occurs.
Economic hedges
When derivative instruments, including forward exchange contracts, are entered into as fair value hedges, no hedge accounting is applied. All gains and losses on fair value hedges are recognised in the income statement.
36 | Subsequent events (non-adjusting) |
In mid-August 2026, the Natref refinery experienced an unplanned shutdown of a downstream unit which coincided with a planned shutdown of a separate unit, impacting refinery production and supply. We are implementing measures to support continued refinery operations and working with industry to ensure the continuous supply of jet fuel and other products. Inventory build at year-end has provided additional flexibility in managing product supply during this period.
Sasol Annual Financial Statements 2026 124