SEGMENT INFORMATION
| Southern Africa | International | | | | | | | ||||||||||
Energy and Chemicals | Chemicals | Business | Consolidation | |||||||||||||||
Mining | Gas | Fuels | Chemicals Africa | America | Eurasia | support | Adjustments | Total | ||||||||||
Rm | | Rm | | Rm | | Rm | | Rm | | Rm | | Rm | | Rm | | Rm | ||
2026 |
| |
| |
| |
| |
| |
| |
| |
| |
| |
Income statement |
| |
| |
| |
| |
| |
| |
| |
| |
| |
External turnover1 |
| 4 |
| 7 998 |
| 122 075 |
| 59 862 |
| 40 290 |
| 41 889 |
| — |
| — | 272 118 | |
Segment turnover |
| 29 309 |
| 12 300 |
| 125 274 |
| 62 527 |
| 40 883 |
| 42 324 |
| — |
| (40 499) |
| 272 118 |
Intersegmental turnover |
| (29 305) |
| (4 302) |
| (3 199) |
| (2 665) |
| (593) |
| (435) |
| — |
| 40 499 |
| — |
Materials, energy and consumables used2 |
| (9 770) |
| (3 360) |
| (80 593) |
| (33 818) |
| (20 700) |
| (29 606) |
| (158) |
| 39 973 |
| (138 032) |
Selling and distribution costs |
| — |
| — |
| (43) |
| (4 671) |
| (3 269) |
| (1 511) |
| — |
| 26 |
| (9 468) |
Maintenance expenditure |
| (4 498) |
| (343) |
| (3 926) |
| (3 699) |
| (1 992) |
| (1 130) |
| (535) |
| 1 260 |
| (14 863) |
Employee-related expenditure |
| (6 941) |
| (914) |
| (5 232) |
| (6 524) |
| (3 849) |
| (6 441) |
| (7 060) |
| 174 |
| (36 787) |
Depreciation and amortisation |
| (1 055) |
| (1 353) |
| (702) |
| (5 845) |
| (2 840) |
| (1 334) |
| (473) |
| — |
| (13 602) |
Other expenses and income |
| (3 290) |
| (1 186) |
| (6 579) |
| (6 697) |
| (4 278) |
| (367) |
| 6 896 |
| (934) |
| (16 435) |
Equity accounted profits/(losses), net of tax |
| 1 |
| 399 |
| (436) |
| 224 |
| — |
| — |
| (109) |
| — |
| 79 |
Remeasurement items affecting operating profit (refer note 8) |
| (42) |
| (4 331) |
| (7 860) |
| (4 836) |
| 142 |
| (450) |
| 57 |
| — |
| (17 320) |
Earnings/(loss) before interest and tax (EBIT/(LBIT)) |
| 3 714 |
| 1 212 |
| 19 903 |
| (3 339) |
| 4 097 |
| 1 485 |
| (1 382) |
| — |
| 25 690 |
Statement of Financial Position |
| |||||||||||||||||
Additions to non-current assets3 |
| 4 143 |
| 1 832 |
| 5 417 |
| 5 898 |
| 1 906 |
| 1 221 |
| 455 |
| — |
| 20 872 |
1 | Mining’s external turnover is net of royalties paid on both external and intersegmental sales. |
2 | An amount of R110,6 billion relating to the cost of raw materials is included in the Materials, energy and consumables used. |
The current year consists of Mining (R8,2 billion), Gas (R3,4 billion), Fuels (R69,6 billion), Chemicals Africa (R25,3 billion), Chemicals America (R16,8 billion), Chemicals Eurasia (R26,4 billion) and Business Support (R0,1 billion) less a consolidation adjustment (R39,2 billion).
3Excludes capital project related payables, equity accounted investments and deferred tax assets.
| Southern Africa | International | | | | | | | ||||||||||
Energy and Chemicals | Chemicals | Business | Consolidation | |||||||||||||||
Mining | Gas | Fuels | Chemicals Africa | America | Eurasia | support | Adjustments | Total | ||||||||||
Rm | | Rm | | Rm | | Rm | | Rm | | Rm | | Rm | | Rm | | Rm | ||
2025 |
| |
| |
| |
| |
| |
| |
| |
| |
| |
Income statement |
| |
| |
| |
| |
| |
| |
| |
| |
| |
External turnover | 3 640 |
| 8 421 |
| 96 026 |
| 60 716 |
| 38 246 |
| 42 047 |
| — |
| — |
| 249 096 | |
Segment turnover | 30 373 |
| 13 133 |
| 98 419 |
| 63 528 |
| 38 703 |
| 42 571 |
| — |
| (37 631) |
| 249 096 | |
Intersegmental turnover | (26 733) |
| (4 712) |
| (2 393) |
| (2 812) |
| (457) |
| (524) |
| — |
| 37 631 |
| — | |
Materials, energy and consumables used¹ | (9 965) |
| (3 493) |
| (70 247) |
| (32 798) |
| (19 278) |
| (30 308) |
| (168) |
| 37 116 |
| (129 141) | |
Selling and distribution costs | — |
| — |
| (28) |
| (4 322) |
| (3 679) |
| (1 584) |
| – |
| 34 |
| (9 579) | |
Maintenance expenditure | (4 602) |
| (286) |
| (4 064) |
| (3 751) |
| (2 586) |
| (1 028) |
| (576) |
| 1 369 |
| (15 524) | |
Employee-related expenditure | (6 854) |
| (732) |
| (4 758) |
| (5 969) |
| (4 648) |
| (6 177) |
| (6 389) |
| 229 |
| (35 298) | |
Depreciation and amortisation | (1 426) |
| (1 179) |
| (1 015) |
| (5 361) |
| (2 988) |
| (1 555) |
| (478) |
| — |
| (14 002) | |
Other expenses and income | (3 531) |
| (88) |
| (2 300) |
| (5 631) |
| (3 849) |
| (946) |
| 8 751 |
| (1 117) |
| (8 711) | |
Equity accounted (losses)/profits, net of tax | 1 |
| 489 |
| 976 |
| 218 |
| — |
| — |
| (61) |
| — |
| 1 623 | |
Remeasurement items affecting operating profit (refer note 8) | (42) |
| (4 796) |
| (11 761) |
| (905) |
| (9) |
| (2 184) |
| 52 |
| — |
| (19 645) | |
Earnings/(loss) before interest and tax (EBIT/(LBIT)) | 3 954 |
| 3 048 |
| 5 222 |
| 5 009 |
| 1 666 |
| (1 211) |
| 1 131 |
| — |
| 18 819 | |
Statement of Financial Position | ||||||||||||||||||
Additions to non-current assets² | 3 573 |
| 3 481 |
| 7 315 |
| 6 863 |
| 2 332 |
| 1 548 |
| 301 |
| — |
| 25 413 | |
1 | An amount of R103 billion relating to the cost of raw materials is included in the Materials, energy and consumables used. |
The current year consists of Mining (R8,5 billion), Gas (R3,5 billion), Fuels (R59,7 billion), Chemicals Africa (R25 billion), Chemicals America (R15,7 billion), Chemicals Eurasia (R26,6 billion) and Business Support (R0,1 billion) less a consolidation adjustment (R36,2 billion).
2Excludes capital project related payables and equity accounted investments.
Southern Africa | International |
|
| |||||||||||||||
Energy and Chemicals | Chemicals |
| Business |
| Consolidation | |||||||||||||
Mining | Gas | Fuels | Chemicals Africa | America | Eurasia | support |
| Adjustments | Total | |||||||||
Rm |
| Rm |
| Rm | Rm |
| Rm |
| Rm |
| Rm |
| Rm |
| Rm | |||
2024 | ||||||||||||||||||
Income statement | |
| |
| | |
| |
| |
| |
| |
| | ||
External turnover | 3 874 |
| 8 014 |
| 116 256 |
| 63 829 |
| 41 424 |
| 41 714 |
| — |
| — |
| 275 111 | |
Segment turnover | 28 876 |
| 12 158 |
| 118 864 |
| 66 883 |
| 41 805 |
| 42 201 |
| — |
| (35 676) |
| 275 111 | |
Intersegmental turnover | (25 002) |
| (4 144) |
| (2 608) |
| (3 054) |
| (381) |
| (487) |
| — |
| 35 676 |
| — | |
Materials, energy and consumables used¹ | (9 401) |
| (4 097) |
| (76 483) |
| (30 038) |
| (21 899) |
| (30 974) |
| (182) |
| 35 117 |
| (137 957) | |
Selling and distribution costs | — |
| — |
| (44) |
| (4 771) |
| (3 936) |
| (1 673) |
| — |
| 30 |
| (10 394) | |
Maintenance expenditure | (4 214) |
| (329) |
| (4 089) |
| (3 492) |
| (2 792) |
| (1 189) |
| (710) |
| 1 369 |
| (15 446) | |
Employee-related expenditure | (6 851) |
| (750) |
| (4 801) |
| (5 721) |
| (4 843) |
| (6 213) |
| (6 564) |
| 278 |
| (35 465) | |
Depreciation and amortisation | (1 532) |
| (665) |
| (1 115) |
| (5 018) |
| (4 905) |
| (1 930) |
| (479) |
| — |
| (15 644) | |
Other expenses and income | (3 684) |
| (1 031) |
| (5 314) |
| (6 459) |
| (4 953) |
| (345) |
| 9 050 |
| (1 118) |
| (13 854) | |
Equity accounted profits, net of tax | (1) |
| 463 |
| 1 173 |
| 143 |
| — |
| — |
| (20) |
| — |
| 1 758 | |
Remeasurement items affecting operating profit (refer note 8) | 17 |
| 954 |
| (9 244) |
| (5 237) |
| (59 686) |
| (2 265) |
| 47 |
| — |
| (75 414) | |
Earnings/(loss) before interest and tax (EBIT/(LBIT)) | 3 210 |
| 6 703 |
| 18 947 |
| 6 290 |
| (61 209) |
| (2 388) |
| 1 142 |
| — |
| (27 305) | |
Statement of Financial Position | ||||||||||||||||||
Additions to non-current assets² | 2 954 |
| 6 492 |
| 8 671 |
| 7 548 |
| 1 762 |
| 2 062 |
| 670 |
| — |
| 30 159 | |
1 | An amount of R114,9 billion relating to the cost of raw materials is included in the Materials, energy and consumables used. |
The current year consists of Mining (R8,2 billion), Gas (R4,1 billion), Fuels (R67,6 billion), Chemicals Africa (R23,5 billion), Chemicals America (R18,6 billion), Chemicals Eurasia (R27,2 billion) and Business Support (R0,1 billion) less a consolidation adjustment (R34,4 billion).
2 | Excludes capital project related payables and equity accounted investments. |
GEOGRAPHIC REGION INFORMATION
| South | | | | | | ||||||
Africa | Mozambique | United States | Europe | Rest of World | Total | |||||||
Rm | Rm | Rm | Rm | Rm | Rm | |||||||
2026 |
| |
| |
| |
| |
| |
| |
External turnover¹ |
| 139 061 |
| 1 205 |
| 41 120 |
| 45 661 |
| 45 071 |
| 272 118 |
Earnings/(loss) before interest and tax (EBIT/(LBIT))² |
| 22 128 |
| (484) |
| 4 111 |
| 505 |
| (570) |
| 25 690 |
Tax paid |
| 3 690 |
| 1 011 |
| 37 |
| 846 |
| 40 |
| 5 624 |
Non-current assets³ |
| 70 343 |
| 18 801 |
| 68 867 |
| 13 368 |
| 8 121 |
| 179 500 |
2025 |
| |
| |
| |
| |
| |
| |
External turnover¹ |
| 119 000 |
| 1 053 |
| 39 167 |
| 47 158 |
| 42 718 |
| 249 096 |
Earnings/(loss) before interest and tax (EBIT/(LBIT))² |
| 16 648 |
| (1 717) |
| 2 354 |
| (2 417) |
| 3 951 |
| 18 819 |
Tax paid |
| 5 352 |
| 1 323 |
| 11 |
| 475 |
| 132 |
| 7 293 |
Non-current assets³ |
| 69 763 |
| 22 901 |
| 75 022 |
| 14 763 |
| 10 066 |
| 192 515 |
2024 |
| |
| |
| |
| |
| |
| |
External turnover¹ |
| 137 903 |
| 1 091 |
| 43 374 |
| 50 044 |
| 42 699 |
| 275 111 |
(Loss)/earnings before interest and tax ((LBIT)/EBIT)² |
| 28 109 |
| 738 |
| (58 891) |
| (834) |
| 3 573 |
| (27 305) |
Tax paid |
| 7 939 |
| 2 536 |
| 12 |
| 400 |
| 45 |
| 10 932 |
Non-current assets³ |
| 69 729 |
| 25 090 |
| 77 217 |
| 17 136 |
| 10 984 |
| 200 156 |
1 | The analysis of turnover is based on the location of the customer. |
2 | Includes equity accounted profits and remeasurement items. |
3 | Excludes deferred tax assets, post-retirement benefit assets and other items not separately disclosed. |
REPORTING SEGMENTS
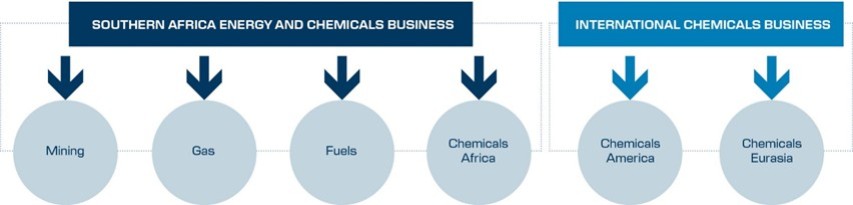
The Group’s operating model comprises of two distinct businesses, Southern Africa Energy and Chemicals and International Chemicals. The Southern Africa Energy and Chemicals business comprises Mining, Gas, Fuels and Chemicals Africa. The International Chemicals business comprises of Chemicals America and Chemicals Eurasia. The operating model structure reflects how the results are reported to the Chief Operating Decision Maker (CODM). The CODM for Sasol is the President and Chief Executive Officer. The Southern Africa Energy business reportable segments are operating segments that are differentiated by the activities that each undertakes and the products they manufacture and market. The Chemicals business reportable segments are differentiated by the regions in which they operate. The Group has six main reportable segments that reflect the structure used by the President and Chief Executive Officer to make key operating decisions and assess performance. The Group evaluates the performance of its reportable segments based on earnings before interest and tax (EBIT).
Southern Africa business
The Southern Africa business operates integrated value chains with feedstock sourced from the Mining and Gas operating segments and processed at our operations in Secunda, Sasolburg and National Petroleum Refiners of South Africa (Pty) Ltd (Natref). There are also associated assets outside South Africa which include the Pande-Temane Petroleum Production Agreement and the Production Sharing Agreement in Mozambique and ORYX GTL (gas to liquids) in Qatar.
MINING
Mining is responsible for securing coal feedstock for the Southern African value chain, mainly for gasification, but also to generate electricity and steam. Coal is sold for gasification and utilities generation to Secunda Operations (SO) and for utilities generation to Sasolburg Operations. Coal is supplied to SO and to Sasolburg Operations based on long-term supply contracts. Following the repurposing of the existing export beneficiation plant as a destoning solution, Sasol Mining ceased export production on 30 June 2025 and concluded its final export sales in quarter 1 of 2026. Accordingly, coal sales are now exclusively directed to the Southern African value chain.
The date of delivery related to Mining is determined in accordance with the contractual agreements entered into with customers. These are summarised as follows:
Delivery terms | | Control passes to the customer |
On delivery | At the point in time when the coal is delivered to the customer. |
GAS
The Gas segment reflects the upstream feedstock, transport of gas through the Republic of Mozambique Pipeline Investments Company (ROMPCO) pipeline, and external natural methane rich gas (MRG) and liquefied petroleum gas (LPG) sales.
Mozambican gas is sold under long-term contracts to the Sasol operations and to external customers. Condensate is sold on short-term contracts. In South Africa, gas is sold under long-term contracts at a price determinable from the supply agreements in accordance with the pricing methodology used by the National Energy Regulator of South Africa (NERSA). Analysis of gas and tests of the specifications and content are performed prior to delivery. Turnover from all gas sales is recognised on delivery.
Delivery terms | | Control passes to the customer |
On-delivery | At the point in time when the: | |
· Gas reaches the inlet coupling of the customer’s pipeline. | ||
· Condensate is loaded onto the customer’s truck. | ||
These are the points when the customer controls the gas, condensate or oil, or directs the use of it. The customer is responsible for transportation and handling costs in terms of gas, condensate and oil. |
FUELS
The Fuels segment comprises the sales and marketing of liquid fuels produced in South Africa. Sasol supplies a significant portion of South Africa’s domestic fuel needs through retail and wholesale channels. Liquid fuels are blended from fuel components produced by SO, crude oil refined at Natref, as well as some products purchased from other oil companies including fuel imports. Liquid fuel products are sold under both short- and long-term agreements for retail sales and commercial sales, including sales to other oil companies.
Liquid fuel prices are mainly driven by the Basic Fuel Price (BFP). Sales through wholesale is at BFP plus costs such as transportation and storage. For commercial sales and sales to other oil companies, the prices are fixed and determinable according to the specific contract, with periodic price adjustments.
Turnover is recognised as follows:
Delivery terms | | Control passes to the customer: |
On-delivery/Ex-gate | At the point in time when the fuel is delivered onto the rail tank car, road tank truck or into the customer pipeline. | |
In-tank | At the point in time when the buyer obtains legal title, physical access or the ability to direct the use of the product and assumes responsibility for any financial losses and is entitled to any profits from the sale. | |
Free Carrier | At the point in time when the goods are unloaded to the port of shipment; Sasol is not responsible for the freight and insurance. | |
Carriage Paid To | Products: At the point in time when the product is delivered to a specified location or main carrier. Freight: Over the period of transporting the goods to the customer’s nominated place – where the seller is responsible for freight costs, which are included in the contract. | |
Consignment Sales | As and when products are consumed by the customer. |
The Fuels segment includes Sasol’s ORYX GTL operations in Qatar, a joint venture with Qatar Petroleum.
Chemicals Africa and International Chemicals business
The Chemicals Business has a strong diversified, global presence which has been organised into three customer-focused regional operating segments – Africa under Southern Africa and America and Eurasia under International Chemicals. Chemical products are grouped into two categories, Base Chemicals (produced in large quantities, are standardised, and used across a wide range of industries) and Differentiated Chemicals (produced in smaller quantities, are more specialised, and typically command higher value and margins). These product divisions have been grouped in relation to the different drivers of revenue relating to each division.
The Chemicals businesses sell the majority of their products under contracts at prices determinable from such agreements. Turnover is recognised in accordance with the related contract terms, at the point at which control transfers to the customer and prices are determinable and collectability is probable.
The point of delivery is determined in accordance with the contractual agreements entered into with customers which are as follows:
Delivery terms | | Control passes to the customer: |
Ex-tank sales | At the point in time when products are loaded into the customer’s vehicle or unloaded from the seller’s storage tanks. | |
Ex-works | At the point in time when products are loaded into the customer’s vehicle or unloaded at the seller’s premises. | |
Carriage Paid To (CPT); Cost Insurance Freight (CIF); Carriage and Insurance Paid (CIP); and Cost Freight Railage (CFR) | Products – CPT: At the point in time when the product is delivered to a specified location or main carrier. | |
Products – CIF, CIP and CFR: At the point in time when the products are loaded into the transport vehicle. | ||
Free on Board | At the point in time when products are loaded into the transport vehicle; the customer is responsible for shipping and handling costs. | |
Delivered at Place | At the point in time when products are delivered to and signed for by the customer. | |
Consignment Sales | As and when products are consumed by the customer. |
Business Support
Business Support consists of support to the Southern Africa and International Chemicals Businesses, as well as the Corporate Office including treasury companies.