Shareholder Report
Jun. 30, 2026
USD ($)
Holding
FUND COSTS FOR THE LAST six months ENDED June 30, 2026
(BASED ON A HYPOTHETICAL $10,000 INVESTMENT)
COSTS OF A $10,000 INVESTMENT |
COSTS PAID AS A PERCENTAGE OF A $10,000 INVESTMENT | |
Schwab U.S. TIPS ETF |
$1 |
0.03% * |
*
Annualized.
Average Annual Total Returns
Fund and Inception Date |
6 Months |
1 Year |
5 Years |
10 Years |
Fund: Schwab U.S. TIPS ETF (08/05/2010)1,2 |
1.26% |
3.38% |
0.98% |
2.53% |
Bloomberg US Aggregate Bond Index 3 |
0.62% |
3.79% |
0.08% |
1.54% |
Bloomberg US Treasury Inflation-Linked Bond Index (Series-L) SM |
1.15% |
3.42% |
1.01% |
2.58% |
All total returns on this page assume dividends and distributions were reinvested. Index figures do not include trading and management costs, which would lower
performance. Indices are unmanaged and cannot be invested in directly. Performance results less than one year are not annualized.
For index definitions, please see www.schwabassetmanagement.com/glossary.
Shares are bought and sold at market price, which may be higher or lower than the net asset value (NAV). Brokerage commissions will reduce returns.
Index ownership — Bloomberg
®
and Bloomberg US Treasury Inflation-Linked Bond Index (Series-L)
SM
are service marks of Bloomberg Finance L.P. and its affiliates, including
Bloomberg Index Services Limited (BISL), the administrator of the indices (collectively, Bloomberg). Bloomberg is not affiliated with Charles Schwab Investment
Management, Inc., and Bloomberg does not approve, endorse, review, or recommend Schwab U.S. TIPS ETF. Bloomberg does not guarantee the timeliness, accurateness, or
completeness of any data or information relating to Schwab U.S. TIPS ETF.
1
Performance does not reflect the deduction of taxes that a shareholder would pay on fund distributions or on the redemption or sale of fund shares.
2
Performance is shown on a NAV basis. The fund’s per share NAV is the value of one share of the fund. NAV is calculated by taking the fund’s total assets (including the fair
value of securities owned), subtracting liabilities, and dividing by the number of shares outstanding. Returns assume that dividends and capital gain distributions have been
reinvested in the fund at NAV.
3
The Bloomberg US Aggregate Bond Index serves as the fund’s regulatory index and provides a broad measure of market performance. The fund generally invests in
securities that are included in the Bloomberg US Treasury Inflation-Linked Bond Index (Series-L)
SM
. The fund does not seek to track the regulatory index.
To obtain performance
information current to the most recent month end, please visit
www.schwabassetmanagement.com/prospectus
.
Statistics
Net Assets (millions) |
$16,547 |
Number of Holdings |
49 |
Portfolio Turnover Rate (not annualized; excludes in-kind transactions) |
12% |
Weighted Average Maturity (Source: Aladdin) |
7.1 Yrs |
Weighted Average Duration (Source: Aladdin) |
6.3 Yrs |
Portfolio Composition By Security Type % of Investments
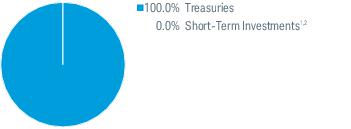
Portfolio holdings may have changed since the report date.
1
Less than 0.05%.
2
Includes the fund’s position in money market mutual funds registered under the Investment Company Act of 1940, as amended.
FUND COSTS FOR THE LAST six months ENDED June 30, 2026
(BASED ON A HYPOTHETICAL $10,000 INVESTMENT)
COSTS OF A $10,000 INVESTMENT |
COSTS PAID AS A PERCENTAGE OF A $10,000 INVESTMENT | |
Schwab Short-Term U.S. Treasury ETF |
$1 |
0.03% * |
*
Annualized.
Average Annual Total Returns
Fund and Inception Date |
6 Months |
1 Year |
5 Years |
10 Years |
Fund: Schwab Short-Term U.S. Treasury ETF (08/05/2010) 1,2 |
0.63% |
2.88% |
1.87% |
1.70% |
Bloomberg US Aggregate Bond Index 3 |
0.62% |
3.79% |
0.08% |
1.54% |
Bloomberg US Treasury 1-3 Year Index |
0.64% |
2.92% |
1.90% |
1.75% |
All total returns on this page assume dividends and distributions were reinvested. Index figures do not include trading and management costs, which would lower
performance. Indices are unmanaged and cannot be invested in directly. Performance results less than one year are not annualized.
For index definitions, please see www.schwabassetmanagement.com/glossary.
Shares are bought and sold at market price, which may be higher or lower than the net asset value (NAV). Brokerage commissions will reduce returns.
Index ownership — Bloomberg
®
and Bloomberg US Treasury 1-3 Year Index are service marks of Bloomberg Finance L.P. and its affiliates, including Bloomberg Index Services
Limited (BISL), the administrator of the indices (collectively, Bloomberg). Bloomberg is not affiliated with Charles Schwab Investment Management, Inc., and Bloomberg does
not approve, endorse, review, or recommend Schwab Short-Term U.S. Treasury ETF. Bloomberg does not guarantee the timeliness, accurateness, or completeness of any data
or information relating to Schwab Short-Term U.S. Treasury ETF.
1
Performance does not reflect the deduction of taxes that a shareholder would pay on fund distributions or on the redemption or sale of fund shares.
2
Performance is shown on a NAV basis. The fund’s per share NAV is the value of one share of the fund. NAV is calculated by taking the fund’s total assets (including the fair
value of securities owned), subtracting liabilities, and dividing by the number of shares outstanding. Returns assume that dividends and capital gain distributions have been
reinvested in the fund at NAV.
3
The Bloomberg US Aggregate Bond Index serves as the fund’s regulatory index and provides a broad measure of market performance. The fund generally invests in
securities that are included in the Bloomberg US Treasury 1-3 Year Index. The fund does not seek to track the regulatory index.
To obtain performance
information current to the most recent month end, please visit
www.schwabassetmanagement.com/prospectus
.
Statistics
Net Assets (millions) |
$12,615 |
Number of Holdings |
97 |
Portfolio Turnover Rate (not annualized; excludes in-kind transactions) |
31% |
Weighted Average Maturity (Source: Aladdin) |
2.0 Yrs |
Weighted Average Duration (Source: Aladdin) |
1.9 Yrs |
Portfolio Composition By Security Type % of Investments
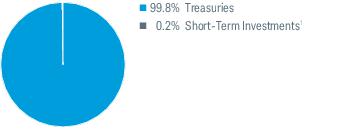
Portfolio holdings may have changed since the report date.
1
Includes the fund’s position in money market mutual funds registered under the Investment Company Act of 1940, as amended.
FUND COSTS FOR THE LAST six months ENDED June 30, 2026
(BASED ON A HYPOTHETICAL $10,000 INVESTMENT)
COSTS OF A $10,000 INVESTMENT |
COSTS PAID AS A PERCENTAGE OF A $10,000 INVESTMENT | |
Schwab Intermediate-Term U.S. Treasury ETF |
$1 |
0.03% * |
*
Annualized.
Average Annual Total Returns
Fund and Inception Date |
6 Months |
1 Year |
5 Years |
10 Years |
Fund: Schwab Intermediate-Term U.S. Treasury ETF (08/05/2010) 1,2 |
0.01% |
2.43% |
0.14% |
1.14% |
Bloomberg US Aggregate Bond Index 3 |
0.62% |
3.79% |
0.08% |
1.54% |
Bloomberg US Treasury 3-10 Year Index |
-0.10% |
2.45% |
0.17% |
1.18% |
All total returns on this page assume dividends and distributions were reinvested. Index figures do not include trading and management costs, which would lower
performance. Indices are unmanaged and cannot be invested in directly. Performance results less than one year are not annualized.
For index definitions, please see www.schwabassetmanagement.com/glossary.
Shares are bought and sold at market price, which may be higher or lower than the net asset value (NAV). Brokerage commissions will reduce returns.
Index ownership — Bloomberg
®
and Bloomberg US Treasury 3-10 Year Index are service marks of Bloomberg Finance L.P. and its affiliates, including Bloomberg Index Services
Limited (BISL), the administrator of the indices (collectively, Bloomberg). Bloomberg is not affiliated with Charles Schwab Investment Management, Inc., and Bloomberg does
not approve, endorse, review, or recommend Schwab Intermediate-Term U.S. Treasury ETF. Bloomberg does not guarantee the timeliness, accurateness, or completeness of
any data or information relating to Schwab Intermediate-Term U.S. Treasury ETF.
1
Performance does not reflect the deduction of taxes that a shareholder would pay on fund distributions or on the redemption or sale of fund shares.
2
Performance is shown on a NAV basis. The fund’s per share NAV is the value of one share of the fund. NAV is calculated by taking the fund’s total assets (including the fair
value of securities owned), subtracting liabilities, and dividing by the number of shares outstanding. Returns assume that dividends and capital gain distributions have been
reinvested in the fund at NAV.
3
The Bloomberg US Aggregate Bond Index serves as the fund’s regulatory index and provides a broad measure of market performance. The fund generally invests in
securities that are included in the Bloomberg US Treasury 3-10 Year Index. The fund does not seek to track the regulatory index.
To obtain performance
information current to the most recent month end, please visit
www.schwabassetmanagement.com/prospectus
.
Statistics
Net Assets (millions) |
$13,386 |
Number of Holdings |
102 |
Portfolio Turnover Rate (not annualized; excludes in-kind transactions) |
24% |
Weighted Average Maturity (Source: Aladdin) |
5.6 Yrs |
Weighted Average Duration (Source: Aladdin) |
4.9 Yrs |
Portfolio Composition By Security Type % of Investments
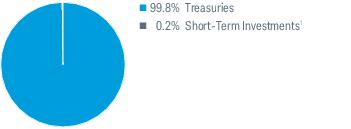
Portfolio holdings may have changed since the report date.
1
Includes the fund’s position in money market mutual funds registered under the Investment Company Act of 1940, as amended.
FUND COSTS FOR THE LAST six months ENDED June 30, 2026
(BASED ON A HYPOTHETICAL $10,000 INVESTMENT)
COSTS OF A $10,000 INVESTMENT |
COSTS PAID AS A PERCENTAGE OF A $10,000 INVESTMENT | |
Schwab Long-Term U.S. Treasury ETF |
$1 |
0.03% * |
*
Annualized.
Average Annual Total Returns
Fund and Inception Date |
6 Months |
1 Year |
5 Years |
Since Inception* |
Fund: Schwab Long-Term U.S. Treasury ETF (10/10/2019) 1,2 |
0.83% |
2.87% |
-5.62% |
-3.79% |
Bloomberg US Aggregate Bond Index 3 |
0.62% |
3.79% |
0.08% |
0.87% |
Bloomberg US Long Treasury Index |
0.44% |
2.89% |
-5.60% |
-3.77% |
All total returns on this page assume dividends and distributions were reinvested. Index figures do not include trading and management costs, which would lower
performance. Indices are unmanaged and cannot be invested in directly. Performance results less than one year are not annualized.
For index definitions, please see www.schwabassetmanagement.com/glossary.
Shares are bought and sold at market price, which may be higher or lower than the net asset value (NAV). Brokerage commissions will reduce returns.
Index ownership — Bloomberg
®
and Bloomberg US Long Treasury Index are service marks of Bloomberg Finance L.P. and its affiliates, including Bloomberg Index Services
Limited (BISL), the administrator of the indices (collectively, Bloomberg). Bloomberg is not affiliated with Charles Schwab Investment Management, Inc., and Bloomberg does
not approve, endorse, review, or recommend Schwab Long-Term U.S. Treasury ETF. Bloomberg does not guarantee the timeliness, accurateness, or completeness of any data
or information relating to Schwab Long-Term U.S. Treasury ETF.
*
Inception (10/10/2019) represents the date that the shares began trading in the secondary market.
1
Performance does not reflect the deduction of taxes that a shareholder would pay on fund distributions or on the redemption or sale of fund shares.
2
Performance is shown on a NAV basis. The fund’s per share NAV is the value of one share of the fund. NAV is calculated by taking the fund’s total assets (including the fair
value of securities owned), subtracting liabilities, and dividing by the number of shares outstanding. Returns assume that dividends and capital gain distributions have been
reinvested in the fund at NAV.
3
The Bloomberg US Aggregate Bond Index serves as the fund’s regulatory index and provides a broad measure of market performance. The fund generally invests in
securities that are included in the Bloomberg US Long Treasury Index. The fund does not seek to track the regulatory index.
To obtain performance
information current to the most recent month end, please visit
www.schwabassetmanagement.com/prospectus
.
Statistics
Net Assets (millions) |
$782 |
Number of Holdings |
100 |
Portfolio Turnover Rate (not annualized; excludes in-kind transactions) |
8% |
Weighted Average Maturity (Source: Aladdin) |
21.8 Yrs |
Weighted Average Duration (Source: Aladdin) |
13.8 Yrs |
Portfolio Composition By Security Type % of Investments
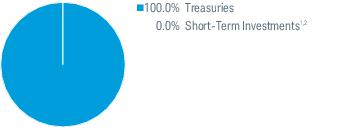
Portfolio holdings may have changed since the report date.
1
Less than 0.05%.
2
Includes the fund’s position in money market mutual funds registered under the Investment Company Act of 1940, as amended.
FUND COSTS FOR THE LAST six months ENDED June 30, 2026
(BASED ON A HYPOTHETICAL $10,000 INVESTMENT)
COSTS OF A $10,000 INVESTMENT |
COSTS PAID AS A PERCENTAGE OF A $10,000 INVESTMENT | |
Schwab U.S. Aggregate Bond ETF |
$1 |
0.03% * |
*
Annualized.
Average Annual Total Returns
Fund and Inception Date |
6 Months |
1 Year |
5 Years |
10 Years |
Fund: Schwab U.S. Aggregate Bond ETF (07/14/2011) 1,2 |
0.73% |
3.75% |
0.04% |
1.48% |
Bloomberg US Aggregate Bond Index |
0.62% |
3.79% |
0.08% |
1.54% |
All total returns on this page assume dividends and distributions were reinvested. Index figures do not include trading and management costs, which would lower
performance. Indices are unmanaged and cannot be invested in directly. Performance results less than one year are not annualized.
For index definitions, please see www.schwabassetmanagement.com/glossary.
Shares are bought and sold at market price, which may be higher or lower than the net asset value (NAV). Brokerage commissions will reduce returns.
Index ownership — Bloomberg
®
and Bloomberg US Aggregate Bond Index are service marks of Bloomberg Finance L.P. and its affiliates, including Bloomberg Index Services
Limited (BISL), the administrator of the indices (collectively, Bloomberg). Bloomberg is not affiliated with Charles Schwab Investment Management, Inc., and Bloomberg does
not approve, endorse, review, or recommend Schwab U.S. Aggregate Bond ETF. Bloomberg does not guarantee the timeliness, accurateness, or completeness of any data or
information relating to Schwab U.S. Aggregate Bond ETF.
1
Performance does not reflect the deduction of taxes that a shareholder would pay on fund distributions or on the redemption or sale of fund shares.
2
Performance is shown on a NAV basis. The fund’s per share NAV is the value of one share of the fund. NAV is calculated by taking the fund’s total assets (including the fair
value of securities owned), subtracting liabilities, and dividing by the number of shares outstanding. Returns assume that dividends and capital gain distributions have been
reinvested in the fund at NAV.
To obtain performance
information current to the most recent month end, please visit
www.schwabassetmanagement.com/prospectus
.
Statistics
Net Assets (millions) |
$10,602 |
Number of Holdings |
12,355 |
Portfolio Turnover Rate (not annualized; excludes in-kind transactions) |
20% |
Weighted Average Maturity (Source: Aladdin) |
8.1 Yrs |
Weighted Average Duration (Source: Aladdin) |
5.8 Yrs |
Portfolio Composition By Security Type % of Investments
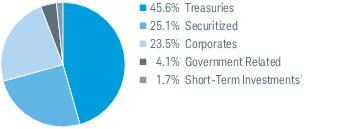
Portfolio holdings may have changed since the report date.
1
Includes the fund’s position in money market mutual funds registered under the Investment Company Act of 1940, as amended.
FUND COSTS FOR THE LAST six months ENDED June 30, 2026
(BASED ON A HYPOTHETICAL $10,000 INVESTMENT)
COSTS OF A $10,000 INVESTMENT |
COSTS PAID AS A PERCENTAGE OF A $10,000 INVESTMENT | |
Schwab 1-5 Year Corporate Bond ETF |
$1 |
0.03% * |
*
Annualized.
Average Annual Total Returns
Fund and Inception Date |
6 Months |
1 Year |
5 Years |
Since Inception* |
Fund: Schwab 1-5 Year Corporate Bond ETF (10/10/2019) 1,2 |
0.93% |
3.84% |
2.40% |
2.64% |
Bloomberg US Aggregate Bond Index 3 |
0.62% |
3.79% |
0.08% |
0.87% |
Bloomberg US 1-5 Year Corporate Bond Index |
0.93% |
3.85% |
2.43% |
2.70% |
All total returns on this page assume dividends and distributions were reinvested. Index figures do not include trading and management costs, which would lower
performance. Indices are unmanaged and cannot be invested in directly. Performance results less than one year are not annualized.
For index definitions, please see www.schwabassetmanagement.com/glossary.
Shares are bought and sold at market price, which may be higher or lower than the net asset value (NAV). Brokerage commissions will reduce returns.
Index ownership — Bloomberg
®
and Bloomberg US 1-5 Year Corporate Bond Index are service marks of Bloomberg Finance L.P. and its affiliates, including Bloomberg Index
Services Limited (BISL), the administrator of the indices (collectively, Bloomberg). Bloomberg is not affiliated with Charles Schwab Investment Management, Inc., and
Bloomberg does not approve, endorse, review, or recommend Schwab 1-5 Year Corporate Bond ETF. Bloomberg does not guarantee the timeliness, accurateness, or
completeness of any data or information relating to Schwab 1-5 Year Corporate Bond ETF.
*
Inception (10/10/2019) represents the date that the shares began trading in the secondary market.
1
Performance does not reflect the deduction of taxes that a shareholder would pay on fund distributions or on the redemption or sale of fund shares.
2
Performance is shown on a NAV basis. The fund’s per share NAV is the value of one share of the fund. NAV is calculated by taking the fund’s total assets (including the fair
value of securities owned), subtracting liabilities, and dividing by the number of shares outstanding. Returns assume that dividends and capital gain distributions have been
reinvested in the fund at NAV.
3
The Bloomberg US Aggregate Bond Index serves as the fund’s regulatory index and provides a broad measure of market performance. The fund generally invests in
securities that are included in the Bloomberg US 1-5 Year Corporate Bond Index. The fund does not seek to track the regulatory index.
To obtain performance
information current to the most recent month end, please visit
www.schwabassetmanagement.com/prospectus
.
Statistics
Net Assets (millions) |
$870 |
Number of Holdings (excludes derivatives) |
3,273 |
Portfolio Turnover Rate (not annualized; excludes in-kind transactions) |
22% |
Weighted Average Maturity (Source: Aladdin) |
3.1 Yrs |
Weighted Average Duration (Source: Aladdin) |
2.7 Yrs |
Portfolio Composition By Security Type % of Investments
1
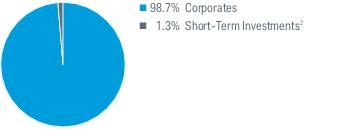
Portfolio holdings may have changed since the report date.
1
Excludes derivatives.
2
Includes the fund’s position in money market mutual funds registered under the Investment Company Act of 1940, as amended.
FUND COSTS FOR THE LAST six months ENDED June 30, 2026
(BASED ON A HYPOTHETICAL $10,000 INVESTMENT)
COSTS OF A $10,000 INVESTMENT |
COSTS PAID AS A PERCENTAGE OF A $10,000 INVESTMENT | |
Schwab 5-10 Year Corporate Bond ETF |
$1 |
0.03% * |
*
Annualized.
Average Annual Total Returns
Fund and Inception Date |
6 Months |
1 Year |
5 Years |
Since Inception* |
Fund: Schwab 5-10 Year Corporate Bond ETF (10/10/2019) 1,2 |
0.64% |
4.55% |
1.17% |
2.18% |
Bloomberg US Aggregate Bond Index 3 |
0.62% |
3.79% |
0.08% |
0.87% |
Bloomberg US 5-10 Year Corporate Bond Index |
0.52% |
4.56% |
1.20% |
2.24% |
All total returns on this page assume dividends and distributions were reinvested. Index figures do not include trading and management costs, which would lower
performance. Indices are unmanaged and cannot be invested in directly. Performance results less than one year are not annualized.
For index definitions, please see www.schwabassetmanagement.com/glossary.
Shares are bought and sold at market price, which may be higher or lower than the net asset value (NAV). Brokerage commissions will reduce returns.
Index ownership — Bloomberg
®
and Bloomberg US 5-10 Year Corporate Bond Index are service marks of Bloomberg Finance L.P. and its affiliates, including Bloomberg Index
Services Limited (BISL), the administrator of the indices (collectively, Bloomberg). Bloomberg is not affiliated with Charles Schwab Investment Management, Inc., and
Bloomberg does not approve, endorse, review, or recommend Schwab 5-10 Year Corporate Bond ETF. Bloomberg does not guarantee the timeliness, accurateness, or
completeness of any data or information relating to Schwab 5-10 Year Corporate Bond ETF.
*
Inception (10/10/2019) represents the date that the shares began trading in the secondary market.
1
Performance does not reflect the deduction of taxes that a shareholder would pay on fund distributions or on the redemption or sale of fund shares.
2
Performance is shown on a NAV basis. The fund’s per share NAV is the value of one share of the fund. NAV is calculated by taking the fund’s total assets (including the fair
value of securities owned), subtracting liabilities, and dividing by the number of shares outstanding. Returns assume that dividends and capital gain distributions have been
reinvested in the fund at NAV.
3
The Bloomberg US Aggregate Bond Index serves as the fund’s regulatory index and provides a broad measure of market performance. The fund generally invests in
securities that are included in the Bloomberg US 5-10 Year Corporate Bond Index. The fund does not seek to track the regulatory index.
To obtain performance
information current to the most recent month end, please visit
www.schwabassetmanagement.com/prospectus
.
Statistics
Net Assets (millions) |
$11,609 |
Number of Holdings (excludes derivatives) |
2,328 |
Portfolio Turnover Rate (not annualized; excludes in-kind transactions) |
23% |
Weighted Average Maturity (Source: Aladdin) |
7.5 Yrs |
Weighted Average Duration (Source: Aladdin) |
6.0 Yrs |
Portfolio Composition By Security Type % of Investments
1
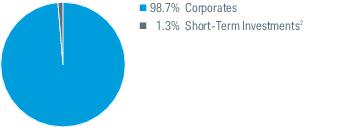
Portfolio holdings may have changed since the report date.
1
Excludes derivatives.
2
Includes the fund’s position in money market mutual funds registered under the Investment Company Act of 1940, as amended.
FUND COSTS FOR THE LAST six months ENDED June 30, 2026
(BASED ON A HYPOTHETICAL $10,000 INVESTMENT)
COSTS OF A $10,000 INVESTMENT |
COSTS PAID AS A PERCENTAGE OF A $10,000 INVESTMENT | |
Schwab Municipal Bond ETF |
$2 |
0.03% * |
*
Annualized.
Average Annual Total Returns
Fund and Inception Date |
6 Months |
1 Year |
Since Inception* |
Fund: Schwab Municipal Bond ETF (10/12/2022) 1,2 |
1.94% |
6.49% |
4.20% |
Bloomberg Municipal Bond Index 3 |
2.32% |
7.03% |
4.63% |
ICE AMT-Free Core U.S. National Municipal Index |
2.12% |
6.76% |
4.28% |
All total returns on this page assume dividends and distributions were reinvested. Index figures do not include trading and management costs, which would lower
performance. Indices are unmanaged and cannot be invested in directly. Performance results less than one year are not annualized.
For index definitions, please see www.schwabassetmanagement.com/glossary.
Shares are bought and sold at market price, which may be higher or lower than the net asset value (NAV). Brokerage commissions will reduce returns.
“ICE
®
” is a registered trademark of ICE Data Indices, LLC or its affiliates. This trademark has been licensed, along with the ICE AMT-Free Core U.S. National Municipal Index
(“Index”) for use by Charles Schwab Investment Management, Inc., dba Schwab Asset Management, in connection with the Schwab Municipal Bond ETF. The Schwab
Municipal Bond ETF is not sponsored, endorsed, sold or promoted by ICE Data Indices, LLC, its affiliates or its Third Party Suppliers (“ICE Data and its Suppliers”). ICE Data and
its Suppliers make no representations or warranties regarding the advisability of investing in the Schwab Municipal Bond ETF.
*
Inception (10/12/2022) represents the date that the shares began trading in the secondary market.
1
Performance does not reflect the deduction of taxes that a shareholder would pay on fund distributions or on the redemption or sale of fund shares.
2
Performance is shown on a NAV basis. The fund’s per share NAV is the value of one share of the fund. NAV is calculated by taking the fund’s total assets (including the fair
value of securities owned), subtracting liabilities, and dividing by the number of shares outstanding. Returns assume that dividends and capital gain distributions have been
reinvested in the fund at NAV.
3
The Bloomberg Municipal Bond Index serves as the fund’s regulatory index and provides a broad measure of market performance. The fund generally invests in securities
that are included in the ICE AMT-Free Core U.S. National Municipal Index. The fund does not seek to track the regulatory index.
To obtain performance
information current to the most recent month end, please visit
www.schwabassetmanagement.com/prospectus
.
Statistics
Net Assets (millions) |
$3,981 |
Number of Holdings |
6,851 |
Portfolio Turnover Rate (not annualized; excludes in-kind transactions) |
4% |
Weighted Average Maturity (Source: Aladdin) |
7.5 Yrs |
Weighted Average Duration (Source: Aladdin) |
6.6 Yrs |
Portfolio Composition By Security Type % of Investments
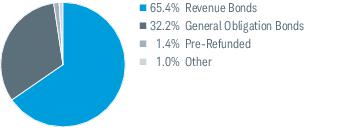
Portfolio holdings may have changed since the report date.
FUND COSTS FOR THE LAST six months ENDED June 30, 2026
(BASED ON A HYPOTHETICAL $10,000 INVESTMENT)
COSTS OF A $10,000 INVESTMENT |
COSTS PAID AS A PERCENTAGE OF A $10,000 INVESTMENT | |
Schwab Core Bond ETF |
$8 |
0.16% * |
*
Annualized.
Average Annual Total Returns
Fund and Inception Date |
6 Months |
1 Year |
Since Inception* |
Fund: Schwab Core Bond ETF (02/05/2025) 1,2 |
0.91% |
4.44% |
5.73% |
Bloomberg US Aggregate Bond Index |
0.62% |
3.79% |
5.04% |
All total returns on this page assume dividends and distributions were reinvested. Index figures do not include trading and management costs, which would lower
performance. Indices are unmanaged and cannot be invested in directly. Performance results less than one year are not annualized.
For index definitions, please see www.schwabassetmanagement.com/glossary.
Shares are bought and sold at market price, which may be higher or lower than the net asset value (NAV). Brokerage commissions will reduce returns.
*
Inception (02/05/2025) represents the date that the shares began trading in the secondary market.
1
Performance does not reflect the deduction of taxes that a shareholder would pay on fund distributions or on the redemption or sale of fund shares.
2
Performance is shown on a NAV basis. The fund’s per share NAV is the value of one share of the fund. NAV is calculated by taking the fund’s total assets (including the fair
value of securities owned), subtracting liabilities, and dividing by the number of shares outstanding. Returns assume that dividends and capital gain distributions have been
reinvested in the fund at NAV.
To obtain performance
information current to the most recent month end, please visit
www.schwabassetmanagement.com/prospectus
.
Statistics
Net Assets (millions) |
$1,497 |
Number of Holdings |
548 |
Portfolio Turnover Rate (not annualized; excludes in-kind transactions) |
48% |
Weighted Average Maturity (Source: Aladdin) |
8.1 Yrs |
Weighted Average Duration (Source: Aladdin) |
5.8 Yrs |
Portfolio Composition By Security Type % of Investments
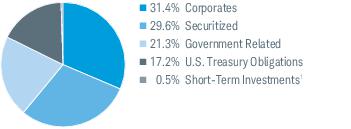
Portfolio holdings may have changed since the report date.
1
Includes the fund’s position in money market mutual funds registered under the Investment Company Act of 1940, as amended.
FUND COSTS FOR THE LAST six months ENDED June 30, 2026
(BASED ON A HYPOTHETICAL $10,000 INVESTMENT)
COSTS OF A $10,000 INVESTMENT |
COSTS PAID AS A PERCENTAGE OF A $10,000 INVESTMENT | |
Schwab Ultra-Short Income ETF |
$7 |
0.14% * |
*
Annualized.
Average Annual Total Returns
Fund and Inception Date |
6 Months |
1 Year |
Since Inception* |
Fund: Schwab Ultra-Short Income ETF (08/13/2024) 1,2 |
1.69% |
3.99% |
4.43% |
Bloomberg US Aggregate Bond Index 3 |
0.62% |
3.79% |
3.44% |
ICE BofA US 3-Month Treasury Bill Index |
1.74% |
3.84% |
4.19% |
All total returns on this page assume dividends and distributions were reinvested. Index figures do not include trading and management costs, which would lower
performance. Indices are unmanaged and cannot be invested in directly. Performance results less than one year are not annualized.
For index definitions, please see www.schwabassetmanagement.com/glossary.
Shares are bought and sold at market price, which may be higher or lower than the net asset value (NAV). Brokerage commissions will reduce returns.
*
Inception (08/13/2024) represents the date that the shares began trading in the secondary market.
1
Performance does not reflect the deduction of taxes that a shareholder would pay on fund distributions or on the redemption or sale of fund shares.
2
Performance is shown on a NAV basis. The fund’s per share NAV is the value of one share of the fund. NAV is calculated by taking the fund’s total assets (including the fair
value of securities owned), subtracting liabilities, and dividing by the number of shares outstanding. Returns assume that dividends and capital gain distributions have been
reinvested in the fund at NAV.
3
The Bloomberg US Aggregate Bond Index serves as the fund’s regulatory index and provides a broad measure of market performance. The ICE BofA US 3-Month Treasury
Bill Index is the fund’s additional index and is more representative of the fund’s investment universe than the regulatory index.
To obtain performance
information current to the most recent month end, please visit
www.schwabassetmanagement.com/prospectus
.
Statistics
Net Assets (millions) |
$242 |
Number of Holdings |
154 |
Portfolio Turnover Rate (not annualized) |
19% |
Weighted Average Maturity (Source: Aladdin) |
0.8 Yr |
Weighted Average Duration (Source: Aladdin) |
0.7 Yr |
Portfolio Composition By Security Type % of Investments
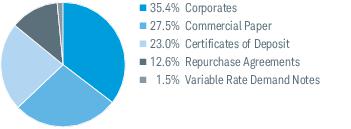
Portfolio holdings may have changed since the report date.
FUND COSTS FOR THE LAST six months ENDED June 30, 2026
(BASED ON A HYPOTHETICAL $10,000 INVESTMENT)
COSTS OF A $10,000 INVESTMENT |
COSTS PAID AS A PERCENTAGE OF A $10,000 INVESTMENT | |
Schwab Government Money Market ETF |
$14 |
0.28% * |
*
Annualized.
Statistics
Net Assets (millions) |
$777 |
Number of Holdings |
213 |
Weighted Average Maturity |
39 Days |
30-Day SEC Yield |
3.41% |
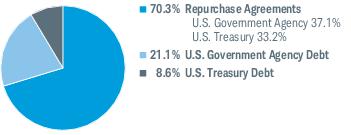
Portfolio Composition by Security Type % of Investments
Portfolio Composition By Effective Maturity % of Investments
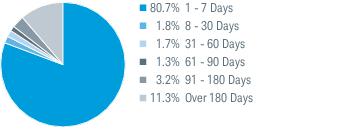
Portfolio holdings may have changed since the report date.
| [1] | Annualized. |