Exhibit (c)(v)
Project ECLIPSEDiscussion Materials for the Special Committee of the Board of Directors June 5, 2026 Confidential
Exhibit (c)(v)
Project ECLIPSEDiscussion Materials for the Special Committee of the Board of Directors June 5, 2026 Confidential
ECLIPSE Disclaimer This presentation (together with any accompanying oral presentation and any supplementary documents provided therewith, the “Presentation”) has been prepared by William Blair & Company, L.L.C. (“William Blair”) exclusively for the benefit and internal use of the recipient (the “Recipient”). The Recipient is not permitted to reproduce in whole or in part the information provided in this Presentation (the “Information”) or to communicate the Information to any third party without William Blair’s prior written consent. No party may rely on this Presentation without William Blair’s prior written consent. William Blair and its affiliates, partners, directors, employees and agents do not accept responsibility or liability for this Presentation or its contents (except to the extent that such liability cannot be excluded by law). This Presentation is for discussion purposes only and speaks only as of the date it is given, and the views expressed are subject to change based on a number of factors, including market conditions and the Recipient’s business and prospects. The Information, whether taken from public sources, received from the Recipient or elsewhere, has not been independently verified by William Blair and William Blair has relied upon and assumed the accuracy and completeness of all Information. No representation or warranty is made as to any to the accuracy or completeness of any Information. In furnishing this Presentation, William Blair undertakes no obligation to provide additional information or to correct or update any of the Information. William Blair, together with its affiliates and partners, is a financial services institution engaged in a wide range of investment banking and other activities (including, but not limited to, investment management, corporate finance, private wealth management, securities trading, research and brokerage activities). It is understood and agreed that William Blair may, from time to time, make a market in, have a long or short position, buy and sell or otherwise effect transactions for customer accounts and for their own accounts in the securities of, or may perform or be solicited to perform investment banking, corporate finance or other services for, the Recipient and other third-party entities which are or may be the subject of the transactions contemplated by this Presentation. William Blair has adopted policies and procedures designed to ensure the independence of its research analysts, whose views may differ from those of William Blair’s investment banking department and who may produce research reports and other materials the timing or content of which conflict with the views of the investment banking department or the Recipient’s interests, in connection with the transactions contemplated by this Presentation or otherwise. Nothing in the Presentation is, or shall be relied upon as, investment advice or any recommendation by William Blair. This Presentation does not purport to contain all of the information that may be necessary or appropriate to evaluate the proposed transaction, and the Recipient should conduct its own independent assessment and such investigations as it deems necessary. Recipient should rely on its own counsel, accountants and other similar expert advisors for legal, regulatory, accounting, tax and other similar advice. Nothing in the Presentation or any related discussions is intended to create, or shall be construed as creating, a principal-agent, advisor-client or fiduciary relationship between William Blair and the Recipient. Confidential 1
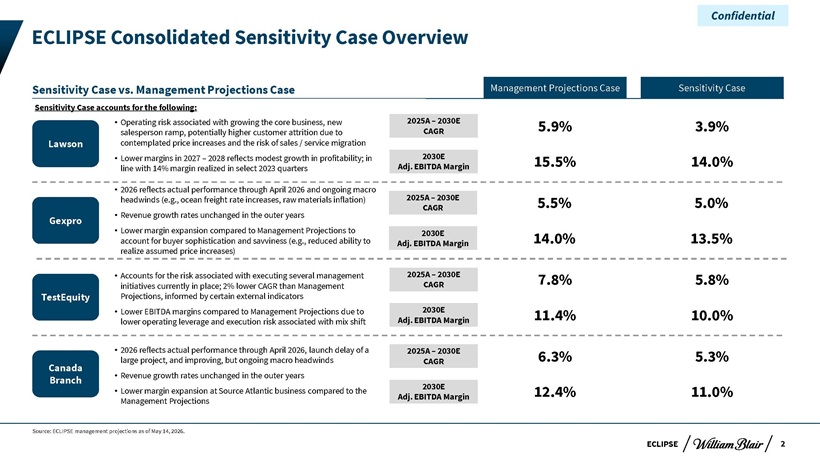
ECLIPSE ECLIPSE Consolidated Sensitivity Case Overview Source: ECLIPSE management projections as of May 14, 2026. Confidential Sensitivity Case vs. Management Projections Case Sensitivity Case accounts for the following: •2026 reflects actual performance through April 2026 and ongoing macro headwinds (e.g., ocean freight rate increases, raw materials inflation) •Revenue growth rates unchanged in the outer years •Lower margin expansion compared to Management Projections to account for buyer sophistication and savviness (e.g., reduced ability to realize assumed price increases) •Accounts for the risk associated with executing several management initiatives currently in place; 2% lower CAGR than Management Projections, informed by certain external indicators •Lower EBITDA margins compared to Management Projections due to lower operating leverage and execution risk associated with mix shift •2026 reflects actual performance through April 2026, launch delay of a large project, and improving, but ongoing macro headwinds •Revenue growth rates unchanged in the outer years •Lower margin expansion at Source Atlantic business compared to the Management Projections •Operating risk associated with growing the core business, new salesperson ramp, potentially higher customer attrition due to contemplated price increases and the risk of sales / service migration •Lower margins in 2027 – 2028 reflects modest growth in profitability; in line with 14% margin realized in select 2023 quarters Management Projections Case Sensitivity Case 2025A – 2030E CAGR 2030E Adj. EBITDA Margin 5.9% 3.9% 15.5% 14.0% 2025A – 2030E CAGR 2030E Adj. EBITDA Margin 5.5% 5.0% 14.0% 13.5% 2025A – 2030E CAGR 2030E Adj. EBITDA Margin 6.3% 5.3% 12.4% 11.0% 2025A – 2030E CAGR 2030E Adj. EBITDA Margin 7.8% 5.8% 11.4% 10.0% Lawson Gexpro TestEquity Canada Branch2
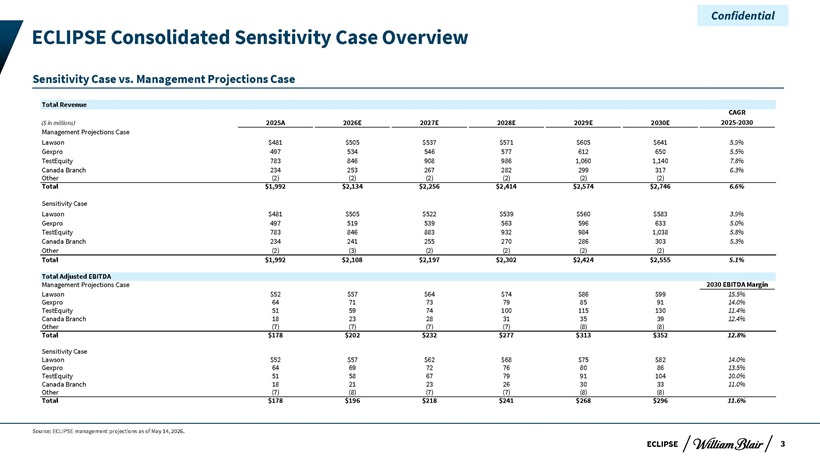
EConfidential ECLIPSE Consolidated Sensitivity Case Overview Sensitivity Case vs. Management Projections Case Total Revenue CAGR ($ in millions) 2025A 2026E 2027E 2028E 2029E 2030E 2025-2030 Management Projections Case Lawson $481 $505 $537 $571 $605 $641 5.9% Gexpro 497 534 546 577 612 650 5.5% TestEquity 783 846 908 986 1,060 1,140 7.8% Canada Branch 234 253 267 282 299 317 6.3% Other (2) (2) (2) (2) (2) (2) Total $1,992 $2,134 $2,256 $2,414 $2,574 $2,746 6.6% Sensitivity Case Lawson $481 $505 $522 $539 $560 $583 3.9% Gexpro 497 519 539 563 596 633 5.0% TestEquity 783 846 883 932 984 1,038 5.8% Canada Branch 234 241 255 270 286 303 5.3% Other (2) (3) (2) (2) (2) (2) Total $1,992 $2,108 $2,197 $2,302 $2,424 $2,555 5.1% Total Adjusted EBITDA Management Projections Case 2030 EBITDA Margin Lawson $52 $57 $64 $74 $86 $99 15.5% Gexpro 64 71 73 79 85 91 14.0% TestEquity 51 59 74 100 115 130 11.4% Canada Branch 18 23 28 31 35 39 12.4% Other (7) (7) (7) (7) (8) (8) Total $178 $202 $232 $277 $313 $352 12.8% Sensitivity Case Lawson $52 $57 $62 $68 $75 $82 14.0% Gexpro 64 69 72 76 80 86 13.5% TestEquity 51 58 67 79 91 104 10.0% Canada Branch 18 21 23 26 30 33 11.0% Other (7) (8) (7) (7) (8) (8) Total $178 $196 $218 $241 $268 $296 11.6% Source: ECLIPSE management projections as of May 14, 2026. ECLIPSE 3
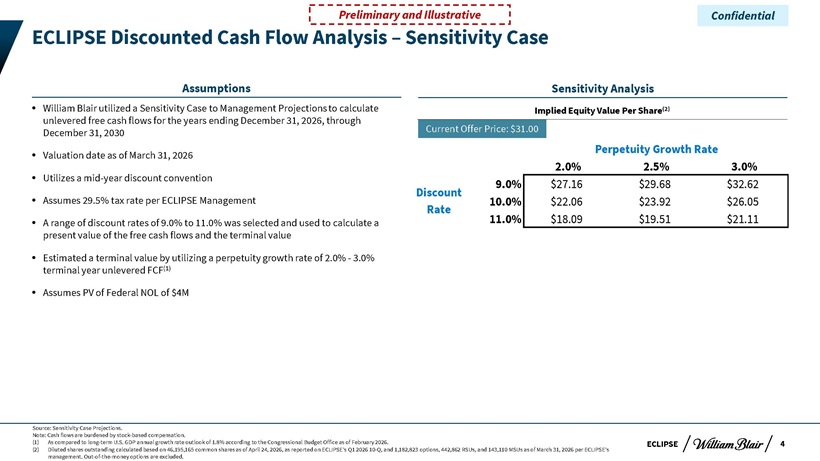
ECLIPSE ECLIPSE Discounted Cash Flow Analysis – Sensitivity Case William Blair utilized a Sensitivity Case to Management Projections to calculate unlevered free cash flows for the years ending December 31, 2026, through December 31, 2030 Valuation date as of March 31, 2026 Utilizes a mid-year discount convention Assumes 29.5% tax rate per ECLIPSE Management A range of discount rates of 9.0% to 11.0% was selected and used to calculate a present value of the free cash flows and the terminal value Estimated a terminal value by utilizing a perpetuity growth rate of 2.0%—3.0% terminal year unlevered FCF(1) Assumes PV of Federal NOL of $4M Assumptions Source: Sensitivity Case Projections. Note: Cash flows are burdened by stock-based compensation. (1) As compared to long-term U.S. GDP annual growth rate outlook of 1.8% according to the Congressional Budget Office as of February 2026. (2) Diluted shares outstanding calculated based on 46,195,165 common shares as of April 24, 2026, as reported on ECLIPSE’s Q1 2026 10-Q, and 1,182,823 options, 442,862 RSUs, and 143,110 MSUs as of March 31, 2026 per ECLIPSE’s management. Out-of-the-money options are excluded. Confidential 4 Current Offer Price: $31.00 Perpetuity Growth Rate 2.0% 2.5% 3.0% 9.0% $27.16 $29.68 $32.62 10.0% $22.06 $23.92 $26.05 11.0% $18.09 $19.51 $21.11 Discount Rate Sensitivity Analysis Implied Equity Value Per Share(2)
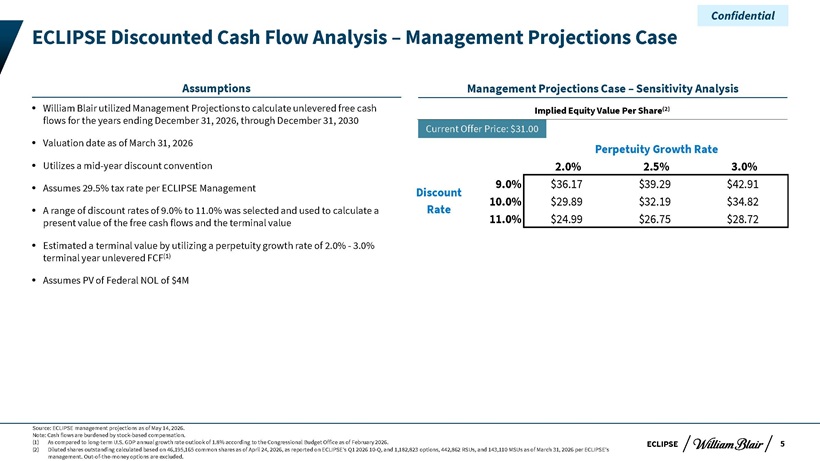
ECLIPSE ECLIPSE Discounted Cash Flow Analysis – Management Projections Case William Blair utilized Management Projections to calculate unlevered free cash flows for the years ending December 31, 2026, through December 31, 2030 Valuation date as of March 31, 2026 Utilizes a mid-year discount convention Assumes 29.5% tax rate per ECLIPSE Management A range of discount rates of 9.0% to 11.0% was selected and used to calculate a present value of the free cash flows and the terminal value Estimated a terminal value by utilizing a perpetuity growth rate of 2.0%—3.0% terminal year unlevered FCF(1) Assumes PV of Federal NOL of $4M Assumptions Source: ECLIPSE management projections as of May 14, 2026. Note: Cash flows are burdened by stock-based compensation. (1) As compared to long-term U.S. GDP annual growth rate outlook of 1.8% according to the Congressional Budget Office as of February 2026. (2) Diluted shares outstanding calculated based on 46,195,165 common shares as of April 24, 2026, as reported on ECLIPSE’s Q1 2026 10-Q, and 1,182,823 options, 442,862 RSUs, and 143,110 MSUs as of March 31, 2026 per ECLIPSE’s management. Out-of-the-money options are excluded. Confidential 5 Current Offer Price: $31.00 Perpetuity Growth Rate 2.0% 2.5% 3.0% 9.0% $36.17 $39.29 $42.91 10.0% $29.89 $32.19 $34.82 11.0% $24.99 $26.75 $28.72 Discount Rate Management Projections Case – Sensitivity Analysis Implied Equity Value Per Share(2)
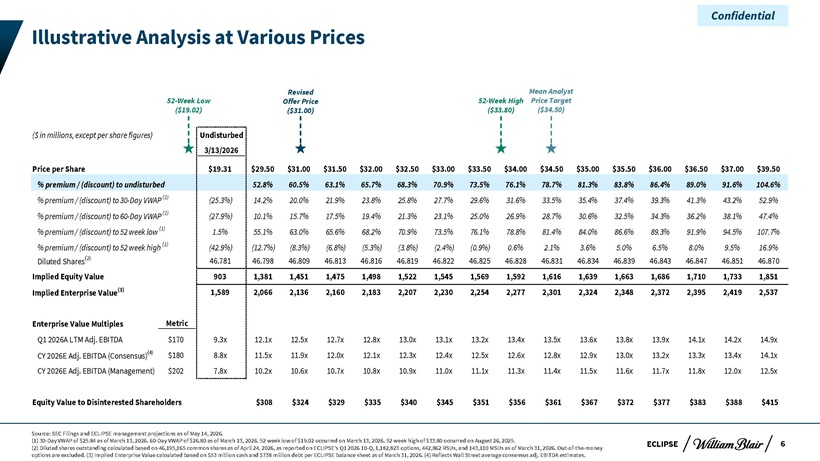
ECLIPSE Illustrative Analysis at Various Prices ($ in millions, except per share figures) Undisturbed 3/13/2026 Price per Share $19.31 $29.50 $31.00 $31.50 $32.00 $32.50 $33.00 $33.50 $34.00 $34.50 $35.00 $35.50 $36.00 $36.50 $37.00 $39.50 % premium / (discount) to undisturbed 52.8% 60.5% 63.1% 65.7% 68.3% 70.9% 73.5% 76.1% 78.7% 81.3% 83.8% 86.4% 89.0% 91.6% 104.6% % premium / (discount) to 30-Day VWAP (1) (25.3%) 14.2% 20.0% 21.9% 23.8% 25.8% 27.7% 29.6% 31.6% 33.5% 35.4% 37.4% 39.3% 41.3% 43.2% 52.9% % premium / (discount) to 60-Day VWAP (1) (27.9%) 10.1% 15.7% 17.5% 19.4% 21.3% 23.1% 25.0% 26.9% 28.7% 30.6% 32.5% 34.3% 36.2% 38.1% 47.4% % premium / (discount) to 52 week low (1) 1.5% 55.1% 63.0% 65.6% 68.2% 70.9% 73.5% 76.1% 78.8% 81.4% 84.0% 86.6% 89.3% 91.9% 94.5% 107.7% % premium / (discount) to 52 week high (1) (42.9%) (12.7%) (8.3%) (6.8%) (5.3%) (3.8%) (2.4%) (0.9%) 0.6% 2.1% 3.6% 5.0% 6.5% 8.0% 9.5% 16.9% Diluted Shares(2) 46.781 46.798 46.809 46.813 46.816 46.819 46.822 46.825 46.828 46.831 46.834 46.839 46.843 46.847 46.851 46.870 Implied Equity Value 903 1,381 1,451 1,475 1,498 1,522 1,545 1,569 1,592 1,616 1,639 1,663 1,686 1,710 1,733 1,851 Implied Enterprise Value(3) 1,589 2,066 2,136 2,160 2,183 2,207 2,230 2,254 2,277 2,301 2,324 2,348 2,372 2,395 2,419 2,537 Enterprise Value Multiples Metric Q1 2026A LTM Adj. EBITDA $170 9.3x 12.1x 12.5x 12.7x 12.8x 13.0x 13.1x 13.2x 13.4x 13.5x 13.6x 13.8x 13.9x 14.1x 14.2x 14.9x CY 2026E Adj. EBITDA (Consensus)(4) $180 8.8x 11.5x 11.9x 12.0x 12.1x 12.3x 12.4x 12.5x 12.6x 12.8x 12.9x 13.0x 13.2x 13.3x 13.4x 14.1x CY 2026E Adj. EBITDA (Management) $202 7.8x 10.2x 10.6x 10.7x 10.8x 10.9x 11.0x 11.1x 11.3x 11.4x 11.5x 11.6x 11.7x 11.8x 12.0x 12.5x Equity Value to Disinterested Shareholders $308 $324 $329 $335 $340 $345 $351 $356 $361 $367 $372 $377 $383 $388 $415 Source: SEC Filings and ECLIPSE management projections as of May 14, 2026. (1) 30-Day VWAP of $25.84 as of March 13, 2026. 60-Day VWAP of $26.80 as of March 13, 2026. 52 week low of $19.02 occurred on March 13, 2026. 52 week high of $33.80 occurred on August 26, 2025. (2) Diluted shares outstanding calculated based on 46,195,165 common shares as of April 24, 2026, as reported on ECLIPSE’s Q1 2026 10-Q, 1,182,823 options, 442,862 RSUs, and 143,110 MSUs as of March 31, 2026. Out-of-the-money options are excluded. (3) Implied Enterprise Value calculated based on $53 million cash and $738 million debt per ECLIPSE balance sheet as of March 31, 2026. (4) Reflects Wall Street average consensus adj. EBITDA estimates. Confidential 52-Week Low ($19.02) 52-Week High ($33.80) Mean Analyst Price Target ($34.50)6 Revised Offer Price ($31.00)
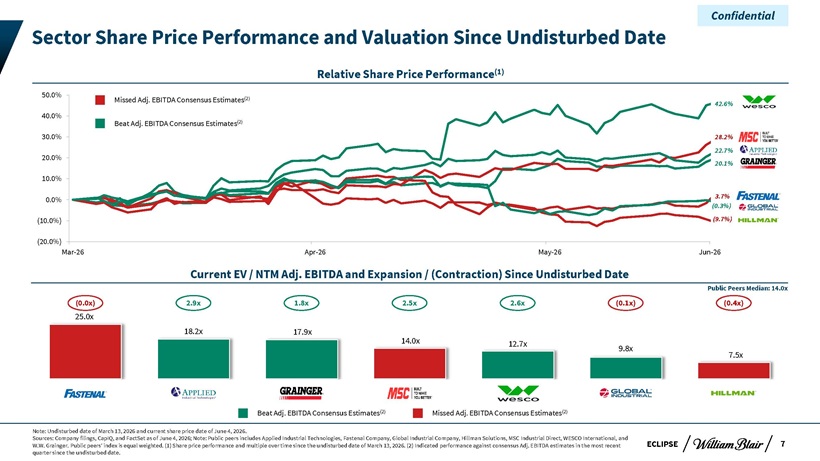
Confidential Sector Share Price Performance and Valuation Since Undisturbed Date Relative Share Price Performance(1) 50.0% Missed Adj. EBITDA Consensus Estimates(2) 42.6% 40.0% Beat Adj. EBITDA Consensus Estimates(2) 30.0% 28.2% 20.0% 22.7% 20.1% 10.0% 0.0% 3.7% (0.3%) (10.0%) (9.7%) (20.0%) Mar-26 Apr-26 May-26 Jun-26 Current EV / NTM Adj. EBITDA and Expansion / (Contraction) Since Undisturbed Date Public Peers Median: 14.0x (0.0x) 2.9x 1.8x 2.5x 2.6x (0.1x) (0.4x) 25.0x 18.2x 17.9x 14.0x 12.7x 9.8x 7.5x Beat Adj. EBITDA Consensus Estimates(2) Missed Adj. EBITDA Consensus Estimates(2) Note: Undisturbed date of March 13, 2026 and current share price date of June 4, 2026. Sources: Company filings, CapIQ, and FactSet as of June 4, 2026; Note: Public peers includes Applied Industrial Technologies, Fastenal Company, Global Industrial Company, Hillman Solutions, MSC Industrial Direct, WESCO International, and W.W. Grainger. Public peers’ index is equal weighted. (1) Share price performance and multiple over time since the undisturbed date of March 13, 2026. (2) Indicated performance against consensus Adj. EBITDA estimates in the most recent ECLIPSE 7 quarter since the undisturbed date.
Confidential Appendix
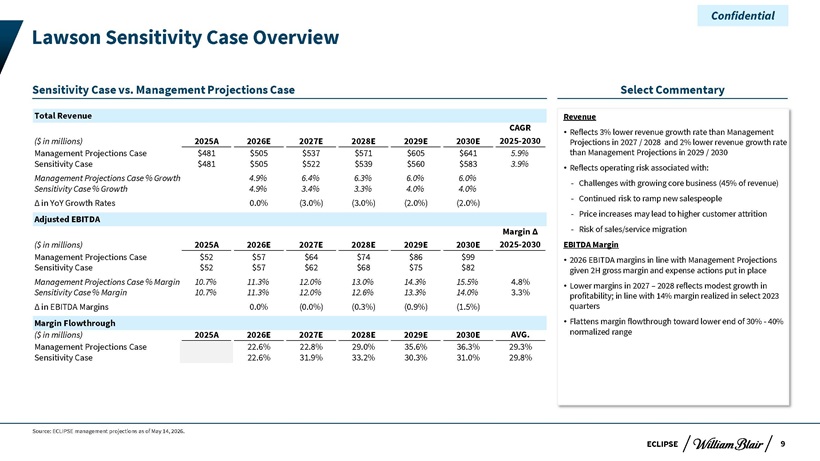
Confidential Lawson Sensitivity Case Overview Sensitivity Case vs. Management Projections Case Select Commentary Total Revenue Revenue CAGR • Reflects 3% lower revenue growth rate than Management ($ in millions) 2025A 2026E 2027E 2028E 2029E 2030E 2025-2030 Projections in 2027 / 2028 and 2% lower revenue growth rate Management Projections Case $481 $505 $537 $571 $605 $641 5.9% than Management Projections in 2029 / 2030 Sensitivity Case $481 $505 $522 $539 $560 $583 3.9% • Reflects operating risk associated with: Management Projections Case % Growth 4.9% 6.4% 6.3% 6.0% 6.0% ? Challenges with growing core business (45% of revenue) Sensitivity Case % Growth 4.9% 3.4% 3.3% 4.0% 4.0% ? Continued risk to ramp new salespeople Ä in YoY Growth Rates 0.0% (3.0%) (3.0%) (2.0%) (2.0%) ? Price increases may lead to higher customer attrition Adjusted EBITDA Margin Ä ? Risk of sales/service migration ($ in millions) 2025A 2026E 2027E 2028E 2029E 2030E 2025-2030 EBITDA Margin Management Projections Case $52 $57 $64 $74 $86 $99 • 2026 EBITDA margins in line with Management Projections Sensitivity Case $52 $57 $62 $68 $75 $82 given 2H gross margin and expense actions put in place Management Projections Case % Margin 10.7% 11.3% 12.0% 13.0% 14.3% 15.5% 4.8% • Lower margins in 2027 – 2028 reflects modest growth in Sensitivity Case % Margin 10.7% 11.3% 12.0% 12.6% 13.3% 14.0% 3.3% profitability; in line with 14% margin realized in select 2023 Ä in EBITDA Margins 0.0% (0.0%) (0.3%) (0.9%) (1.5%) quarters Margin Flowthrough • Flattens margin flowthrough toward lower end of 30%—40% ($ in millions) 2025A 2026E 2027E 2028E 2029E 2030E AVG. normalized range Management Projections Case 22.6% 22.8% 29.0% 35.6% 36.3% 29.3% Sensitivity Case 22.6% 31.9% 33.2% 30.3% 31.0% 29.8% Source: ECLIPSE management projections as of May 14, 2026. ECLIPSE 9
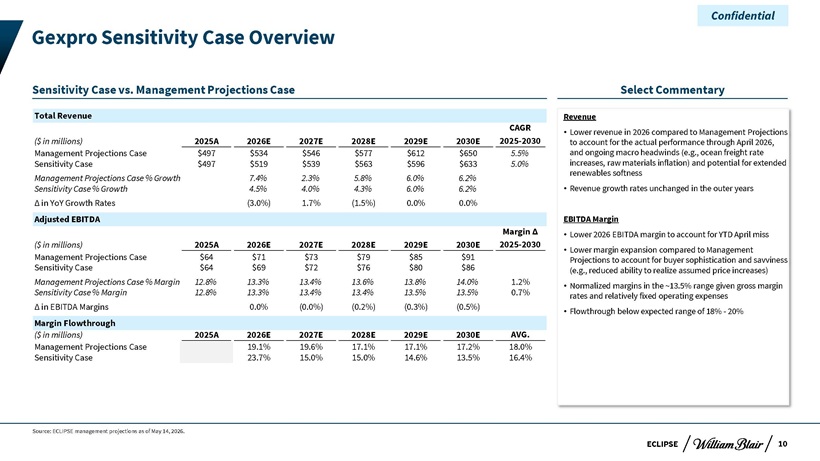
Confidential Gexpro Sensitivity Case Overview Sensitivity Case vs. Management Projections Case Select Commentary Total Revenue Revenue CAGR • Lower revenue in 2026 compared to Management Projections ($ in millions) 2025A 2026E 2027E 2028E 2029E 2030E 2025-2030 to account for the actual performance through April 2026, Management Projections Case $497 $534 $546 $577 $612 $650 5.5% and ongoing macro headwinds (e.g., ocean freight rate Sensitivity Case $497 $519 $539 $563 $596 $633 5.0% increases, raw materials inflation) and potential for extended renewables softness Management Projections Case % Growth 7.4% 2.3% 5.8% 6.0% 6.2% Sensitivity Case % Growth 4.5% 4.0% 4.3% 6.0% 6.2% • Revenue growth rates unchanged in the outer years Ä in YoY Growth Rates (3.0%) 1.7% (1.5%) 0.0% 0.0% Adjusted EBITDA EBITDA Margin Margin Ä • Lower 2026 EBITDA margin to account for YTD April miss ($ in millions) 2025A 2026E 2027E 2028E 2029E 2030E 2025-2030 • Lower margin expansion compared to Management Management Projections Case $64 $71 $73 $79 $85 $91 Projections to account for buyer sophistication and savviness Sensitivity Case $64 $69 $72 $76 $80 $86 (e.g., reduced ability to realize assumed price increases) Management Projections Case % Margin 12.8% 13.3% 13.4% 13.6% 13.8% 14.0% 1.2% • Normalized margins in the ~13.5% range given gross margin Sensitivity Case % Margin 12.8% 13.3% 13.4% 13.4% 13.5% 13.5% 0.7% rates and relatively fixed operating expenses Ä in EBITDA Margins 0.0% (0.0%) (0.2%) (0.3%) (0.5%) • Flowthrough below expected range of 18%—20% Margin Flowthrough ($ in millions) 2025A 2026E 2027E 2028E 2029E 2030E AVG. Management Projections Case 19.1% 19.6% 17.1% 17.1% 17.2% 18.0% Sensitivity Case 23.7% 15.0% 15.0% 14.6% 13.5% 16.4% Source: ECLIPSE management projections as of May 14, 2026. ECLIPSE 10
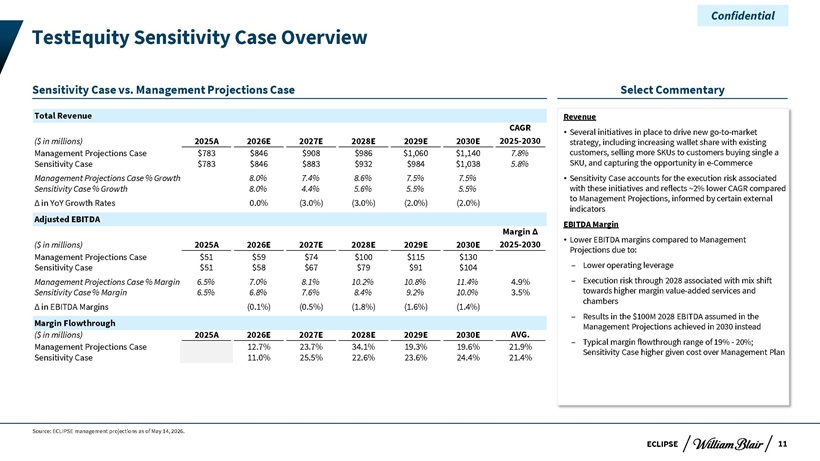
Confidential TestEquity Sensitivity Case Overview Sensitivity Case vs. Management Projections Case Select Commentary Total Revenue Revenue CAGR • Several initiatives in place to drive new go-to-market ($ in millions) 2025A 2026E 2027E 2028E 2029E 2030E 2025-2030 strategy, including increasing wallet share with existing Management Projections Case $783 $846 $908 $986 $1,060 $1,140 7.8% customers, selling more SKUs to customers buying single a Sensitivity Case $783 $846 $883 $932 $984 $1,038 5.8% SKU, and capturing the opportunity in e-Commerce Management Projections Case % Growth 8.0% 7.4% 8.6% 7.5% 7.5% • Sensitivity Case accounts for the execution risk associated Sensitivity Case % Growth 8.0% 4.4% 5.6% 5.5% 5.5% with these initiatives and reflects ~2% lower CAGR compared to Management Projections, informed by certain external in YoY Growth Rates 0.0% (3.0%) (3.0%) (2.0%) (2.0%) indicators Adjusted EBITDA EBITDA Margin Margin • Lower EBITDA margins compared to Management ($ in millions) 2025A 2026E 2027E 2028E 2029E 2030E 2025-2030 Projections due to: Management Projections Case $51 $59 $74 $100 $115 $130 Lower operating leverage Sensitivity Case $51 $58 $67 $79 $91 $104 Management Projections Case % Margin 6.5% 7.0% 8.1% 10.2% 10.8% 11.4% 4.9% Execution risk through 2028 associated with mix shift Sensitivity Case % Margin 6.5% 6.8% 7.6% 8.4% 9.2% 10.0% 3.5% towards higher margin value-added services and chambers in EBITDA Margins (0.1%) (0.5%) (1.8%) (1.6%) (1.4%) Results in the $100M 2028 EBITDA assumed in the Margin Flowthrough Management Projections achieved in 2030 instead ($ in millions) 2025A 2026E 2027E 2028E 2029E 2030E AVG. Typical margin flowthrough range of 19%—20%; Management Projections Case 12.7% 23.7% 34.1% 19.3% 19.6% 21.9% Sensitivity Case higher given cost over Management Plan Sensitivity Case 11.0% 25.5% 22.6% 23.6% 24.4% 21.4% Source: ECLIPSE management projections as of May 14, 2026. ECLIPSE 11
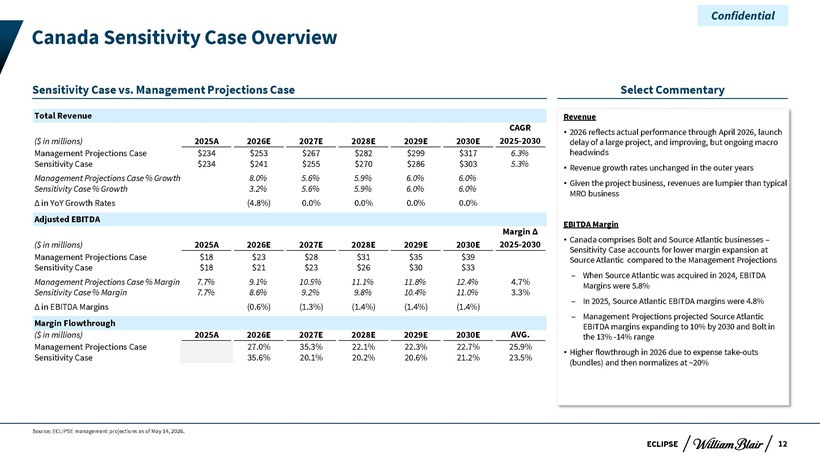
Confidential Canada Sensitivity Case Overview Sensitivity Case vs. Management Projections Case Select Commentary Total Revenue Revenue CAGR • 2026 reflects actual performance through April 2026, launch ($ in millions) 2025A 2026E 2027E 2028E 2029E 2030E 2025-2030 delay of a large project, and improving, but ongoing macro Management Projections Case $234 $253 $267 $282 $299 $317 6.3% headwinds Sensitivity Case $234 $241 $255 $270 $286 $303 5.3% • Revenue growth rates unchanged in the outer years Management Projections Case % Growth 8.0% 5.6% 5.9% 6.0% 6.0% • Given the project business, revenues are lumpier than typical Sensitivity Case % Growth 3.2% 5.6% 5.9% 6.0% 6.0% MRO business Ä in YoY Growth Rates (4.8%) 0.0% 0.0% 0.0% 0.0% Adjusted EBITDA EBITDA Margin Margin Ä and Source Atlantic businesses –• Canada comprises Bolt ($ in millions) 2025A 2026E 2027E 2028E 2029E 2030E 2025-2030 Sensitivity Case accounts for lower margin expansion at Management Projections Case $18 $23 $28 $31 $35 $39 Source Atlantic compared to the Management Projections Sensitivity Case $18 $21 $23 $26 $30 $33 ? When Source Atlantic was acquired in 2024, EBITDA Management Projections Case % Margin 7.7% 9.1% 10.5% 11.1% 11.8% 12.4% 4.7% Margins were 5.8% Sensitivity Case % Margin 7.7% 8.6% 9.2% 9.8% 10.4% 11.0% 3.3% ? In 2025, Source Atlantic EBITDA margins were 4.8% Ä in EBITDA Margins (0.6%) (1.3%) (1.4%) (1.4%) (1.4%) ? Management Projections projected Source Atlantic Margin Flowthrough EBITDA margins expanding to 10% by 2030 and Bolt in ($ in millions) 2025A 2026E 2027E 2028E 2029E 2030E AVG. the 13% -14% range Management Projections Case 27.0% 35.3% 22.1% 22.3% 22.7% 25.9% • Higher flowthrough in 2026 due to expense take-outs Sensitivity Case 35.6% 20.1% 20.2% 20.6% 21.2% 23.5% (bundles) and then normalizes at ~20% Source: ECLIPSE management projections as of May 14, 2026. ECLIPSE 12
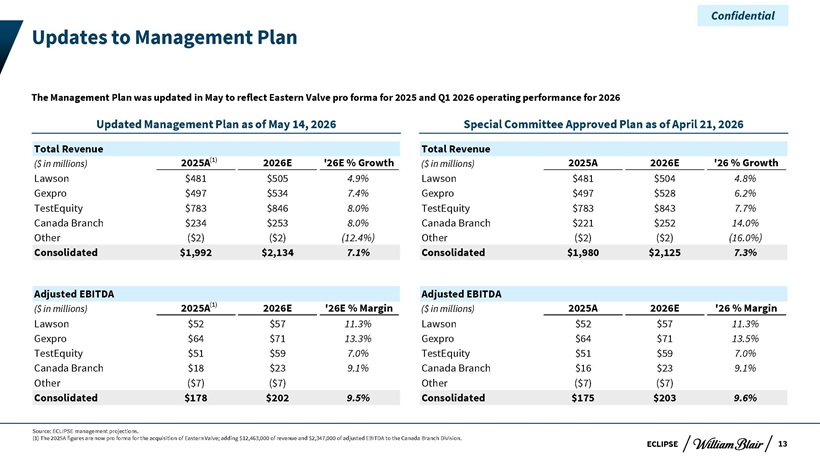
Confidential Updates to Management Plan The Management Plan was updated in May to reflect Eastern Valve pro forma for 2025 and Q1 2026 operating performance for 2026 Updated Management Plan as of May 14, 2026 Special Committee Approved Plan as of April 21, 2026 Total Revenue Total Revenue ($ in millions) 2025A(1) 2026E ‘26E % Growth ($ in millions) 2025A 2026E ‘26 % Growth Lawson $481 $505 4.9% Lawson $481 $504 4.8% Gexpro $497 $534 7.4% Gexpro $497 $528 6.2% TestEquity $783 $846 8.0% TestEquity $783 $843 7.7% Canada Branch $234 $253 8.0% Canada Branch $221 $252 14.0% Other ($2) ($2) (12.4%) Other ($2) ($2) (16.0%) Consolidated $1,992 $2,134 7.1% Consolidated $1,980 $2,125 7.3% Adjusted EBITDA Adjusted EBITDA ($ in millions) 2025A(1) 2026E ‘26E % Margin ($ in millions) 2025A 2026E ‘26 % Margin Lawson $52 $57 11.3% Lawson $52 $57 11.3% Gexpro $64 $71 13.3% Gexpro $64 $71 13.5% TestEquity $51 $59 7.0% TestEquity $51 $59 7.0% Canada Branch $18 $23 9.1% Canada Branch $16 $23 9.1% Other ($7) ($7) Other ($7) ($7) Consolidated $178 $202 9.5% Consolidated $175 $203 9.6% Source: ECLIPSE management projections. (1) The 2025A figures are now pro forma for the acquisition of Eastern Valve; adding $12,463,000 of revenue and $2,347,000 of adjusted EBITDA to the Canada Branch Division. ECLIPSE 13
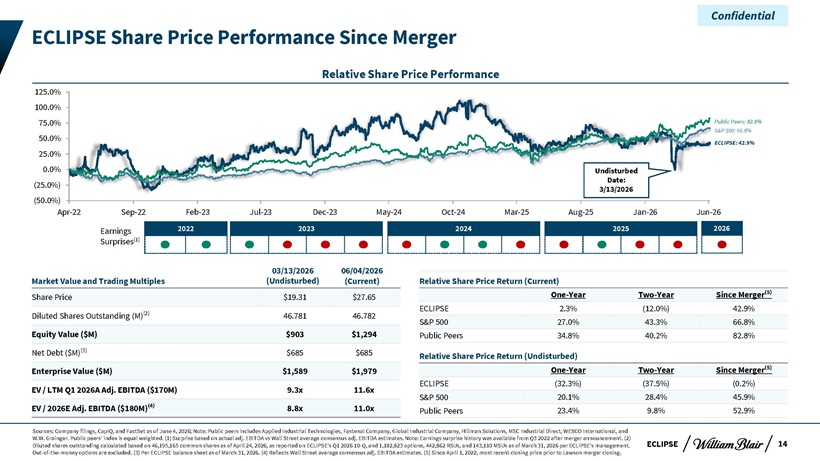
Confidential ECLIPSE Share Price Performance Since Merger Relative Share Price Performance 125.0% 100.0% 75.0% Public Peers: 82.8% 50.0% S&P 500: 66.8% ECLIPSE: 42.9% 25.0% 0.0% Undisturbed Date: (25.0%) 3/13/2026 (50.0%) Apr-22 Sep-22 Feb-23 Jul-23 Dec-23 May-24 Oct-24 Mar-25 Aug-25 Jan-26 Jun-26 Earnings 2022 2023 2024 2025 2026 Surprises(1) 03/13/2026 06/04/2026 Market Value and Trading Multiples (Undisturbed) (Current) Relative Share Price Return (Current) One-Year Two-Year Since Merger(5) Share Price $19.31 $27.65 ECLIPSE 2.3% (12.0%) 42.9% Diluted Shares Outstanding (M)(2) 46.781 46.782 S&P 500 27.0% 43.3% 66.8% Equity Value ($M) $903 $1,294 Public Peers 34.8% 40.2% 82.8% Net Debt ($M)(3) $685 $685 Relative Share Price Return (Undisturbed) Enterprise Value ($M) $1,589 $1,979 One-Year Two-Year Since Merger(5) ECLIPSE (32.3%) (37.5%) (0.2%) EV / LTM Q1 2026A Adj. EBITDA ($170M) 9.3x 11.6x S&P 500 20.1% 28.4% 45.9% EV / 2026E Adj. EBITDA ($180M)(4) 8.8x 11.0x Public Peers 23.4% 9.8% 52.9% Sources: Company filings, CapIQ, and FactSet as of June 4, 2026; Note: Public peers includes Applied Industrial Technologies, Fastenal Company, Global Industrial Company, Hillman Solutions, MSC Industrial Direct, WESCO International, and W.W. Grainger. Public peers’ index is equal weighted. (1) Surprise based on actual adj. EBITDA vs Wall Street average consensus adj. EBITDA estimates. Note: Earnings surprise history was available from Q3 2022 after merger announcement. (2) Diluted shares outstanding calculated based on 46,195,165 common shares as of April 24, 2026, as reported on ECLIPSE’s Q1 2026 10-Q, and 1,182,823 options, 442,862 RSUs, and 143,110 MSUs as of March 31, 2026 per ECLIPSE’s management. ECLIPSE 14 Out-of-the-money options are excluded. (3) Per ECLIPSE balance sheet as of March 31, 2026. (4) Reflects Wall Street average consensus adj. EBITDA estimates. (5) Since April 1, 2022, most recent closing price prior to Lawson merger closing.