Exhibit (c)(ix)
Illustrative analysis—for discussion purposes only Project Eclipse – Discussion materials May 2026
Exhibit (c)(ix)
Illustrative analysis—for discussion purposes only Project Eclipse – Discussion materials May 2026
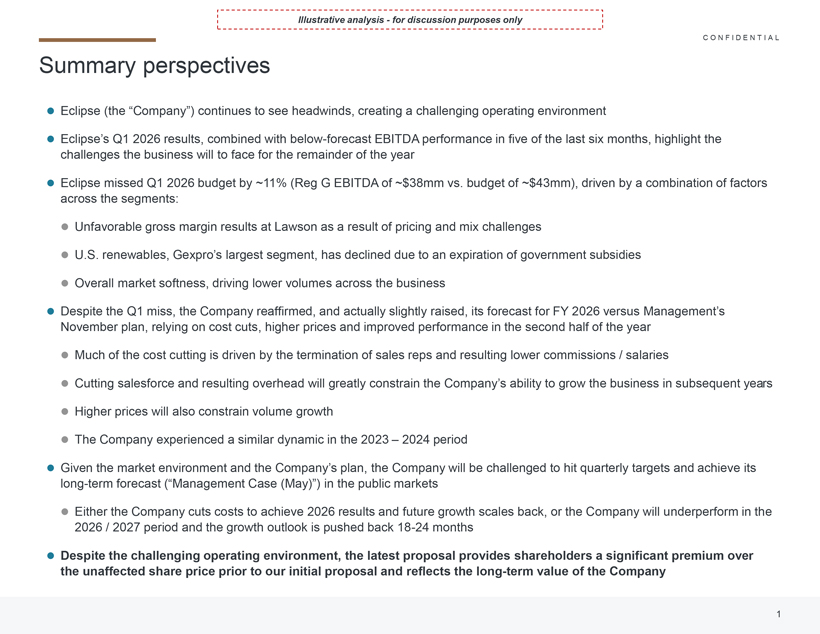
Illustrative analysis—for discussion purposes only Summary perspectives Eclipse (the “Company”) continues to see headwinds, creating a challenging operating environment CONFIDENTIAL Eclipse’s Q1 2026 results, combined with below-forecast EBITDA performance in five of the last six months, highlight the challenges the business will to face for the remainder of the year Eclipse missed Q1 2026 budget by ~11% (Reg G EBITDA of ~$38mm vs. budget of ~$43mm), driven by a combination of factors across the segments: Unfavorable gross margin results at Lawson as a result of pricing and mix challenges U.S. renewables, Gexpro’s largest segment, has declined due to an expiration of government subsidies Overall market softness, driving lower volumes across the business Despite the Q1 miss, the Company reaffirmed, and actually slightly raised, its forecast for FY 2026 versus Management’s November plan, relying on cost cuts, higher prices and improved performance in the second half of the year Much of the cost cutting is driven by the termination of sales reps and resulting lower commissions / salaries Cutting salesforce and resulting overhead will greatly constrain the Company’s ability to grow the business in subsequent years Higher prices will also constrain volume growth The Company experienced a similar dynamic in the 2023 – 2024 period Given the market environment and the Company’s plan, the Company will be challenged to hit quarterly targets and achieve its long-term forecast (“Management Case (May)”) in the public markets Either the Company cuts costs to achieve 2026 results and future growth scales back, or the Company will underperform in the 2026 / 2027 period and the growth outlook is pushed back 18-24 months Despite the challenging operating environment, the latest proposal provides shareholders a significant premium over the unaffected share price prior to our initial proposal and reflects the long-term value of the Company
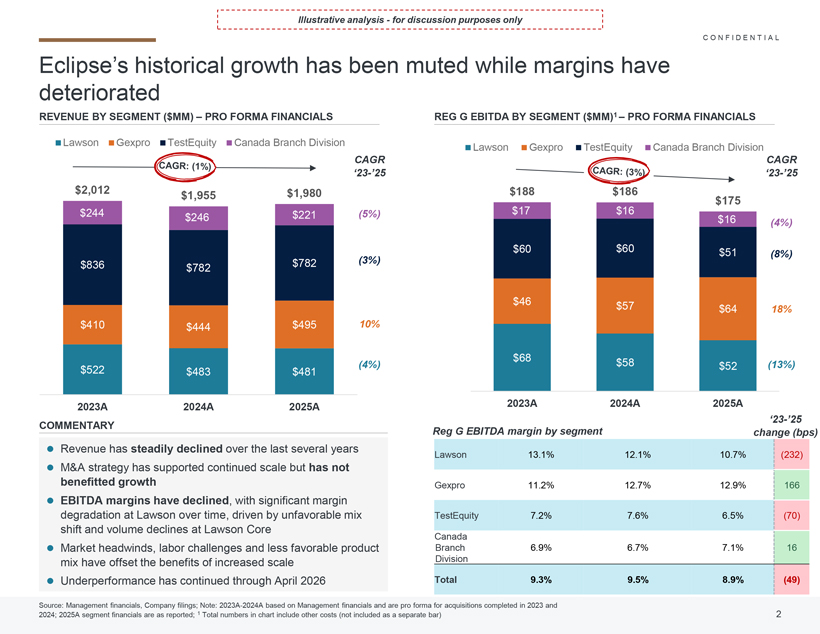
Illustrative analysis—for discussion purposes only Eclipse’s historical growth has been muted while margins have deteriorated REVENUE BY SEGMENT ($MM) –PRO FORMA FINANCIALS REG G EBITDA BY SEGMENT ($MM)1 –PRO FORMA FINANCIALSRevenue has steadily declinedover the last several years M&A strategy has supported continued scale but has not benefitted growth EBITDA margins have declined, with significant margin degradation at Lawson over time, driven by unfavorable mix shift and volume declines at Lawson Core Market headwinds, labor challenges and less favorable product mix have offset the benefits of increased scale Underperformance has continued through April 2026 Source: Management financials, Company filings; Note: 2023A-2024A based on Management financials and are pro forma for acquisitions completed in 2023 and 2024; 2025A segment financials are as reported; 1Total numbers in chart include other costs (not included as a separate bar) CONFIDENTIAL
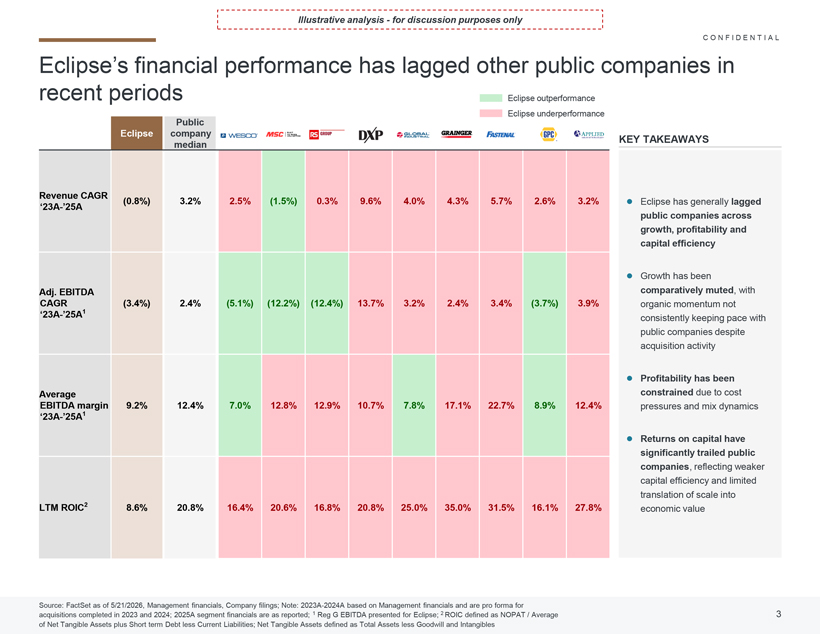
Illustrative analysis—for discussion purposes only Eclipse’s financial performance has lagged other public companies in recent periods Eclipse has generally lagged public companies across growth, profitability and capital efficiency Growth has been comparatively muted, with organic momentum not consistently keeping pace with public companies despite acquisition activity Profitability has been constraineddue tocost pressures and mix dynamics Returns on capital have significantly trailed public companies, reflecting weaker capital efficiency and limited translation of scale into economic value CONFIDENTIAL
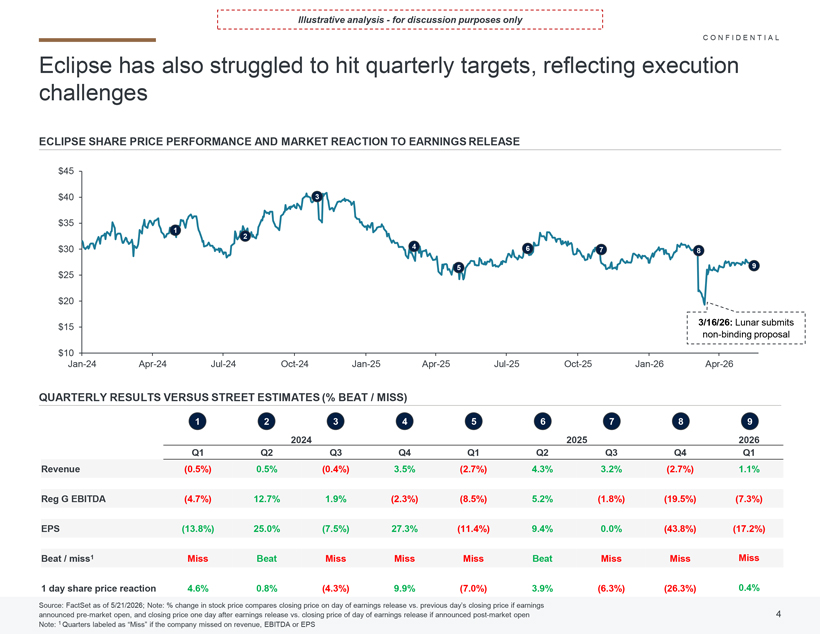
Illustrative analysis—for discussion purposes only Eclipse has also struggled to hit quarterly targets, reflecting execution challenges ECLIPSE SHARE PRICE PERFORMANCE AND MARKET REACTION TO EARNINGS RELEASE CONFIDENTIAL
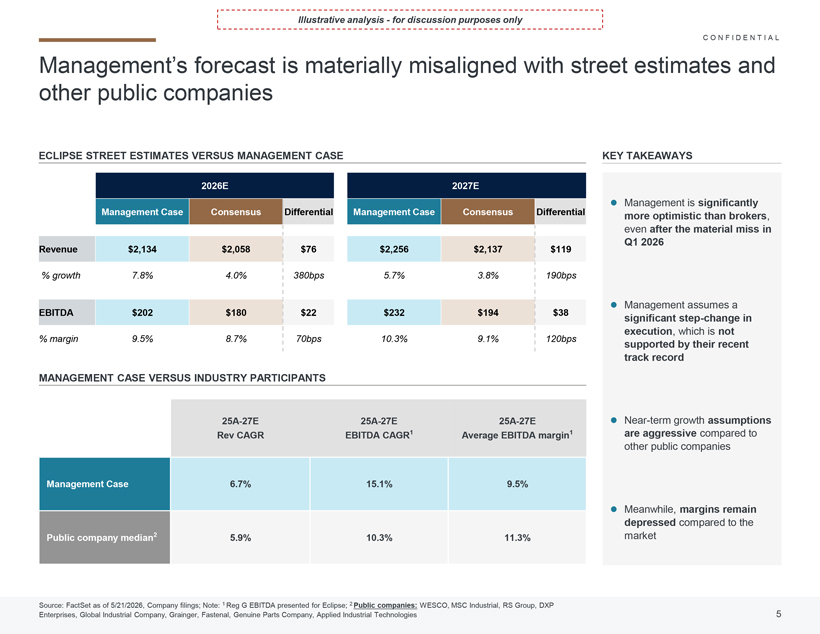
Illustrative analysis—for discussion purposes only Management’s forecast is materially misaligned with street estimates and other public companies Management is significantly more optimistic than brokers, even after the material miss in Q1 2026 Management assumes a significant step-change in execution, which is not supported by their recent track record Near-term growth assumptions are aggressivecompared to other public companies Meanwhile, margins remain depressed compared to the market Source: FactSet as of 5/21/2026, Company filings; Note: 1 Reg G EBITDA presented for Eclipse; 2 Public companies:WESCO, MSC Industrial, RS Group, DXP Enterprises, Global Industrial Company, Grainger, Fastenal, Genuine Parts Company, Applied Industrial Technologies 25A-27E Rev CAGR 25A-27E EBITDA CAGR1 25A-27E Average EBITDA margin1 Management Case 6.7% 15.1% 9.5% Public company median2 5.9% 10.3% 11.3% ECLIPSE STREET ESTIMATES VERSUS MANAGEMENT CASE MANAGEMENT CASE VERSUS INDUSTRY PARTICIPANTS 2026E 2027E Management Case Consensus Differential Management Case Consensus Differential Revenue $2,134 $2,058 $76 $2,256 $2,137 $119 % growth 7.8% 4.0% 380bps 5.7% 3.8% 190bps EBITDA $202 $180 $22 $232 $194 $38 % margin 9.5% 8.7% 70bps 10.3% 9.1% 120bps KEY TAKEAWAYS CONFIDENTIAL
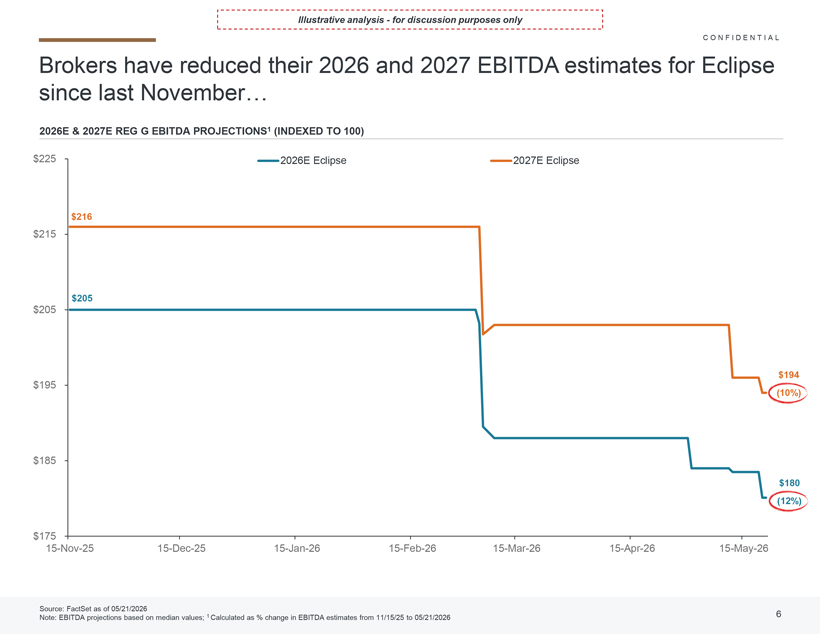
Illustrative analysis—for discussion purposes only Brokers have reduced their 2026 and 2027 EBITDA estimates for Eclipse since last November… 2026E & 2027E REG G EBITDA PROJECTIONS1 (INDEXED TO 100 CONFIDENTIAL
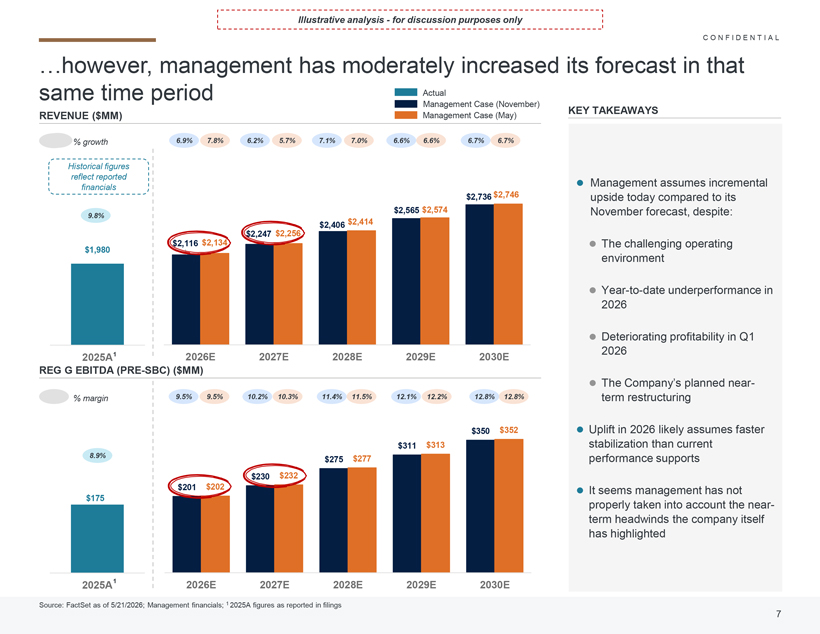
Illustrative analysis—for discussion purposes only however, management has moderately increased its forecast in that same time period Actual Management Case (November) REVENUE ($MM) % growth Historical figures reflect reported financials 9.8% $1,980 2025A 1 REG G EBITDA (PRE-SBC) ($MM) % margin 8.9% $175 2025A 1 Management Case (May) 6.9% $2,116 7.8% $2,134 6.2% $2,247 5.7% $2,256 7.1% 7.0% $2,406 $2,414 6.6% 6.6% $2,565 6.7% 6.7% $2,736 $2,574 $2,746 2026E 9.5% $201 9.5% $202 2027E 10.2% $230 10.3% $232 2028E 11.4% $275 11.5% $277 2029E 12.1% $311 2030E 12.2% $313 12.8% $350 12.8% $352 2026E 2027E 75849-007 31Aug26 14:52 Page 9 2028E Source: FactSet as of 5/21/2026; Management financials; 1 2025A figures as reported in filings 2029E 2030E KEY TAKEAWAYS Management assumes incremental upside today compared to its November forecast, despite: The challenging operating environment Year-to-date underperformance in 2026 Deteriorating profitability in Q1 2026 The Company’s planned near term restructuring Uplift in 2026 likely assumes faster stabilization than current performance supports It seems management has not properly taken into account the near term headwinds the company itself has highlighted CONFIDENTIAL
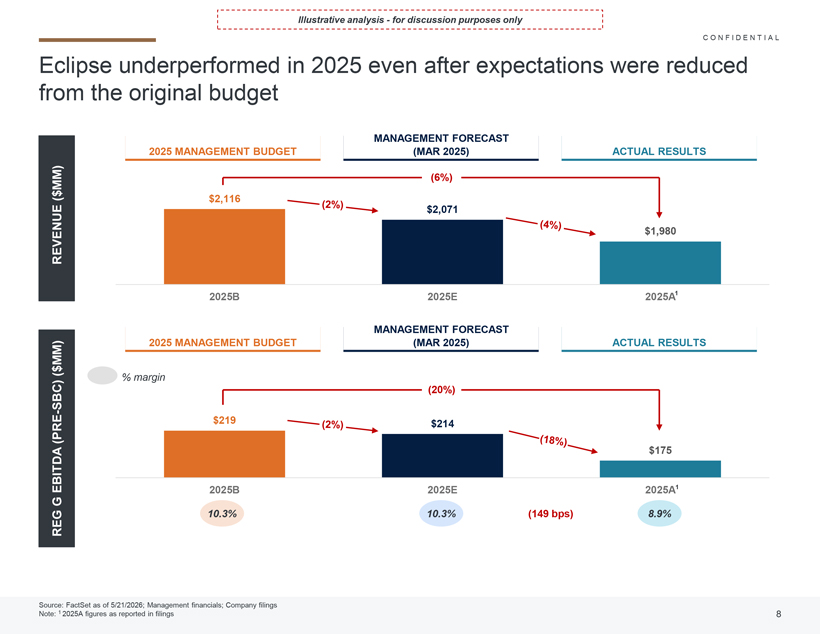
Illustrative analysis—for discussion purposes only Eclipse underperformed in 2025 even after expectations were reduced from the original budget REVENUE ($MM) REG G EBITDA (PRE-SBC) ($MM) 2025 MANAGEMENT BUDGET MANAGEMENT FORECAST (MAR 2025) ACTUAL RESULTS CONFIDENTIAL
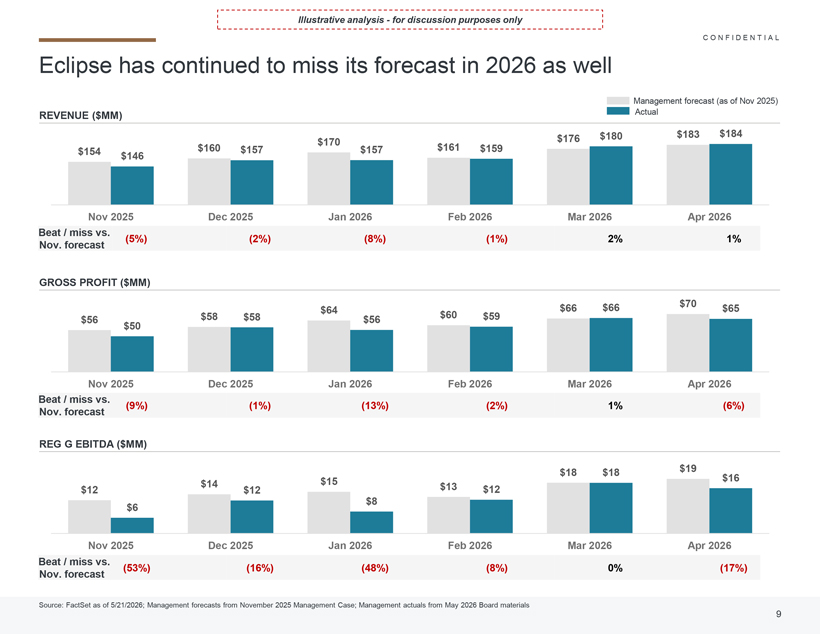
Illustrative analysis—for discussion purposes only Eclipse has continued to miss its forecast in 2026 as well REVENUE ($MM) Source: FactSet as of 5/21/2026; Management forecasts from November 2025 Management Case; Management actuals from May 2026 Board materials M CONFIDENTIAL
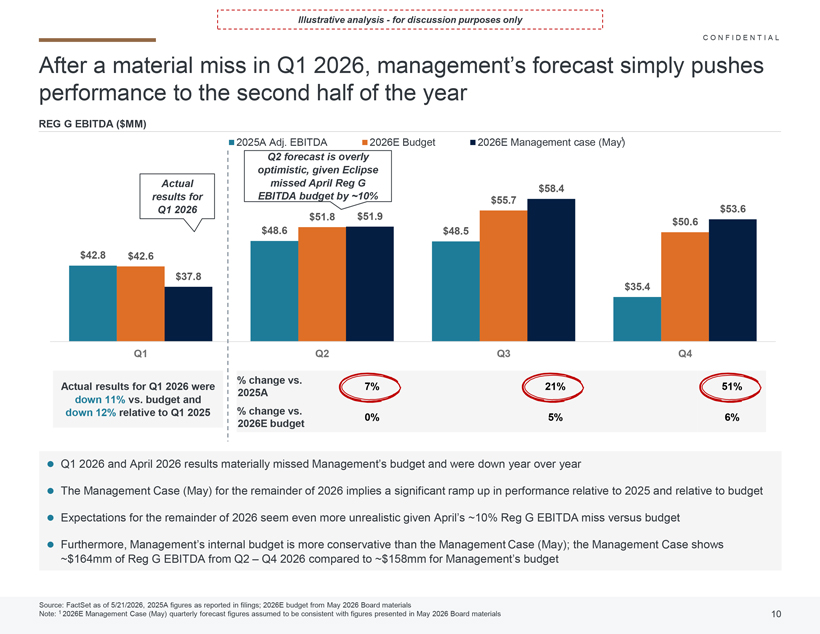
Illustrative analysis—for discussion purposes only After a material miss in Q1 2026, management’s forecast simply pushes performance to the second half of the year Q1 2026 and April 2026 results materially missed Management’s budget and were down year over year The Management Case (May) for the remainder of 2026 implies a significant ramp up in performance relative to 2025 and relative to budget Expectations for the remainder of 2026 seem even more unrealistic given April’s ~10% Reg G EBITDA miss versus budget Furthermore, Management’s internal budget is more conservative than the Management Case (May); the Management Case shows ~$164mm of Reg G EBITDA from Q2 –Q4 2026 compared to ~$158mm for Management’s budget Source: FactSet as of 5/21/2026, 2025A figures as reported in filings; 2026E budget from May 2026 Board materials Note: 1 2026E Management Case (May) quarterly forecast figures assumed to be consistent with figures presented in May 2026 Board materials CONFIDENTIAL
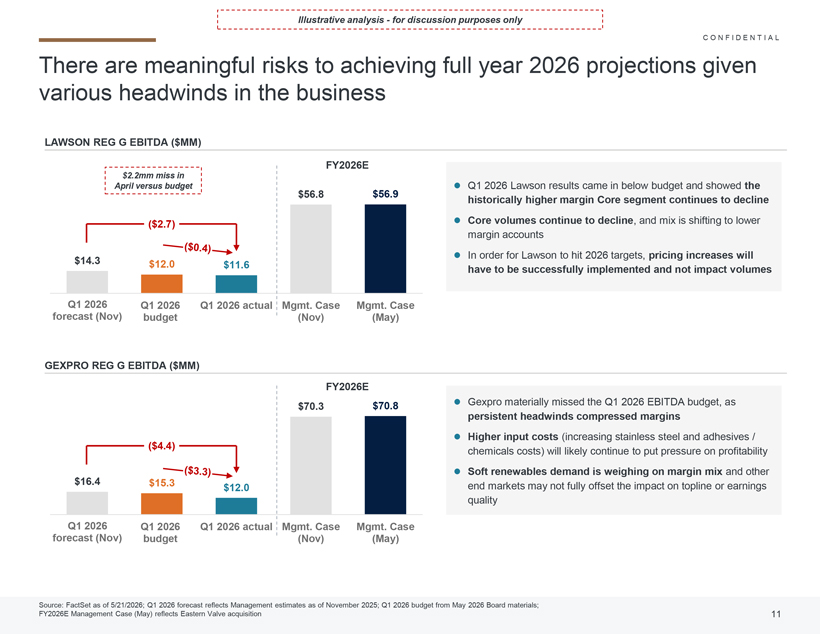
Illustrative analysis—for discussion purposes only There are meaningful risks to achieving full year 2026 projections given various headwinds in the business LAWSON REG G EBITDA ($MM) $14.3 $12.0 $11.6 $56.8 $56.9 Q1 2026 forecast Q1 2026 budget Q1 2026 actual Mgmt. Case (Nov) Mgmt. Case (May) Source: FactSet as of 5/21/2026; Q1 2026 forecast reflects Management estimates as of November 2025; Q1 2026 budget from May 2026 Board materials; FY2026E Management Case (May) reflects EasternValve acquisition GEXPRO REG G EBITDA ($MM) $16.4 $15.3 $12.0 $70.3 $70.8 Q1 2026 forecast Q1 2026 budget Q1 2026 actual Mgmt. Case (Nov) Mgmt. Case (May) Gexpro materially missed the Q1 2026 EBITDA budget, as persistent headwinds compressed margins Higher input costs (increasing stainless steel and adhesives / chemicals costs) will likely continue to put pressure on profitability Soft renewables demand is weighing on margin mixand other end markets may not fully offset the impact on topline or earnings quality Q1 2026 Lawson results came in below budget and showed the historically higher margin Core segment continues to decline Core volumes continue to decline, and mix is shifting to lower margin accounts In order forLawson to hit 2026 targets, pricing increases will have to be successfully implemented and not impact volumes CONFIDENTIAL
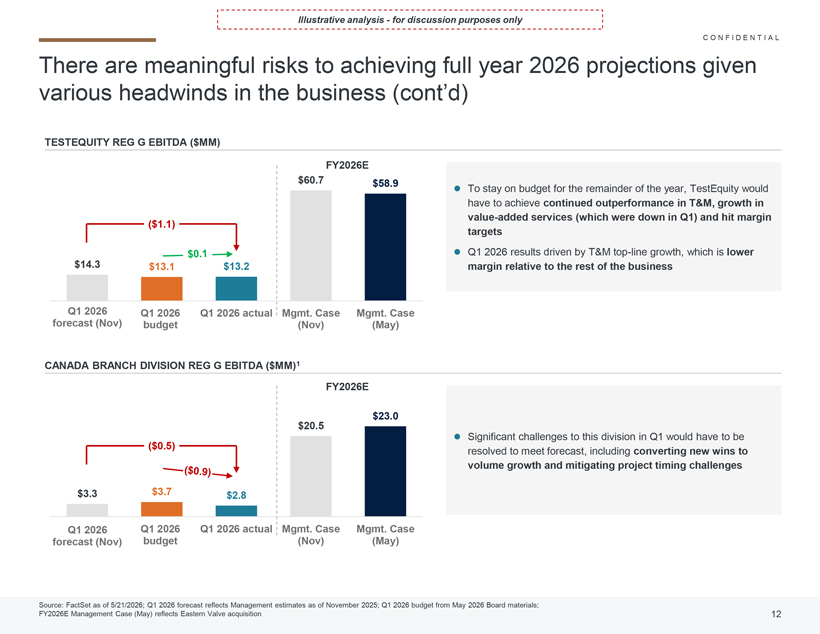
Illustrative analysis—for discussion purposes only There are meaningful risks to achieving full year 2026 projections given various headwinds in the business (cont’d) Significant challenges to this division in Q1 would have to be resolved to meet forecast, including converting new wins to volume growth and mitigating project timing challenges Source: FactSet as of 5/21/2026; Q1 2026 forecast reflects Management estimates as of November 2025; Q1 2026 budget from May 2026 Board materials; FY2026E Management Case (May) reflects EasternValve acquisition TESTEQUITY REG G EBITDA ($MM) CANADA BRANCH DIVISION REG G EBITDA ($MM)1 To stay on budget for the remainder of the year, TestEquitywould have to achieve continued outperformance in T&M, growth in value-added services (which were down in Q1) and hit margin targets Q1 2026 results driven by T&M top-line growth, which is lower margin relative to the rest of the business CONFIDENTIAL
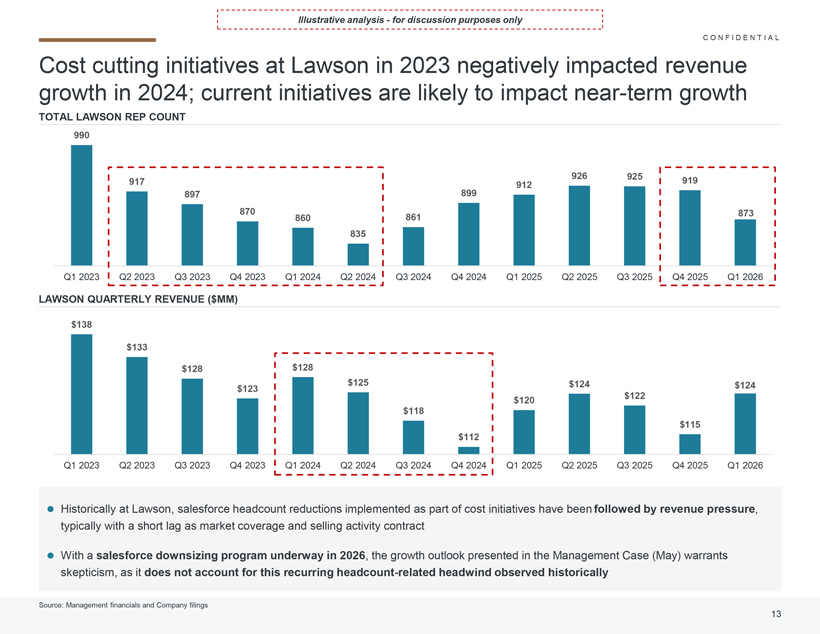
Illustrative analysis—for discussion purposes only Cost cutting initiatives at Lawson in 2023 negatively impacted revenue growth in 2024; current initiatives are likely to impact near-term growth TOTAL LAWSON REP COUNT $138 $133 $128 $123 $128 $125 $118 $112 $120 $124 $122 $115 $124 Q1 2023 Q2 2023 Q3 2023 Q4 2023 Q1 2024 Q2 2024 Q3 2024 Q4 2024 Q1 2025 Q2 2025 Q3 2025 Q4 2025 Q1 2026 LAWSON QUARTERLY REVENUE($MM) Historically at Lawson, salesforce headcount reductions implemented as part of cost initiatives have been followed by revenue pressure, typically with a short lag as market coverage and selling activity contract With a salesforce downsizing program underway in 2026, the growth outlook presented in the Management Case (May) warrants skepticism, as it does not account for this recurring headcount-related headwind observed historically CONFIDENTIAL
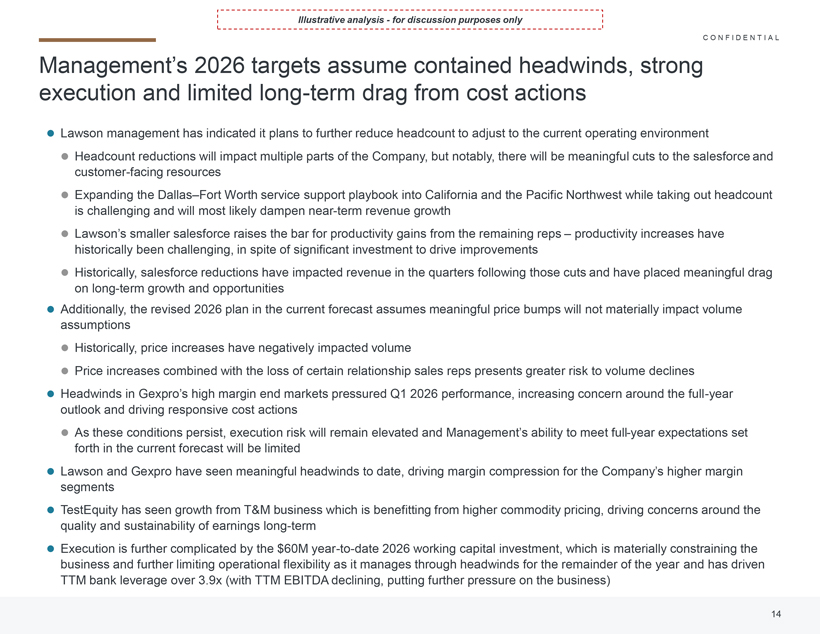
Illustrative analysis—for discussion purposes only Management’s 2026 targets assume contained headwinds, strong execution and limited long-term drag from cost actions Lawson management has indicated it plans to further reduce headcount to adjust to the current operating environment Headcount reductions will impact multiple parts of the Company, but notably, there will be meaningful cuts to the salesforceand customer-facing resources Expanding the Dallas–Fort Worth service support playbook into California and the Pacific Northwest while taking out headcount is challenging and will most likely dampen near-term revenue growth Lawson’s smaller salesforce raises the bar for productivity gains from the remaining reps– productivity increases have historically been challenging, in spite of significant investment to drive improvements Historically, salesforce reductions have impacted revenue in the quarters following those cuts and have placed meaningful drag on long-term growth and opportunities Additionally, the revised 2026 plan in the current forecast assumes meaningful price bumps will not materially impact volume assumptions Historically, price increases have negatively impacted volume Price increases combined with the loss of certain relationship sales reps presents greater risk to volume declines Headwinds in Gexpro’s high margin end markets pressured Q1 2026 performance, increasing concern around the full-year outlook and driving responsive cost actions As these conditions persist, execution risk will remain elevated and Management’s ability to meet full-year expectations set forth in the current forecast will be limited Lawson and Gexpro have seen meaningful headwinds to date, driving margin compression for the Company’s higher margin segments TestEquity has seen growth from T&M business which is benefitting from higher commodity pricing, driving concerns around the quality and sustainability of earnings long-term Execution is further complicated by the $60M year-to-date 2026 working capital investment, which is materially constraining the business and further limiting operational flexibility as it manages through headwinds for the remainder of the year and has driven TTM bank leverage over 3.9x (with TTM EBITDA declining, putting further pressure on the business) CONFIDENTIAL
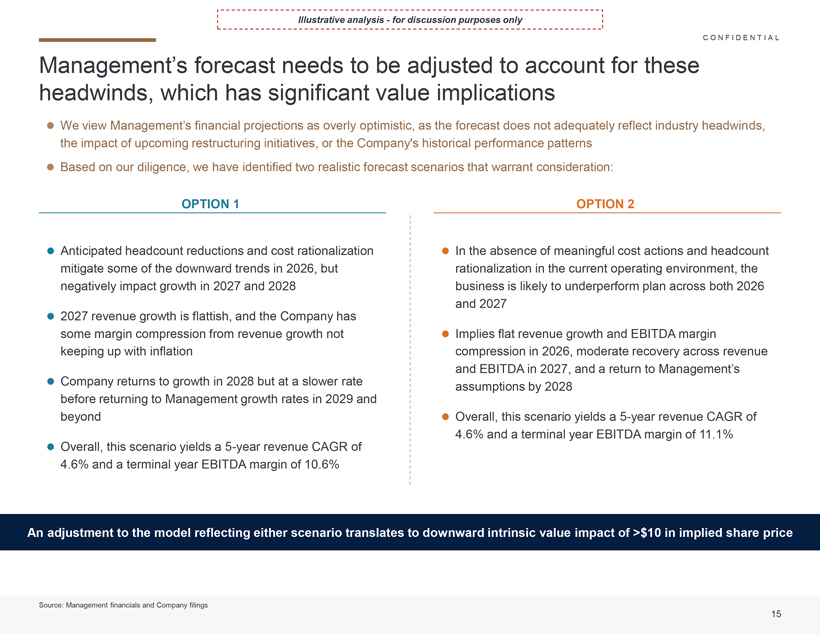
Illustrative analysis—for discussion purposes only Management’s forecast needs to be adjusted to account for these headwinds, which has significant value implications C ONFIDENTIAL We view Management’s financial projections as overly optimistic, as the forecast does not adequately reflect industry headwinds, the impact of upcoming restructuring initiatives, or the Company’s historical performance patterns Based on our diligence, we have identified two realistic forecast scenarios that warrant consideration: OPTION 1 Anticipated headcount reductions and cost rationalization mitigate some of the downward trends in 2026, but negatively impact growth in 2027 and 2028 2027 revenue growth is flattish, and the Company has some margin compression from revenue growth not keeping up with inflation Company returns to growth in 2028 but at a slower rate before returning to Management growth rates in 2029 and beyond Overall, this scenario yields a 5-year revenue CAGR of 4.6% and a terminal year EBITDA margin of 10.6% OPTION 2 In the absence of meaningful cost actions and headcount rationalization in the current operating environment, the business is likely to underperform plan across both 2026 and 2027 Implies flat revenue growth and EBITDA margin compression in 2026, moderate recovery across revenue and EBITDA in 2027, and a return to Management’s assumptions by 2028 Overall, this scenario yields a 5-year revenue CAGR of 4.6% and a terminal year EBITDA margin of 11.1% An adjustment to the model reflecting either scenario translates to downward intrinsic value impact of >$10 in implied share price CONFIDENTIAL