Exhibit (c)(ii)
Project ECLIPSE Discussion Materials for the Special Committee of Board of Directors April 21, 2026 Confidential ECLIPSE
Exhibit (c)(ii)
Project ECLIPSE Discussion Materials for the Special Committee of Board of Directors April 21, 2026 Confidential ECLIPSE
Disclaimer This presentation (together with any accompanying oral presentation and any supplementary documents provided therewith, the “Presentation”) has been prepared by William Blair & Company, L.L.C. (“William Blair”) exclusively for the benefit and internal use of the recipient (the “Recipient”). The Recipient is not permitted to reproduce in whole or in part the information provided in this Presentation (the “Information”) or to communicate the Information to any third party without William Blair’s prior written consent. No party may rely on this Presentation without William Blair’s prior written consent. William Blair and its affiliates, partners, directors, employees and agents do not accept responsibility or liability for this Presentation or its contents (except to the extent that such liability cannot be excluded by law). This Presentation is for discussion purposes only and speaks only as of the date it is given, and the views expressed are subject to change based on a number of factors, including market conditions and the Recipient’s business and prospects. The Information, whether taken from public sources, received from the Recipient or elsewhere, has not been independently verified by William Blair and William Blair has relied upon and assumed the accuracy and completeness of all Information. No representation or warranty is made as to any to the accuracy or completeness of any Information. In furnishing this Presentation, William Blair undertakes no obligation to provide additional information or to correct or update any of the Information. William Blair, together with its affiliates and partners, is a financial services institution engaged in a wide range of investment banking and other activities (including, but not limited to, investment management, corporate finance, private wealth management, securities trading, research and brokerage activities). It is understood and agreed that William Blair may, from time to time, make a market in, have a long or short position, buy and sell or otherwise effect transactions for customer accounts and for their own accounts in the securities of, or may perform or be solicited to perform investment banking, corporate finance or other services for, the Recipient and other third-party entities which are or may be the subject of the transactions contemplated by this Presentation. William Blair has adopted policies and procedures designed to ensure the independence of its research analysts, whose views may differ from those of William Blair’s investment banking department and who may produce research reports and other materials the timing or content of which conflict with the views of the investment banking department or the Recipient’s interests, in connection with the transactions contemplated by this Presentation or otherwise. Nothing in the Presentation is, or shall be relied upon as, investment advice or any recommendation by William Blair. This Presentation does not purport to contain all of the information that may be necessary or appropriate to evaluate the proposed transaction, and the Recipient should conduct its own independent assessment and such investigations as it deems necessary. Recipient should rely on its own counsel, accountants and other similar expert advisors for legal, regulatory, accounting, tax and other similar advice. Nothing in the Presentation or any related discussions is intended to create, or shall be construed as creating, a principal-agent, advisor-client or fiduciary relationship between William Blair and the Recipient. Confidential 1
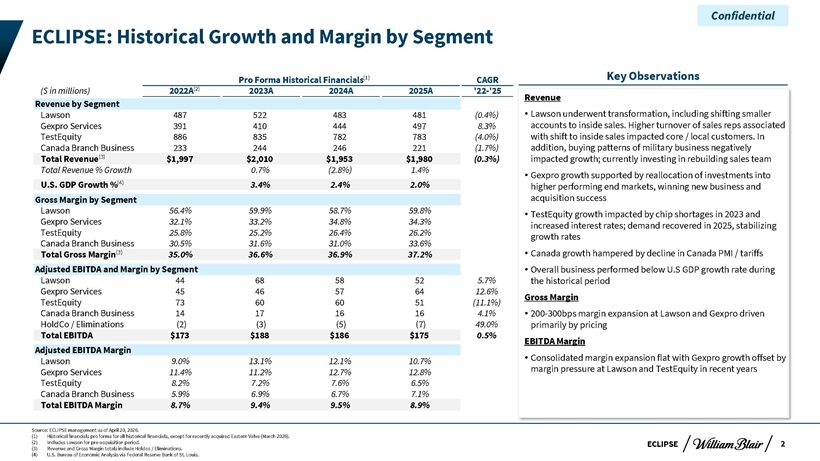
ECLIPSE Pro Forma Historical Financials CAGR ($ in millions) 2022A 2023A 2024A 2025A ‘22-’25 Revenue by Segment Lawson 487 522 483 481 (0.4%) Gexpro Services 391 410 444 497 8.3% TestEquity 886 835 782 783 (4.0%) Canada Branch Business 233 244 246 221 (1.7%) Total Revenue $1,997 $2,010 $1,953 $1,980 (0.3%) Total Revenue % Growth 0.7% (2.8%) 1.4% U.S. GDP Growth % 3.4% 2.4% 2.0% Gross Margin by Segment Lawson 56.4% 59.9% 58.7% 59.8% Gexpro Services 32.1% 33.2% 34.8% 34.3% TestEquity 25.8% 25.2% 26.4% 26.2% Canada Branch Business 30.5% 31.6% 31.0% 33.6% Total Gross Margin 35.0% 36.6% 36.9% 37.2% Adjusted EBITDA and Margin by Segment Lawson 44 68 58 52 5.7% Gexpro Services 45 46 57 64 12.6% TestEquity 73 60 60 51 (11.1%) Canada Branch Business 14 17 16 16 4.1% HoldCo / Eliminations (2) (3) (5) (7) 49.0% Total EBITDA $173 $188 $186 $175 0.5% Adjusted EBITDA Margin Lawson 9.0% 13.1% 12.1% 10.7% Gexpro Services 11.4% 11.2% 12.7% 12.8% TestEquity 8.2% 7.2% 7.6% 6.5% Canada Branch Business 5.9% 6.9% 6.7% 7.1% Total EBITDA Margin 8.7% 9.4% 9.5% 8.9% Key Observations Revenue Lawson underwent transformation, including shifting smaller accounts to inside sales. Higher turnover of sales reps associated with shift to inside sales impacted core / local customers. In addition, buying patterns of military business negatively impacted growth; currently investing in rebuilding sales team Gexpro growth supported by reallocation of investments into higher performing end markets, winning new business and acquisition success TestEquity growth impacted by chip shortages in 2023 and increased interest rates; demand recovered in 2025, stabilizing growth rates Canada growth hampered by decline in Canada PMI / tariffs Overall business performed below U.S GDP growth rate during the historical period Gross Margin 200-300bps margin expansion at Lawson and Gexpro driven primarily by pricing EBITDA Margin Consolidated margin expansion flat with Gexpro growth offset by margin pressure at Lawson and TestEquity in recent years (1) (4) Confidential ECLIPSE: Historical Growth and Margin by Segment (2) (3) (3)2 Source: ECLIPSE management as of April 20, 2026. (1) Historical financials pro forma for all historical financials, except for recently acquired Eastern Valve (March 2026). (2) Includes Lawson for pre-acquisition period. (3) Revenue and Gross Margin totals include Holdco / Eliminations. (4) U.S. Bureau of Economic Analysis via Federal Reserve Bank of St. Louis.
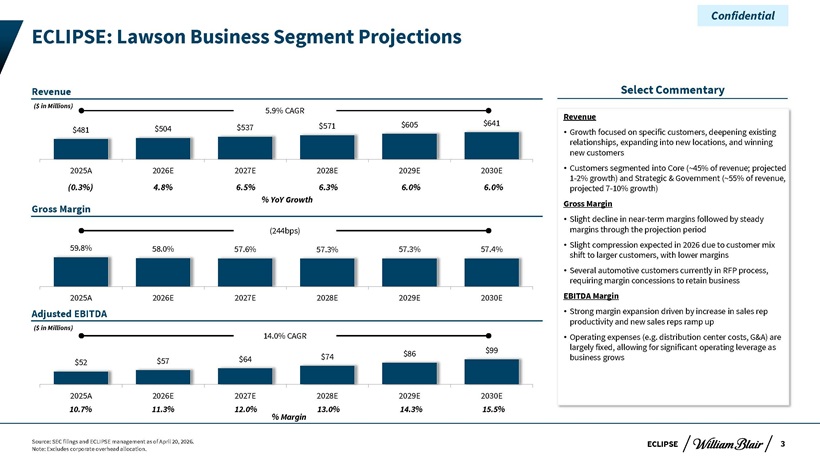
ECLIPSE $52 $57 $64 $74 $86 $99 2025A 2026E 2027E 2028E 2029E 2030E $481 $504 $537 $571 $605 $641 2025A 2026E 2027E 2028E 2029E 2030E ECLIPSE: Lawson Business Segment Projections Source: SEC filings and ECLIPSE management as of April 20, 2026. Note: Excludes corporate overhead allocation. Confidential 3 Revenue Adjusted EBITDA 59.8% 58.0% 57.6% 57.3% 57.3% 57.4% 2025A 2026E 2027E 2028E 2029E 2030E 5.9% CAGR 14.0% CAGR Gross Margin (244bps) Select Commentary Revenue • Growth focused on specific customers, deepening existing relationships, expanding into new locations, and winning new customers • Customers segmented into Core (~45% of revenue; projected 1-2% growth) and Strategic & Government (~55% of revenue, projected 7-10% growth) Gross Margin • Slight decline in near-term margins followed by steady margins through the projection period • Slight compression expected in 2026 due to customer mix shift to larger customers, with lower margins • Several automotive customers currently in RFP process, requiring margin concessions to retain business EBITDA Margin • Strong margin expansion driven by increase in sales rep productivity and new sales reps ramp up • Operating expenses (e.g. distribution center costs, G&A) are largely fixed, allowing for significant operating leverage as business grows (0.3%) 4.8% 6.5% 6.3% 6.0% 6.0% % YoY Growth ($ in Millions) 10.7% 11.3% 12.0% 13.0% 14.3% 15.5% % Margin ($ in Millions)
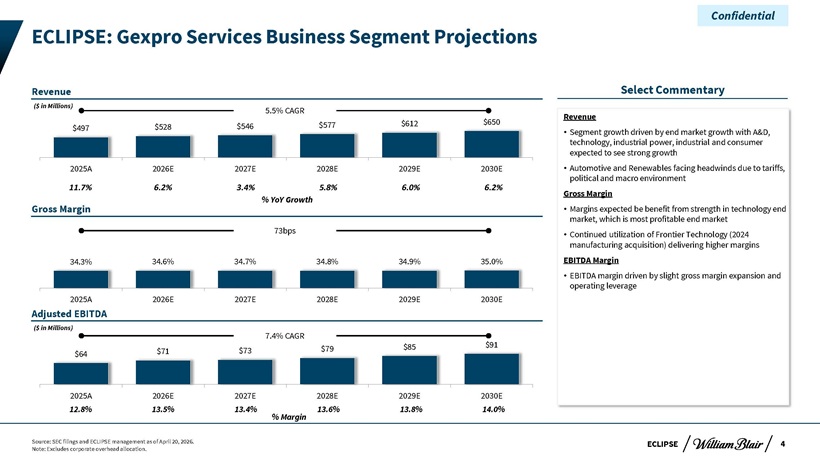
ECLIPSE $497 $528 $546 $577 $612 $650 2025A 2026E 2027E 2028E 2029E 2030E $64 $71 $73 $79 $85 $91 2025A 2026E 2027E 2028E 2029E 2030E Gross Margin Source: SEC filings and ECLIPSE management as of April 20, 2026. Note: Excludes corporate overhead allocation. Confidential 4 Revenue Select Commentary ECLIPSE: Gexpro Services Business Segment Projections Revenue • Segment growth driven by end market growth with A&D, technology, industrial power, industrial and consumer expected to see strong growth • Automotive and Renewables facing headwinds due to tariffs, political and macro environment Gross Margin • Margins expected be benefit from strength in technology end market, which is most profitable end market • Continued utilization of Frontier Technology (2024 manufacturing acquisition) delivering higher margins EBITDA Margin • EBITDA margin driven by slight gross margin expansion and operating leverage % YoY Growth 5.5% CAGR 7.4% CAGR 73bps 11.7% 6.2% 3.4% 5.8% 6.0% 6.2% 34.3% 34.6% 34.7% 34.8% 34.9% 35.0% 2025A 2026E 2027E 2028E 2029E 2030E 12.8% 13.5% 13.4% 13.6% 13.8% 14.0% % Margin Adjusted EBITDA ($ in Millions) ($ in Millions)
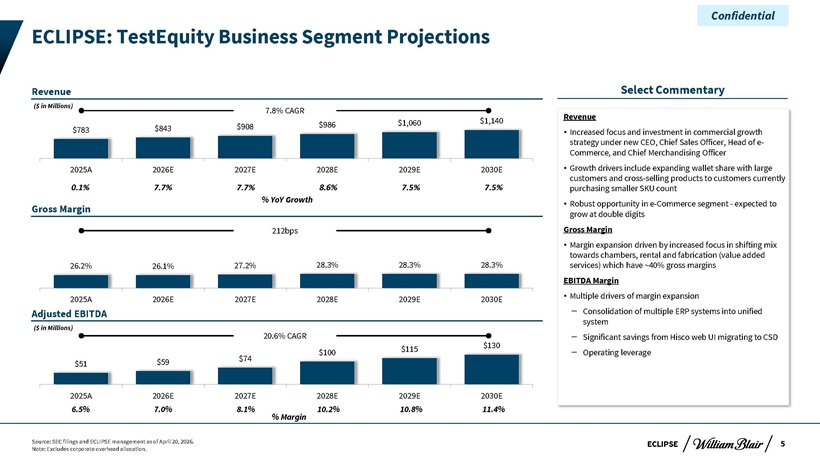
ECLIPSE $51 $59 $74 $100 $115 $130 2025A 2026E 2027E 2028E 2029E 2030E $783 $843 $908 $986 $1,060 $1,140 2025A 2026E 2027E 2028E 2029E 2030E Gross Margin Source: SEC filings and ECLIPSE management as of April 20, 2026. Note: Excludes corporate overhead allocation. Confidential 5 Revenue Select Commentary ECLIPSE: TestEquity Business Segment Projections Revenue • Increased focus and investment in commercial growth strategy under new CEO, Chief Sales Officer, Head of e- Commerce, and Chief Merchandising Officer • Growth drivers include expanding wallet share with large customers and cross-selling products to customers currently purchasing smaller SKU count • Robust opportunity in e-Commerce segment - expected to grow at double digits Gross Margin • Margin expansion driven by increased focus in shifting mix towards chambers, rental and fabrication (value added services) which have ~40% gross margins EBITDA Margin • Multiple drivers of margin expansion ‒ Consolidation of multiple ERP systems into unified system ‒ Significant savings from Hisco web UI migrating to CSD ‒ Operating leverage % YoY Growth 7.8% CAGR 20.6% CAGR 212bps 0.1% 7.7% 7.7% 8.6% 7.5% 7.5% 26.2% 26.1% 27.2% 28.3% 28.3% 28.3% 2025A 2026E 2027E 2028E 2029E 2030E 6.5% 7.0% 8.1% 10.2% 10.8% 11.4% % Margin Adjusted EBITDA ($ in Millions) ($ in Millions)
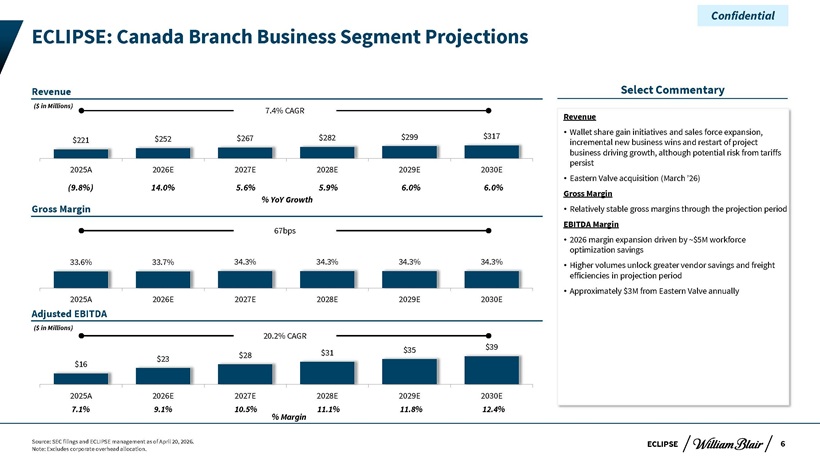
ECLIPSE Revenue $16 $23 $28 $31 $35 $39 2025A 2026E 2027E 2028E 2029E 2030E $221 $252 $267 $282 $299 $317 2025A 2026E 2027E 2028E 2029E 2030E Gross Margin Source: SEC filings and ECLIPSE management as of April 20, 2026. Note: Excludes corporate overhead allocation. Confidential 6 Select Commentary ECLIPSE: Canada Branch Business Segment Projections Revenue • Wallet share gain initiatives and sales force expansion, incremental new business wins and restart of project business driving growth, although potential risk from tariffs persist • Eastern Valve acquisition (March ‘26) Gross Margin • Relatively stable gross margins through the projection period EBITDA Margin • 2026 margin expansion driven by ~$5M workforce optimization savings • Higher volumes unlock greater vendor savings and freight efficiencies in projection period • Approximately $3M from Eastern Valve annually % YoY Growth 7.4% CAGR 20.2% CAGR 67bps (9.8%) 14.0% 5.6% 5.9% 6.0% 6.0% 33.6% 33.7% 34.3% 34.3% 34.3% 34.3% 2025A 2026E 2027E 2028E 2029E 2030E 7.1% 9.1% 10.5% 11.1% 11.8% 12.4% % Margin Adjusted EBITDA ($ in Millions) ($ in Millions)
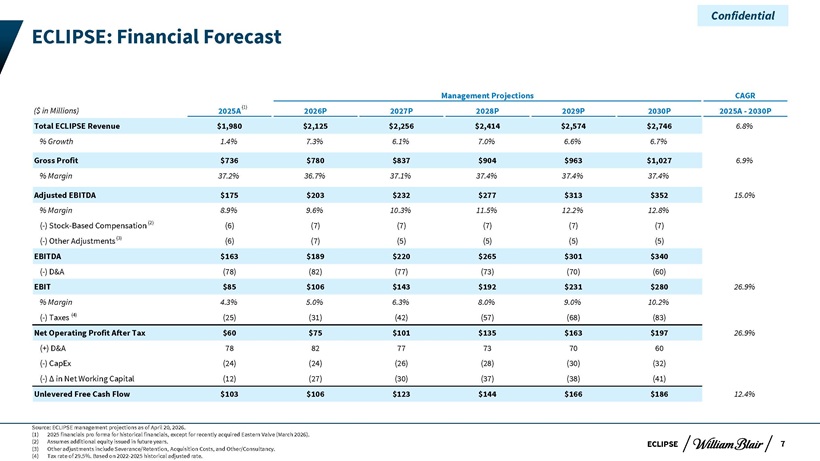
ECLIPSE Management Projections CAGR ($ in Millions) 2025A 2026P 2027P 2028P 2029P 2030P 2025A - 2030P Total ECLIPSE Revenue $1,980 $2,125 $2,256 $2,414 $2,574 $2,746 6.8% % Growth 1.4% 7.3% 6.1% 7.0% 6.6% 6.7% Gross Profit $736 $780 $837 $904 $963 $1,027 6.9% % Margin 37.2% 36.7% 37.1% 37.4% 37.4% 37.4% Adjusted EBITDA $175 $203 $232 $277 $313 $352 15.0% % Margin 8.9% 9.6% 10.3% 11.5% 12.2% 12.8% (-) Stock-Based Compensation (6) (7) (7) (7) (7) (7) (-) Other Adjustments (6) (7) (5) (5) (5) (5) EBITDA $163 $189 $220 $265 $301 $340 (-) D&A (78) (82) (77) (73) (70) (60) EBIT $85 $106 $143 $192 $231 $280 26.9% % Margin 4.3% 5.0% 6.3% 8.0% 9.0% 10.2% (-) Taxes (25) (31) (42) (57) (68) (83) Net Operating Profit After Tax $60 $75 $101 $135 $163 $197 26.9% (+) D&A 78 82 77 73 70 60 (-) CapEx (24) (24) (26) (28) (30) (32) (-) Ä in Net Working Capital (12) (27) (30) (37) (38) (41) Unlevered Free Cash Flow $103 $106 $123 $144 $166 $186 12.4% Source: ECLIPSE management projections as of April 20, 2026. (1) 2025 financials pro forma for historical financials, except for recently acquired Eastern Valve (March 2026). (2) Assumes additional equity issued in future years. (3) Other adjustments include Severance/Retention, Acquisition Costs, and Other/Consultancy. (4) Tax rate of 29.5%. Based on 2022-2025 historical adjusted rate. Confidential 7 (4) (3) (1) ECLIPSE: Financial Forecast (2)
Appendix Confidential william Blair
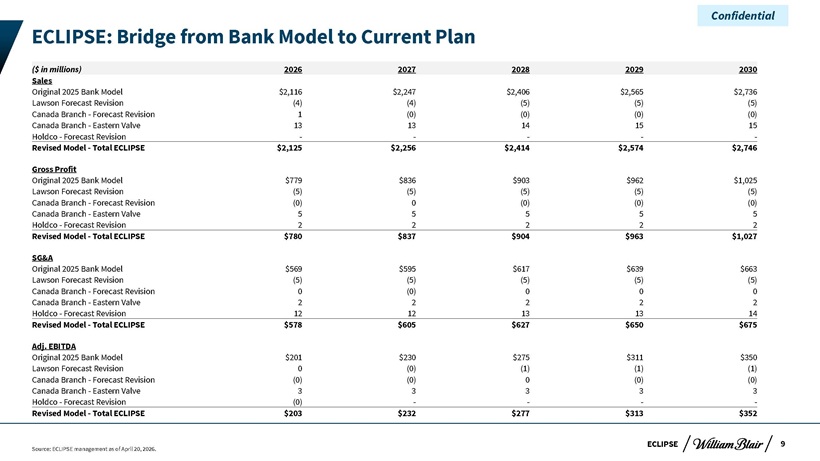
ECLIPSE ECLIPSE: Bridge from Bank Model to Current Plan Source: ECLIPSE management as of April 20, 2026. Confidential 9 ($ in millions) 2026 2027 2028 2029 2030 Sales Original 2025 Bank Model $2,116 $2,247 $2,406 $2,565 $2,736 Lawson Forecast Revision (4) (4) (5) (5) (5) Canada Branch—Forecast Revision 1 (0) (0) (0) (0) Canada Branch—Eastern Valve 13 13 14 15 15 Holdco—Forecast Revision ————— Revised Model—Total ECLIPSE $2,125 $2,256 $2,414 $2,574 $2,746 Gross Profit Original 2025 Bank Model $779 $836 $903 $962 $1,025 Lawson Forecast Revision (5) (5) (5) (5) (5) Canada Branch—Forecast Revision (0) 0 (0) (0) (0) Canada Branch—Eastern Valve 5 5 5 5 5 Holdco—Forecast Revision 2 2 2 2 2 Revised Model—Total ECLIPSE $780 $837 $904 $963 $1,027 SG&A Original 2025 Bank Model $569 $595 $617 $639 $663 Lawson Forecast Revision (5) (5) (5) (5) (5) Canada Branch—Forecast Revision 0 (0) 0 0 0 Canada Branch—Eastern Valve 2 2 2 2 2 Holdco—Forecast Revision 12 12 13 13 14 Revised Model—Total ECLIPSE $578 $605 $627 $650 $675 Adj. EBITDA Original 2025 Bank Model $201 $230 $275 $311 $350 Lawson Forecast Revision 0 (0) (1) (1) (1) Canada Branch—Forecast Revision (0) (0) 0 (0) (0) Canada Branch—Eastern Valve 3 3 3 3 3 Holdco—Forecast Revision (0) ———— Revised Model—Total ECLIPSE $203 $232 $277 $313 $352