Shareholder Report
|
1 Months Ended |
5 Months Ended |
12 Months Ended |
|
Jun. 30, 2026
USD ($)
shares
|
Jun. 30, 2026
USD ($)
shares
|
Jun. 30, 2026
USD ($)
shares
|
| Shareholder Report [Line Items] |
|
|
|
| Document Type |
|
|
N-CSR
|
| Amendment Flag |
|
|
false
|
| Registrant Name |
|
|
PFS FUNDS
|
| Entity Central Index Key |
|
|
0001103243
|
| Entity Investment Company Type |
|
|
N-1A
|
| Document Period End Date |
|
|
Jun. 30, 2026
|
| Shareholder Report Annual or Semi-Annual |
|
|
annual shareholder report
|
| Potomac Defensive Bull Fund | Institutional Class Shares |
|
|
|
| Shareholder Report [Line Items] |
|
|
|
| Fund Name |
|
|
Potomac Defensive Bull Fund
|
| Class Name |
|
|
Institutional Class
|
| Trading Symbol |
|
|
CRDBX
|
| Annual or Semi-Annual Statement [Text Block] |
|
|
This annual shareholder report contains important information about the Potomac Defensive Bull Fund ("Fund") for the period of July 1, 2025 to June 30, 2026.
|
| Additional Information [Text Block] |
|
|
You can find additional information about the Fund at https://potomacfunds.com/crdbx/. You can also request this information by contacting us at 1-888-774-6679.
|
| Material Fund Change Notice [Text Block] |
|
|
This report describes changes to the Fund that occurred during the reporting period.
|
| Additional Information Phone Number |
|
|
1-888-774-6679
|
| Additional Information Website |
|
|
https://potomacfunds.com/crdbx/
|
| Expenses [Text Block] |
|
|
| Institutional Class |
$133 |
1.12% |
|
| Expenses Paid, Amount |
|
|
$ 133
|
| Expense Ratio, Percent |
|
|
1.12%
|
| Factors Affecting Performance [Text Block] |
|
|
For the year ended June 30, 2026, the Potomac Defensive Bull Fund returned 37.40%. The S&P 500 Index returned 22.32% in the same period. The S&P Target Risk Aggressive Index returned 20.11% in the same period. The Fund posted a strong absolute return due to concentrated exposure to the S&P 500 when the risk-reward profile was favorable based on the signals from our composite timing model. Additionally, and importantly, the model moved to cash in early March 2026 and was able to avoid a large part of the S&P 500's decline from February 2026 to the end of March 2026. In April 2026, when the weight of the evidence in our composite model pointed to a favorable risk-reward profile in the market, we added concentrated exposure that allowed us to more than participate in a strong advance that played out until the end of the fiscal year. |
| Performance Past Does Not Indicate Future [Text] |
|
|
The Fund's past performance is not a good predictor of the Fund's future performance.
|
| Line Graph [Table Text Block] |
|
|
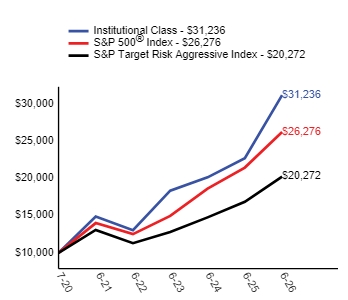
|
| Average Annual Return [Table Text Block] |
|
|
|
Institutional Class
| 37.40% | 15.95% | 20.91% |
|
S&P 500® Index
| 22.32% | 13.41% | 17.48% |
|
S&P Target Risk Aggressive Index
| 20.11% | 9.14% | 12.51% | |
| Performance Inception Date |
|
|
Jul. 01, 2020
|
| No Deduction of Taxes [Text Block] |
|
|
The graph and table do not reflect the deduction of taxes that a shareholder would pay on fund distributions or redemption of fund shares.
|
| Material Change Date |
|
|
Nov. 01, 2025
|
| Net Assets |
$ 3,684,191,869
|
$ 3,684,191,869
|
$ 3,684,191,869
|
| Holdings Count | shares |
4
|
4
|
4
|
| Advisory Fees Paid, Amount |
|
|
$ 23,092,707
|
| Investment Company, Portfolio Turnover |
|
|
1275.00%
|
| Additional Fund Statistics [Text Block] |
|
|
| Net Assets ($) |
$3,684,191,869 |
| Number of Portfolio Holdings |
4 |
| Portfolio Turnover Rate (%) |
1,275%1275% |
| Total Advisory Fees Paid ($) |
$23,092,707 |
|
| Holdings [Text Block] |
|
|
|
iShares Core S&P 500 ETF
|
72.07% |
|
State Street Institutional U.S. Government Money Market Fund Premier Class
|
11.39% |
|
BondBloxx Bloomberg Six Month Target Duration US Treasury ETF
|
9.20% |
|
Exchange Traded Funds
|
81.27% |
|
Net Cash*
|
18.73% |
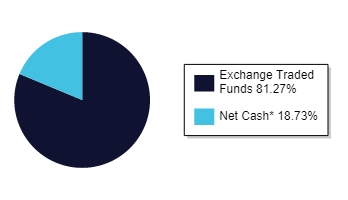 | | * | Net Cash represents cash, cash equivalents and other assets, including futures contracts, in excess of liabilities. |
|
| Largest Holdings [Text Block] |
|
|
|
iShares Core S&P 500 ETF
|
72.07% |
|
State Street Institutional U.S. Government Money Market Fund Premier Class
|
11.39% |
|
BondBloxx Bloomberg Six Month Target Duration US Treasury ETF
|
9.20% |
|
| Material Fund Change [Text Block] |
|
|
Effective November 1, 2025, the Fund may invest in underlying funds that hold or have exposure to cryptocurrencies such as Bitcoin, including ETFs (exchange traded funds) and ETPs (exchange traded products) that invest directly in Bitcoin and Bitcoin futures. Additionally, the Fund may invest up to 15% of its assets in ETFs and ETPs that hold Bitcoin and Bitcoin futures. |
| Material Fund Change Strategies [Text Block] |
|
|
Effective November 1, 2025, the Fund may invest in underlying funds that hold or have exposure to cryptocurrencies such as Bitcoin, including ETFs (exchange traded funds) and ETPs (exchange traded products) that invest directly in Bitcoin and Bitcoin futures. Additionally, the Fund may invest up to 15% of its assets in ETFs and ETPs that hold Bitcoin and Bitcoin futures.
|
| Potomac Defensive Bull Fund | Class R Shares |
|
|
|
| Shareholder Report [Line Items] |
|
|
|
| Fund Name |
Potomac Defensive Bull Fund
|
|
|
| Class Name |
Class R
|
|
|
| Trading Symbol |
SDDBX
|
|
|
| Annual or Semi-Annual Statement [Text Block] |
This annual shareholder report contains important information about the Potomac Defensive Bull Fund ("Fund") for the period of May 28, 2026 (commencement of Class R shares operations) to June 30, 2026.
|
|
|
| Additional Information [Text Block] |
You can find additional information about the Fund at https://potomacfunds.com/sddbx/. You can also request this information by contacting us at 1-888-774-6679.
|
|
|
| Additional Information Phone Number |
1-888-774-6679
|
|
|
| Additional Information Website |
https://potomacfunds.com/sddbx/
|
|
|
| Expenses [Text Block] |
|
|
|
| Expenses Paid, Amount |
$ 19
|
|
|
| Expense Ratio, Percent |
2.09%
|
|
|
| Expenses Short Period Footnote [Text Block] |
Amount shown reflects the expenses of the Class R shares from May 28, 2026 (commencement of operations) through June 30, 2026. Expenses for a full fiscal year would be higher.
|
|
|
| Factors Affecting Performance [Text Block] |
Class R shares of the Fund commenced investment operations on May 28, 2026. For the year ended June 30, 2026, the Institutional Class shares of the Fund returned 37.40%. The S&P 500 Index returned 22.32% in the same period. The S&P Target Risk Aggressive Index returned 20.11% in the same period. The Fund posted a strong absolute return due to concentrated exposure to the S&P 500 when the risk-reward profile was favorable based on the signals from our composite timing model. Additionally, and importantly, the model moved to cash in early March 2026 and was able to avoid a large part of the S&P 500's decline from February 2026 to the end of March 2026. In April 2026, when the weight of the evidence in our composite model pointed to a favorable risk-reward profile in the market, we added concentrated exposure that allowed us to more than participate in a strong advance that played out until the end of the fiscal year. |
|
|
| Performance Past Does Not Indicate Future [Text] |
The Fund's past performance is not a good predictor of the Fund's future performance.
|
|
|
| Line Graph [Table Text Block] |
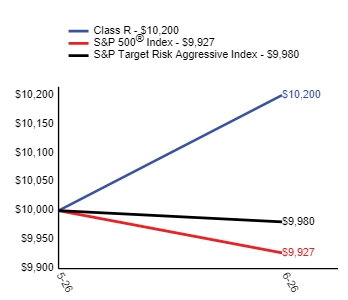
|
|
|
| Average Annual Return [Table Text Block] |
|
Class R
| 2.00% |
|
S&P 500® Index
| -0.73% |
|
S&P Target Risk Aggressive Index
| -0.20% | |
|
|
| Performance Inception Date |
May 28, 2026
|
|
|
| No Deduction of Taxes [Text Block] |
The graph and table do not reflect the deduction of taxes that a shareholder would pay on fund distributions or redemption of fund shares.
|
|
|
| Net Assets |
$ 3,684,191,869
|
$ 3,684,191,869
|
$ 3,684,191,869
|
| Holdings Count | shares |
4
|
4
|
4
|
| Advisory Fees Paid, Amount |
$ 23,092,707
|
|
|
| Investment Company, Portfolio Turnover |
1275.00%
|
|
|
| Additional Fund Statistics [Text Block] |
| Net Assets ($) |
$3,684,191,869 |
| Number of Portfolio Holdings |
4 |
| Portfolio Turnover Rate (%) |
1,275%1275% |
| Total Advisory Fees Paid ($) |
$23,092,707 |
|
|
|
| Holdings [Text Block] |
|
iShares Core S&P 500 ETF
|
72.07% |
|
State Street Institutional U.S. Government Money Market Fund Premier Class
|
11.39% |
|
BondBloxx Bloomberg Six Month Target Duration US Treasury ETF
|
9.20% |
|
Exchange Traded Funds
|
81.27% |
|
Net Cash*
|
18.73% |
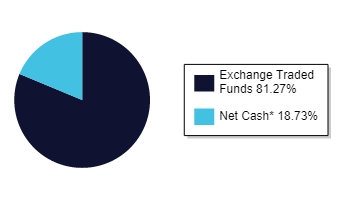 | | * | Net Cash represents cash, cash equivalents and other assets, including futures contracts, in excess of liabilities. |
|
|
|
| Largest Holdings [Text Block] |
|
iShares Core S&P 500 ETF
|
72.07% |
|
State Street Institutional U.S. Government Money Market Fund Premier Class
|
11.39% |
|
BondBloxx Bloomberg Six Month Target Duration US Treasury ETF
|
9.20% |
|
|
|
| Potomac Managed Volatility Fund | Institutional Class Shares |
|
|
|
| Shareholder Report [Line Items] |
|
|
|
| Fund Name |
|
|
Potomac Managed Volatility Fund
|
| Class Name |
|
|
Institutional Class
|
| Trading Symbol |
|
|
CRMVX
|
| Annual or Semi-Annual Statement [Text Block] |
|
|
This annual shareholder report contains important information about the Potomac Managed Volatility Fund ("Fund") for the period of July 1, 2025 to June 30, 2026.
|
| Additional Information [Text Block] |
|
|
You can find additional information about the Fund at https://potomacfunds.com/crmvx/. You can also request this information by contacting us at 1-888-774-6679.
|
| Material Fund Change Notice [Text Block] |
|
|
This report describes changes to the Fund that occurred during the reporting period.
|
| Additional Information Phone Number |
|
|
1-888-774-6679
|
| Additional Information Website |
|
|
https://potomacfunds.com/crmvx/
|
| Expenses [Text Block] |
|
|
| Institutional Class |
$140 |
1.36% |
|
| Expenses Paid, Amount |
|
|
$ 140
|
| Expense Ratio, Percent |
|
|
1.36%
|
| Factors Affecting Performance [Text Block] |
|
|
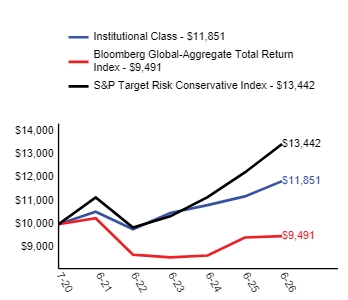
For the year ended June 30, 2026, the Potomac Managed Volatility Fund returned 5.86%. The Bloomberg Global-Aggregate Total Return Index returned 0.62% in the same period. The S&P Target Risk Conservative Index returned 9.96% in the same period. The Fund posted a strong return relative to the primary benchmark due to positions in ETFs with exposure to Convertible Bonds, Commodities, and trend following strategies. Additionally, the Fund was able to obtain exposure to High Yield bonds when our High Yield timing model indicated positive risk-reward opportunities in that market. |
| Performance Past Does Not Indicate Future [Text] |
|
|
The Fund's past performance is not a good predictor of the Fund's future performance.
|
| Line Graph [Table Text Block] |
|
|
|
| Average Annual Return [Table Text Block] |
|
|
|
Institutional Class
| 5.86% | 2.38% | 2.87% |
|
Bloomberg Global-Aggregate Total Return Index
| 0.62% | -1.55% | -0.87% |
|
S&P Target Risk Conservative Index
| 9.96% | 3.80% | 5.06% | |
| Performance Inception Date |
|
|
Jul. 01, 2020
|
| No Deduction of Taxes [Text Block] |
|
|
The graph and table do not reflect the deduction of taxes that a shareholder would pay on fund distributions or redemption of fund shares.
|
| Material Change Date |
|
|
Nov. 01, 2025
|
| Net Assets |
$ 242,510,335
|
$ 242,510,335
|
$ 242,510,335
|
| Holdings Count | shares |
7
|
7
|
7
|
| Advisory Fees Paid, Amount |
|
|
$ 2,255,466
|
| Investment Company, Portfolio Turnover |
|
|
1096.00%
|
| Additional Fund Statistics [Text Block] |
|
|
| Net Assets ($) |
$242,510,335 |
| Number of Portfolio Holdings |
7 |
| Portfolio Turnover Rate (%) |
1,096%1096% |
| Total Advisory Fees Paid ($) |
$2,255,466 |
|
| Holdings [Text Block] |
|
|
|
BondBloxx CCC Rated USD High Yield Corporate Bond ETF
|
24.50% |
|
BondBloxx BB Rated USD High Yield Corporate Bond ETF
|
22.69% |
|
Vanguard Emerging Markets Government Index Fund ETF
|
12.38% |
|
Invesco DB US Dollar Index Bullish Fund
|
12.36% |
|
iShares Fallen Angels USD Bond ETF
|
12.34% |
|
BondBloxx JP Morgan USD Emerging Markets 1-10 Year Bond ETF
|
12.28% |
|
State Street Institutional U.S. Government Money Market Fund Premier Class
|
2.93% |
|
Exchange Traded Funds
|
96.55% |
|
Net Cash*
|
3.45% |
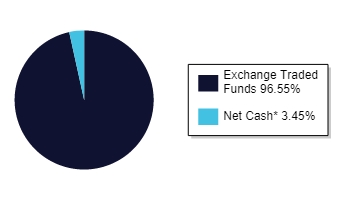 | | * | Net Cash represents cash, cash equivalents and other assets in excess of liabilities. |
|
| Largest Holdings [Text Block] |
|
|
|
BondBloxx CCC Rated USD High Yield Corporate Bond ETF
|
24.50% |
|
BondBloxx BB Rated USD High Yield Corporate Bond ETF
|
22.69% |
|
Vanguard Emerging Markets Government Index Fund ETF
|
12.38% |
|
Invesco DB US Dollar Index Bullish Fund
|
12.36% |
|
iShares Fallen Angels USD Bond ETF
|
12.34% |
|
BondBloxx JP Morgan USD Emerging Markets 1-10 Year Bond ETF
|
12.28% |
|
State Street Institutional U.S. Government Money Market Fund Premier Class
|
2.93% |
|
| Material Fund Change [Text Block] |
|
|
Effective November 1, 2025, the Fund may invest in underlying funds that hold or have exposure to cryptocurrencies such as Bitcoin, including ETFs (exchange traded funds) and ETPs (exchange traded products) that invest directly in Bitcoin and Bitcoin futures. Additionally, the Fund may invest up to 15% of its assets in ETFs and ETPs that hold Bitcoin and Bitcoin futures. |
| Material Fund Change Strategies [Text Block] |
|
|
Effective November 1, 2025, the Fund may invest in underlying funds that hold or have exposure to cryptocurrencies such as Bitcoin, including ETFs (exchange traded funds) and ETPs (exchange traded products) that invest directly in Bitcoin and Bitcoin futures. Additionally, the Fund may invest up to 15% of its assets in ETFs and ETPs that hold Bitcoin and Bitcoin futures.
|
| Potomac Managed Volatility Fund | Class R Shares |
|
|
|
| Shareholder Report [Line Items] |
|
|
|
| Fund Name |
Potomac Managed Volatility Fund
|
|
|
| Class Name |
Class R
|
|
|
| Trading Symbol |
SDMVX
|
|
|
| Annual or Semi-Annual Statement [Text Block] |
This annual shareholder report contains important information about the Potomac Managed Volatility Fund ("Fund") for the period of May 28, 2026 (commencement of Class R shares operations) to June 30, 2026.
|
|
|
| Additional Information [Text Block] |
You can find additional information about the Fund at https://potomacfunds.com/sdmvx/. You can also request this information by contacting us at 1-888-774-6679.
|
|
|
| Additional Information Phone Number |
1-888-774-6679
|
|
|
| Additional Information Website |
https://potomacfunds.com/sdmvx/
|
|
|
| Expenses [Text Block] |
|
|
|
| Expenses Paid, Amount |
$ 20
|
|
|
| Expense Ratio, Percent |
2.30%
|
|
|
| Expenses Short Period Footnote [Text Block] |
Amount shown reflects the expenses of the Class R shares from May 28, 2026 (commencement of operations) through June 30, 2026. Expenses for a full fiscal year would be higher.
|
|
|
| Factors Affecting Performance [Text Block] |
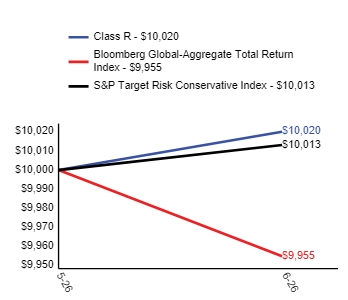
Class R shares of the Fund commenced investment operations on May 28, 2026. For the year ended June 30, 2026, the Institutional Class shares of the Fund returned 5.86%. The Bloomberg Global-Aggregate Total Return Index returned 0.62% in the same period. The S&P Target Risk Conservative Index returned 9.96% in the same period. The Fund posted a strong return relative to the primary benchmark due to positions in ETFs with exposure to Convertible Bonds, Commodities, and trend following strategies. Additionally, the Fund was able to obtain exposure to High Yield bonds when our High Yield timing model indicated positive risk-reward opportunities in that market. |
|
|
| Performance Past Does Not Indicate Future [Text] |
The Fund's past performance is not a good predictor of the Fund's future performance.
|
|
|
| Line Graph [Table Text Block] |
|
|
|
| Average Annual Return [Table Text Block] |
|
Class R
| 0.20% |
|
Bloomberg Global-Aggregate Total Return Index
| -0.45% |
|
S&P Target Risk Conservative Index
| 0.13% | |
|
|
| Performance Inception Date |
May 28, 2026
|
|
|
| No Deduction of Taxes [Text Block] |
The graph and table do not reflect the deduction of taxes that a shareholder would pay on fund distributions or redemption of fund shares.
|
|
|
| Net Assets |
$ 242,510,335
|
$ 242,510,335
|
$ 242,510,335
|
| Holdings Count | shares |
7
|
7
|
7
|
| Advisory Fees Paid, Amount |
$ 2,255,466
|
|
|
| Investment Company, Portfolio Turnover |
1096.00%
|
|
|
| Additional Fund Statistics [Text Block] |
| Net Assets ($) |
$242,510,335 |
| Number of Portfolio Holdings |
7 |
| Portfolio Turnover Rate (%) |
1,096%1096% |
| Total Advisory Fees Paid ($) |
$2,255,466 |
|
|
|
| Holdings [Text Block] |
|
BondBloxx CCC Rated USD High Yield Corporate Bond ETF
|
24.50% |
|
BondBloxx BB Rated USD High Yield Corporate Bond ETF
|
22.69% |
|
Vanguard Emerging Markets Government Index Fund ETF
|
12.38% |
|
Invesco DB US Dollar Index Bullish Fund
|
12.36% |
|
iShares Fallen Angels USD Bond ETF
|
12.34% |
|
BondBloxx JP Morgan USD Emerging Markets 1-10 Year Bond ETF
|
12.28% |
|
State Street Institutional U.S. Government Money Market Fund Premier Class
|
2.93% |
|
Exchange Traded Funds
|
96.55% |
|
Net Cash*
|
3.45% |
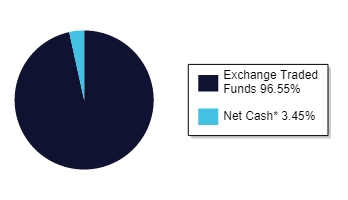 | | * | Net Cash represents cash, cash equivalents and other assets in excess of liabilities. |
|
|
|
| Largest Holdings [Text Block] |
|
BondBloxx CCC Rated USD High Yield Corporate Bond ETF
|
24.50% |
|
BondBloxx BB Rated USD High Yield Corporate Bond ETF
|
22.69% |
|
Vanguard Emerging Markets Government Index Fund ETF
|
12.38% |
|
Invesco DB US Dollar Index Bullish Fund
|
12.36% |
|
iShares Fallen Angels USD Bond ETF
|
12.34% |
|
BondBloxx JP Morgan USD Emerging Markets 1-10 Year Bond ETF
|
12.28% |
|
State Street Institutional U.S. Government Money Market Fund Premier Class
|
2.93% |
|
|
|
| Potomac Tactical Opportunities Fund | Institutional Class Shares |
|
|
|
| Shareholder Report [Line Items] |
|
|
|
| Fund Name |
|
|
Potomac Tactical Opportunities Fund
|
| Class Name |
|
|
Institutional Class
|
| Trading Symbol |
|
|
CRTOX
|
| Annual or Semi-Annual Statement [Text Block] |
|
|
This annual shareholder report contains important information about the Potomac Tactical Opportunities Fund ("Fund") for the period of July 1, 2025 to June 30, 2026.
|
| Additional Information [Text Block] |
|
|
You can find additional information about the Fund at https://potomacfunds.com/crtox/. You can also request this information by contacting us at 1-888-774-6679.
|
| Material Fund Change Notice [Text Block] |
|
|
This report describes changes to the Fund that occurred during the reporting period.
|
| Additional Information Phone Number |
|
|
1-888-774-6679
|
| Additional Information Website |
|
|
https://potomacfunds.com/crtox/
|
| Expenses [Text Block] |
|
|
| Institutional Class |
$154 |
1.36% |
|
| Expenses Paid, Amount |
|
|
$ 154
|
| Expense Ratio, Percent |
|
|
1.36%
|
| Factors Affecting Performance [Text Block] |
|
|
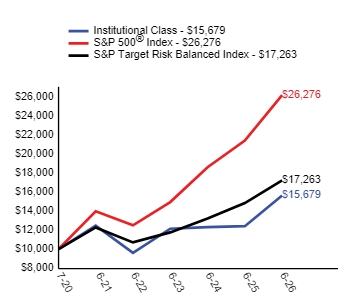
For the year ended June 30, 2026, the Potomac Tactical Opportunities Fund returned 26.15%. The S&P 500 Index returned 22.32% in the same period. The S&P Target Risk Balanced Index returned 16.05% in the same period. The Fund posted a strong absolute return due to exposure to the NASDAQ 100 when our NASDAQ timing model identified periods of time when risk-reward was favorable for that index. Additionally, the Fund's momentum strategy was able to identify strong trends in the metals and mining space with added upside from exposure to the silver miners. The strategy also benefitted from exposure to the strong trend in semiconductor stocks that was in place for much of the fiscal year. |
| Performance Past Does Not Indicate Future [Text] |
|
|
The Fund's past performance is not a good predictor of the Fund's future performance.
|
| Line Graph [Table Text Block] |
|
|
|
| Average Annual Return [Table Text Block] |
|
|
|
Institutional Class
| 26.15% | 4.67% | 7.79% |
|
S&P 500® Index
| 22.32% | 13.41% | 17.48% |
|
S&P Target Risk Balanced Index
| 16.05% | 7.02% | 9.53% | |
| Performance Inception Date |
|
|
Jul. 01, 2020
|
| No Deduction of Taxes [Text Block] |
|
|
The graph and table do not reflect the deduction of taxes that a shareholder would pay on fund distributions or redemption of fund shares.
|
| Material Change Date |
|
|
Nov. 01, 2025
|
| Net Assets |
$ 245,830,468
|
$ 245,830,468
|
$ 245,830,468
|
| Holdings Count | shares |
10
|
10
|
10
|
| Advisory Fees Paid, Amount |
|
|
$ 2,214,399
|
| Investment Company, Portfolio Turnover |
|
|
1177.00%
|
| Additional Fund Statistics [Text Block] |
|
|
| Net Assets ($) |
$245,830,468 |
| Number of Portfolio Holdings |
10 |
| Portfolio Turnover Rate (%) |
1,177%1177% |
| Total Advisory Fees Paid ($) |
$2,214,399 |
|
| Holdings [Text Block] |
|
|
|
iShares 0-3 Month Treasury Bond ETF
|
11.48% |
|
VanEck Semiconductor ETF
|
10.43% |
|
BondBloxx Bloomberg Six Month Target Duration US Treasury ETF
|
9.92% |
|
iShares Russell 2000 Growth ETF
|
9.87% |
|
iShares Russell 2000 ETF
|
9.75% |
|
Invesco Optimum Yield Diversified Commodity Strategy No K-1 ETF
|
9.72% |
|
State Street® SPDR® S&P® Metals & Mining ETF
|
9.63% |
|
Global X Silver Miners ETF
|
9.62% |
|
State Street® Energy Select Sector SPDR® ETF
|
9.59% |
|
State Street Institutional U.S. Government Money Market Fund Premier Class
|
4.58% |
|
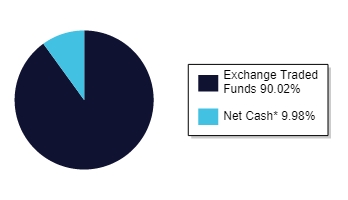
Exchange Traded Funds
|
90.02% |
|
Net Cash*
|
9.98% |
 | | * | Net Cash represents cash, cash equivalents and other assets in excess of liabilities. |
|
| Largest Holdings [Text Block] |
|
|
|
iShares 0-3 Month Treasury Bond ETF
|
11.48% |
|
VanEck Semiconductor ETF
|
10.43% |
|
BondBloxx Bloomberg Six Month Target Duration US Treasury ETF
|
9.92% |
|
iShares Russell 2000 Growth ETF
|
9.87% |
|
iShares Russell 2000 ETF
|
9.75% |
|
Invesco Optimum Yield Diversified Commodity Strategy No K-1 ETF
|
9.72% |
|
State Street® SPDR® S&P® Metals & Mining ETF
|
9.63% |
|
Global X Silver Miners ETF
|
9.62% |
|
State Street® Energy Select Sector SPDR® ETF
|
9.59% |
|
State Street Institutional U.S. Government Money Market Fund Premier Class
|
4.58% |
|
| Material Fund Change [Text Block] |
|
|
Effective November 1, 2025, the Fund may invest in underlying funds that hold or have exposure to cryptocurrencies such as Bitcoin, including ETFs (exchange traded funds) and ETPs (exchange traded products) that invest directly in Bitcoin and Bitcoin futures. Additionally, the Fund may invest up to 15% of its assets in ETFs and ETPs that hold Bitcoin and Bitcoin futures. |
| Material Fund Change Strategies [Text Block] |
|
|
Effective November 1, 2025, the Fund may invest in underlying funds that hold or have exposure to cryptocurrencies such as Bitcoin, including ETFs (exchange traded funds) and ETPs (exchange traded products) that invest directly in Bitcoin and Bitcoin futures. Additionally, the Fund may invest up to 15% of its assets in ETFs and ETPs that hold Bitcoin and Bitcoin futures.
|
| Potomac Tactical Opportunities Fund | Class R Shares |
|
|
|
| Shareholder Report [Line Items] |
|
|
|
| Fund Name |
Potomac Tactical Opportunities Fund
|
|
|
| Class Name |
Class R
|
|
|
| Trading Symbol |
SDTOX
|
|
|
| Annual or Semi-Annual Statement [Text Block] |
This annual shareholder report contains important information about the Potomac Tactical Opportunities Fund ("Fund") for the period of May 28, 2026 (commencement of Class R shares operations) to June 30, 2026.
|
|
|
| Additional Information [Text Block] |
You can find additional information about the Fund at https://potomacfunds.com/sdtox/. You can also request this information by contacting us at 1-888-774-6679.
|
|
|
| Additional Information Phone Number |
1-888-774-6679
|
|
|
| Additional Information Website |
https://potomacfunds.com/sdtox/
|
|
|
| Expenses [Text Block] |
|
|
|
| Expenses Paid, Amount |
$ 20
|
|
|
| Expense Ratio, Percent |
2.30%
|
|
|
| Expenses Short Period Footnote [Text Block] |
Amount shown reflects the expenses of the Class R shares from May 28, 2026 (commencement of operations) through June 30, 2026. Expenses for a full fiscal year would be higher.
|
|
|
| Factors Affecting Performance [Text Block] |
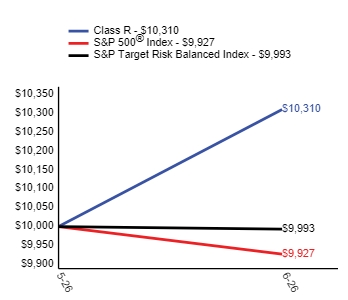
Class R shares of the Fund commenced investment operations on May 28, 2026. For the year ended June 30, 2026, the Institutional Class shares of the Fund returned 26.15%. The S&P 500 Index returned 22.32% in the same period. The S&P Target Risk Balanced Index returned 16.05% in the same period. The Fund posted a strong absolute return due to exposure to the NASDAQ 100 when our NASDAQ timing model identified periods of time when risk-reward was favorable for that index. Additionally, the Fund's momentum strategy was able to identify strong trends in the metals and mining space with added upside from exposure to the silver miners. The strategy also benefitted from exposure to the strong trend in semiconductor stocks that was in place for much of the fiscal year. |
|
|
| Performance Past Does Not Indicate Future [Text] |
The Fund's past performance is not a good predictor of the Fund's future performance.
|
|
|
| Line Graph [Table Text Block] |
|
|
|
| Average Annual Return [Table Text Block] |
|
Class R
| 3.10% |
|
S&P 500® Index
| -0.73% |
|
S&P Target Risk Balanced Index
| -0.07% | |
|
|
| Performance Inception Date |
May 28, 2026
|
|
|
| No Deduction of Taxes [Text Block] |
The graph and table do not reflect the deduction of taxes that a shareholder would pay on fund distributions or redemption of fund shares.
|
|
|
| Net Assets |
$ 245,830,468
|
$ 245,830,468
|
$ 245,830,468
|
| Holdings Count | shares |
10
|
10
|
10
|
| Advisory Fees Paid, Amount |
$ 2,214,399
|
|
|
| Investment Company, Portfolio Turnover |
1177.00%
|
|
|
| Additional Fund Statistics [Text Block] |
| Net Assets ($) |
$245,830,468 |
| Number of Portfolio Holdings |
10 |
| Portfolio Turnover Rate (%) |
1,177%1177% |
| Total Advisory Fees Paid ($) |
$2,214,399 |
|
|
|
| Holdings [Text Block] |
|
iShares 0-3 Month Treasury Bond ETF
|
11.48% |
|
VanEck Semiconductor ETF
|
10.43% |
|
BondBloxx Bloomberg Six Month Target Duration US Treasury ETF
|
9.92% |
|
iShares Russell 2000 Growth ETF
|
9.87% |
|
iShares Russell 2000 ETF
|
9.75% |
|
Invesco Optimum Yield Diversified Commodity Strategy No K-1 ETF
|
9.72% |
|
State Street® SPDR® S&P® Metals & Mining ETF
|
9.63% |
|
Global X Silver Miners ETF
|
9.62% |
|
State Street® Energy Select Sector SPDR® ETF
|
9.59% |
|
State Street Institutional U.S. Government Money Market Fund Premier Class
|
4.58% |
|
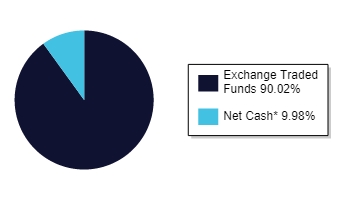
Exchange Traded Funds
|
90.02% |
|
Net Cash*
|
9.98% |
 | | * | Net Cash represents cash, cash equivalents and other assets in excess of liabilities. |
|
|
|
| Largest Holdings [Text Block] |
|
iShares 0-3 Month Treasury Bond ETF
|
11.48% |
|
VanEck Semiconductor ETF
|
10.43% |
|
BondBloxx Bloomberg Six Month Target Duration US Treasury ETF
|
9.92% |
|
iShares Russell 2000 Growth ETF
|
9.87% |
|
iShares Russell 2000 ETF
|
9.75% |
|
Invesco Optimum Yield Diversified Commodity Strategy No K-1 ETF
|
9.72% |
|
State Street® SPDR® S&P® Metals & Mining ETF
|
9.63% |
|
Global X Silver Miners ETF
|
9.62% |
|
State Street® Energy Select Sector SPDR® ETF
|
9.59% |
|
State Street Institutional U.S. Government Money Market Fund Premier Class
|
4.58% |
|
|
|
| Potomac Tactical Rotation Fund | Institutional Class Shares |
|
|
|
| Shareholder Report [Line Items] |
|
|
|
| Fund Name |
|
|
Potomac Tactical Rotation Fund
|
| Class Name |
|
|
Institutional Class
|
| Trading Symbol |
|
|
CRTBX
|
| Annual or Semi-Annual Statement [Text Block] |
|
|
This annual shareholder report contains important information about the Potomac Tactical Rotation Fund ("Fund") for the period of July 1, 2025 to June 30, 2026.
|
| Additional Information [Text Block] |
|
|
You can find additional information about the Fund at https://potomacfunds.com/crtbx/. You can also request this information by contacting us at 1-888-774-6679.
|
| Material Fund Change Notice [Text Block] |
|
|
This report describes changes to the Fund that occurred during the reporting period.
|
| Additional Information Phone Number |
|
|
1-888-774-6679
|
| Additional Information Website |
|
|
https://potomacfunds.com/crtbx/
|
| Expenses [Text Block] |
|
|
| Institutional Class |
$147 |
1.33% |
|
| Expenses Paid, Amount |
|
|
$ 147
|
| Expense Ratio, Percent |
|
|
1.33%
|
| Factors Affecting Performance [Text Block] |
|
|
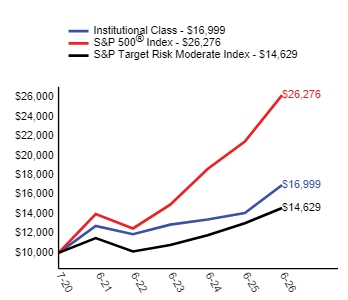
For the year ended June 30, 2026, the Potomac Tactical Rotation Fund returned 20.51%. The S&P 500 Index returned 22.32% in the same period. The S&P Target Risk Moderate Index returned 11.99% in the same period. The Fund posted a strong absolute return due to exposure to the S&P 500 when the risk-reward profile was favorable based on the signals from our composite timing model. Additionally, the Fund's momentum strategy was able to identify strong trends in ETFs with exposure to Japan, the Equal Weight Quality factor, Convertible Bonds, and a broad-based equity index. Underperformance relative to the S&P 500 was largely a function of the investible universe of ETFs for the Fund mostly having a beta and/or standard deviation that is less than the S&P 500. |
| Performance Past Does Not Indicate Future [Text] |
|
|
The Fund's past performance is not a good predictor of the Fund's future performance.
|
| Line Graph [Table Text Block] |
|
|
|
| Average Annual Return [Table Text Block] |
|
|
|
Institutional Class
| 20.51% | 5.86% | 9.25% |
|
S&P 500® Index
| 22.32% | 13.41% | 17.48% |
|
S&P Target Risk Moderate Index
| 11.99% | 4.88% | 6.55% | |
| Performance Inception Date |
|
|
Jul. 01, 2020
|
| No Deduction of Taxes [Text Block] |
|
|
The graph and table do not reflect the deduction of taxes that a shareholder would pay on fund distributions or redemption of fund shares.
|
| Material Change Date |
|
|
Nov. 01, 2025
|
| Net Assets |
$ 280,848,253
|
$ 280,848,253
|
$ 280,848,253
|
| Holdings Count | shares |
9
|
9
|
9
|
| Advisory Fees Paid, Amount |
|
|
$ 2,494,558
|
| Investment Company, Portfolio Turnover |
|
|
588.00%
|
| Additional Fund Statistics [Text Block] |
|
|
| Net Assets ($) |
$280,848,253 |
| Number of Portfolio Holdings |
9 |
| Portfolio Turnover Rate (%) |
588% |
| Total Advisory Fees Paid ($) |
$2,494,558 |
|
| Holdings [Text Block] |
|
|
|
iShares 0-3 Month Treasury Bond ETF
|
19.23% |
|
State Street Institutional U.S. Government Money Market Fund Premier Class
|
16.02% |
|
BondBloxx Bloomberg Six Month Target Duration US Treasury ETF
|
10.40% |
|
Astoria US Equal Weight Quality Kings ETF
|
9.98% |
|
Vanguard Total Stock Market ETF
|
9.98% |
|
WisdomTree U.S. Quality Dividend Growth Fund
|
9.90% |
|
State Street® SPDR® Bloomberg Convertible Securities ETF
|
9.87% |
|
WisdomTree Japan Hedged Equity Fund
|
9.87% |
|
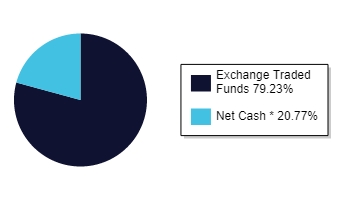
Exchange Traded Funds
|
79.23% |
|
Net Cash *
|
20.77% |
 | | * | Net Cash represents cash, cash equivalents and other assets, including futures contracts, in excess of liabilities. |
|
| Largest Holdings [Text Block] |
|
|
|
iShares 0-3 Month Treasury Bond ETF
|
19.23% |
|
State Street Institutional U.S. Government Money Market Fund Premier Class
|
16.02% |
|
BondBloxx Bloomberg Six Month Target Duration US Treasury ETF
|
10.40% |
|
Astoria US Equal Weight Quality Kings ETF
|
9.98% |
|
Vanguard Total Stock Market ETF
|
9.98% |
|
WisdomTree U.S. Quality Dividend Growth Fund
|
9.90% |
|
State Street® SPDR® Bloomberg Convertible Securities ETF
|
9.87% |
|
WisdomTree Japan Hedged Equity Fund
|
9.87% |
|
| Material Fund Change [Text Block] |
|
|
Effective November 1, 2025, the Fund may invest in underlying funds that hold or have exposure to cryptocurrencies such as Bitcoin, including ETFs (exchange traded funds) and ETPs (exchange traded products) that invest directly in Bitcoin and Bitcoin futures. Additionally, the Fund may invest up to 15% of its assets in ETFs and ETPs that hold Bitcoin and Bitcoin futures. |
| Material Fund Change Strategies [Text Block] |
|
|
Effective November 1, 2025, the Fund may invest in underlying funds that hold or have exposure to cryptocurrencies such as Bitcoin, including ETFs (exchange traded funds) and ETPs (exchange traded products) that invest directly in Bitcoin and Bitcoin futures. Additionally, the Fund may invest up to 15% of its assets in ETFs and ETPs that hold Bitcoin and Bitcoin futures.
|
| Potomac Tactical Rotation Fund | Class R Shares |
|
|
|
| Shareholder Report [Line Items] |
|
|
|
| Fund Name |
Potomac Tactical Rotation Fund
|
|
|
| Class Name |
Class R
|
|
|
| Trading Symbol |
SDTRX
|
|
|
| Annual or Semi-Annual Statement [Text Block] |
This annual shareholder report contains important information about the Potomac Tactical Rotation Fund ("Fund") for the period of May 28, 2026 (commencement of Class R shares operations) to June 30, 2026.
|
|
|
| Additional Information [Text Block] |
You can find additional information about the Fund at https://potomacfunds.com/sdtrx/. You can also request this information by contacting us at 1-888-774-6679.
|
|
|
| Additional Information Phone Number |
1-888-774-6679
|
|
|
| Additional Information Website |
https://potomacfunds.com/sdtrx/
|
|
|
| Expenses [Text Block] |
|
|
|
| Expenses Paid, Amount |
$ 20
|
|
|
| Expense Ratio, Percent |
2.27%
|
|
|
| Expenses Short Period Footnote [Text Block] |
Amount shown reflects the expenses of the Class R shares from May 28, 2026 (commencement of operations) through June 30, 2026. Expenses for a full fiscal year would be higher.
|
|
|
| Factors Affecting Performance [Text Block] |
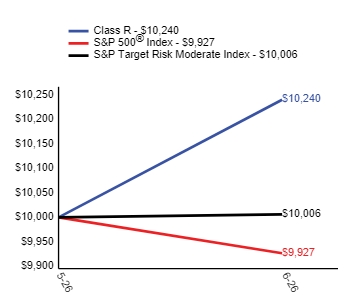
Class R shares of the Fund commenced investment operations on May 28, 2026. For the year ended June 30, 2026, the Institutional Class shares of the Fund returned 20.51%. The S&P 500 Index returned 22.32% in the same period. The S&P Target Risk Moderate Index returned 11.99% in the same period. The Fund posted a strong absolute return due to exposure to the S&P 500 when the risk-reward profile was favorable based on the signals from our composite timing model. Additionally, the Fund's momentum strategy was able to identify strong trends in ETFs with exposure to Japan, the Equal Weight Quality factor, Convertible Bonds, and a broad-based equity index. Underperformance relative to the S&P 500 was largely a function of the investible universe of ETFs for the Fund mostly having a beta and/or standard deviation that is less than the S&P 500. |
|
|
| Performance Past Does Not Indicate Future [Text] |
The Fund's past performance is not a good predictor of the Fund's future performance.
|
|
|
| Line Graph [Table Text Block] |
|
|
|
| Average Annual Return [Table Text Block] |
|
Class R
| 2.40% |
|
S&P 500® Index
| -0.73% |
|
S&P Target Risk Moderate Index
| 0.06% | |
|
|
| Performance Inception Date |
May 28, 2026
|
|
|
| No Deduction of Taxes [Text Block] |
The graph and table do not reflect the deduction of taxes that a shareholder would pay on fund distributions or redemption of fund shares.
|
|
|
| Net Assets |
$ 280,848,253
|
$ 280,848,253
|
$ 280,848,253
|
| Holdings Count | shares |
9
|
9
|
9
|
| Advisory Fees Paid, Amount |
$ 2,494,558
|
|
|
| Investment Company, Portfolio Turnover |
588.00%
|
|
|
| Additional Fund Statistics [Text Block] |
| Net Assets ($) |
$280,848,253 |
| Number of Portfolio Holdings |
9 |
| Portfolio Turnover Rate (%) |
588% |
| Total Advisory Fees Paid ($) |
$2,494,558 |
|
|
|
| Holdings [Text Block] |
|
iShares 0-3 Month Treasury Bond ETF
|
19.23% |
|
State Street Institutional U.S. Government Money Market Fund Premier Class
|
16.02% |
|
BondBloxx Bloomberg Six Month Target Duration US Treasury ETF
|
10.40% |
|
Astoria US Equal Weight Quality Kings ETF
|
9.98% |
|
Vanguard Total Stock Market ETF
|
9.98% |
|
WisdomTree U.S. Quality Dividend Growth Fund
|
9.90% |
|
State Street® SPDR® Bloomberg Convertible Securities ETF
|
9.87% |
|
WisdomTree Japan Hedged Equity Fund
|
9.87% |
|
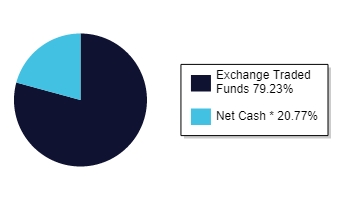
Exchange Traded Funds
|
79.23% |
|
Net Cash *
|
20.77% |
 | | * | Net Cash represents cash, cash equivalents and other assets, including futures contracts, in excess of liabilities. |
|
|
|
| Largest Holdings [Text Block] |
|
iShares 0-3 Month Treasury Bond ETF
|
19.23% |
|
State Street Institutional U.S. Government Money Market Fund Premier Class
|
16.02% |
|
BondBloxx Bloomberg Six Month Target Duration US Treasury ETF
|
10.40% |
|
Astoria US Equal Weight Quality Kings ETF
|
9.98% |
|
Vanguard Total Stock Market ETF
|
9.98% |
|
WisdomTree U.S. Quality Dividend Growth Fund
|
9.90% |
|
State Street® SPDR® Bloomberg Convertible Securities ETF
|
9.87% |
|
WisdomTree Japan Hedged Equity Fund
|
9.87% |
|
|
|
| Potomac Tactically Passive Fund | Institutional Class Shares |
|
|
|
| Shareholder Report [Line Items] |
|
|
|
| Fund Name |
|
Potomac Tactically Passive Fund
|
|
| Class Name |
|
Institutional Class
|
|
| Trading Symbol |
|
CRTPX
|
|
| Annual or Semi-Annual Statement [Text Block] |
|
This annual shareholder report contains important information about the Potomac Tactically Passive Fund ("Fund") for the period of February 11, 2026 (commencement of Institutional Class shares operations) to June 30, 2026.
|
|
| Additional Information [Text Block] |
|
You can find additional information about the Fund at https://potomacfunds.com/crtpx/. You can also request this information by contacting us at 1-888-774-6679.
|
|
| Additional Information Phone Number |
|
1-888-774-6679
|
|
| Additional Information Website |
|
https://potomacfunds.com/crtpx/
|
|
| Expenses [Text Block] |
|
| Institutional Class |
$56 |
1.45% |
|
|
| Expenses Paid, Amount |
|
$ 56
|
|
| Expense Ratio, Percent |
|
1.45%
|
|
| Expenses Short Period Footnote [Text Block] |
|
Amount shown reflects the expenses of the Institutional Class shares from February 11, 2026 (commencement of operations) through June 30, 2026. Expenses for a full fiscal year would be higher.
|
|
| Factors Affecting Performance [Text Block] |
|
From inception on February 11, 2026, until the end of the fiscal year on June 30, 2026, the Potomac Tactically Passive Fund returned 1.70%. The S&P 500 Index returned 8.56% in the same period. Underperformance relative to the benchmark is a function of the composite model that drives investment positioning in the Fund moving to a cash position in early April while the S&P 500 was moving strongly higher. |
|
| Net Assets |
$ 139,204,049
|
$ 139,204,049
|
$ 139,204,049
|
| Holdings Count | shares |
2
|
2
|
2
|
| Advisory Fees Paid, Amount |
|
$ 290,236
|
|
| Investment Company, Portfolio Turnover |
|
6.00%
|
|
| Additional Fund Statistics [Text Block] |
|
| Net Assets ($) |
$139,204,049 |
| Number of Portfolio Holdings |
2 |
| Portfolio Turnover Rate (%) |
6% |
| Total Advisory Fees Paid ($) |
$290,236 |
|
|
| Holdings [Text Block] |
|
|
State Street® SPDR® Portfolio S&P 500® ETF
|
98.84% |
|
State Street Institutional U.S. Government Money Market Fund Premier Class
|
0.47% |
|
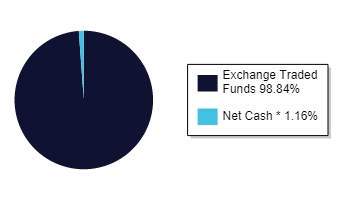
Exchange Traded Funds
|
98.84% |
|
Net Cash *
|
1.16% |
 | | * | Net Cash represents cash, cash equivalents and other assets in excess of liabilities. |
|
|
| Largest Holdings [Text Block] |
|
|
State Street® SPDR® Portfolio S&P 500® ETF
|
98.84% |
|
State Street Institutional U.S. Government Money Market Fund Premier Class
|
0.47% |
|
|
| Potomac Tactically Passive Fund | Class R Shares |
|
|
|
| Shareholder Report [Line Items] |
|
|
|
| Fund Name |
Potomac Tactically Passive Fund
|
|
|
| Class Name |
Class R
|
|
|
| Trading Symbol |
SDTPX
|
|
|
| Annual or Semi-Annual Statement [Text Block] |
This annual shareholder report contains important information about the Potomac Tactically Passive Fund ("Fund") for the period of May 28, 2026 (commencement of Class R shares operations) to June 30, 2026.
|
|
|
| Additional Information [Text Block] |
You can find additional information about the Fund at https://potomacfunds.com/sdtpx/. You can also request this information by contacting us at 1-888-774-6679.
|
|
|
| Additional Information Phone Number |
1-888-774-6679
|
|
|
| Additional Information Website |
https://potomacfunds.com/sdtpx/
|
|
|
| Expenses [Text Block] |
|
|
|
| Expenses Paid, Amount |
$ 21
|
|
|
| Expense Ratio, Percent |
2.42%
|
|
|
| Expenses Short Period Footnote [Text Block] |
Amount shown reflects the expenses of the Class R shares from May 28, 2026 (commencement of operations) through June 30, 2026. Expenses for a full fiscal year would be higher.
|
|
|
| Factors Affecting Performance [Text Block] |
Class R shares of the Fund commenced investment operations on May 28, 2026. From inception on February 11, 2026, until the end of the fiscal year on June 30, 2026, the Institutional Class shares returned 1.70%. The S&P 500 Index returned 8.56% in the same period. Underperformance relative to the benchmark is a function of the composite model that drives investment positioning in the Fund moving to a cash position in early April while the S&P 500 was moving strongly higher. |
|
|
| Net Assets |
$ 139,204,049
|
$ 139,204,049
|
$ 139,204,049
|
| Holdings Count | shares |
2
|
2
|
2
|
| Advisory Fees Paid, Amount |
$ 290,236
|
|
|
| Investment Company, Portfolio Turnover |
6.00%
|
|
|
| Additional Fund Statistics [Text Block] |
| Net Assets ($) |
$139,204,049 |
| Number of Portfolio Holdings |
2 |
| Portfolio Turnover Rate (%) |
6% |
| Total Advisory Fees Paid ($) |
$290,236 |
|
|
|
| Holdings [Text Block] |
|
State Street® SPDR® Portfolio S&P 500® ETF
|
98.84% |
|
State Street Institutional U.S. Government Money Market Fund Premier Class
|
0.47% |
|
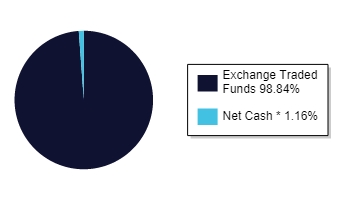
Exchange Traded Funds
|
98.84% |
|
Net Cash *
|
1.16% |
 | | * | Net Cash represents cash, cash equivalents and other assets in excess of liabilities. |
|
|
|
| Largest Holdings [Text Block] |
|
State Street® SPDR® Portfolio S&P 500® ETF
|
98.84% |
|
State Street Institutional U.S. Government Money Market Fund Premier Class
|
0.47% |
|
|
|