
I N V E S T O R P R E S E N T A T I O N Raymond James 2026 U.S. Bank & Banking on Tech Conferences Chicago | September 9 - 10, 2026 N Y S E : C B N A
Cautionary Note Regarding Forward-Looking Statements This presentation contains forward-looking statements within the meaning of the U.S. federal securities laws. Forward-looking statements involve risks and uncertainties. You should not place undue reliance on forward-looking statements because they are subject to numerous uncertainties and factors relating to our operations and business, all of which are difficult to predict and many of which are beyond our control. Forward-looking statements include information concerning our possible or assumed future results of operations. These forward-looking statements are generally identified by the use of forward-looking terminology, including the terms “anticipate,” “believe,” “could,” “estimate,” “expect,” “intend,” “may,” “might,” “plan,” “potential,” “predict,” “project,” “should,” “target,” “will,” “would” and, in each case, their negative or other variations or comparable terminology and expressions. Actual results, performance, or achievements could differ materially from those contemplated, expressed, or implied by the forward- looking statements. Any forward-looking statements presented herein are made only as of the date of this presentation, and the Company does not undertake any obligation to update or revise any forward- looking statements to reflect changes in assumptions, new information, the occurrence of unanticipated events, or otherwise, except as required by law. Forward-looking statements include, among other things, statements relating to: (i) changes in trade, monetary and fiscal policies of, and other activities undertaken by, governments, agencies, central banks and similar organizations, including the effects of United States federal government spending and tariffs; (ii) the level of, or changes in the level of, interest rates and inflation, including the effects on our net interest income, noninterest income, and the market value of our investment and loan portfolios; (iii) the level and composition of our deposits, including our ability to attract and retain, and the seasonality of, client deposits, including those in the ICS® network, as well as the amount and timing of deposit inflows and outflows and the concentration of our deposits; (iv) our future net interest margin, net interest income, net income, and return on equity; (v) our political organization clients’ fundraising and disbursement activities; (vi) the level and composition of our loan portfolio, including our ability to maintain the credit quality of our loan portfolio; (vii) current and future business, economic and market conditions in the United States generally or in the Washington, D.C. metropolitan area in particular; (viii) the effects of disruptions or instability in the financial system, including as a result of the failure of a financial institution or other participants in it, or geopolitical instability, including war, terrorist attacks, pandemics and man-made and natural disasters; (ix) the impact of, and changes, in applicable laws, regulations, regulatory expectations and accounting standards and policies; (x) our likelihood of success in, and the impact of, legal, regulatory or other actions, investigations or proceedings related to our business; (xi) adverse publicity or reputational harm to us, our senior officers, directors, employees or clients; (xii) our ability to effectively execute our growth plans or other initiatives; (xiii) changes in demand for our products and services; (xiv) our levels of, and access to, sources of liquidity and capital; (xv)the ability to attract and retain essential personnel or changes in our essential personnel; (xvi)our ability to effectively compete with banks, non-bank financial institutions, and financial technology firms and the effects of competition in the financial services industry on our business; (xvii)the emergence, adoption and evolution of new technologies and payment methods, including stablecoins, digital assets, blockchains and other technologies based on distributed ledgers, and their effects on competition and our business; (xviii) the development, use and regulation of artificial intelligence, including by us, our vendors and our competitors; (xix) the effectiveness of our risk management and internal disclosure controls and procedures; (xx) any failure or interruption of our information and technology systems, including any components provided by a third party; (xxi) our ability to identify and address cybersecurity threats and breaches; (xxii) our ability to keep pace with technological changes; (xxiii) our ability to receive dividends from Chain Bridge Bank, N.A. and satisfy our obligations as they become due; (xxiv) the incremental costs of operating as a public company; (xxv) our ability to meet our obligations as a public company, including our obligation under Section 404 of the Sarbanes-Oxley Act; and (xxvi) the effect of our dual-class structure and the concentrated ownership of our Class B common stock, including beneficial ownership of our shares by members of the Fitzgerald Family. You should not rely upon forward-looking statements as predictions of future events. We have based the forward-looking statements contained in this presentation primarily on our current expectations and projections about future events and trends that we believe may affect our business, financial condition, results of operations and prospects. The outcome of the events described in these forward- looking statements is subject to risks, uncertainties and other factors, including the risks described in the “Risk Factors” section of the Company’s most recent Annual Report on Form 10-K for the year ended December 31, 2025, and in the Company’s subsequent filings with the Securities and Exchange Commission, including its Quarterly Reports on Form 10-Q, available at the Securities and Exchange Commission’s website (www.sec.gov). Chain Bridge Bancorp, Inc. 2
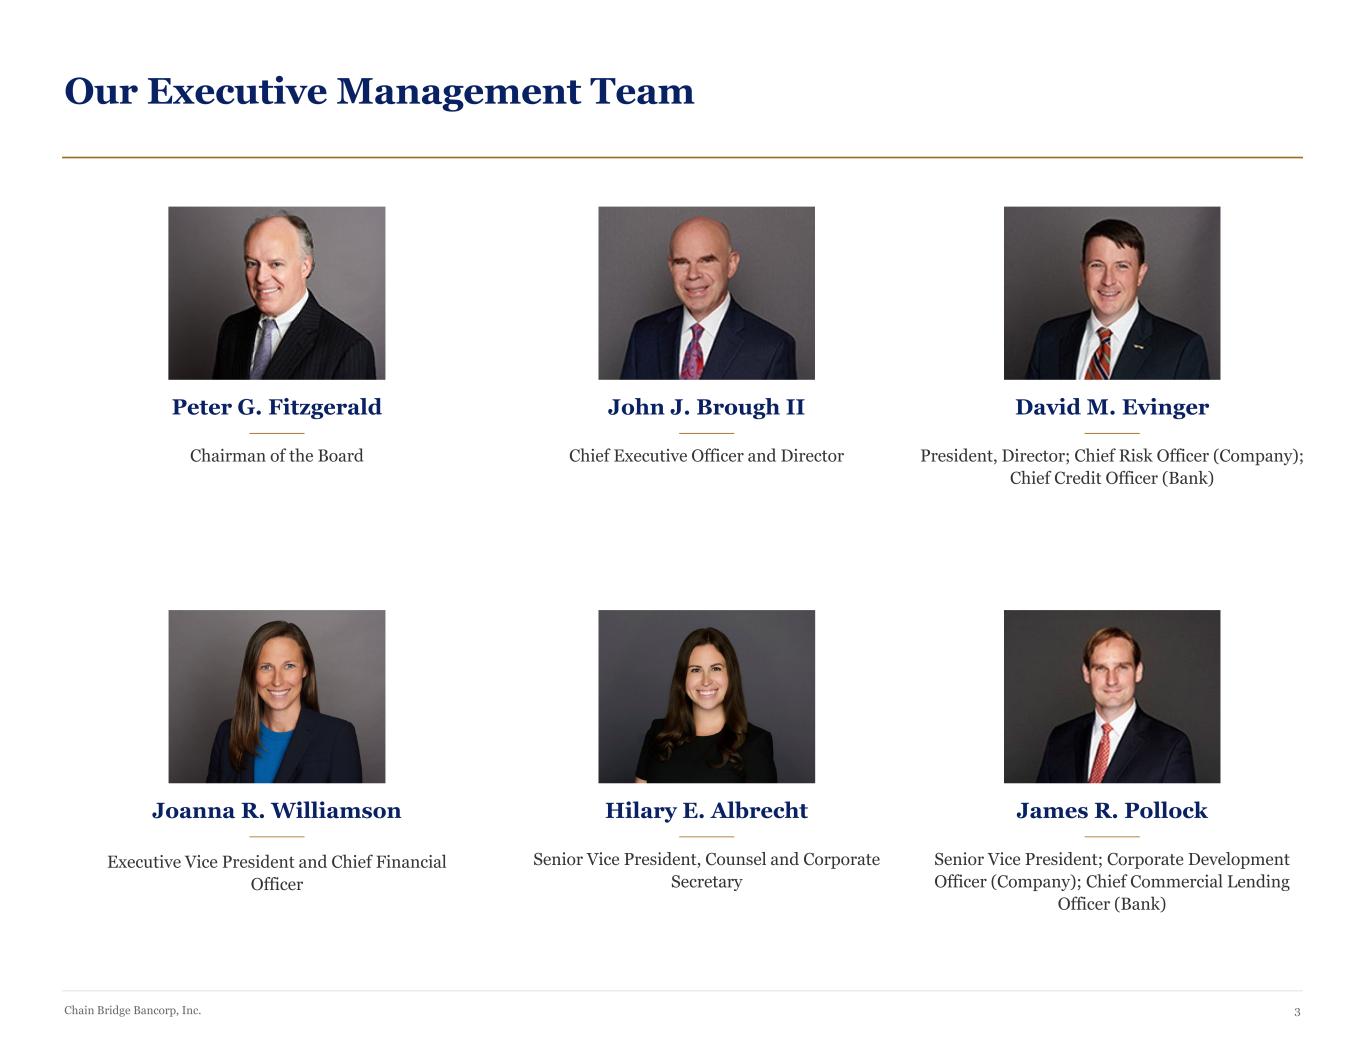
Our Executive Management Team Peter G. Fitzgerald Chairman of the Board John J. Brough II Chief Executive Officer and Director David M. Evinger President, Director; Chief Risk Officer (Company); Chief Credit Officer (Bank) Joanna R. Williamson Executive Vice President and Chief Financial Officer Hilary E. Albrecht Senior Vice President, Counsel and Corporate Secretary James R. Pollock Senior Vice President; Corporate Development Officer (Company); Chief Commercial Lending Officer (Bank) Chain Bridge Bancorp, Inc. 3
Company Overview Chain Bridge Bancorp, Inc. is a Delaware-chartered bank holding company and the parent of its wholly-owned subsidiary, Chain Bridge Bank, N.A., a nationally chartered commercial bank with fiduciary powers granted by the Office of the Comptroller of the Currency. ■ Founded: Incorporated on May 26, 2006; Bank opened August 6, 2007 ■ Trust Powers: Granted by the OCC on March 5, 2020; trust activities initiated on September 18, 2020 ■ Headquarters: McLean, VA (approximately 5 miles from Washington, D.C.) ■ IPO: October 2024 – Issued 1,992,897 shares of Class A common stock, par value $0.01 per share, at $22.00 per share – IPO and partial exercise of the underwriters’ over-allotment option resulted in approximately $36.5 million in net proceeds to the Company ■ Listing: Traded on the New York Stock Exchange (NYSE) under ticker symbol “CBNA” ■ Index Membership: As of June 30, 2025, the Company was added to the Russell 3000® Index and certain other Russell indices. Membership in these indices is determined annually by FTSE Russell and is subject to change. As of June 30, 2026, the Company remains a member of these indices. Chain Bridge Bancorp, Inc. 4
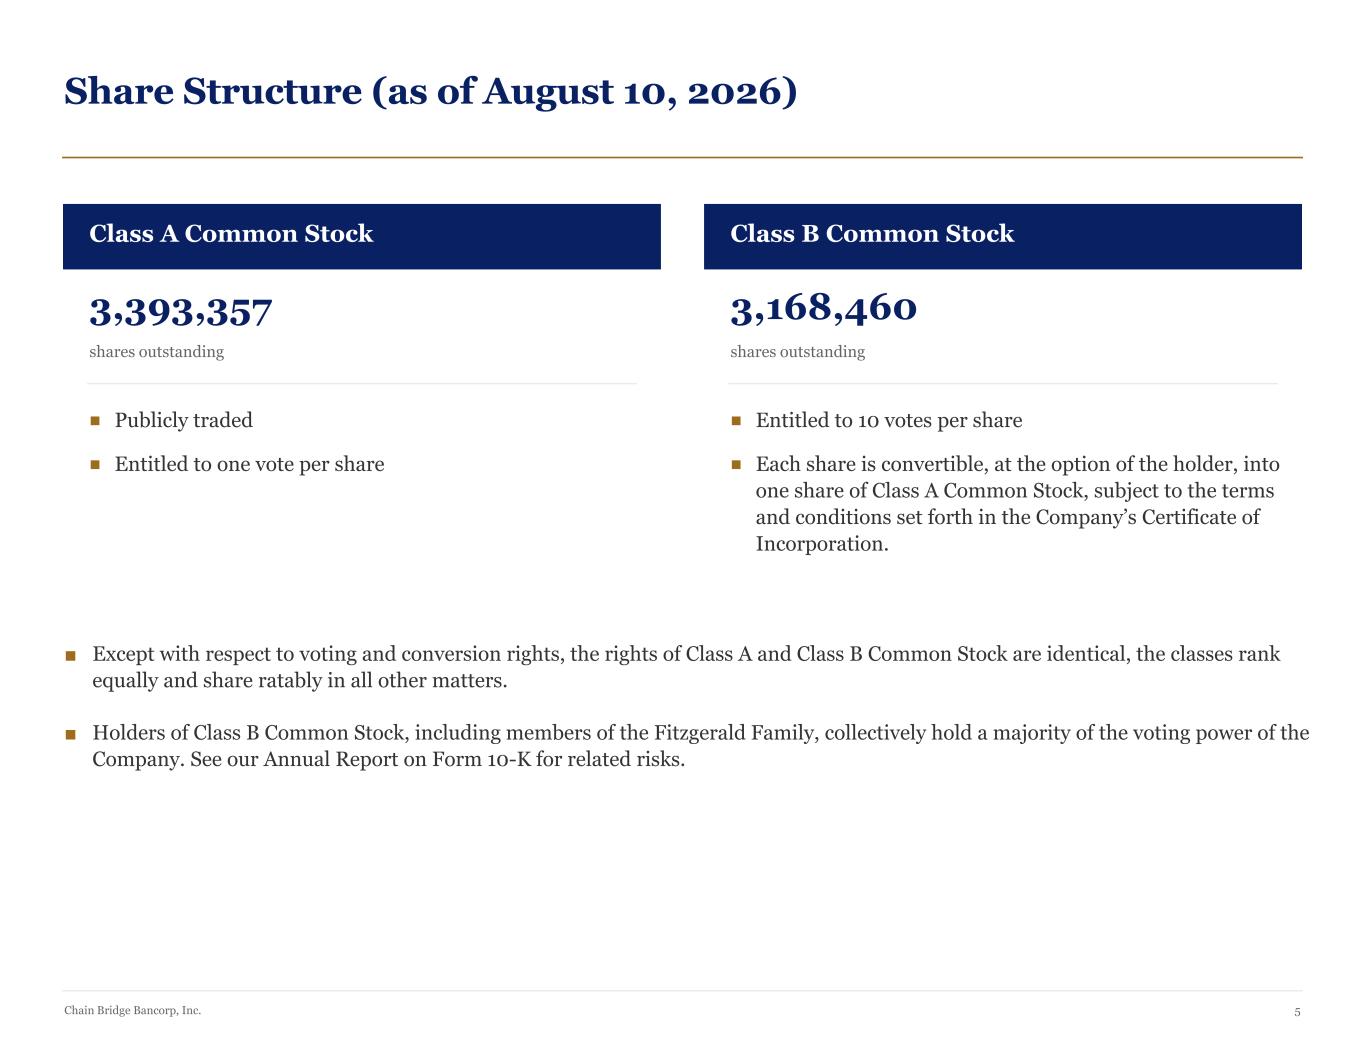
Share Structure (as of August 10, 2026) Class A Common Stock 3,393,357 shares outstanding ■ Publicly traded ■ Entitled to one vote per share Class B Common Stock 3,168,460 shares outstanding ■ Entitled to 10 votes per share ■ Each share is convertible, at the option of the holder, into one share of Class A Common Stock, subject to the terms and conditions set forth in the Company’s Certificate of Incorporation. ■ Except with respect to voting and conversion rights, the rights of Class A and Class B Common Stock are identical, the classes rank equally and share ratably in all other matters. ■ Holders of Class B Common Stock, including members of the Fitzgerald Family, collectively hold a majority of the voting power of the Company. See our Annual Report on Form 10-K for related risks. Chain Bridge Bancorp, Inc. 5
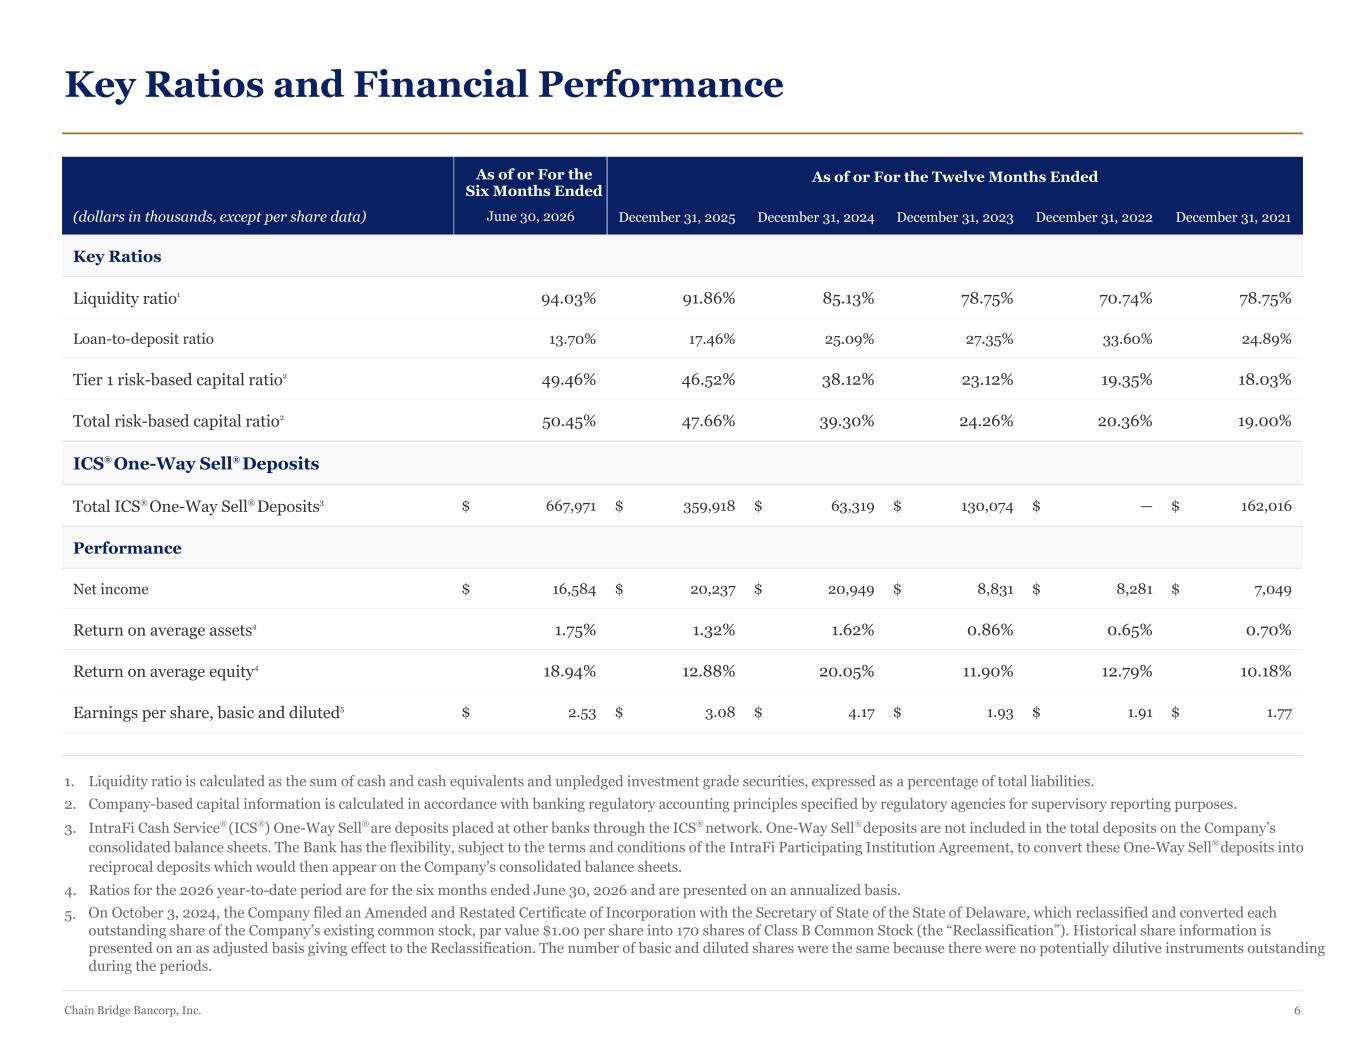
Key Ratios and Financial Performance (dollars in thousands, except per share data) As of or For the Six Months Ended June 30, 2026 As of or For the Twelve Months Ended December 31, 2025 December 31, 2024 December 31, 2023 December 31, 2022 December 31, 2021 Key Ratios Liquidity ratio1 94.03% 91.86% 85.13% 78.75% 70.74% 78.75% Loan-to-deposit ratio 13.70% 17.46% 25.09% 27.35% 33.60% 24.89% Tier 1 risk-based capital ratio2 49.46% 46.52% 38.12% 23.12% 19.35% 18.03% Total risk-based capital ratio2 50.45% 47.66% 39.30% 24.26% 20.36% 19.00% ICS® One-Way Sell® Deposits Total ICS® One-Way Sell® Deposits3 $ 667,971 $ 359,918 $ 63,319 $ 130,074 $ — $ 162,016 Performance Net income $ 16,584 $ 20,237 $ 20,949 $ 8,831 $ 8,281 $ 7,049 Return on average assets4 1.75% 1.32% 1.62% 0.86% 0.65% 0.70% Return on average equity4 18.94% 12.88% 20.05% 11.90% 12.79% 10.18% Earnings per share, basic and diluted5 $ 2.53 $ 3.08 $ 4.17 $ 1.93 $ 1.91 $ 1.77 1. Liquidity ratio is calculated as the sum of cash and cash equivalents and unpledged investment grade securities, expressed as a percentage of total liabilities. 2. Company-based capital information is calculated in accordance with banking regulatory accounting principles specified by regulatory agencies for supervisory reporting purposes. 3. IntraFi Cash Service® (ICS®) One-Way Sell® are deposits placed at other banks through the ICS® network. One-Way Sell® deposits are not included in the total deposits on the Company’s consolidated balance sheets. The Bank has the flexibility, subject to the terms and conditions of the IntraFi Participating Institution Agreement, to convert these One-Way Sell® deposits into reciprocal deposits which would then appear on the Company’s consolidated balance sheets. 4. Ratios for the 2026 year-to-date period are for the six months ended June 30, 2026 and are presented on an annualized basis. 5. On October 3, 2024, the Company filed an Amended and Restated Certificate of Incorporation with the Secretary of State of the State of Delaware, which reclassified and converted each outstanding share of the Company’s existing common stock, par value $1.00 per share into 170 shares of Class B Common Stock (the “Reclassification”). Historical share information is presented on an as adjusted basis giving effect to the Reclassification. The number of basic and diluted shares were the same because there were no potentially dilutive instruments outstanding during the periods. Chain Bridge Bancorp, Inc. 6
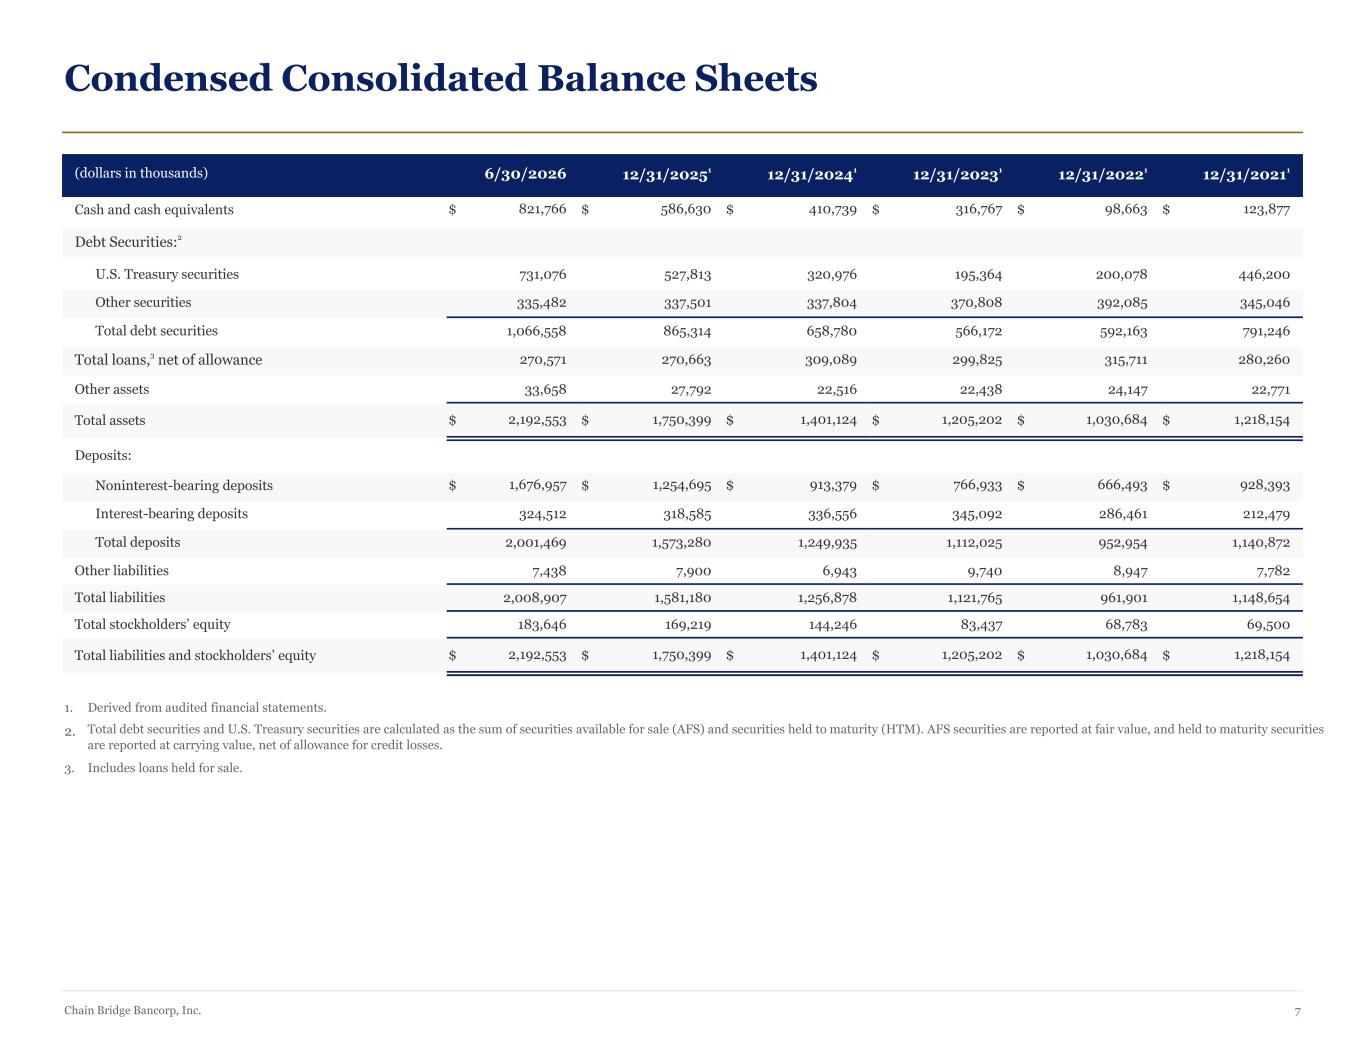
Condensed Consolidated Balance Sheets (dollars in thousands) 6/30/2026 12/31/20251 12/31/20241 12/31/20231 12/31/20221 12/31/20211 Cash and cash equivalents $ 821,766 $ 586,630 $ 410,739 $ 316,767 $ 98,663 $ 123,877 Debt Securities:2 U.S. Treasury securities 731,076 527,813 320,976 195,364 200,078 446,200 Other securities 335,482 337,501 337,804 370,808 392,085 345,046 Total debt securities 1,066,558 865,314 658,780 566,172 592,163 791,246 Total loans,3 net of allowance 270,571 270,663 309,089 299,825 315,711 280,260 Other assets 33,658 27,792 22,516 22,438 24,147 22,771 Total assets $ 2,192,553 $ 1,750,399 $ 1,401,124 $ 1,205,202 $ 1,030,684 $ 1,218,154 Deposits: Noninterest-bearing deposits $ 1,676,957 $ 1,254,695 $ 913,379 $ 766,933 $ 666,493 $ 928,393 Interest-bearing deposits 324,512 318,585 336,556 345,092 286,461 212,479 Total deposits 2,001,469 1,573,280 1,249,935 1,112,025 952,954 1,140,872 Other liabilities 7,438 7,900 6,943 9,740 8,947 7,782 Total liabilities 2,008,907 1,581,180 1,256,878 1,121,765 961,901 1,148,654 Total stockholders’ equity 183,646 169,219 144,246 83,437 68,783 69,500 Total liabilities and stockholders’ equity $ 2,192,553 $ 1,750,399 $ 1,401,124 $ 1,205,202 $ 1,030,684 $ 1,218,154 1. Derived from audited financial statements. 2. Total debt securities and U.S. Treasury securities are calculated as the sum of securities available for sale (AFS) and securities held to maturity (HTM). AFS securities are reported at fair value, and held to maturity securities are reported at carrying value, net of allowance for credit losses. 3. Includes loans held for sale. Chain Bridge Bancorp, Inc. 7
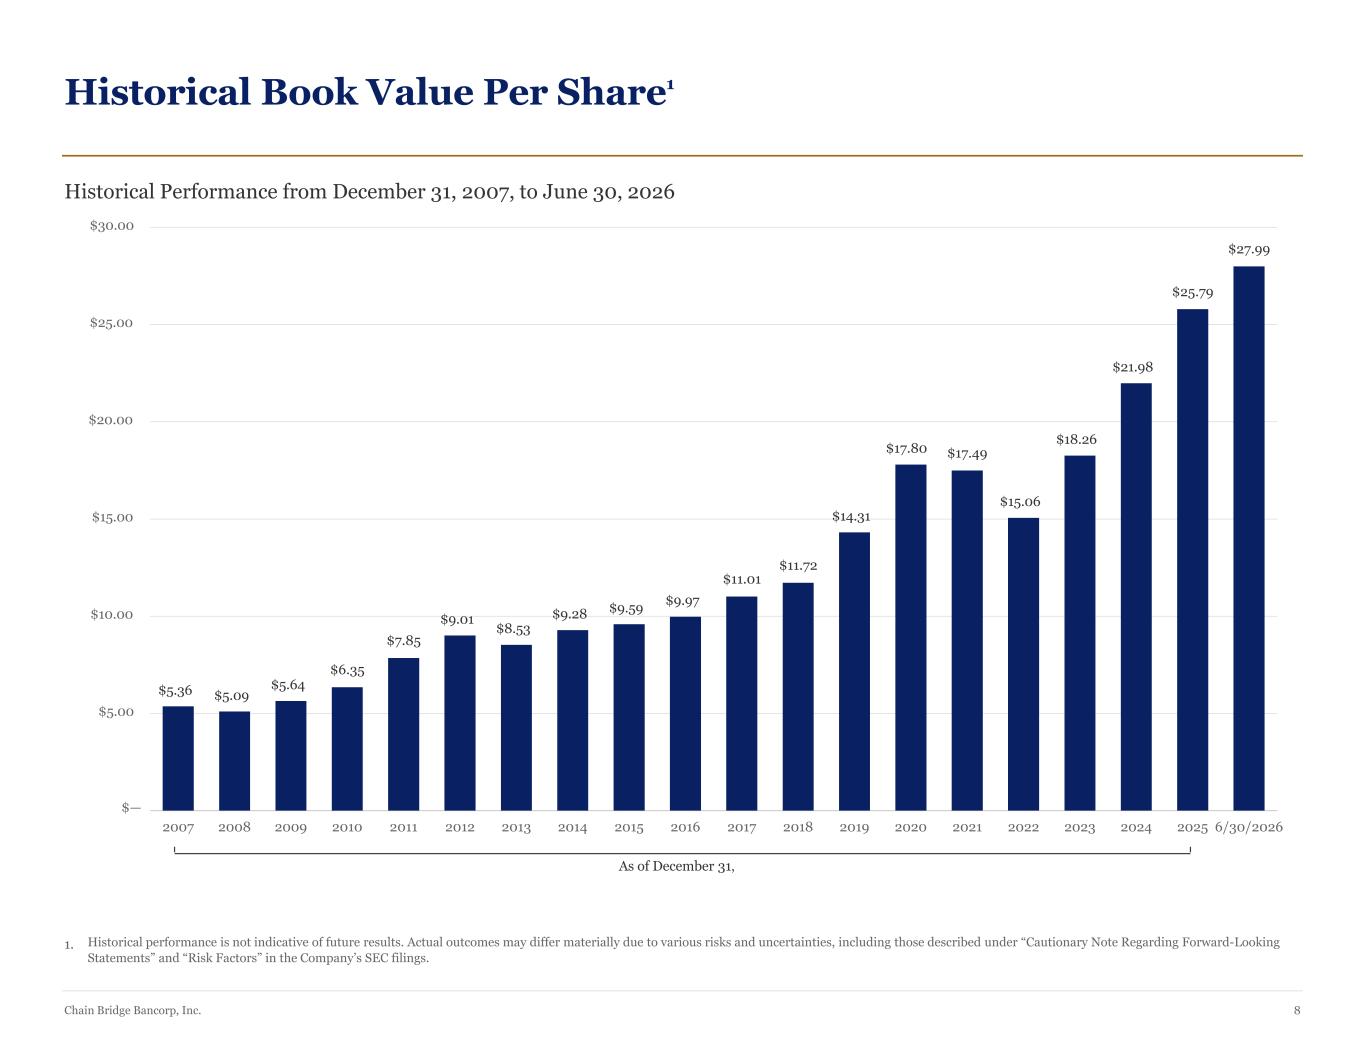
Historical Book Value Per Share1 Historical Performance from December 31, 2007, to June 30, 2026 $5.00 $10.00 $15.00 $20.00 $25.00 $5.36 $5.09 $5.64 $6.35 $7.85 $9.01 $8.53 $9.28 $9.59 $9.97 $14.31 $17.80 $15.06 $18.26 $21.98 1. Historical performance is not indicative of future results. Actual outcomes may differ materially due to various risks and uncertainties, including those described under “Cautionary Note Regarding Forward-Looking Statements” and “Risk Factors” in the Company’s SEC filings. Chain Bridge Bancorp, Inc. 8 As of December 31, 2007 2008 2009 2010 2011 2012 2013 2014 2015 2016 2017 2018 2019 2020 2021 2022 2023 2024 2025 6/30/2026 $— $17.49 $11.01 $11.72 $25.79 $27.99 $30.00
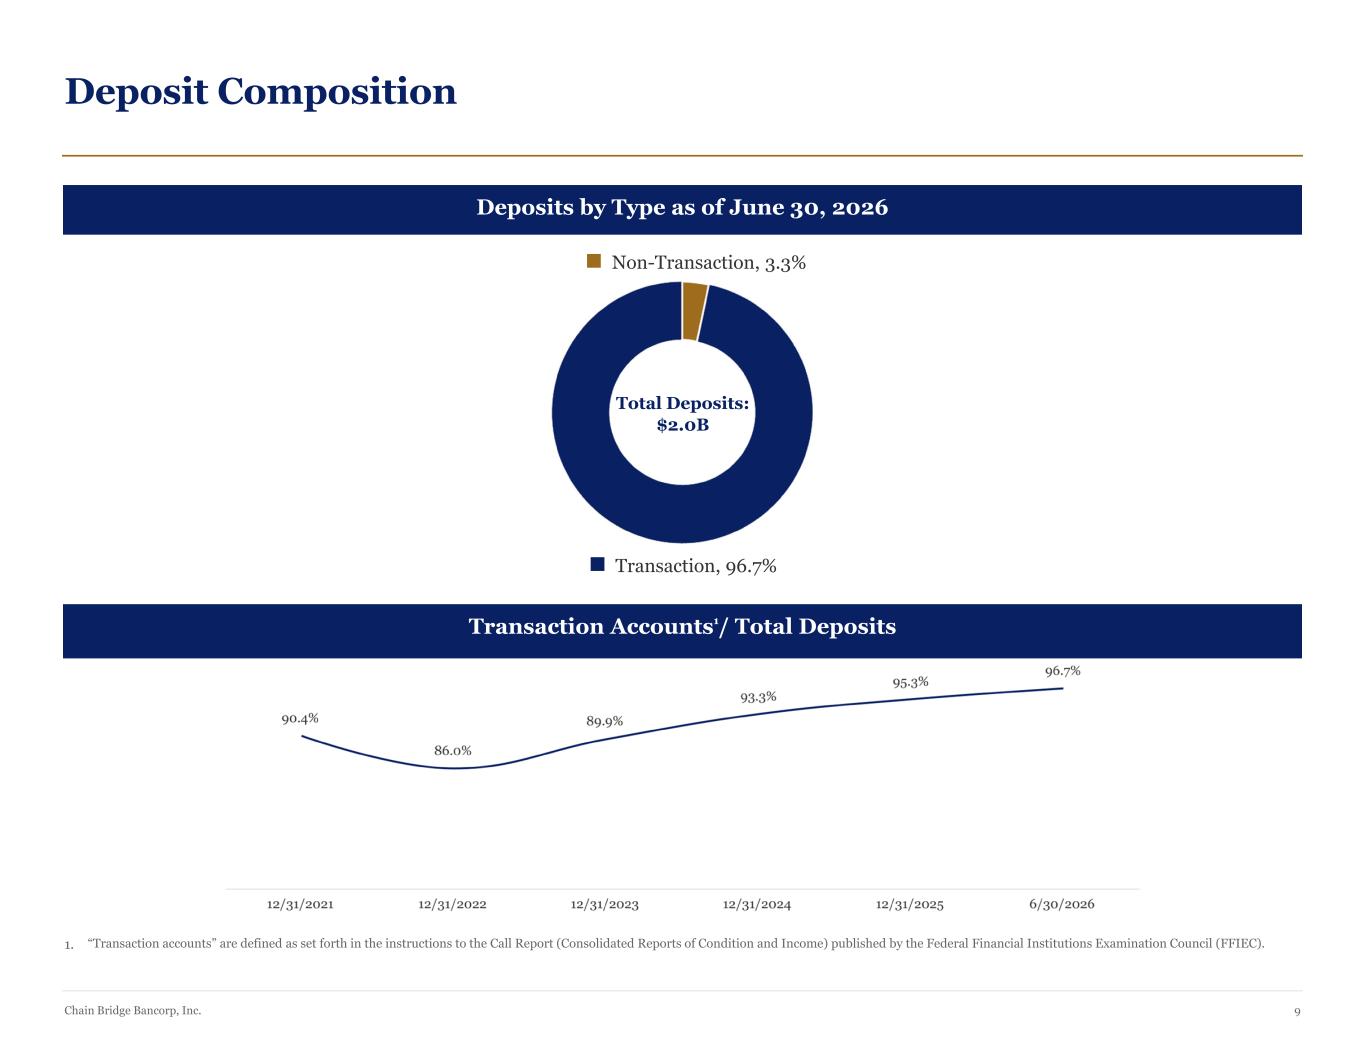
Deposit Composition Deposits by Type as of June 30, 2026 Non-Transaction, 3.3% Total Deposits: $2.0B Transaction, 96.7% Transaction Accounts1/ Total Deposits 1. “Transaction accounts” are defined as set forth in the instructions to the Call Report (Consolidated Reports of Condition and Income) published by the Federal Financial Institutions Examination Council (FFIEC). Chain Bridge Bancorp, Inc. 9
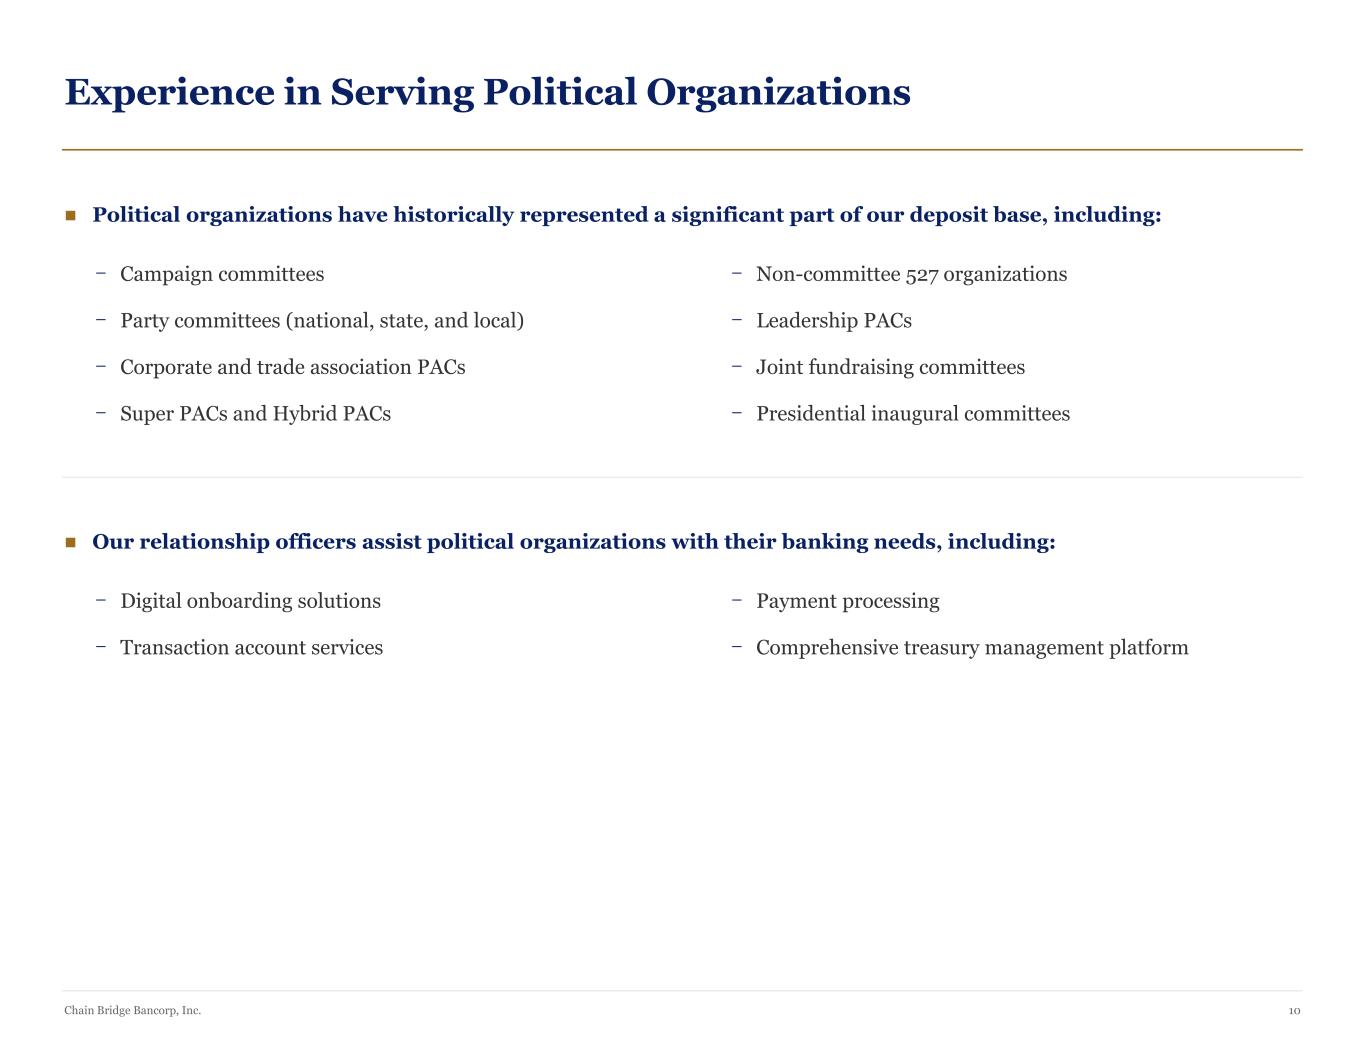
Experience in Serving Political Organizations ■ Political organizations have historically represented a significant part of our deposit base, including: – Campaign committees – Non-committee 527 organizations – Party committees (national, state, and local) – Leadership PACs – Corporate and trade association PACs – Joint fundraising committees – Super PACs and Hybrid PACs – Presidential inaugural committees ■ Our relationship officers assist political organizations with their banking needs, including: – Digital onboarding solutions – Payment processing – Transaction account services – Comprehensive treasury management platform Chain Bridge Bancorp, Inc. 10
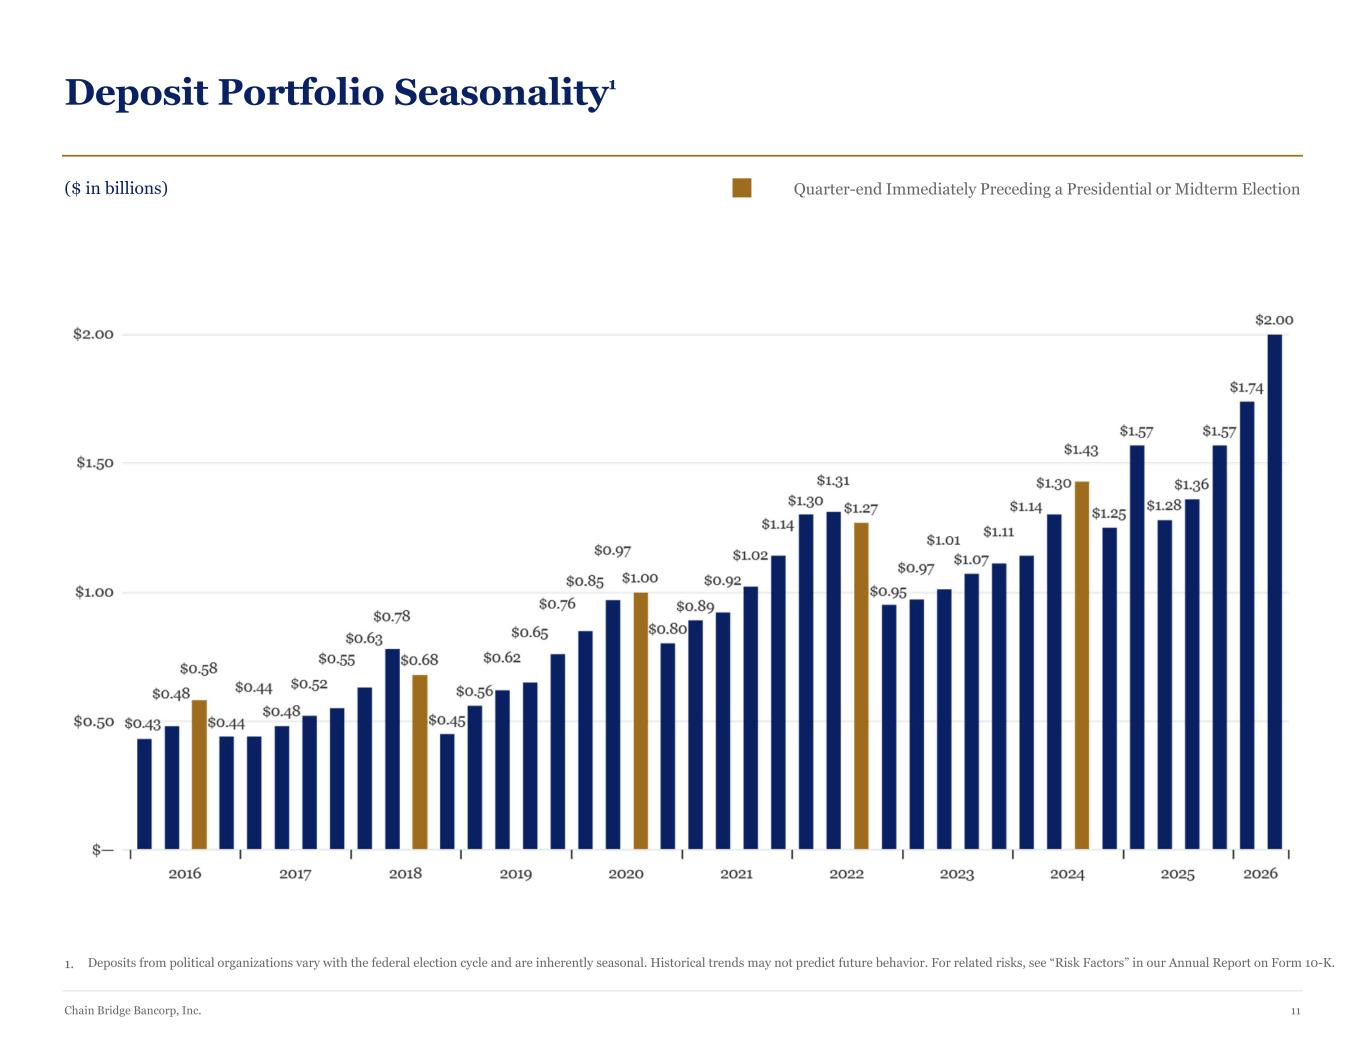
Deposit Portfolio Seasonality1 ($ in billions) Quarter-end Immediately Preceding a Presidential or Midterm Election 1. Deposits from political organizations vary with the federal election cycle and are inherently seasonal. Historical trends may not predict future behavior. For related risks, see “Risk Factors” in our Annual Report on Form 10-K. Chain Bridge Bancorp, Inc. 11
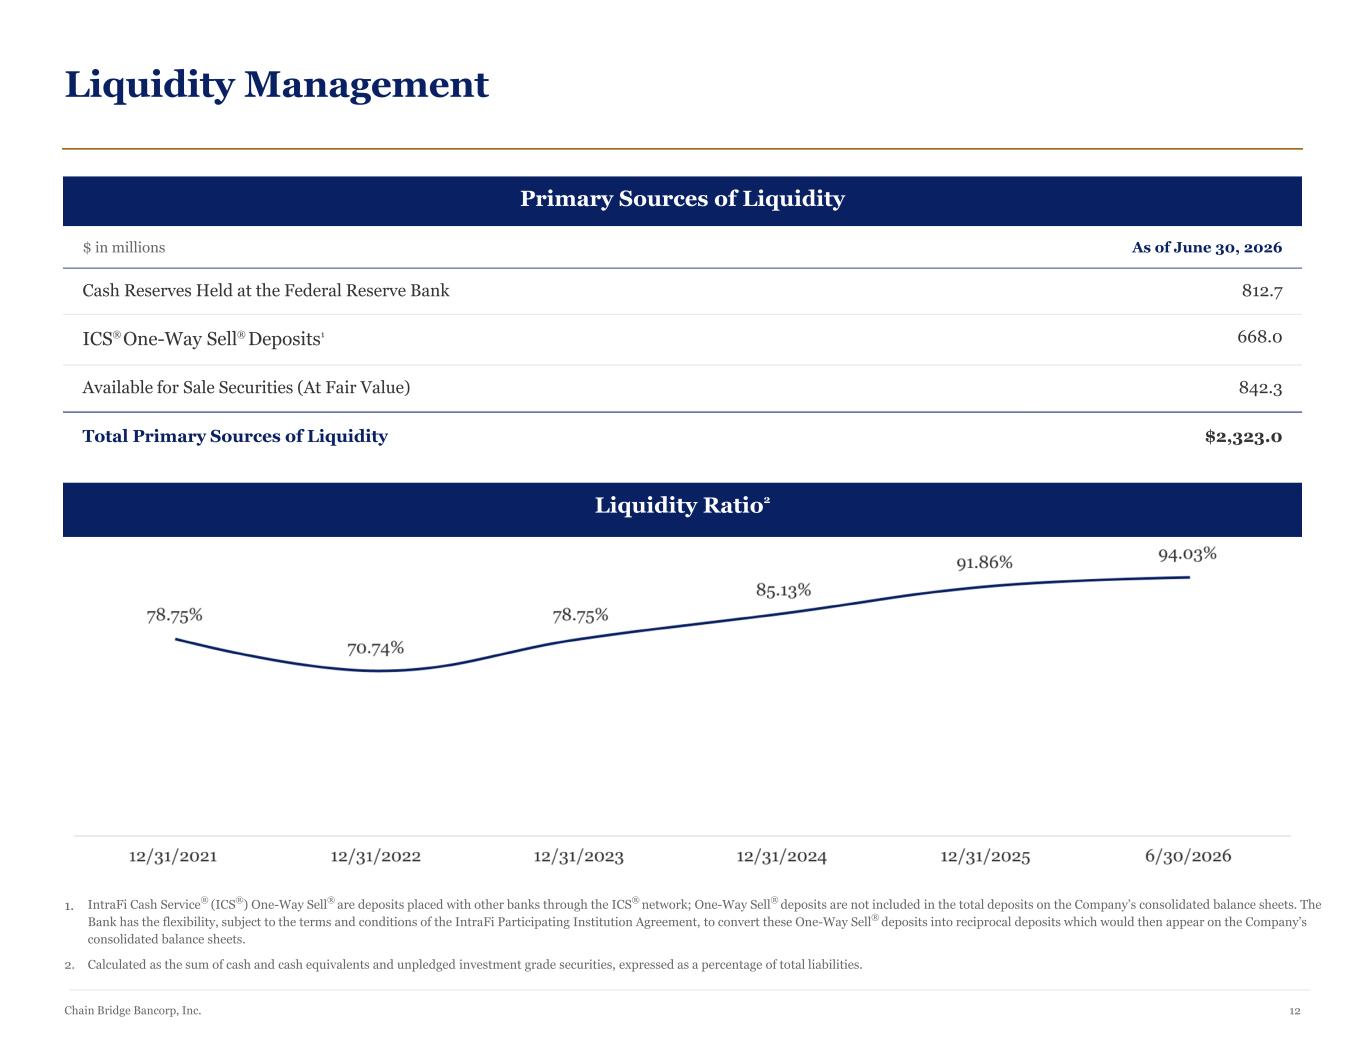
Liquidity Management Primary Sources of Liquidity $ in millions As of June 30, 2026 Cash Reserves Held at the Federal Reserve Bank 812.7 ICS® One-Way Sell® Deposits1 668.0 Available for Sale Securities (At Fair Value) 842.3 Total Primary Sources of Liquidity $2,323.0 Liquidity Ratio2 1. IntraFi Cash Service® (ICS®) One-Way Sell® are deposits placed with other banks through the ICS® network; One-Way Sell® deposits are not included in the total deposits on the Company’s consolidated balance sheets. The Bank has the flexibility, subject to the terms and conditions of the IntraFi Participating Institution Agreement, to convert these One-Way Sell® deposits into reciprocal deposits which would then appear on the Company’s consolidated balance sheets. 2. Calculated as the sum of cash and cash equivalents and unpledged investment grade securities, expressed as a percentage of total liabilities. Chain Bridge Bancorp, Inc. 12
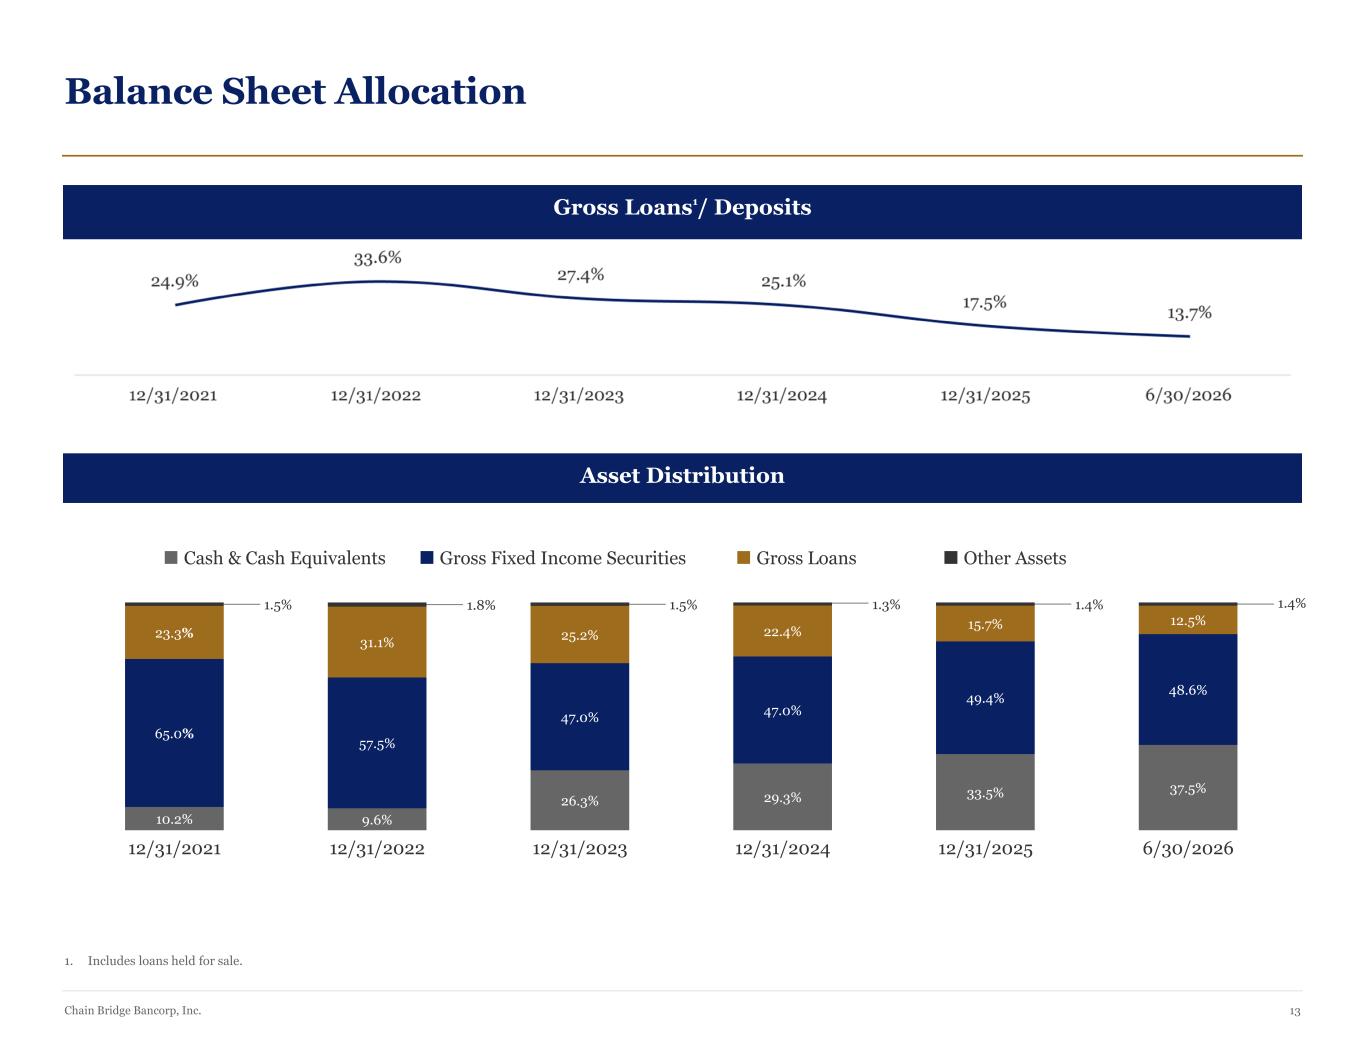
Balance Sheet Allocation Gross Loans1/ Deposits Asset Distribution 10.2% 65.0% 23.3% 1.5% 12/31/2021 9.6% 57.5% 31.1% 1.8% 12/31/2022 26.3% 47.0% 25.2% 1.5% 12/31/2023 29.3% 47.0% 22.4% 1.3% 12/31/2024 33.5% 49.4% 15.7% 1.4% 12/31/2025 37.5% 48.6% 12.5% 1.4% 6/30/2026 Cash & Cash Equivalents Gross Fixed Income Securities Gross Loans Other Assets 1. Includes loans held for sale. Chain Bridge Bancorp, Inc. 13
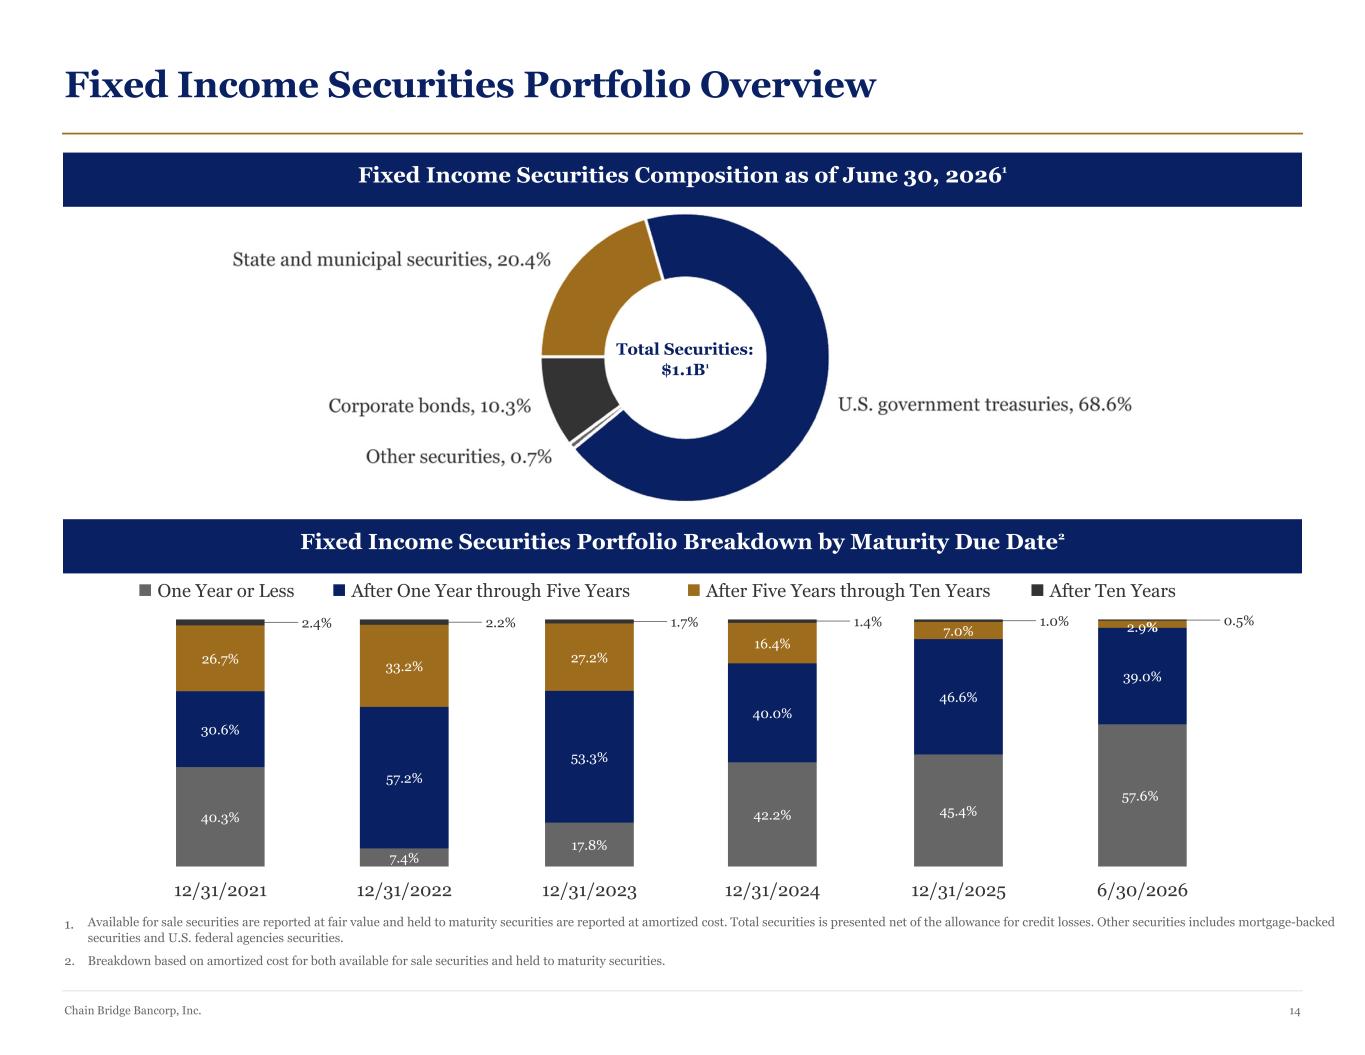
Fixed Income Securities Portfolio Overview Fixed Income Securities Composition as of June 30, 20261 Total Securities: $1.1B1 Fixed Income Securities Portfolio Breakdown by Maturity Due Date2 40.3% 30.6% 26.7% 2.4% 12/31/2021 7.4% 57.2% 33.2% 2.2% 12/31/2022 17.8% 53.3% 27.2% 1.7% 12/31/2023 42.2% 40.0% 16.4% 1.4% 12/31/2024 45.4% 46.6% 7.0% 1.0% 12/31/2025 57.6% 39.0% 2.9% 0.5% 6/30/2026 One Year or Less After One Year through Five Years After Five Years through Ten Years After Ten Years 1. Available for sale securities are reported at fair value and held to maturity securities are reported at amortized cost. Total securities is presented net of the allowance for credit losses. Other securities includes mortgage-backed securities and U.S. federal agencies securities. 2. Breakdown based on amortized cost for both available for sale securities and held to maturity securities. Chain Bridge Bancorp, Inc. 14
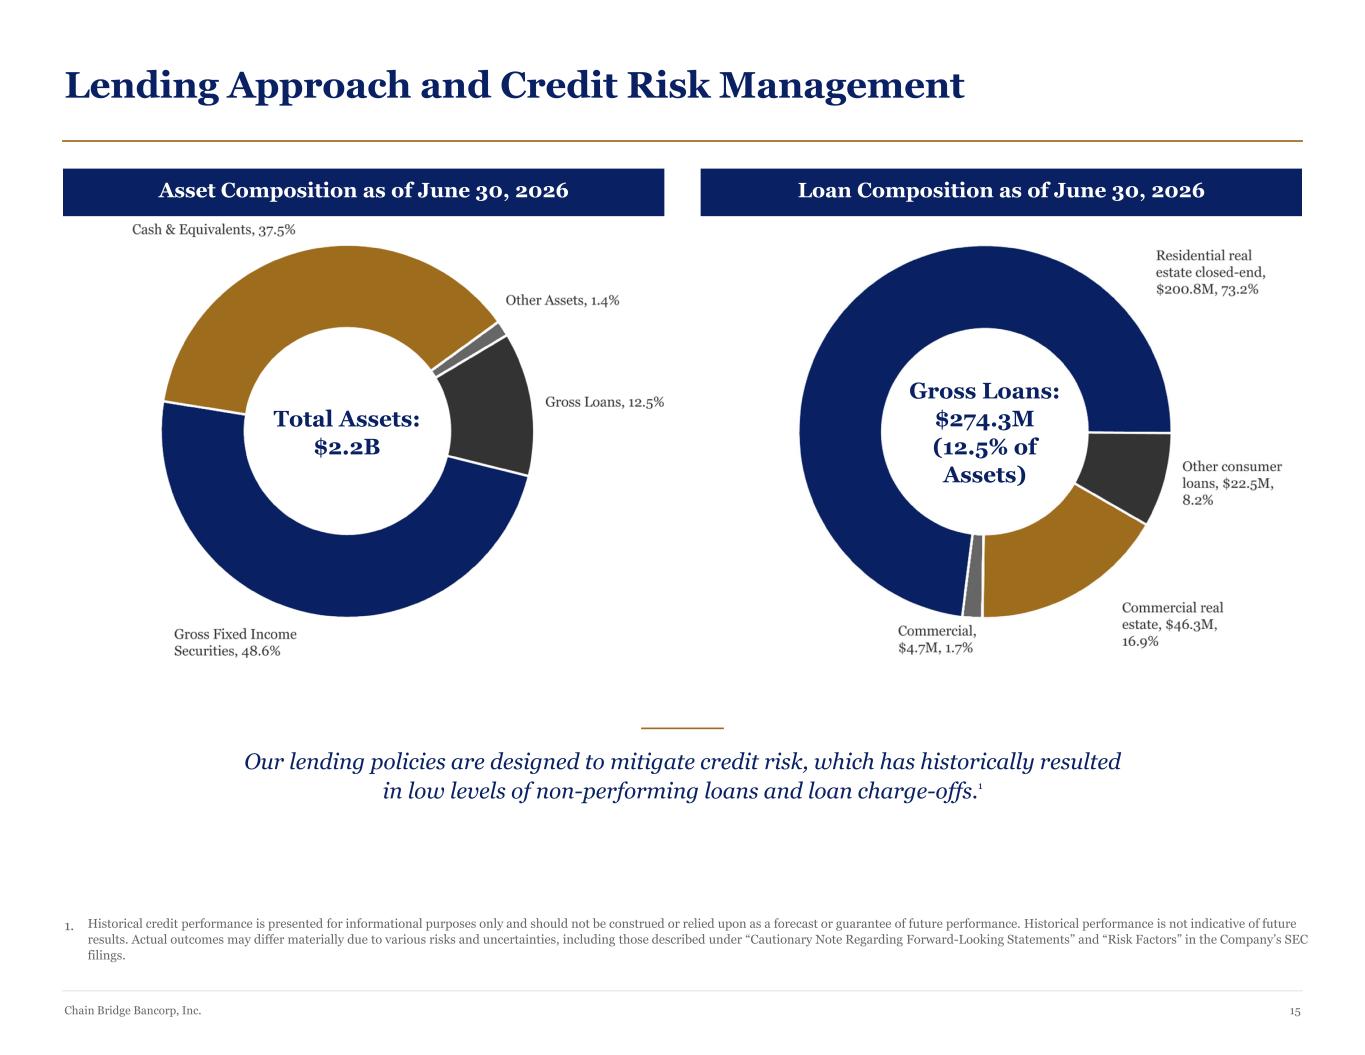
Lending Approach and Credit Risk Management Asset Composition as of June 30, 2026 Total Assets: $2.2B Loan Composition as of June 30, 2026 Gross Loans: $274.3M (12.5% of Assets) Our lending policies are designed to mitigate credit risk, which has historically resulted in low levels of non-performing loans and loan charge-offs.1 1. Historical credit performance is presented for informational purposes only and should not be construed or relied upon as a forecast or guarantee of future performance. Historical performance is not indicative of future results. Actual outcomes may differ materially due to various risks and uncertainties, including those described under “Cautionary Note Regarding Forward-Looking Statements” and “Risk Factors” in the Company’s SEC filings. Chain Bridge Bancorp, Inc. 15
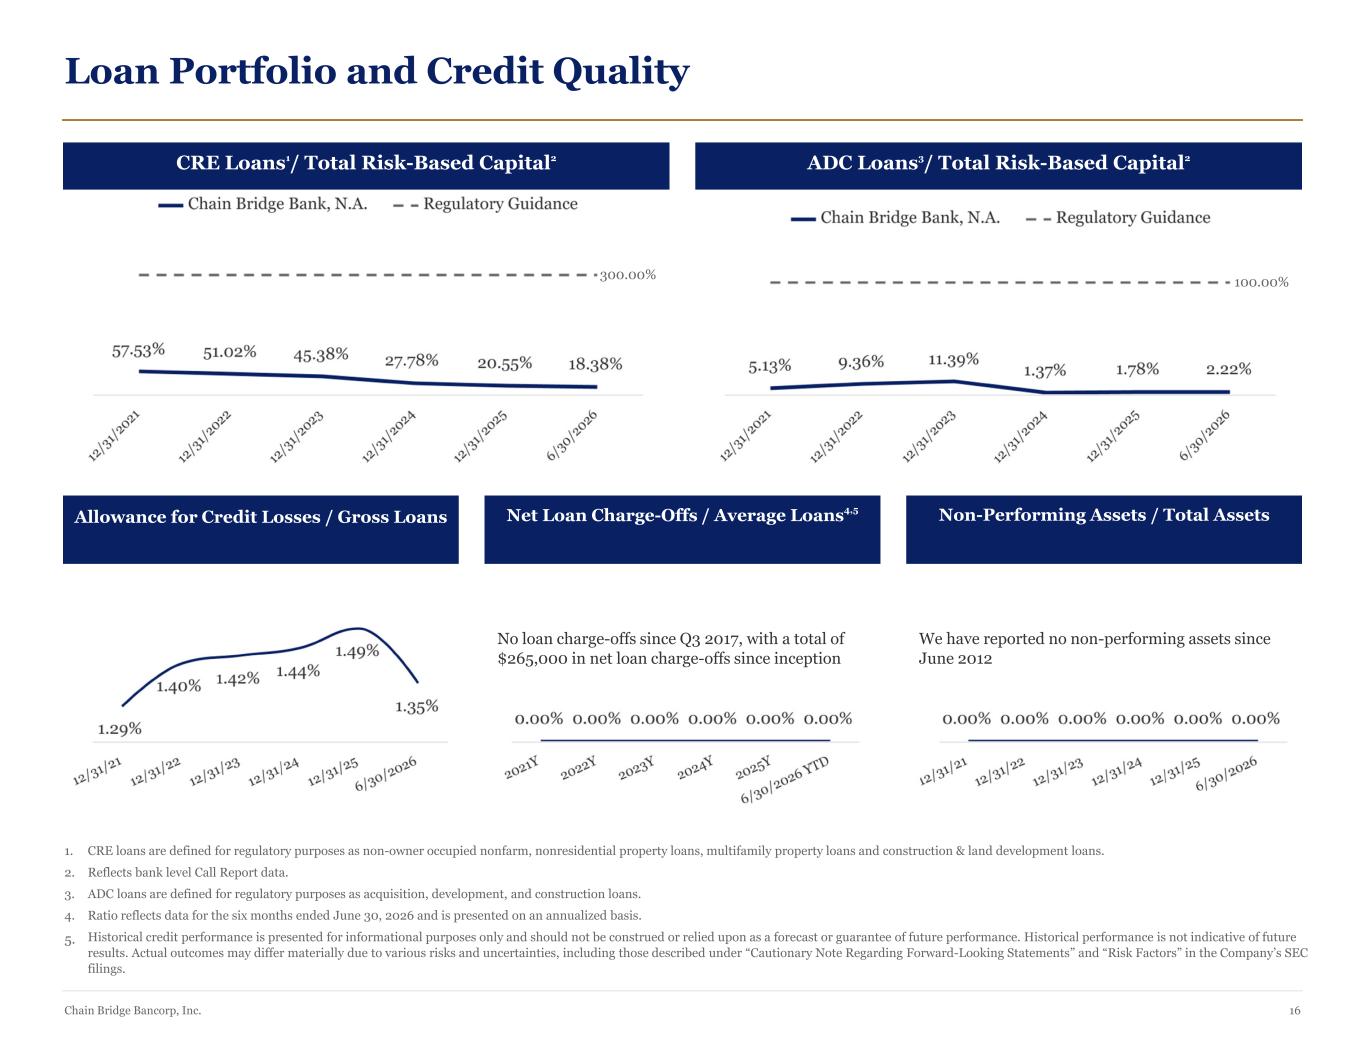
Loan Portfolio and Credit Quality CRE Loans1/ Total Risk-Based Capital2 300.00% ADC Loans3/ Total Risk-Based Capital2 100.00% Allowance for Credit Losses / Gross Loans Net Loan Charge-Offs / Average Loans4,5 No loan charge-offs since Q3 2017, with a total of $265,000 in net loan charge-offs since inception Non-Performing Assets / Total Assets We have reported no non-performing assets since June 2012 1. CRE loans are defined for regulatory purposes as non-owner occupied nonfarm, nonresidential property loans, multifamily property loans and construction & land development loans. 2. Reflects bank level Call Report data. 3. ADC loans are defined for regulatory purposes as acquisition, development, and construction loans. 4. Ratio reflects data for the six months ended June 30, 2026 and is presented on an annualized basis. 5. Historical credit performance is presented for informational purposes only and should not be construed or relied upon as a forecast or guarantee of future performance. Historical performance is not indicative of future results. Actual outcomes may differ materially due to various risks and uncertainties, including those described under “Cautionary Note Regarding Forward-Looking Statements” and “Risk Factors” in the Company’s SEC filings. Chain Bridge Bancorp, Inc. 16
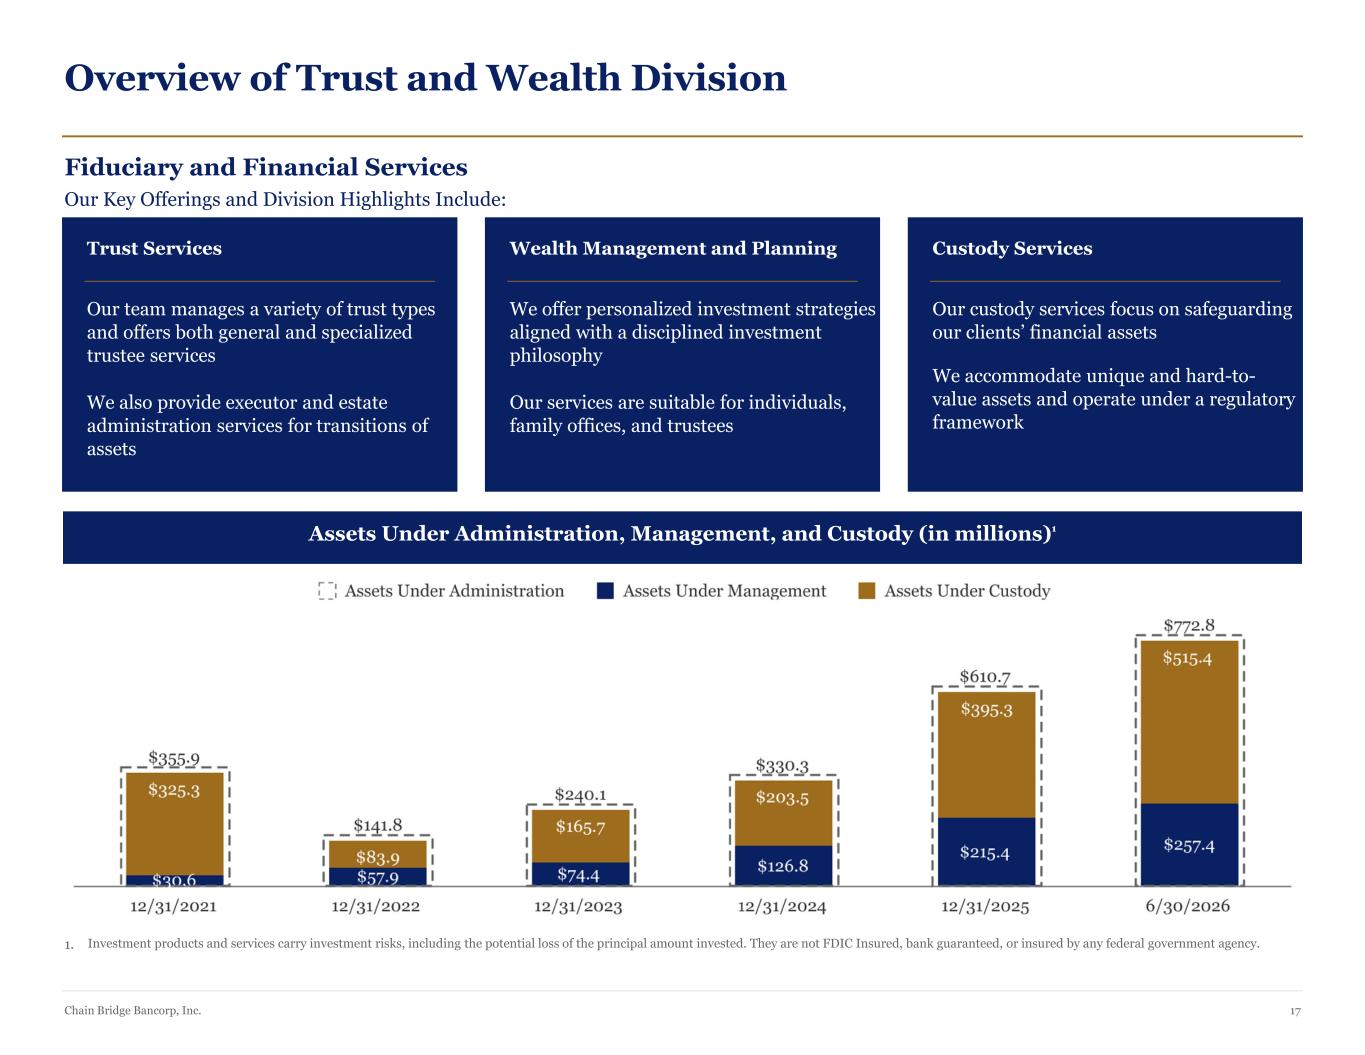
Overview of Trust and Wealth Division Fiduciary and Financial Services Our Key Offerings and Division Highlights Include: Trust Services Our team manages a variety of trust types and offers both general and specialized trustee services We also provide executor and estate administration services for transitions of assets Wealth Management and Planning We offer personalized investment strategies aligned with a disciplined investment philosophy Our services are suitable for individuals, family offices, and trustees Custody Services Our custody services focus on safeguarding our clients’ financial assets We accommodate unique and hard-to- value assets and operate under a regulatory framework Assets Under Administration, Management, and Custody (in millions)1 1. Investment products and services carry investment risks, including the potential loss of the principal amount invested. They are not FDIC Insured, bank guaranteed, or insured by any federal government agency. Chain Bridge Bancorp, Inc. 17
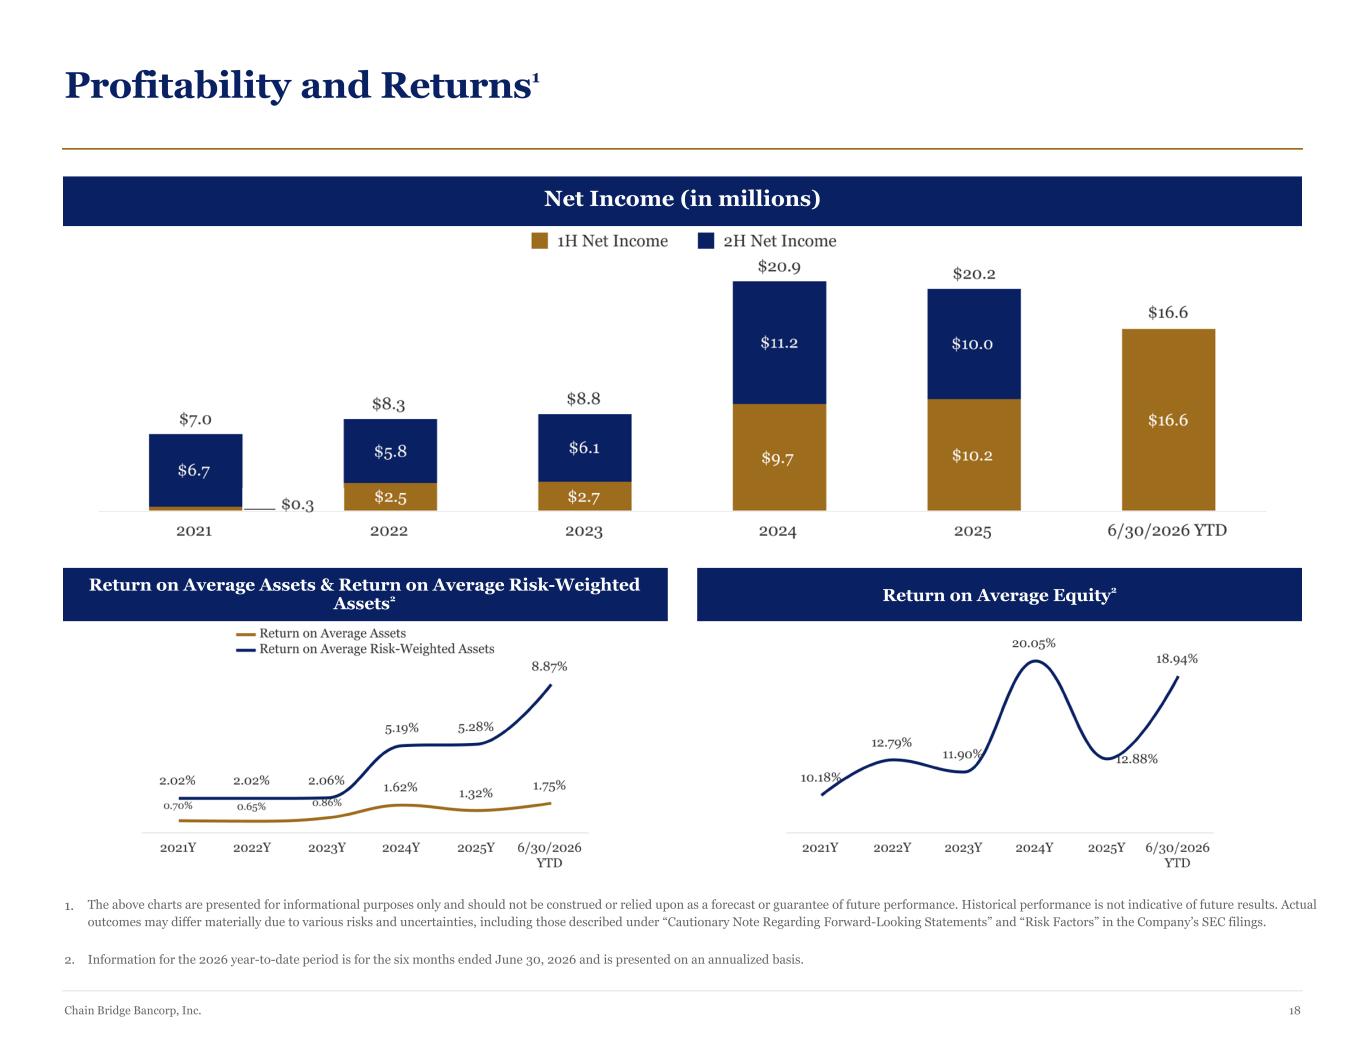
Profitability and Returns1 Net Income (in millions) Return on Average Assets & Return on Average Risk-Weighted Assets2 Return on Average Equity2 1. The above charts are presented for informational purposes only and should not be construed or relied upon as a forecast or guarantee of future performance. Historical performance is not indicative of future results. Actual outcomes may differ materially due to various risks and uncertainties, including those described under “Cautionary Note Regarding Forward-Looking Statements” and “Risk Factors” in the Company’s SEC filings. 2. Information for the 2026 year-to-date period is for the six months ended June 30, 2026 and is presented on an annualized basis. Chain Bridge Bancorp, Inc. 18
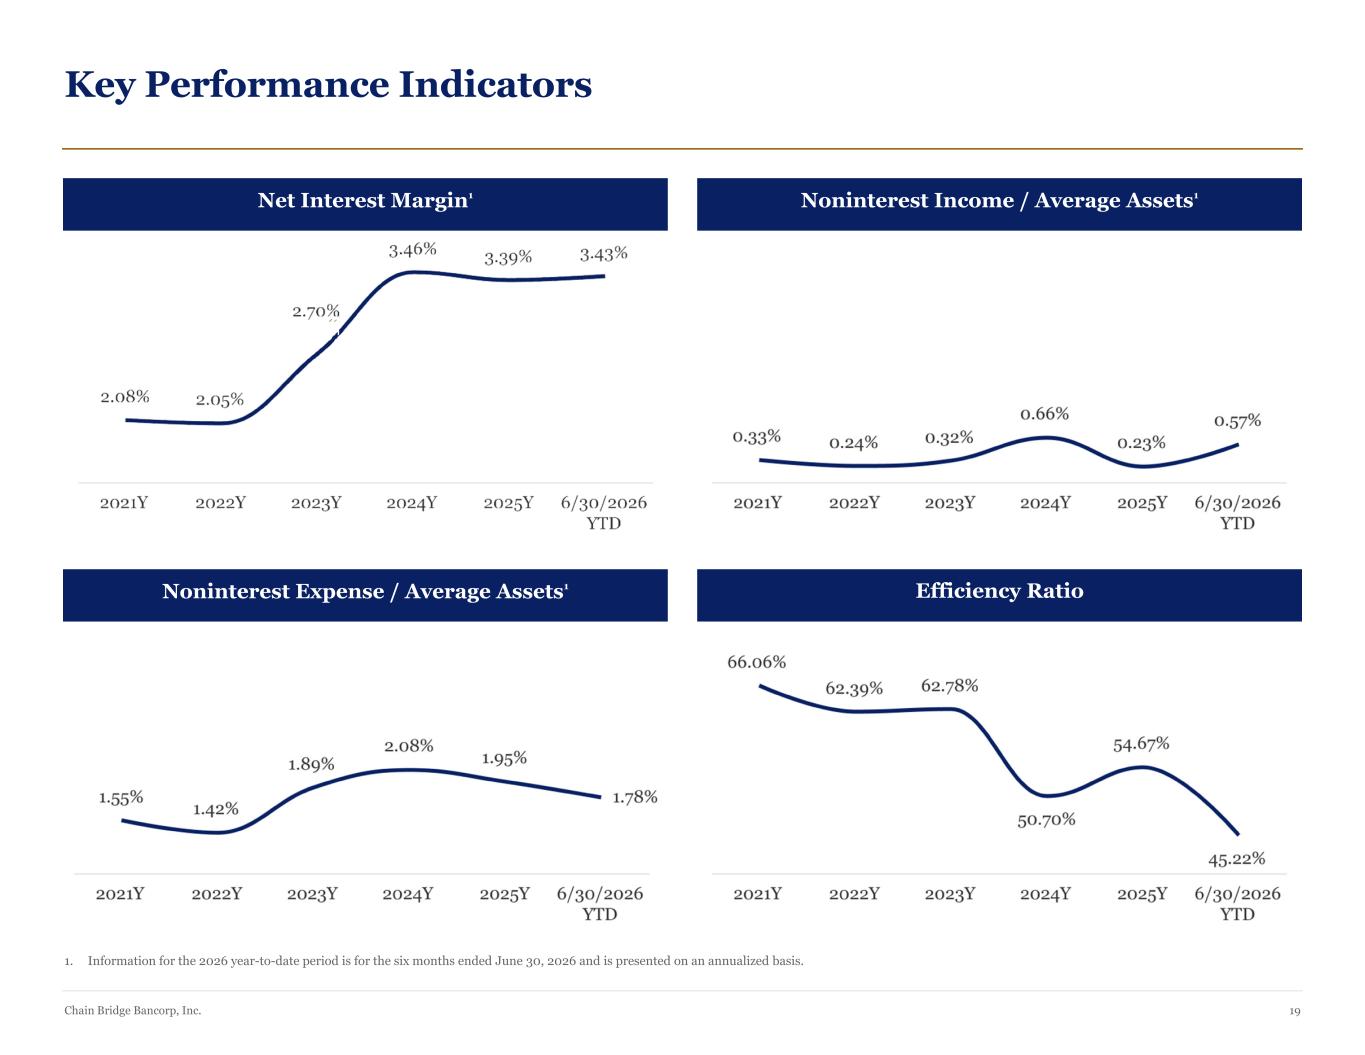
Key Performance Indicators Net Interest Margin1 Noninterest Income / Average Assets1 Noninterest Expense / Average Assets1 Efficiency Ratio 1. Information for the 2026 year-to-date period is for the six months ended June 30, 2026 and is presented on an annualized basis. Chain Bridge Bancorp, Inc. 19
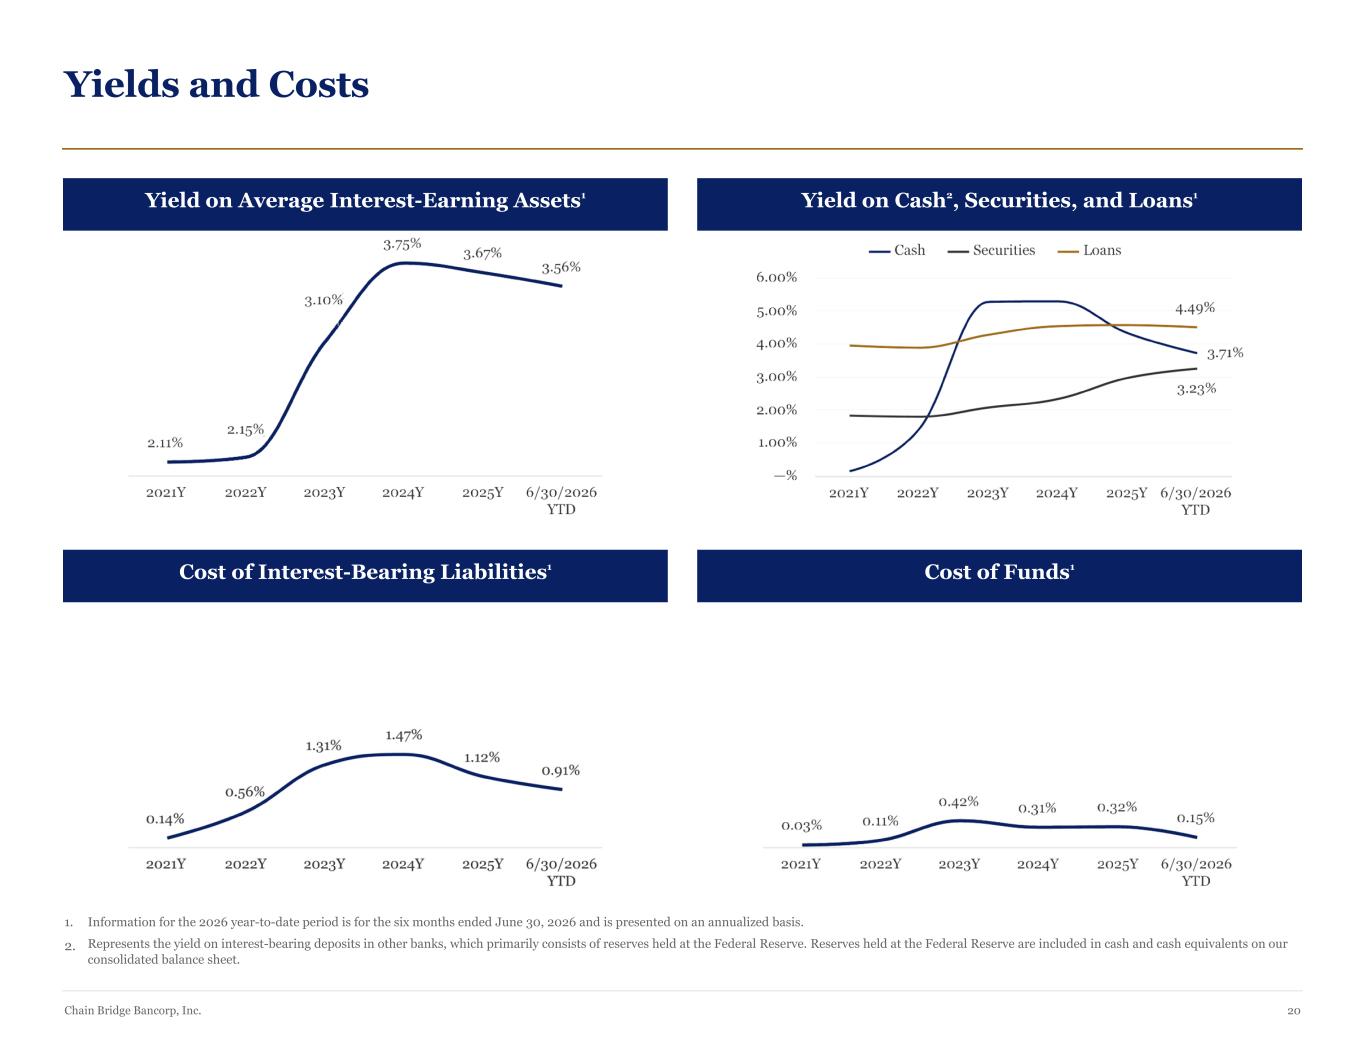
Yields and Costs Yield on Average Interest-Earning Assets1 Yield on Cash2, Securities, and Loans1 Cost of Interest-Bearing Liabilities1 Cost of Funds1 1. Information for the 2026 year-to-date period is for the six months ended June 30, 2026 and is presented on an annualized basis. 2. Represents the yield on interest-bearing deposits in other banks, which primarily consists of reserves held at the Federal Reserve. Reserves held at the Federal Reserve are included in cash and cash equivalents on our consolidated balance sheet. Chain Bridge Bancorp, Inc. 20
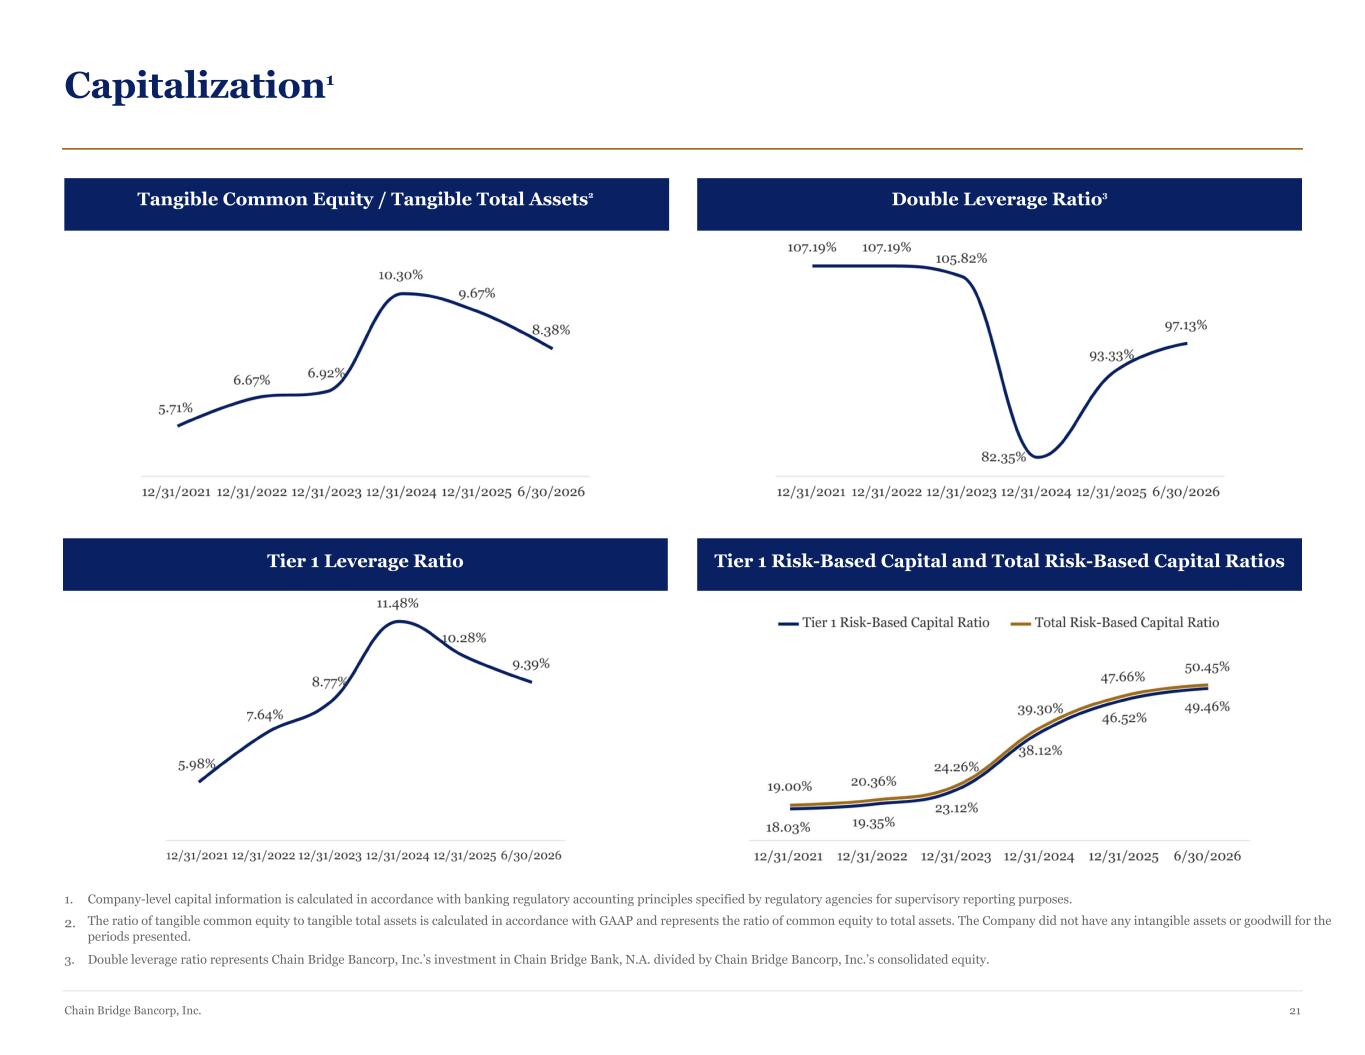
Capitalization1 Tangible Common Equity / Tangible Total Assets2 Double Leverage Ratio3 Tier 1 Leverage Ratio Tier 1 Risk-Based Capital and Total Risk-Based Capital Ratios 1. Company-level capital information is calculated in accordance with banking regulatory accounting principles specified by regulatory agencies for supervisory reporting purposes. 2. The ratio of tangible common equity to tangible total assets is calculated in accordance with GAAP and represents the ratio of common equity to total assets. The Company did not have any intangible assets or goodwill for the periods presented. 3. Double leverage ratio represents Chain Bridge Bancorp, Inc.’s investment in Chain Bridge Bank, N.A. divided by Chain Bridge Bancorp, Inc.’s consolidated equity. Chain Bridge Bancorp, Inc. 21
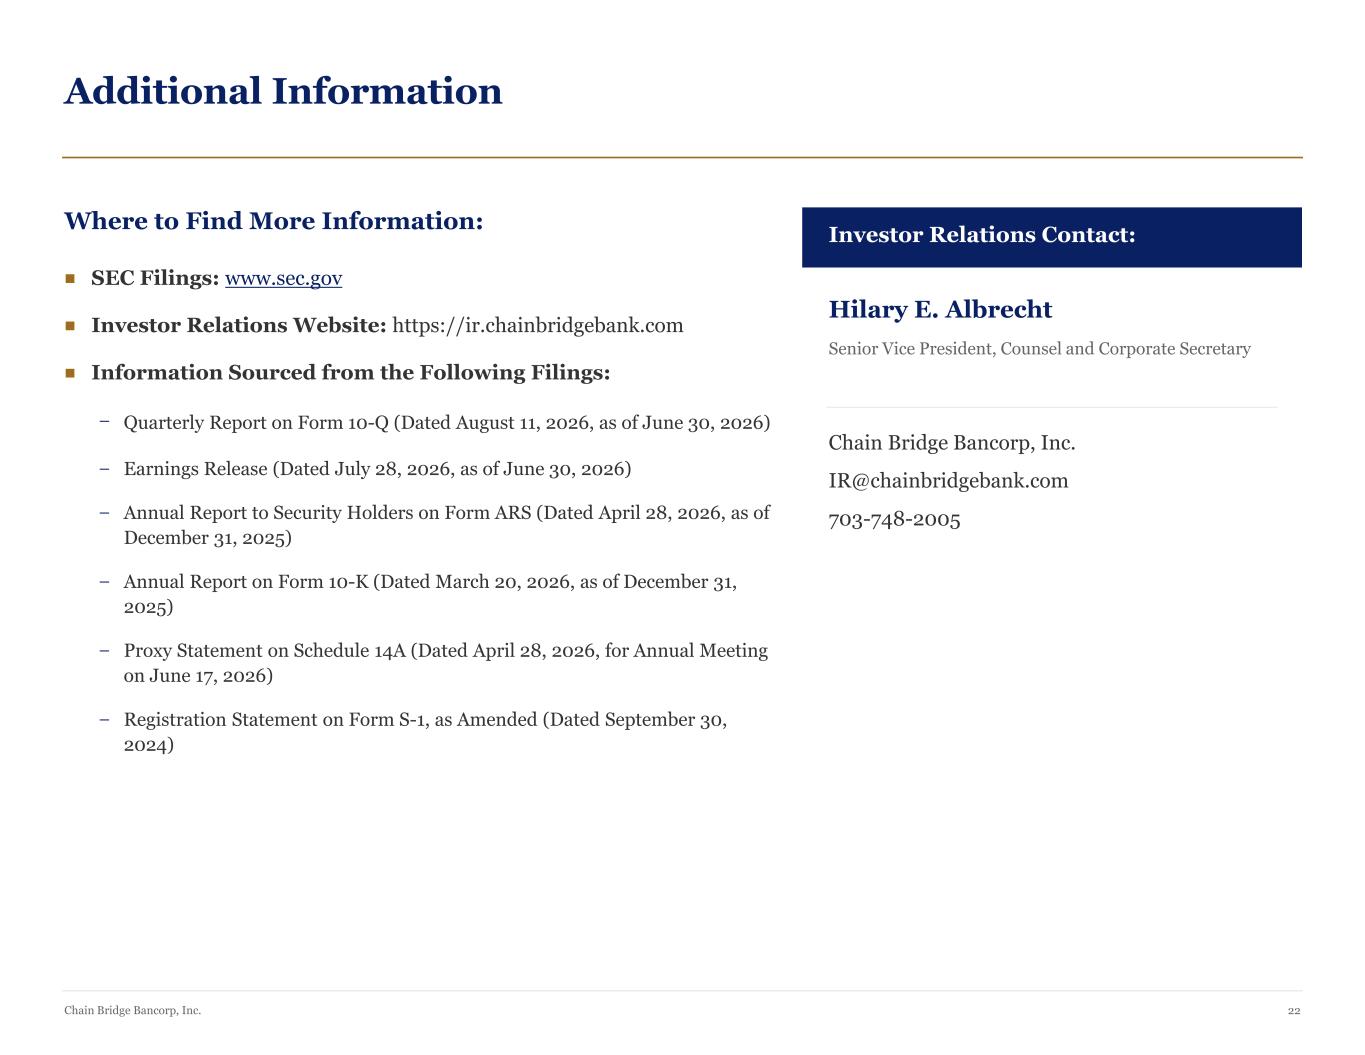
Additional Information Where to Find More Information: ■ SEC Filings: www.sec.gov ■ Investor Relations Website: https://ir.chainbridgebank.com ■ Information Sourced from the Following Filings: – Quarterly Report on Form 10-Q (Dated August 11, 2026, as of June 30, 2026) – Earnings Release (Dated July 28, 2026, as of June 30, 2026) – Annual Report to Security Holders on Form ARS (Dated April 28, 2026, as of December 31, 2025) – Annual Report on Form 10-K (Dated March 20, 2026, as of December 31, 2025) – Proxy Statement on Schedule 14A (Dated April 28, 2026, for Annual Meeting on June 17, 2026) – Registration Statement on Form S-1, as Amended (Dated September 30, 2024) Investor Relations Contact: Hilary E. Albrecht Senior Vice President, Counsel and Corporate Secretary Chain Bridge Bancorp, Inc. IR@chainbridgebank.com 703-748-2005 Chain Bridge Bancorp, Inc. 22

Appendix
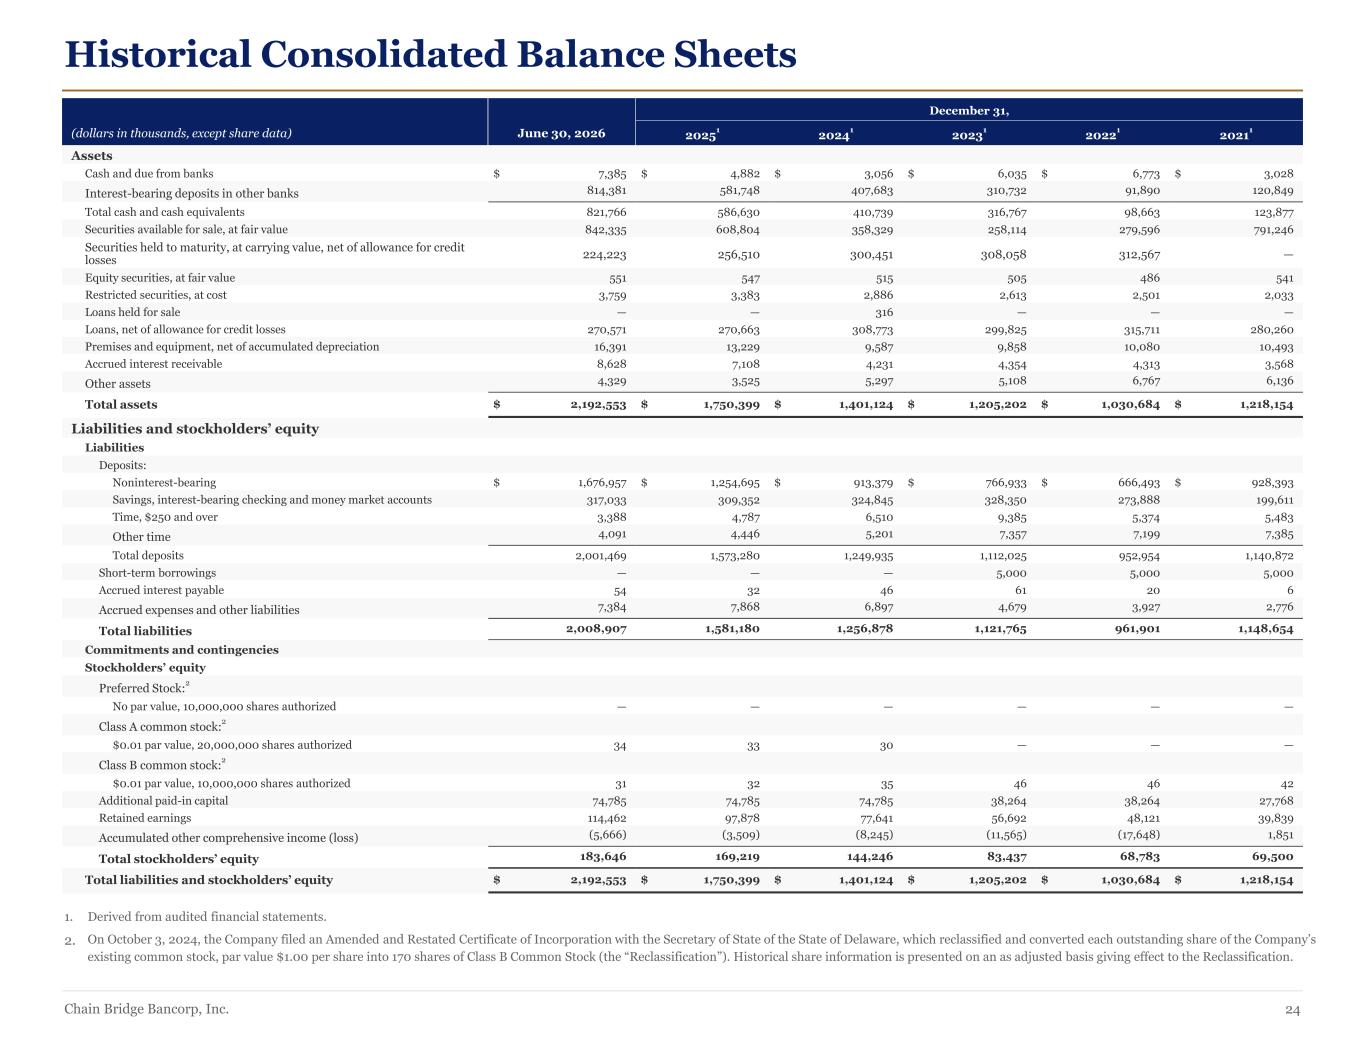
Historical Consolidated Balance Sheets (dollars in thousands, except share data) June 30, 2026 December 31, 20251 20241 20231 20221 20211 Assets Cash and due from banks $ 7,385 $ 4,882 $ 3,056 $ 6,035 $ 6,773 $ 3,028 Interest-bearing deposits in other banks 814,381 581,748 407,683 310,732 91,890 120,849 Total cash and cash equivalents 821,766 586,630 410,739 316,767 98,663 123,877 Securities available for sale, at fair value 842,335 608,804 358,329 258,114 279,596 791,246 Securities held to maturity, at carrying value, net of allowance for credit losses 224,223 256,510 300,451 308,058 312,567 — Equity securities, at fair value 551 547 515 505 486 541 Restricted securities, at cost 3,759 3,383 2,886 2,613 2,501 2,033 Loans held for sale — — 316 — — — Loans, net of allowance for credit losses 270,571 270,663 308,773 299,825 315,711 280,260 Premises and equipment, net of accumulated depreciation 16,391 13,229 9,587 9,858 10,080 10,493 Accrued interest receivable 8,628 7,108 4,231 4,354 4,313 3,568 Other assets 4,329 3,525 5,297 5,108 6,767 6,136 Total assets $ 2,192,553 $ 1,750,399 $ 1,401,124 $ 1,205,202 $ 1,030,684 $ 1,218,154 Liabilities and stockholders’ equity Liabilities Deposits: Noninterest-bearing $ 1,676,957 $ 1,254,695 $ 913,379 $ 766,933 $ 666,493 $ 928,393 Savings, interest-bearing checking and money market accounts 317,033 309,352 324,845 328,350 273,888 199,611 Time, $250 and over 3,388 4,787 6,510 9,385 5,374 5,483 Other time 4,091 4,446 5,201 7,357 7,199 7,385 Total deposits 2,001,469 1,573,280 1,249,935 1,112,025 952,954 1,140,872 Short-term borrowings — — — 5,000 5,000 5,000 Accrued interest payable 54 32 46 61 20 6 Accrued expenses and other liabilities 7,384 7,868 6,897 4,679 3,927 2,776 Total liabilities 2,008,907 1,581,180 1,256,878 1,121,765 961,901 1,148,654 Commitments and contingencies Stockholders’ equity Preferred Stock:2 No par value, 10,000,000 shares authorized — — — — — — Class A common stock:2 $0.01 par value, 20,000,000 shares authorized 34 33 30 — — — Class B common stock:2 $0.01 par value, 10,000,000 shares authorized 31 32 35 46 46 42 Additional paid-in capital 74,785 74,785 74,785 38,264 38,264 27,768 Retained earnings 114,462 97,878 77,641 56,692 48,121 39,839 Accumulated other comprehensive income (loss) (5,666) (3,509) (8,245) (11,565) (17,648) 1,851 Total stockholders’ equity 183,646 169,219 144,246 83,437 68,783 69,500 Total liabilities and stockholders’ equity $ 2,192,553 $ 1,750,399 $ 1,401,124 $ 1,205,202 $ 1,030,684 $ 1,218,154 1. Derived from audited financial statements. 2. On October 3, 2024, the Company filed an Amended and Restated Certificate of Incorporation with the Secretary of State of the State of Delaware, which reclassified and converted each outstanding share of the Company’s existing common stock, par value $1.00 per share into 170 shares of Class B Common Stock (the “Reclassification”). Historical share information is presented on an as adjusted basis giving effect to the Reclassification. Chain Bridge Bancorp, Inc. 24
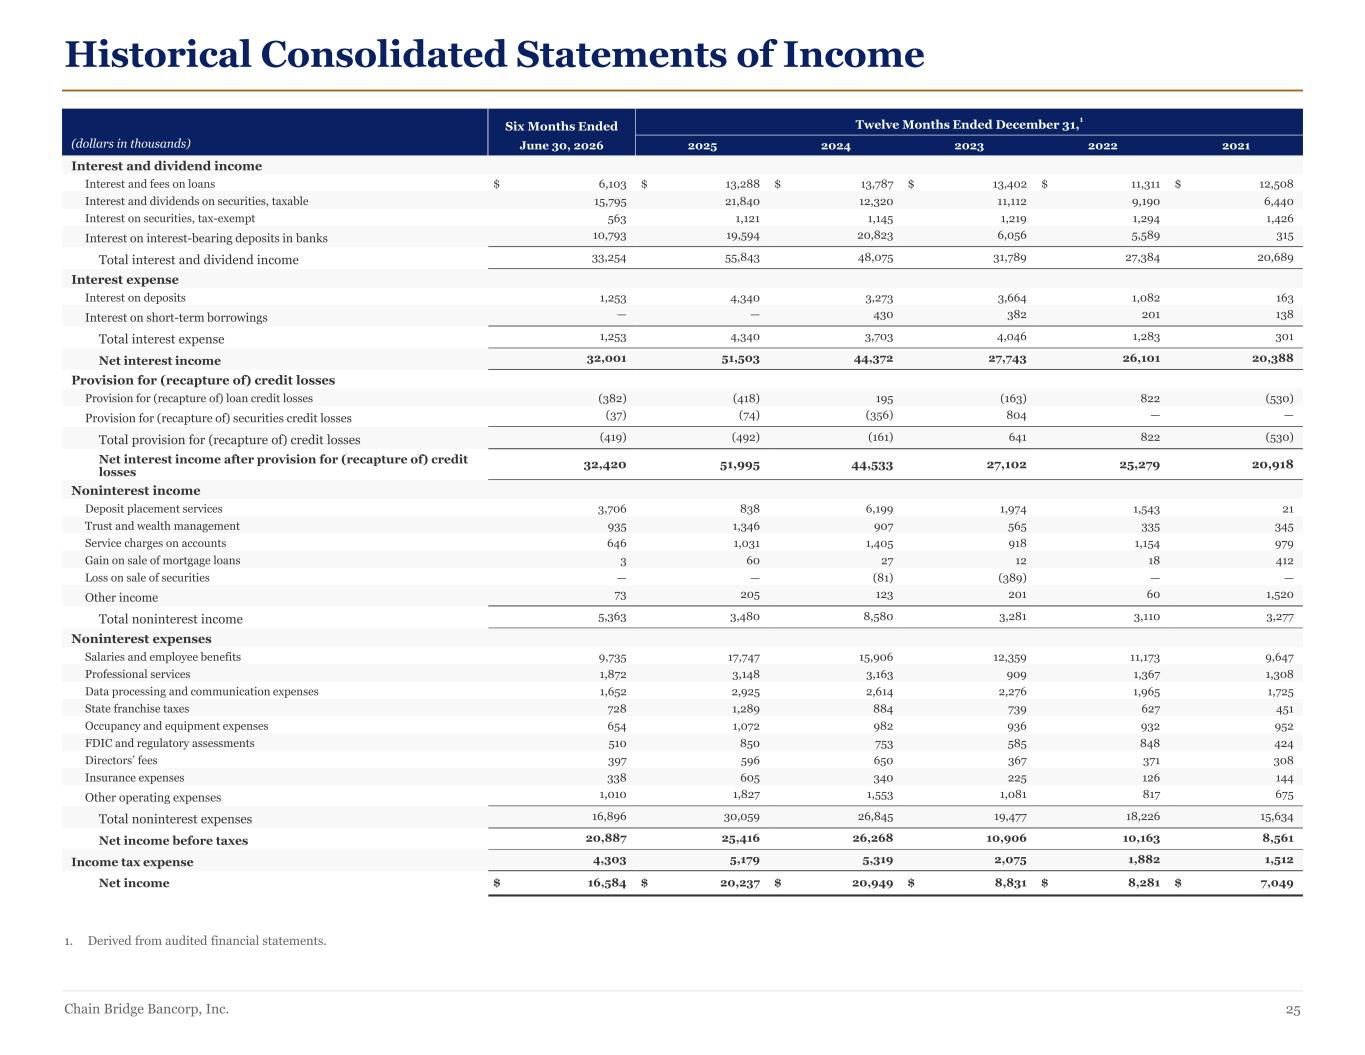
Historical Consolidated Statements of Income (dollars in thousands) Six Months Ended Twelve Months Ended December 31,1 June 30, 2026 2025 2024 2023 2022 2021 Interest and dividend income Interest and fees on loans $ 6,103 $ 13,288 $ 13,787 $ 13,402 $ 11,311 $ 12,508 Interest and dividends on securities, taxable 15,795 21,840 12,320 11,112 9,190 6,440 Interest on securities, tax-exempt 563 1,121 1,145 1,219 1,294 1,426 Interest on interest-bearing deposits in banks 10,793 19,594 20,823 6,056 5,589 315 Total interest and dividend income 33,254 55,843 48,075 31,789 27,384 20,689 Interest expense Interest on deposits 1,253 4,340 3,273 3,664 1,082 163 Interest on short-term borrowings — — 430 382 201 138 Total interest expense 1,253 4,340 3,703 4,046 1,283 301 Net interest income 32,001 51,503 44,372 27,743 26,101 20,388 Provision for (recapture of) credit losses Provision for (recapture of) loan credit losses (382) (418) 195 (163) 822 (530) Provision for (recapture of) securities credit losses (37) (74) (356) 804 — — Total provision for (recapture of) credit losses (419) (492) (161) 641 822 (530) Net interest income after provision for (recapture of) credit losses 32,420 51,995 44,533 27,102 25,279 20,918 Noninterest income Deposit placement services 3,706 838 6,199 1,974 1,543 21 Trust and wealth management 935 1,346 907 565 335 345 Service charges on accounts 646 1,031 1,405 918 1,154 979 Gain on sale of mortgage loans 3 60 27 12 18 412 Loss on sale of securities — — (81) (389) — — Other income 73 205 123 201 60 1,520 Total noninterest income 5,363 3,480 8,580 3,281 3,110 3,277 Noninterest expenses Salaries and employee benefits 9,735 17,747 15,906 12,359 11,173 9,647 Professional services 1,872 3,148 3,163 909 1,367 1,308 Data processing and communication expenses 1,652 2,925 2,614 2,276 1,965 1,725 State franchise taxes 728 1,289 884 739 627 451 Occupancy and equipment expenses 654 1,072 982 936 932 952 FDIC and regulatory assessments 510 850 753 585 848 424 Directors’ fees 397 596 650 367 371 308 Insurance expenses 338 605 340 225 126 144 Other operating expenses 1,010 1,827 1,553 1,081 817 675 Total noninterest expenses 16,896 30,059 26,845 19,477 18,226 15,634 Net income before taxes 20,887 25,416 26,268 10,906 10,163 8,561 Income tax expense 4,303 5,179 5,319 2,075 1,882 1,512 Net income $ 16,584 $ 20,237 $ 20,949 $ 8,831 $ 8,281 $ 7,049 1. Derived from audited financial statements. Chain Bridge Bancorp, Inc. 25

Chain Bridge Bancorp, Inc. | NYSE: CBNA | ir.chainbridgebank.com