1Investor Presentation August 2026 COMPOUNDING LONG-TERM VALUE IN NATURAL RESOURCES August 2026
2Investor Presentation August 2026 Forward Looking Information Disclosures This presentation includes forward-looking statements subject to important risks and uncertainties. It may also contain financial measures that are not in conformance with accounting principles generally accepted in the United States of America (GAAP). The forward-looking statements included are within the meaning of Section 27A of the Securities Act of 1933, as amended, and Section 21E of the Securities Exchange Act of 1934, as amended. Any and all statements regarding the Company’s expected future financial position, results of operations, cash flows, business strategy, projected costs, capital expenditures, services, competitive positions, growth opportunities, plans, goals and objectives of management for future operations, as well as statements that include words such as “anticipate,” “if,” “believe,” “plan,” “estimate,” “expect,” “intend,” “may,” “could,” “should,” “will,” and other similar expressions are forward-looking statements. Forward-looking Information noted in the following slides was effective as of August 6, 2026. Such statements are inherently uncertain, and readers must recognize that actual results may differ materially from the expectations of NACCO Industries’ management. The Company does not undertake a duty to update such forward-looking statements. Among the factors that could cause plans, actions and results to differ materially from current expectations are, without limitation: (1) a significant reduction in demand by the Company's customers, (2) weather conditions, extended power plant outages, liquidity events or other events that would change the level of customers' coal or aggregates requirements, (3) changes to or termination of customer or other third-party contracts, or a customer or other third party default under a contract, (4) changes in the prices of hydrocarbons, particularly diesel fuel, natural gas, natural gas liquids and oil as a result of factors such as OPEC and/or government actions, geopolitical developments, economic conditions and regulatory changes, vehicle electrification, as well as supply and demand dynamics, (5) changes in development plans by third-party lessees of the Company's mineral interests, (6) failure or delays by the Company's lessees in achieving expected production of natural gas and other hydrocarbons; the availability and cost of transportation and processing services in the areas where the Company's oil and gas reserves are located; and the ability of lessees to obtain capital or financing needed for well-development operations and leasing and development of oil and gas reserves on federal lands, (7) any customer's premature facility closure or extended project development delay, (8) federal and state legislative and regulatory actions affecting fossil fuels, (9) supply chain disruptions, including price increases and shortages of parts and materials, inclusive of tariff effects, (10) failure to obtain adequate insurance coverages at reasonable rates, (11) changes in tax laws or regulatory requirements, including the elimination of, or reduction in, the percentage depletion tax deduction, changes in mining or power plant emission regulations and health, safety or environmental legislation, (12) impairment charges, (13) changes in costs related to geological and geotechnical conditions, repairs and maintenance, new equipment and replacement parts, fuel or other similar items, (14) equipment problems that could affect deliveries to customers, (15) changes in the costs to reclaim mining areas, (16) costs to pursue and develop new mining, mitigation, oil and gas and power generation development opportunities and other value-added service opportunities, (17) the ability to successfully evaluate investments and achieve intended financial results in new business and growth initiatives, (18) disruptions from natural or human causes, including severe weather, accidents, fires, earthquakes and terrorist acts, any of which could result in suspension of operations or harm to people or the environment, and (19) the ability to attract, retain, and replace workforce and administrative employees.
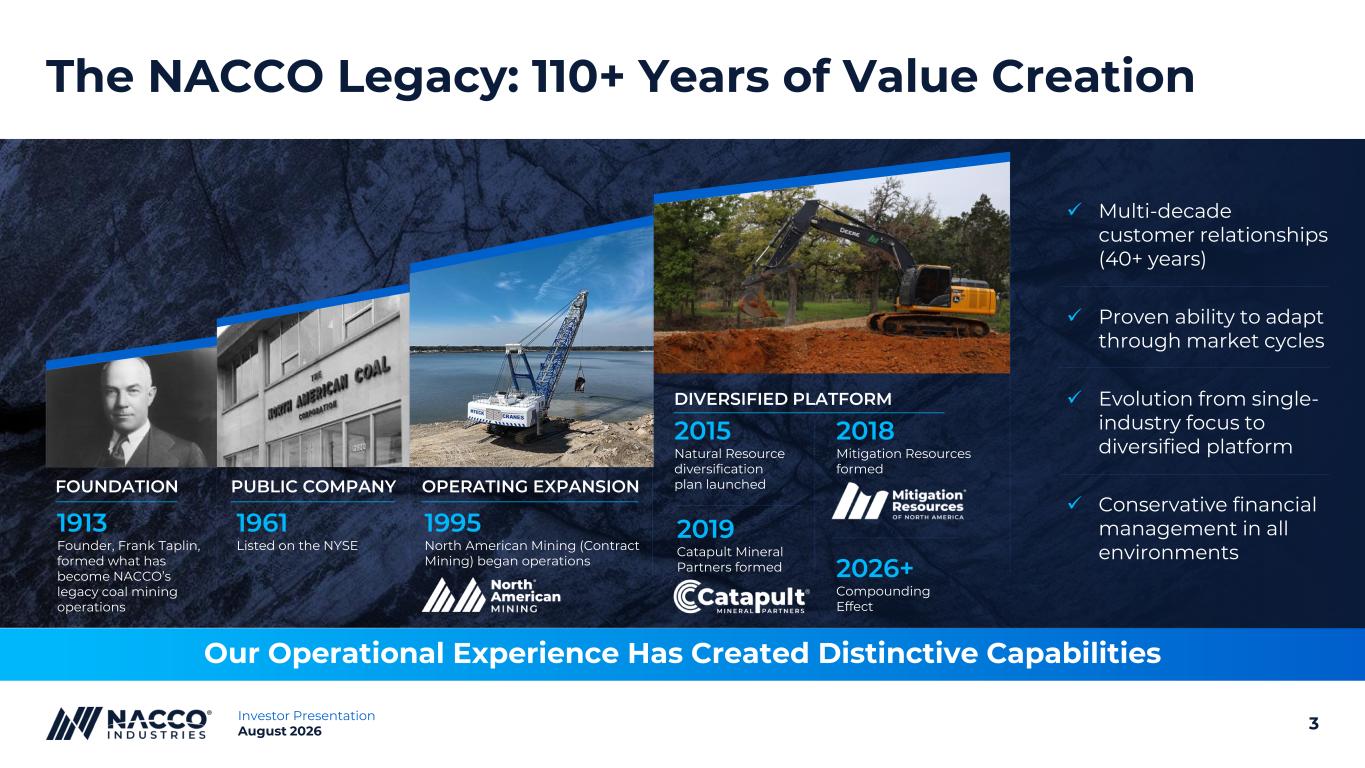
3Investor Presentation August 2026 The NACCO Legacy: 110+ Years of Value Creation Our Operational Experience Has Created Distinctive Capabilities 1961 Listed on the NYSE 1995 North American Mining (Contract Mining) began operations ✓ Multi-decade customer relationships (40+ years) ✓ Proven ability to adapt through market cycles ✓ Evolution from single- industry focus to diversified platform ✓ Conservative financial management in all environments 1913 Founder, Frank Taplin, formed what has become NACCO’s legacy coal mining operations 2015 Natural Resource diversification plan launched 2019 Catapult Mineral Partners formed 2018 Mitigation Resources formed 2026+ Compounding Effect FOUNDATION PUBLIC COMPANY OPERATING EXPANSION DIVERSIFIED PLATFORM Mitigation Resources ®
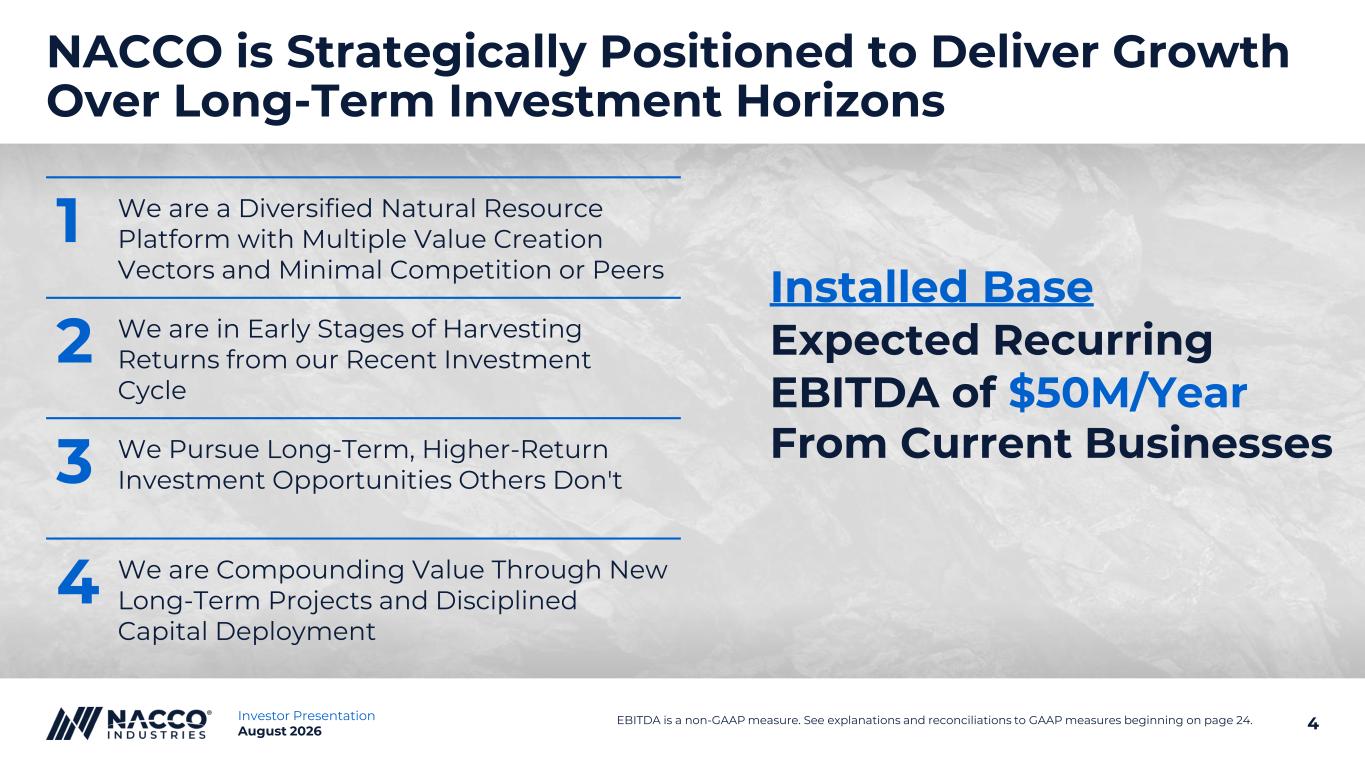
4Investor Presentation August 2026 NACCO is Strategically Positioned to Deliver Growth Over Long-Term Investment Horizons Installed Base Expected Recurring EBITDA of $50M/Year From Current Businesses 1 We are a Diversified Natural Resource Platform with Multiple Value Creation Vectors and Minimal Competition or Peers 2 We are in Early Stages of Harvesting Returns from our Recent Investment Cycle 3 We Pursue Long-Term, Higher-Return Investment Opportunities Others Don't 4 We are Compounding Value Through New Long-Term Projects and Disciplined Capital Deployment EBITDA is a non-GAAP measure. See explanations and reconciliations to GAAP measures beginning on page 24.
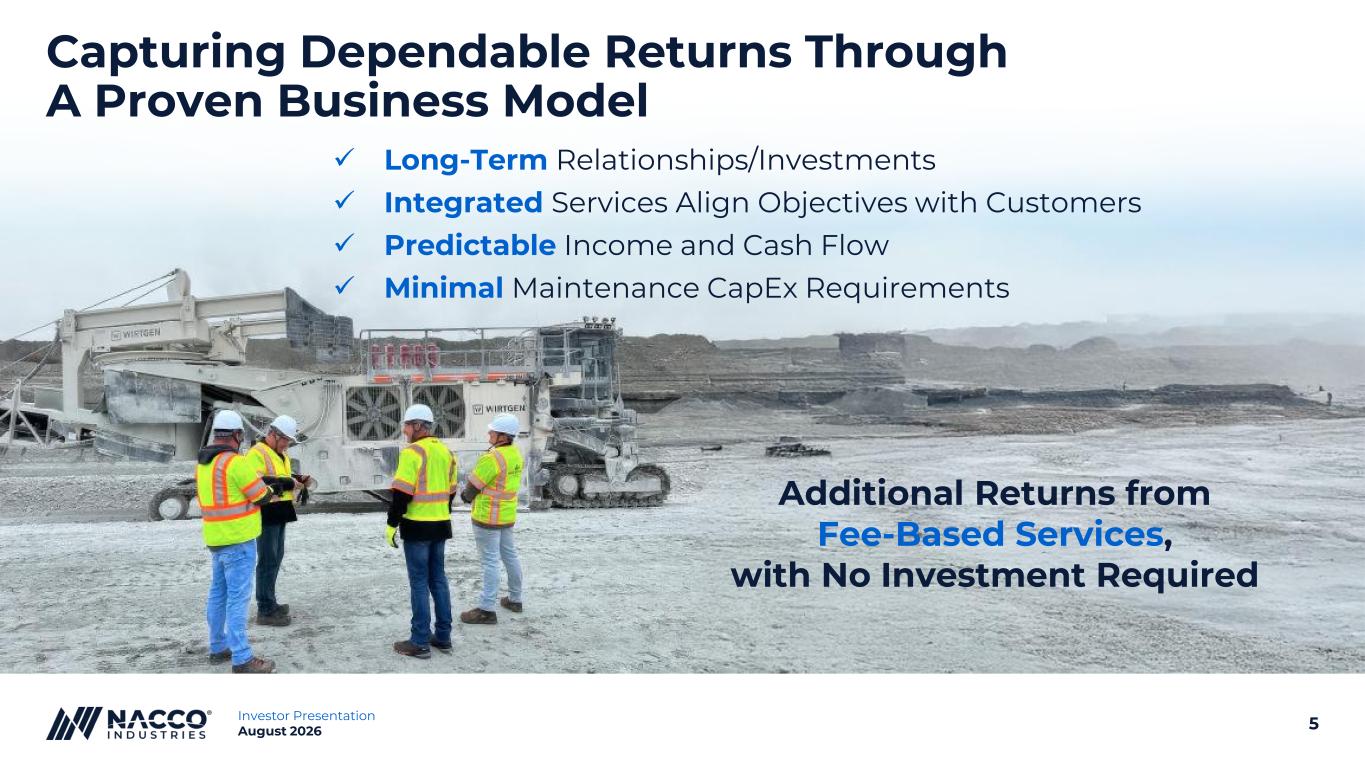
5Investor Presentation August 2026 Capturing Dependable Returns Through A Proven Business Model ✓ Long-Term Relationships/Investments ✓ Integrated Services Align Objectives with Customers ✓ Predictable Income and Cash Flow ✓ Minimal Maintenance CapEx Requirements Additional Returns from Fee-Based Services, with No Investment Required
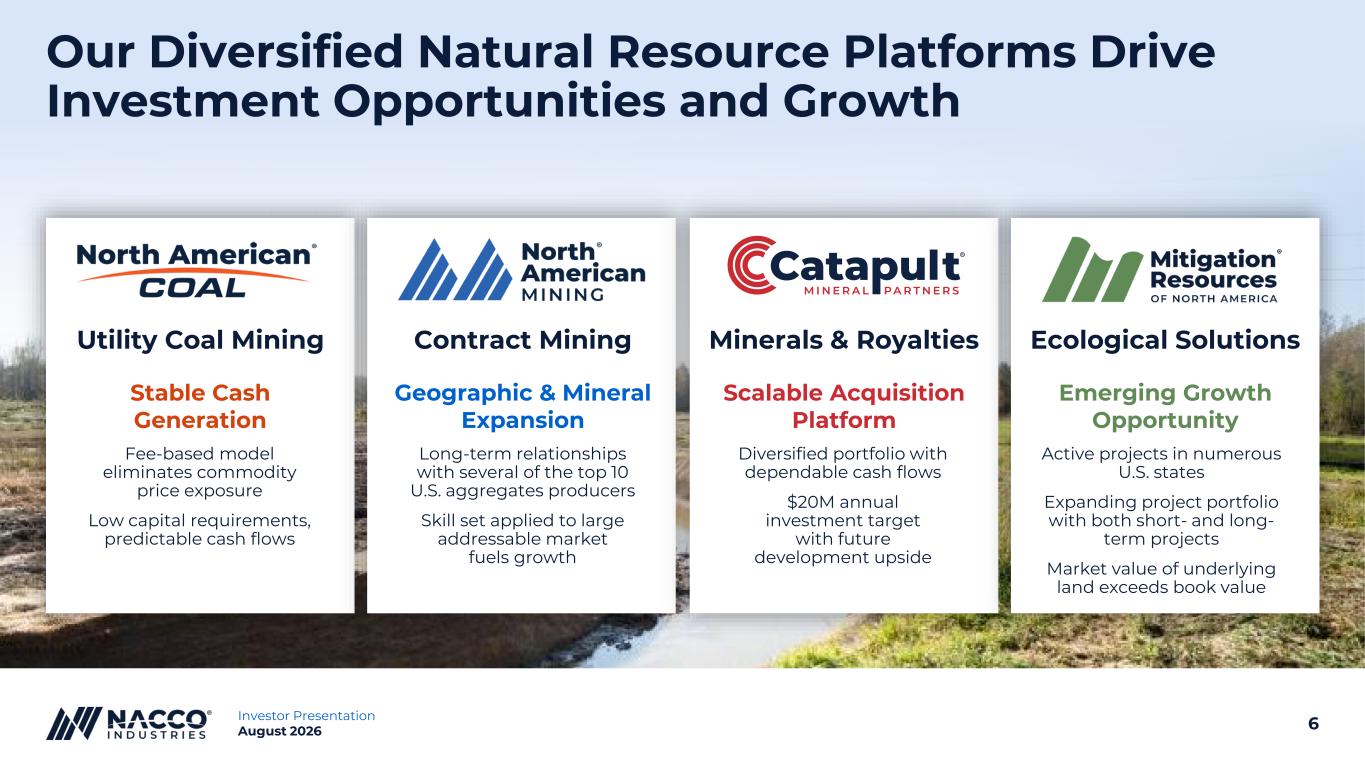
6Investor Presentation August 2026 Our Diversified Natural Resource Platforms Drive Investment Opportunities and Growth (R) Utility Coal Mining Stable Cash Generation Contract Mining Geographic & Mineral Expansion Minerals & Royalties Scalable Acquisition Platform Ecological Solutions Emerging Growth Opportunity North American Coal Mitigation Resources Fee-based model eliminates commodity price exposure Low capital requirements, predictable cash flows Diversified portfolio with dependable cash flows $20M annual investment target with future development upside Active projects in numerous U.S. states Expanding project portfolio with both short- and long- term projects Market value of underlying land exceeds book value Long-term relationships with several of the top 10 U.S. aggregates producers Skill set applied to large addressable market fuels growth ®
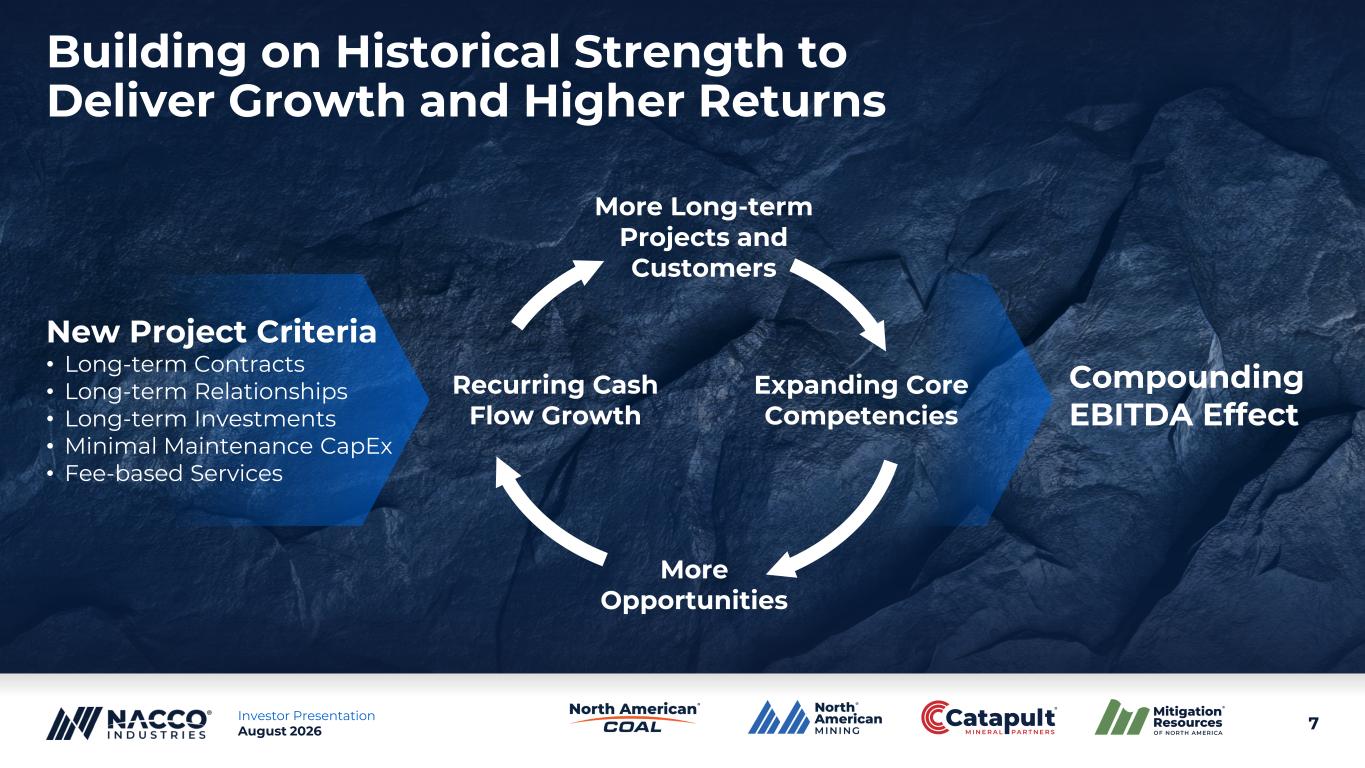
7Investor Presentation August 2026 Building on Historical Strength to Deliver Growth and Higher Returns More Long-term Projects and Customers Expanding Core Competencies Recurring Cash Flow Growth More Opportunities Compounding EBITDA Effect North American Coal Mitigation Resources ® New Project Criteria • Long-term Contracts • Long-term Relationships • Long-term Investments • Minimal Maintenance CapEx • Fee-based Services
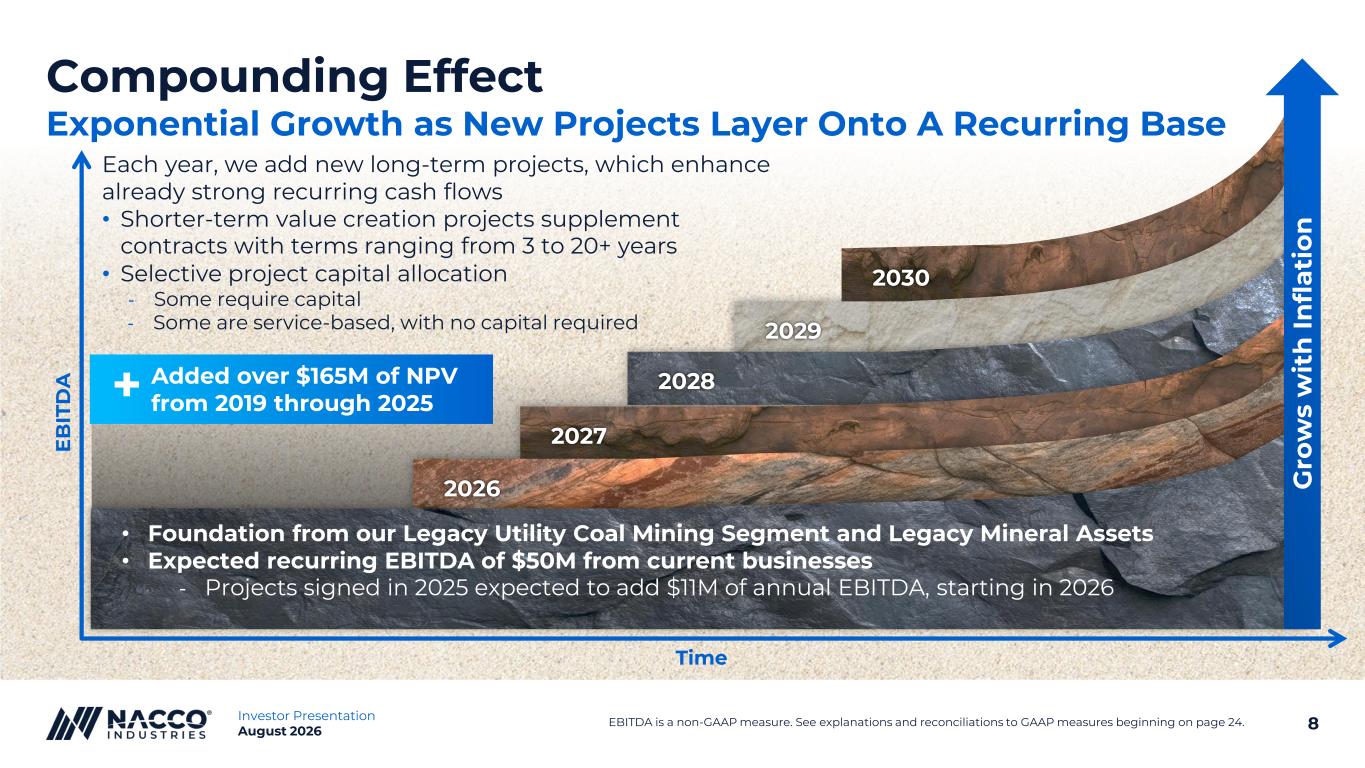
8Investor Presentation August 2026 2030 2029 2028 2027 2026 • Foundation from our Legacy Utility Coal Mining Segment and Legacy Mineral Assets • Expected recurring EBITDA of $50M from current businesses - Projects signed in 2025 expected to add $11M of annual EBITDA, starting in 2026 Compounding Effect Exponential Growth as New Projects Layer Onto A Recurring Base Each year, we add new long-term projects, which enhance already strong recurring cash flows • Shorter-term value creation projects supplement contracts with terms ranging from 3 to 20+ years • Selective project capital allocation - Some require capital - Some are service-based, with no capital required Time E B IT D A G ro w s w it h I n fl a ti o n Added over $165M of NPV from 2019 through 2025+ EBITDA is a non-GAAP measure. See explanations and reconciliations to GAAP measures beginning on page 24.
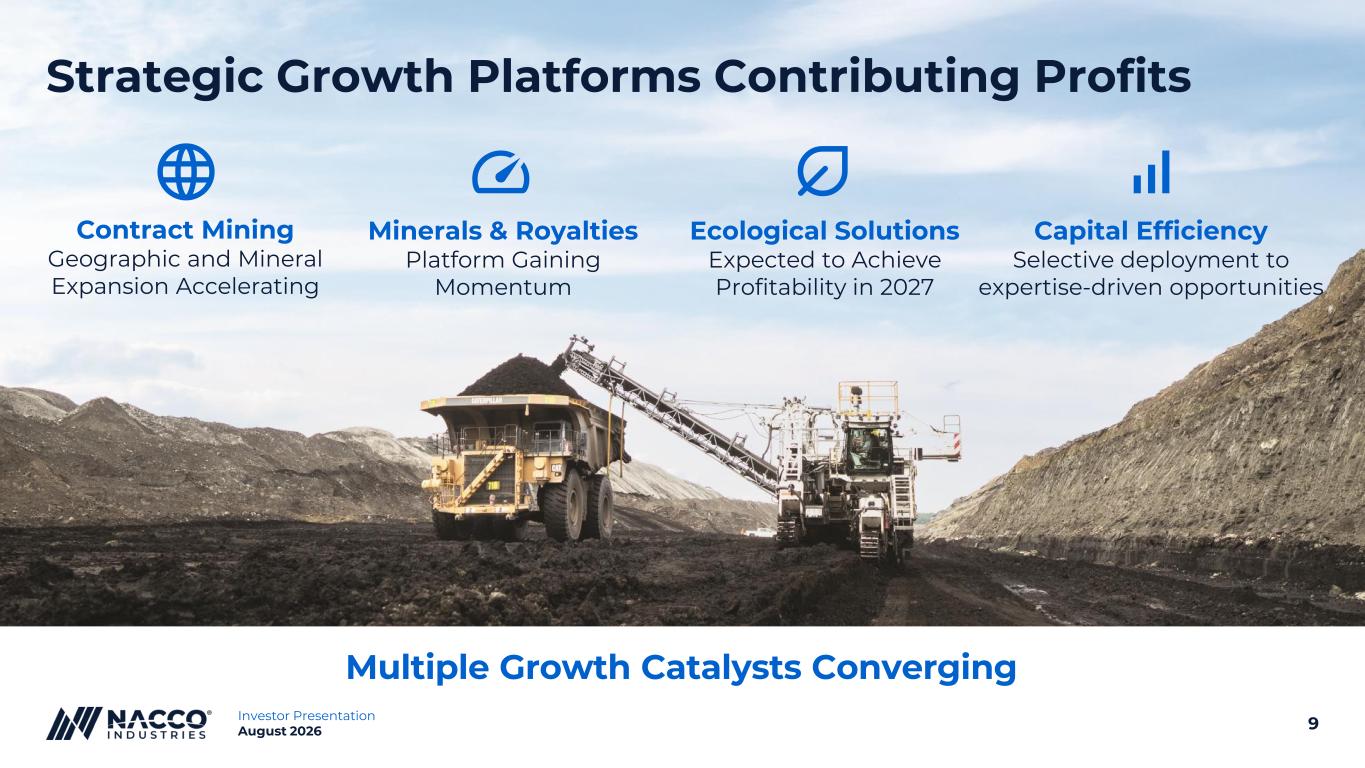
9Investor Presentation August 2026 Strategic Growth Platforms Contributing Profits Minerals & Royalties Platform Gaining Momentum Ecological Solutions Expected to Achieve Profitability in 2027 Contract Mining Geographic and Mineral Expansion Accelerating Capital Efficiency Selective deployment to expertise-driven opportunities Multiple Growth Catalysts Converging
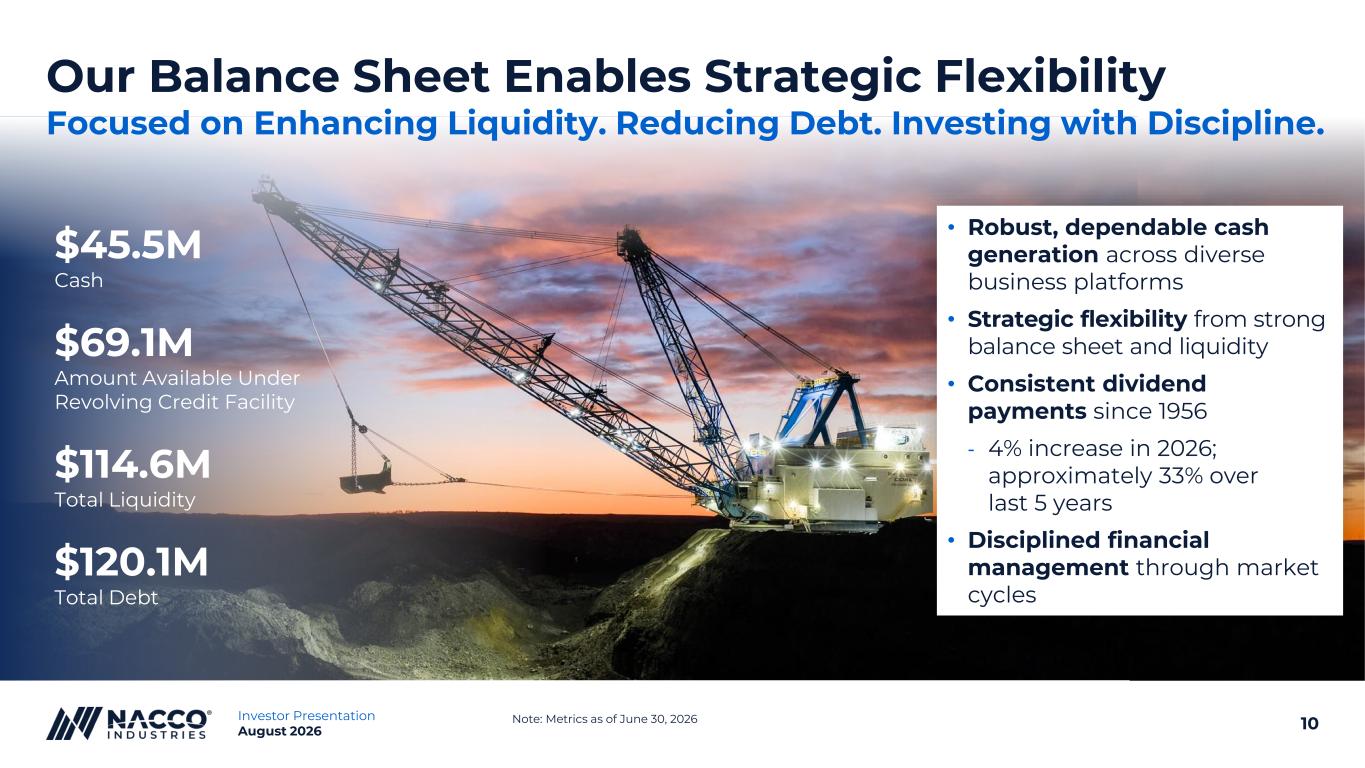
10Investor Presentation August 2026 Our Balance Sheet Enables Strategic Flexibility Focused on Enhancing Liquidity. Reducing Debt. Investing with Discipline. Note: Metrics as of June 30, 2026 • Robust, dependable cash generation across diverse business platforms • Strategic flexibility from strong balance sheet and liquidity • Consistent dividend payments since 1956 - 4% increase in 2026; approximately 33% over last 5 years • Disciplined financial management through market cycles $45.5M Cash $69.1M Amount Available Under Revolving Credit Facility $114.6M Total Liquidity $120.1M Total Debt
11Investor Presentation August 2026 NACCO is Strategically Positioned to Deliver Growth over Long-Term Investment Horizons Strong, steady, dependable, and uncorrelated to the tech- heavy market — a true, U.S.- centric portfolio anchor for the long-term We are not speculative. We are not cyclical. We are not trend-dependent. NACCO is a unique domestic natural resource investment opportunity A Different Kind Of Stock: While others focus on 1- to 3-year time horizons, we are building a diversified compounder you can own for the long-term 1 2 3
12Investor Presentation August 2026 Thank You www.nacco.com
13Investor Presentation August 2026 APPENDIX

14Investor Presentation August 2026 BUSINESS PLATFORM OVERVIEW
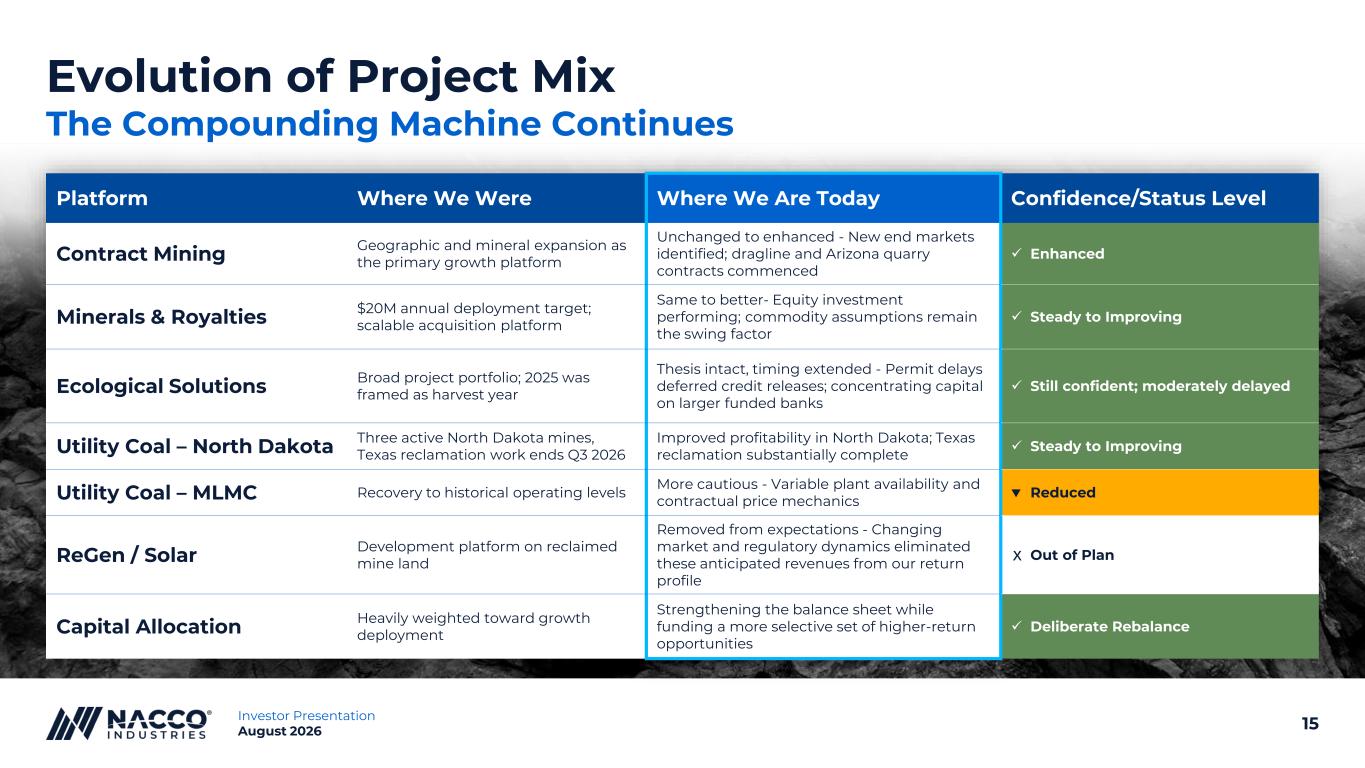
15Investor Presentation August 2026 Evolution of Project Mix Platform Where We Were Where We Are Today Confidence/Status Level Contract Mining Geographic and mineral expansion as the primary growth platform Unchanged to enhanced - New end markets identified; dragline and Arizona quarry contracts commenced ✓ Enhanced Minerals & Royalties $20M annual deployment target; scalable acquisition platform Same to better- Equity investment performing; commodity assumptions remain the swing factor ✓ Steady to Improving Ecological Solutions Broad project portfolio; 2025 was framed as harvest year Thesis intact, timing extended - Permit delays deferred credit releases; concentrating capital on larger funded banks ✓ Still confident; moderately delayed Utility Coal – North Dakota Three active North Dakota mines, Texas reclamation work ends Q3 2026 Improved profitability in North Dakota; Texas reclamation substantially complete ✓ Steady to Improving Utility Coal – MLMC Recovery to historical operating levels More cautious - Variable plant availability and contractual price mechanics ▼ Reduced ReGen / Solar Development platform on reclaimed mine land Removed from expectations - Changing market and regulatory dynamics eliminated these anticipated revenues from our return profile • Out of Plan Capital Allocation Heavily weighted toward growth deployment Strengthening the balance sheet while funding a more selective set of higher-return opportunities ✓ Deliberate Rebalance The Compounding Machine Continues x
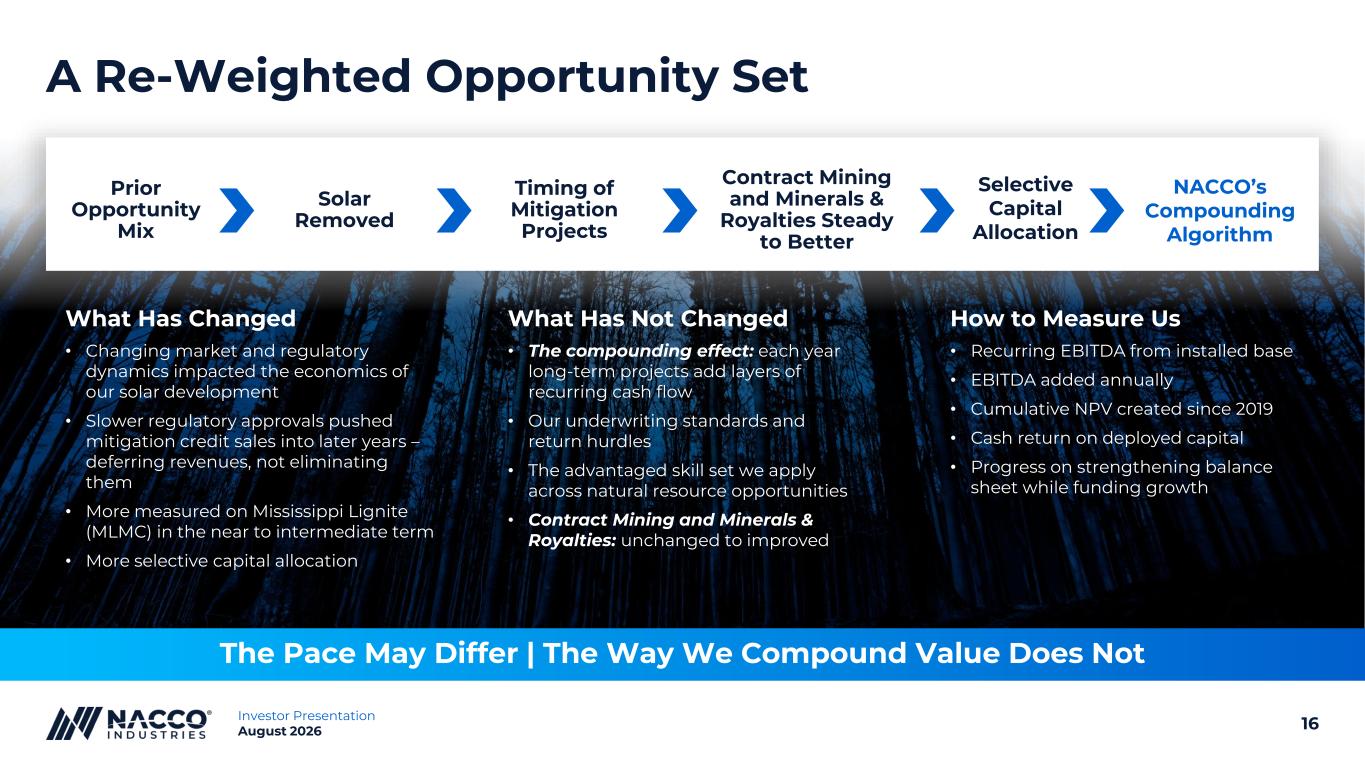
16Investor Presentation August 2026 A Re-Weighted Opportunity Set The Pace May Differ | The Way We Compound Value Does Not NACCO’s Compounding Algorithm Selective Capital Allocation Contract Mining and Minerals & Royalties Steady to Better Timing of Mitigation Projects Solar Removed Prior Opportunity Mix What Has Changed • Changing market and regulatory dynamics impacted the economics of our solar development • Slower regulatory approvals pushed mitigation credit sales into later years – deferring revenues, not eliminating them • More measured on Mississippi Lignite (MLMC) in the near to intermediate term • More selective capital allocation What Has Not Changed • The compounding effect: each year long-term projects add layers of recurring cash flow • Our underwriting standards and return hurdles • The advantaged skill set we apply across natural resource opportunities • Contract Mining and Minerals & Royalties: unchanged to improved How to Measure Us • Recurring EBITDA from installed base • EBITDA added annually • Cumulative NPV created since 2019 • Cash return on deployed capital • Progress on strengthening balance sheet while funding growth
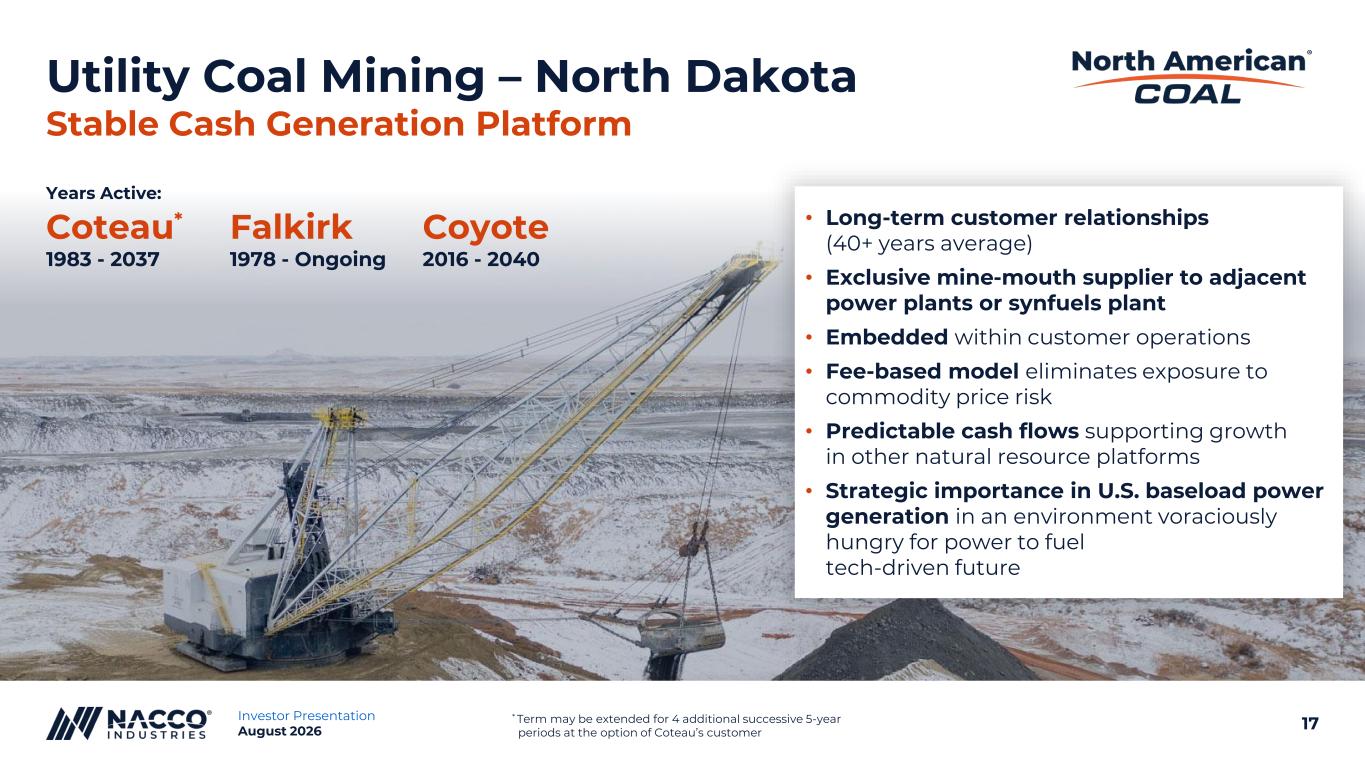
17Investor Presentation August 2026 Coteau* Falkirk Coyote 1983 - 2037 1978 - Ongoing 2016 - 2040 Utility Coal Mining – North Dakota Stable Cash Generation Platform North American Coal * Term may be extended for 4 additional successive 5-year periods at the option of Coteau’s customer Years Active: • Long-term customer relationships (40+ years average) • Exclusive mine-mouth supplier to adjacent power plants or synfuels plant • Embedded within customer operations • Fee-based model eliminates exposure to commodity price risk • Predictable cash flows supporting growth in other natural resource platforms • Strategic importance in U.S. baseload power generation in an environment voraciously hungry for power to fuel tech-driven future
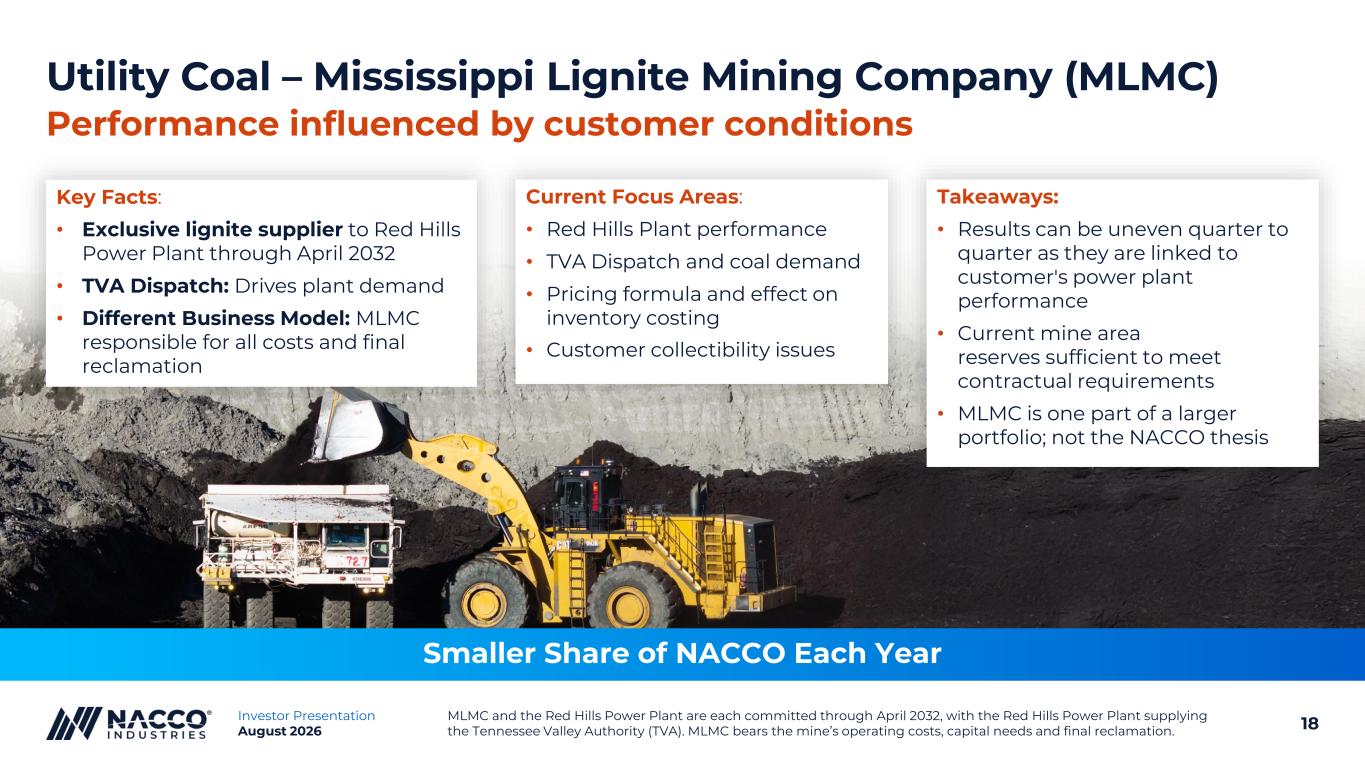
18Investor Presentation August 2026 Utility Coal – Mississippi Lignite Mining Company (MLMC) Performance influenced by customer conditions Smaller Share of NACCO Each Year Takeaways: • Results can be uneven quarter to quarter as they are linked to customer's power plant performance • Current mine area reserves sufficient to meet contractual requirements • MLMC is one part of a larger portfolio; not the NACCO thesis MLMC and the Red Hills Power Plant are each committed through April 2032, with the Red Hills Power Plant supplying the Tennessee Valley Authority (TVA). MLMC bears the mine’s operating costs, capital needs and final reclamation. Current Focus Areas: • Red Hills Plant performance • TVA Dispatch and coal demand • Pricing formula and effect on inventory costing • Customer collectibility issues Key Facts: • Exclusive lignite supplier to Red Hills Power Plant through April 2032 • TVA Dispatch: Drives plant demand • Different Business Model: MLMC responsible for all costs and final reclamation
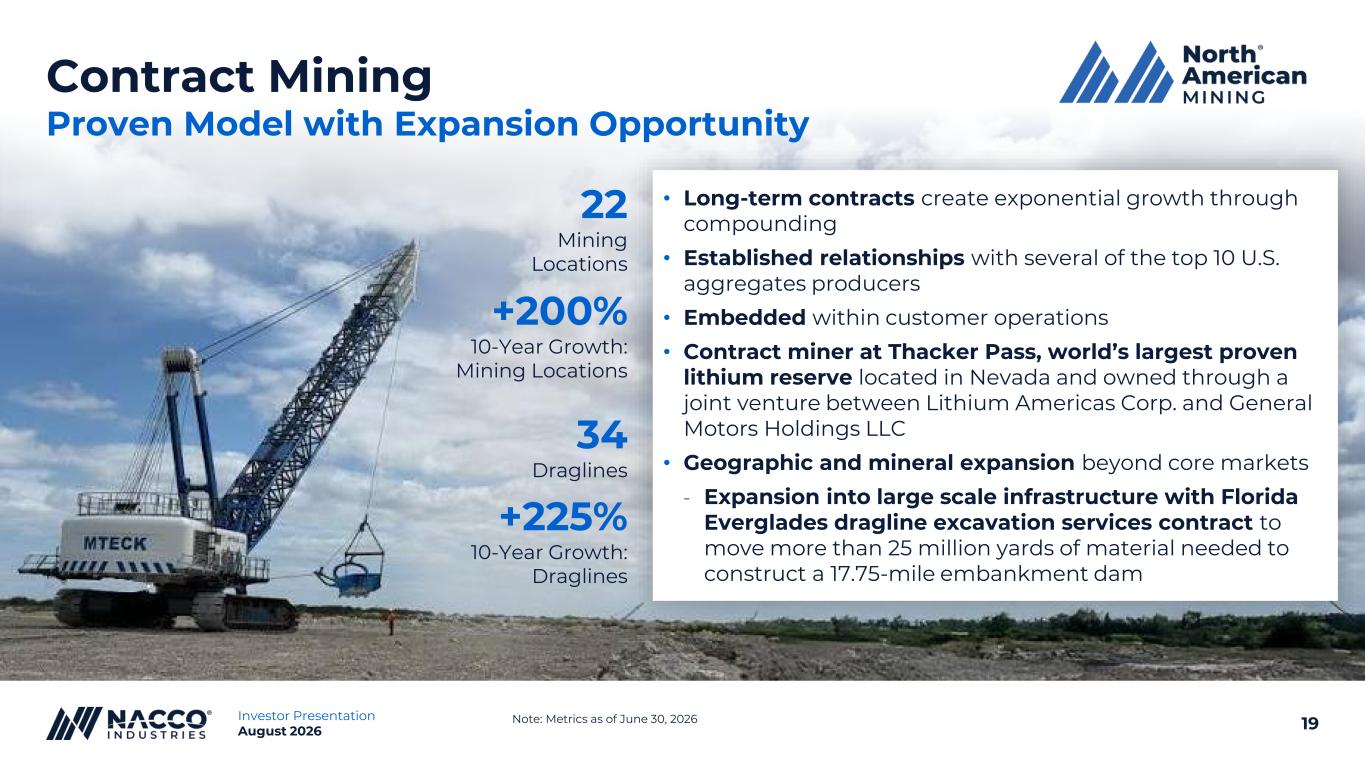
19Investor Presentation August 2026 Contract Mining Proven Model with Expansion Opportunity Note: Metrics as of June 30, 2026 34 Draglines +225% 10-Year Growth: Draglines • Long-term contracts create exponential growth through compounding • Established relationships with several of the top 10 U.S. aggregates producers • Embedded within customer operations • Contract miner at Thacker Pass, world’s largest proven lithium reserve located in Nevada and owned through a joint venture between Lithium Americas Corp. and General Motors Holdings LLC • Geographic and mineral expansion beyond core markets - Expansion into large scale infrastructure with Florida Everglades dragline excavation services contract to move more than 25 million yards of material needed to construct a 17.75-mile embankment dam 22 Mining Locations +200% 10-Year Growth: Mining Locations
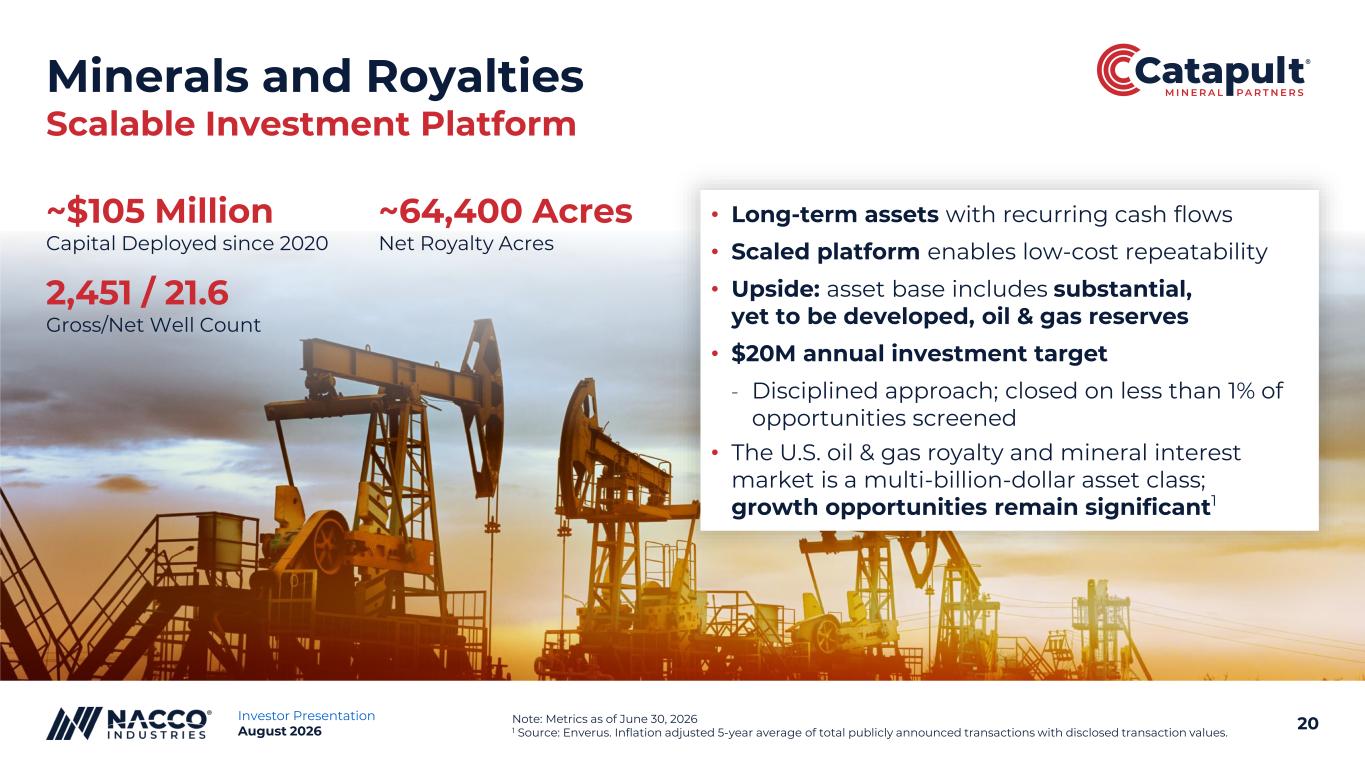
20Investor Presentation August 2026 Minerals and Royalties Scalable Investment Platform Note: Metrics as of June 30, 2026 1 Source: Enverus. Inflation adjusted 5-year average of total publicly announced transactions with disclosed transaction values. • Long-term assets with recurring cash flows • Scaled platform enables low-cost repeatability • Upside: asset base includes substantial, yet to be developed, oil & gas reserves • $20M annual investment target - Disciplined approach; closed on less than 1% of opportunities screened • The U.S. oil & gas royalty and mineral interest market is a multi-billion-dollar asset class; growth opportunities remain significant1 ~$105 Million ~64,400 Acres Capital Deployed since 2020 Net Royalty Acres 2,451 / 21.6 Gross/Net Well Count ®
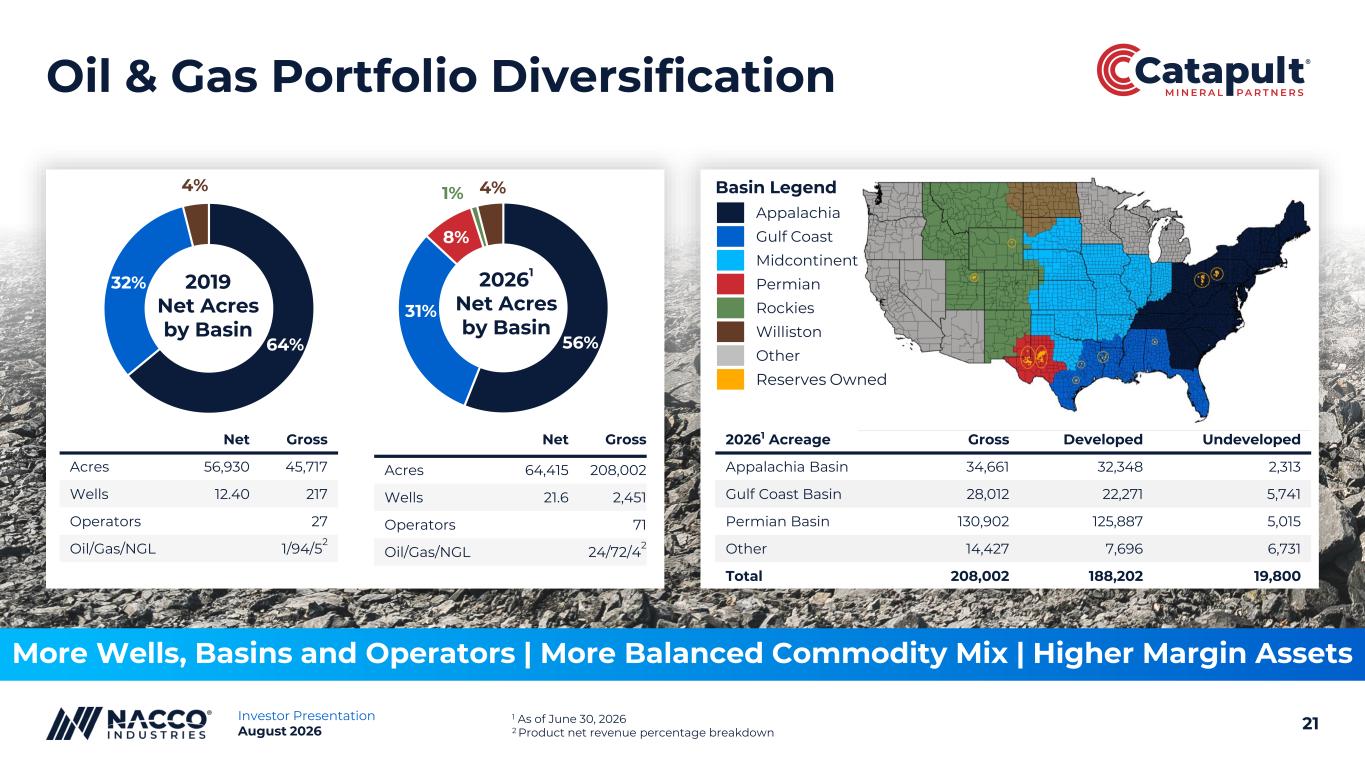
21Investor Presentation August 2026 Oil & Gas Portfolio Diversification More Wells, Basins and Operators | More Balanced Commodity Mix | Higher Margin Assets 1 As of June 30, 2026 2 Product net revenue percentage breakdown Basin Legend Appalachia Gulf Coast Midcontinent Permian Rockies Williston Other Reserves Owned 20261 Acreage Gross Developed Undeveloped Appalachia Basin 34,661 32,348 2,313 Gulf Coast Basin 28,012 22,271 5,741 Permian Basin 130,902 125,887 5,015 Other 14,427 7,696 6,731 Total 208,002 188,202 19,800 56% 31% 8% 1% 4% Net Gross Acres 56,930 45,717 Wells 12.40 217 Operators 27 Oil/Gas/NGL 1/94/52 20261 Net Acres by Basin 64% 32% 4% Net Gross Acres 64,415 208,002 Wells 21.6 2,451 Operators 71 Oil/Gas/NGL 24/72/42 2019 Net Acres by Basin ®
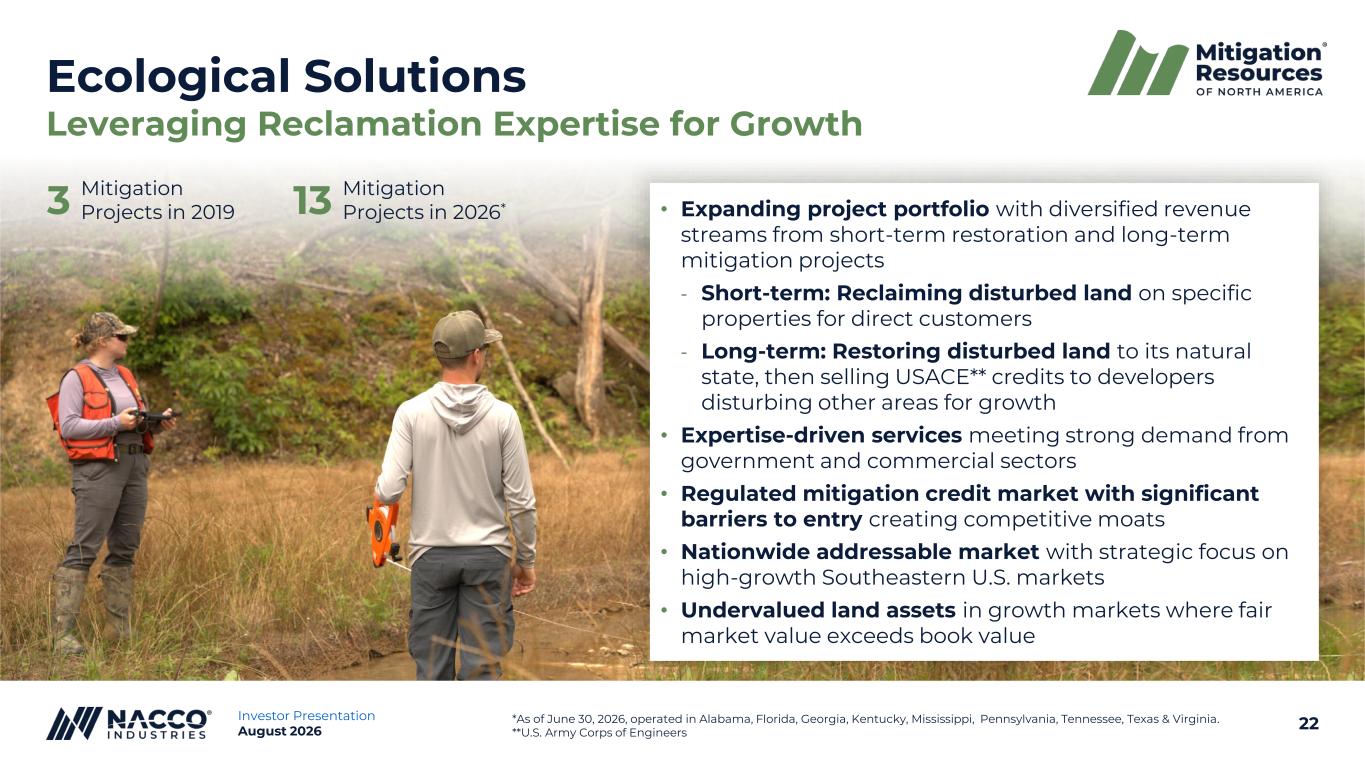
22Investor Presentation August 2026 Ecological Solutions Leveraging Reclamation Expertise for Growth *As of June 30, 2026, operated in Alabama, Florida, Georgia, Kentucky, Mississippi, Pennsylvania, Tennessee, Texas & Virginia. **U.S. Army Corps of Engineers • Expanding project portfolio with diversified revenue streams from short-term restoration and long-term mitigation projects - Short-term: Reclaiming disturbed land on specific properties for direct customers - Long-term: Restoring disturbed land to its natural state, then selling USACE** credits to developers disturbing other areas for growth • Expertise-driven services meeting strong demand from government and commercial sectors • Regulated mitigation credit market with significant barriers to entry creating competitive moats • Nationwide addressable market with strategic focus on high-growth Southeastern U.S. markets • Undervalued land assets in growth markets where fair market value exceeds book value Mitigation Resources 3 Mitigation Projects in 2019 13 Mitigation Projects in 2026*
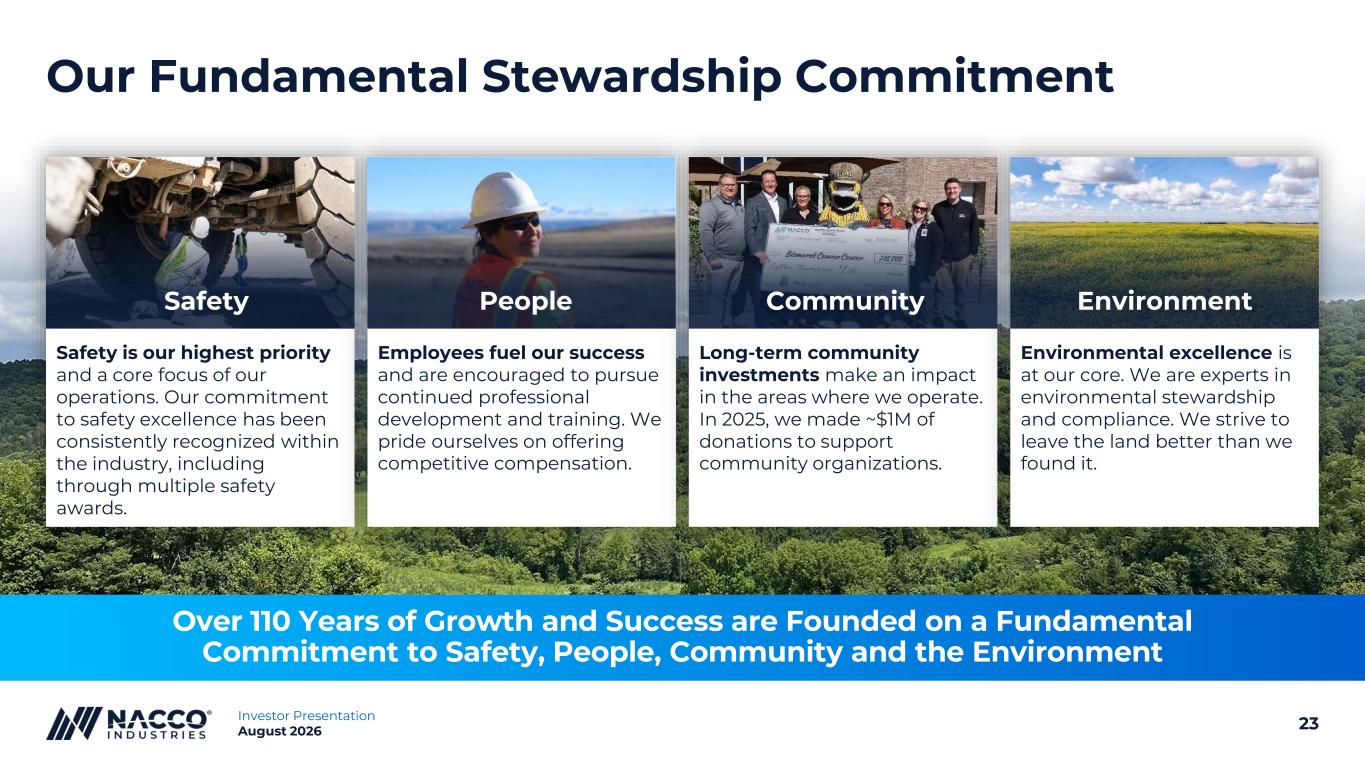
23Investor Presentation August 2026 Safety is our highest priority and a core focus of our operations. Our commitment to safety excellence has been consistently recognized within the industry, including through multiple safety awards. Employees fuel our success and are encouraged to pursue continued professional development and training. We pride ourselves on offering competitive compensation. Long-term community investments make an impact in the areas where we operate. In 2025, we made ~$1M of donations to support community organizations. Environmental excellence is at our core. We are experts in environmental stewardship and compliance. We strive to leave the land better than we found it. Our Fundamental Stewardship Commitment Over 110 Years of Growth and Success are Founded on a Fundamental Commitment to Safety, People, Community and the Environment EnvironmentCommunityPeopleSafety
24Investor Presentation August 2026 Non-GAAP Disclosure This presentation contains non-GAAP financial measures. Included in this presentation are reconciliations of these non-GAAP financial measures to the most directly comparable financial measures calculated in accordance with U.S. generally accepted accounting principles ("GAAP"). Consolidated EBITDA, Consolidated Adjusted EBITDA and Segment Adjusted EBITDA are measures of income (loss) that differ from financial results measured in accordance with GAAP. Consolidated EBITDA, Consolidated Adjusted EBITDA and Segment Adjusted EBITDA in this presentation are provided solely as supplemental non-GAAP disclosures of operating results. Management believes these non-GAAP financial measures assist investors in understanding the results of operations of NACCO Industries, Inc. and its subsidiaries and aid in understanding comparability of results. In addition, management evaluates results using these non-GAAP financial measures. We have also provided certain forward-looking statements regarding Consolidated EBITDA. We have not reconciled this forward- looking non-GAAP financial measure to the corresponding GAAP financial measure because outlook for the various reconciling items is not provided. We are unable to provide outlook for these reconciling items because we cannot determine their probable significance, as certain items are outside of our control and cannot be reasonably predicted since these items could vary significantly from period to period. Accordingly, a reconciliation to the corresponding GAAP financial measure is not available without unreasonable effort. NACCO defines non-GAAP measures as follows: ▪ Consolidated EBITDA is net income before income taxes, plus net interest expense and depreciation, depletion and amortization expense; ▪ Consolidated Adjusted EBITDA is net income before asset impairment charges, pension settlement charge and income taxes, plus net interest expense and depreciation, depletion and amortization expense; and ▪ Segment Adjusted EBITDA is segment operating profit before asset impairment charges and depreciation, depletion and amortization expense.
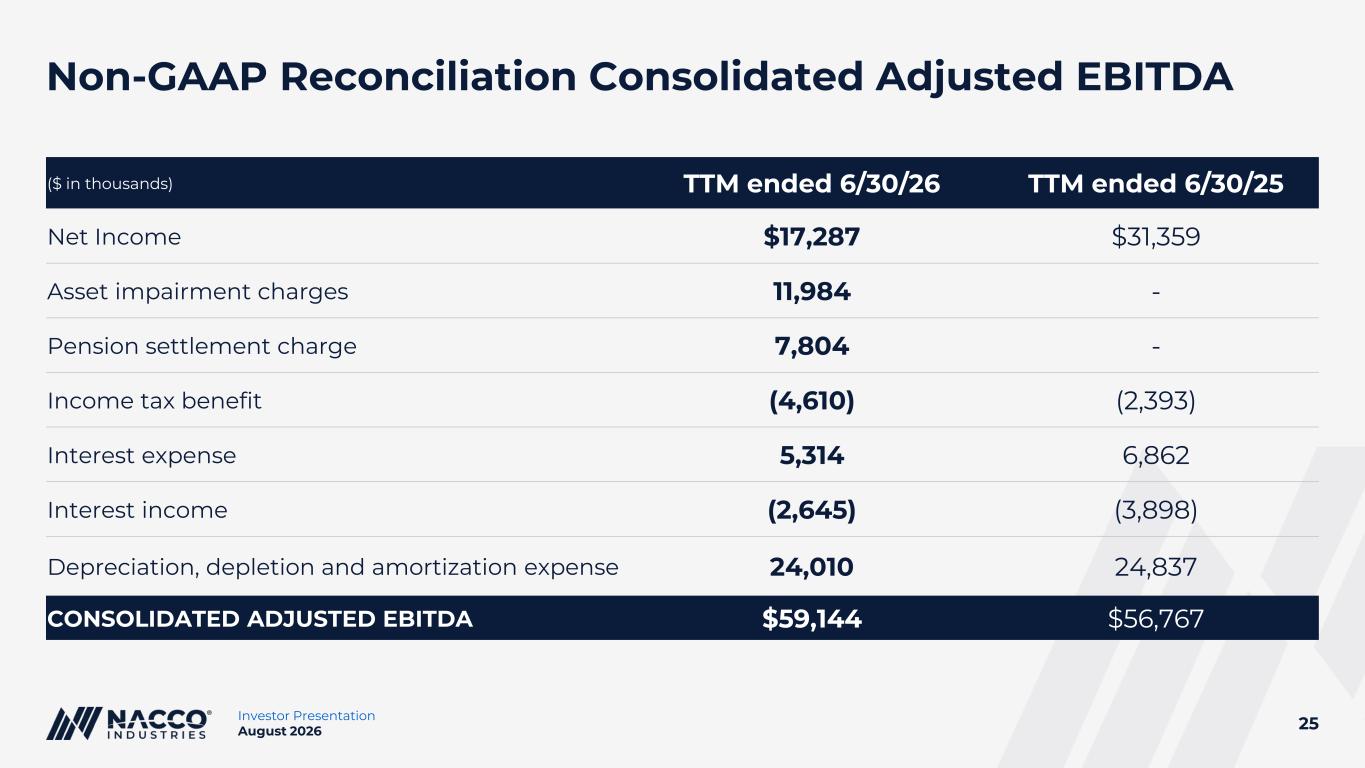
25Investor Presentation August 2026 Non-GAAP Reconciliation Consolidated Adjusted EBITDA ($ in thousands) TTM ended 6/30/26 TTM ended 6/30/25 Net Income $17,287 $31,359 Asset impairment charges 11,984 - Pension settlement charge 7,804 - Income tax benefit (4,610) (2,393) Interest expense 5,314 6,862 Interest income (2,645) (3,898) Depreciation, depletion and amortization expense 24,010 24,837 CONSOLIDATED ADJUSTED EBITDA $59,144 $56,767
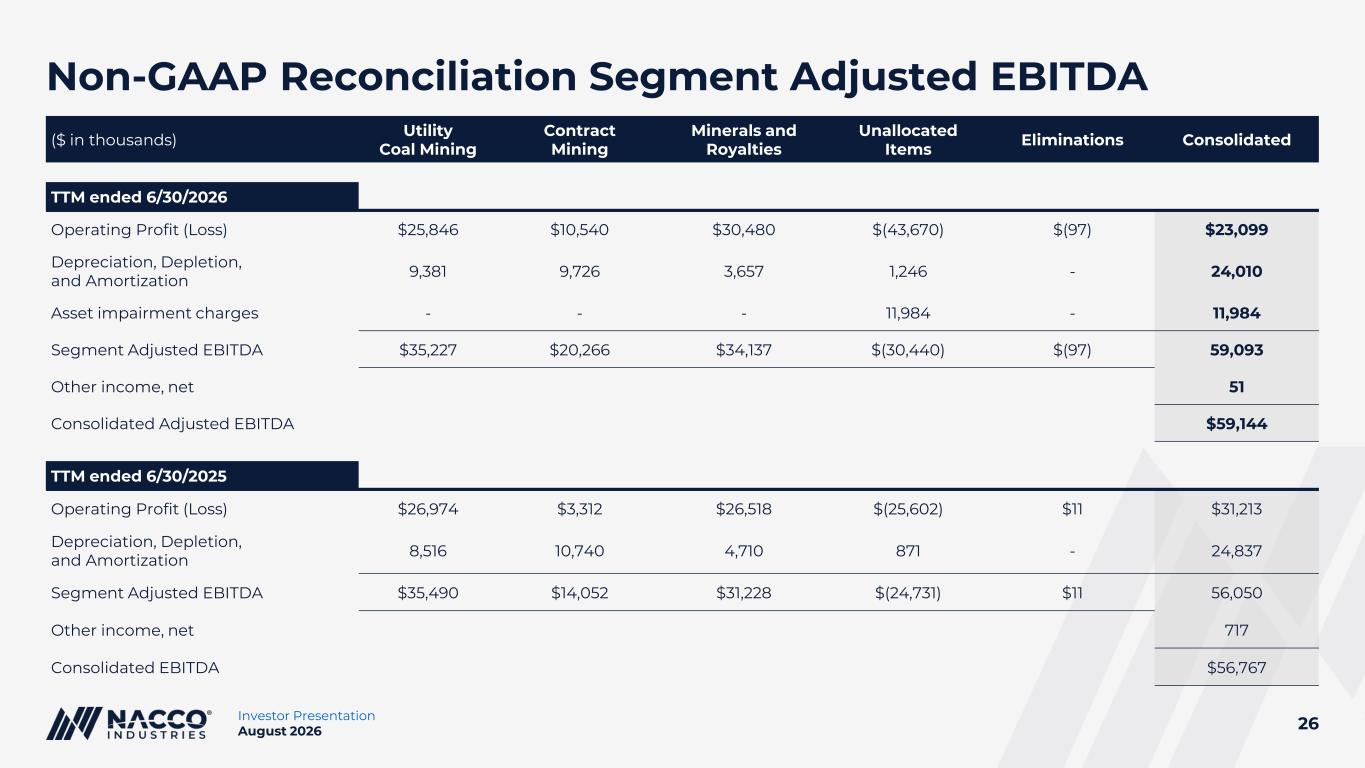
26Investor Presentation August 2026 Non-GAAP Reconciliation Segment Adjusted EBITDA ($ in thousands) Utility Coal Mining Contract Mining Minerals and Royalties Unallocated Items Eliminations Consolidated TTM ended 6/30/2026 Operating Profit (Loss) $25,846 $10,540 $30,480 $(43,670) $(97) $23,099 Depreciation, Depletion, and Amortization 9,381 9,726 3,657 1,246 - 24,010 Asset impairment charges - - - 11,984 - 11,984 Segment Adjusted EBITDA $35,227 $20,266 $34,137 $(30,440) $(97) 59,093 Other income, net 51 Consolidated Adjusted EBITDA $59,144 TTM ended 6/30/2025 Operating Profit (Loss) $26,974 $3,312 $26,518 $(25,602) $11 $31,213 Depreciation, Depletion, and Amortization 8,516 10,740 4,710 871 - 24,837 Segment Adjusted EBITDA $35,490 $14,052 $31,228 $(24,731) $11 56,050 Other income, net 717 Consolidated EBITDA $56,767
27Investor Presentation August 2026