ITEM 1. SCHEDULE OF INVESTMENTS.
The Schedule(s) of Investments is attached herewith.
Partners Group Next Generation Infrastructure, LLC
(a Delaware Limited Liability Company)
Consolidated Schedule of Investments —
June 30, 2026 (Unaudited)
The unaudited consolidated schedule of investments of Partners Group Next Generation Infrastructure, LLC (the “Fund”), a Delaware limited liability company that is registered under the Investment Company Act of 1940, as amended (the “Investment Company Act”), as a non-diversified, closed-end management investment company, as of June 30, 2026, is set forth below:
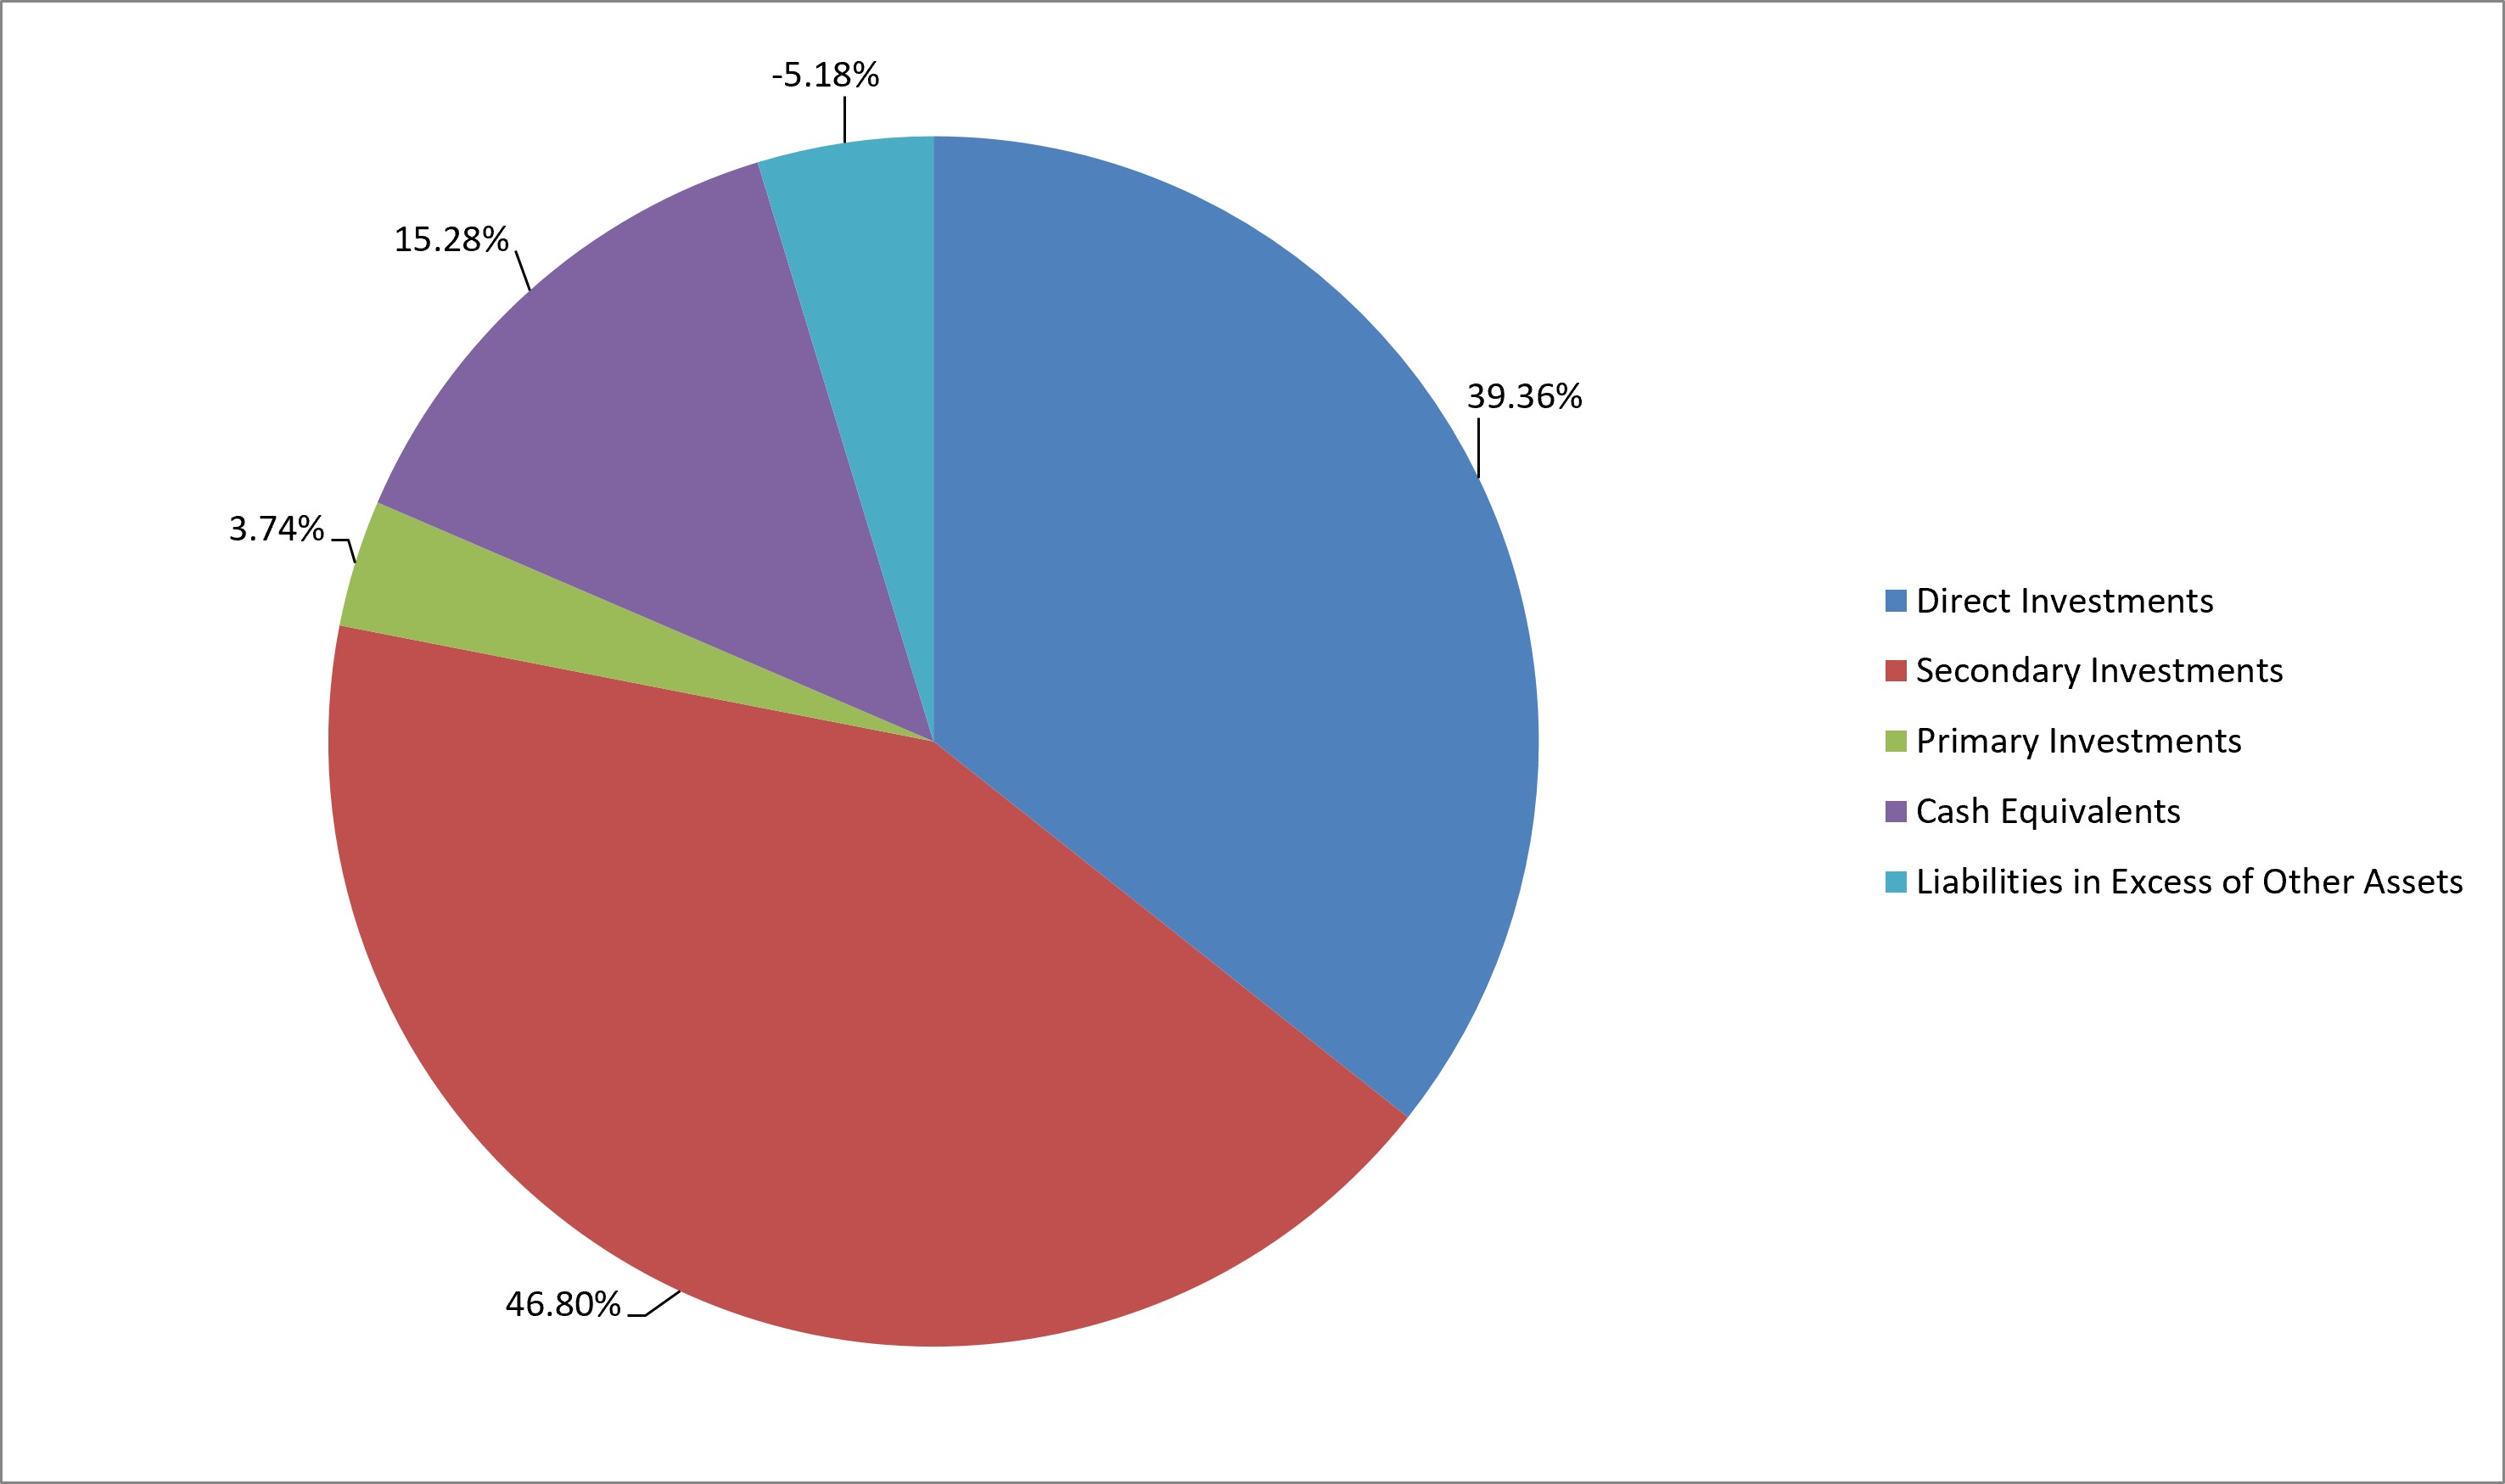
INVESTMENT PORTFOLIO AS A PERCENTAGE OF TOTAL NET ASSETS
Private Equity Investments (89.90%) Direct Investments * (39.36%) Direct Equity (39.36%) | Investment Type | Acquisition Date | Shares | Cost | Fair Value** | |||||||||||
| North America (18.00%) | ||||||||||||||||
| Arroyo Dunamis Direct Investment I-B L.P. +, a, b, d | Limited partnership interest | 02/25/25 | — | $ | 1,820,113 | $ | 3,492,441 | |||||||||
| DigitalBridge Zeus Partners V, LP +, a, b, c, d | Limited partnership interest | 10/13/23 | — | 5,490,537 | 10,238,990 | |||||||||||
| EdgeCore Holdings, LP +, a, b, d | Limited partnership interest | 08/22/24 | — | 1,164,340 | 2,096,625 | |||||||||||
| EQT Infra VI Co-Investment (E) SCSp +, a, c, d | Common equity | 03/13/24 | 1,400,000 | 1,243,527 | 1,741,447 | |||||||||||
| Exus US Holdings, LP +, a, b, c, d | Limited partnership interest | 10/03/23 | — | 2,691,443 | 4,132,633 | |||||||||||
| Forge Opportunity L.P. +, a, b, d | Common equity | 08/13/25 | 2,336,000 | 439,123 | 2,087,502 | |||||||||||
| Gateway Fleets Holdings, LP +, a, b, c, d | Limited partnership interest | 09/30/24 | — | 84,941 | 97,862 | |||||||||||
| LCP Parent LP +, a, b, d | Limited partnership interest | 12/03/25 | — | 12,906,347 | 14,598,459 | |||||||||||
| MRP Topco, LP +, a, b, c, d | Limited partnership interest | 06/04/25 | — | 11,250,000 | 13,262,884 | |||||||||||
| PowerTransitions LLC +, a, b, d | Limited partnership interest | 09/11/25 | — | 580,204 | 627,669 | |||||||||||
| Total North America (18.00%) | 52,376,512 | |||||||||||||||
| Western Europe (21.36%) | ||||||||||||||||
| Andromeda Co-Invest LP +, a, b, c, d | Limited partnership interest | 01/31/24 | — | 2,983,003 | 3,947,196 | |||||||||||
| Birdie Holdco Limited +, a, b, d | Limited partnership interest | 05/01/25 | — | 519,614 | 815,377 | |||||||||||
| EQT Active Core Infrastructure Co-Investment (Y) SCSp +, a, d | Limited partnership interest | 06/04/26 | — | 7,310,982 | 7,242,243 | |||||||||||
| InfraJoule V SCSp +, a | Limited partnership interest | 06/18/26 | — | 14,251,477 | 14,185,599 | |||||||||||
| PG Elysium HoldCo S.à r.l. +, a, c, d | Common equity | 11/14/23 | 7,992,369 | 1,383,047 | 1,853,983 | |||||||||||
| PG Investment Company 71 S.à r.l. +, a, d | Common equity | 09/26/24 | 674,470 | 760,379 | 1,017,357 | |||||||||||
| PG Polaris TopCo S.à r.l. +, a, c | Preferred equity | 03/27/24 | 1,843,991 | 1,843,991 | 1,828,171 | |||||||||||
| PG Polaris TopCo S.à r.l. +, a, c, d | Common equity | 03/27/24 | 97,052 | 97,065 | 1,426,338 | |||||||||||
| PG Polaris Warehouse SCSp +, a, b, c | Limited partnership interest | 03/27/24 | — | 37,427 | 45,331 | |||||||||||
| Southern Water +, a, b, d | Limited partnership interest | 11/13/25 | — | 11,263,347 | 18,986,887 | |||||||||||
| T InvestCo Lux I S.à r.l. +, a, d | Common equity | 10/07/25 | 595,692 | 1,169,873 | 3,213,042 | |||||||||||
| T InvestCo Lux I S.à r.l. +, a, d | Preferred equity | 10/07/25 | 2,163,794 | 7,266,226 | 7,600,283 | |||||||||||
| Total Western Europe (21.36%) | 62,161,807 | |||||||||||||||
| Total Direct Equity (39.36%) | $ | 86,557,006 | $ | 114,538,319 | ||||||||||||
| Total Direct Investments (39.36%) | $ | 86,557,006 | $ | 114,538,319 | ||||||||||||
| Secondary Investments *, b (46.80%) | Acquisition Date | Cost | Fair Value | |||||||
| North America (31.88%) | ||||||||||
| Arroyo Investors Fund IV, L.P. +, a, d | 02/25/25 | $ | 1,785,378 | $ | 2,014,465 | |||||
| Avenue Kite Continuation Fund (Offshore), L.P. +, a | 06/30/26 | 17,298,630 | 17,298,630 | |||||||
| Blackstone Energy Partners III, L.P. +, a, d | 03/31/26 | 5,328,464 | 9,476,124 | |||||||
| Bolt Energy, LLC +, a, d | 07/01/25 | 441,034 | 434,373 | |||||||
| DigitalBridge Partners II, LP +, a, c, d | 10/01/23 | 7,864,244 | 10,225,122 | |||||||
| EnCap Flatrock Midstream Fund III, L.P. +, a, d | 09/30/25 | 54,879 | 124,997 | |||||||
| EnCap Flatrock Midstream Fund IV L.P. +, a, d | 09/30/25 | 479,229 | 688,798 | |||||||
| ERA Blade Continuation Fund Parallel LP +, a, d | 08/06/25 | 857,041 | 984,725 | |||||||
| Fengate Everest Continuation Fund L.P. +, a, c, d | 06/17/24 | 1,045,947 | 1,534,479 | |||||||
| GI Zeus Holdings-A L.P. +, a, d | 08/13/25 | 2,272,783 | 2,627,842 | |||||||
| Grain Communications Opportunity Fund (Parallel), L.P. +, a, c, d | 06/30/24 | 101,634 | 105,016 | |||||||
| Grain Spectrum Holdings III (Cayman), L.P. +, a, c, d | 06/30/24 | 152,710 | 192,292 | |||||||
| Gridiron Energy, LLC +, a | 10/01/24 | 1 | 2,310,707 | |||||||
| Jackrabbit Power Holdings, LLC +, a, c | 06/30/24 | 1 | 1 | |||||||
| LS Power Equity Partners III Feeder 1, L.P. +, a | 01/01/25 | 4 | 1,568,730 | |||||||
| LS Power Equity Partners III Feeder 3, L.P. +, a, c, d | 06/30/24 | 1 | 65,912 | |||||||
The accompanying notes are an integral part of this Consolidated Schedule of Investments.
Partners Group Next Generation Infrastructure, LLC
(a Delaware Limited Liability Company)
Consolidated Schedule of Investments —
June 30, 2026 (Unaudited) (continued)
Private Equity Investments (continued) Secondary Investments *, b (continued) | Acquisition Date | Cost | Fair Value | |||||||
| North America (continued) | ||||||||||
| LS Power Equity Partners IV, L.P. +, a, c, d | 06/30/24 | $ | 1,571 | $ | 151,854 | |||||
| Peppertree Capital Fund IX +, a, d | 01/01/26 | 847,997 | 955,737 | |||||||
| Peppertree Capital Fund IX +, a, c | 09/29/23 | 7,378,899 | 8,996,073 | |||||||
| Peppertree Capital Fund VI QP, LP +, a | 10/01/25 | 2,834,874 | 3,849,313 | |||||||
| Peppertree Capital Fund VII QP, LP +, a | 12/31/23 | 2,999,638 | 4,007,745 | |||||||
| Peppertree Capital Fund VIII QP, LP +, a | 12/31/23 | 1,953,308 | 2,625,695 | |||||||
| QNZPF US Co-Investment Vehicle +, a, d | 07/31/24 | 752,666 | 1,849,026 | |||||||
| Quinbrook Net Zero Power Fund +, a, d | 07/31/24 | 954,968 | 1,539,972 | |||||||
| Rockland Gridflex Partners +, a, c | 06/30/24 | 128,806 | 434,549 | |||||||
| Rockland PHR Partners, L.P. +, a, c | 08/01/23 | 4,892,446 | 12,814,959 | |||||||
| Rockland Power Partners II, LP +, a, c | 06/30/24 | 1 | 11,124 | |||||||
| Rockland Power Partners III, LP +, a, c | 06/30/24 | 161,750 | 223,237 | |||||||
| Rockland Power Partners IV, L.P. +, a, c | 06/30/24 | 299,137 | 567,384 | |||||||
| Rockland Power Partners IV, L.P. +, a, c | 08/02/23 | 1,914,253 | 3,804,354 | |||||||
| True Green Capital Fund III, L.P. +, a, c | 06/30/24 | 45,884 | 66,623 | |||||||
| True Green Capital Fund IV, L.P. +, a, c | 06/30/24 | 188,912 | 246,713 | |||||||
| Valley of Fire Continuation Fund Feeder LP +, a, c, d | 03/08/24 | 728,864 | 980,367 | |||||||
| Total North America (31.88%) | 92,776,938 | |||||||||
| Western Europe (14.92%) | ||||||||||
| Aparca8 Capital Estacionamientos, S.C.R., S.A. +, a, c, d | 12/15/23 | 2,750,896 | 4,930,282 | |||||||
| Daiwa ICP European Infrastructure 1, L.P. +, a | 09/11/24 | 1,176,421 | 1,882,029 | |||||||
| Digital Infrastructure Vehicle II SCSp, SICAV-RAIF +, a, c, d | 09/04/23 | 5,182,118 | 6,782,037 | |||||||
| DIV II Matrix Co-Invest II SCSp +, a, d | 06/18/24 | 1,349,310 | 2,664,846 | |||||||
| DIV II Matrix Co-Invest SCSp +, a, c, d | 09/04/23 | 3,395,557 | 6,746,857 | |||||||
| F2i III +, a, d | 07/01/24 | 8,477,130 | 11,157,407 | |||||||
| MML Keystone I +, a, c, d | 04/15/25 | 262,181 | 322,326 | |||||||
| Next Generation Rail Fund SCSp +, a, d | 06/18/26 | 8,906,844 | 8,951,753 | |||||||
| Total Western Europe (14.92%) | 43,437,537 | |||||||||
| Total Secondary Investments (46.80%) | $ | 95,266,411 | $ | 136,214,475 | ||||||
| Primary Investments *, b (3.74%) | ||||||||||
| North America (3.74%) | ||||||||||
| ArcLight Infrastructure Partners Fund VIII-B, L.P. +, a, d | 10/29/25 | 2,486,256 | 2,715,255 | |||||||
| Arroyo Investors Fund IV, L.P. +, a, d | 03/28/25 | 3,542,416 | 3,996,954 | |||||||
| DigitalBridge Partners III, LP +, a, c, d | 05/14/24 | 409,905 | 398,321 | |||||||
| EnCap Energy Transition Fund II-C, L.P. +, a, c, d | 12/28/23 | 650,123 | 644,151 | |||||||
| GI Data Infrastructure Fund II LP +, a, c, d | 01/22/24 | 461,848 | 545,238 | |||||||
| KKR Global Infrastructure Investors V (USD) SCSp +, a, d | 06/01/24 | 213,583 | 220,659 | |||||||
| LS Power Equity Partners V, L.P. +, a, c, d | 12/20/23 | 597,585 | 793,358 | |||||||
| Rockland Power Partners IV, L.P. +, a, c | 01/31/24 | 686,305 | 1,373,809 | |||||||
| Stonepeak Infrastructure Partners V, L.P. +, a, c, d | 03/04/24 | 190,349 | 186,540 | |||||||
| Total North America (3.74%) | 10,874,285 | |||||||||
| Total Primary Investments (3.74%) | $ | 9,238,370 | $ | 10,874,285 | ||||||
| Total Private Equity Investments (Cost $191,061,787)(89.90%) | $ | 261,627,079 | ||||||||
| Total Investments (Cost $191,061,787)(89.90%) | 261,627,079 | |||||||||
The accompanying notes are an integral part of this Consolidated Schedule of Investments.
Partners Group Next Generation Infrastructure, LLC
(a Delaware Limited Liability Company)
Consolidated Schedule of Investments —
June 30, 2026 (Unaudited) (continued)
| Interest Rate | Units | Cost | Fair Value | |||||||||||||
| Cash Equivalents | ||||||||||||||||
| BlackRock Liquidity Funds - Treasury Trust Fund | 3.54 | %e | 44,479,029 | $ | 44,479,029 | $ | 44,479,029 | |||||||||
| Total Cash Equivalents (Cost $44,479,029)(15.28%) | 44,479,029 | 44,479,029 | ||||||||||||||
| Total Investments and Cash Equivalents (Cost $235,540,816)(105.18%) | 306,106,108 | |||||||||||||||
| Liabilities in Excess of Other Assets((5.18)%) | (15,084,265 | ) | ||||||||||||||
| Net Assets (100.00%)f | $ | 291,021,843 | ||||||||||||||
| * | Direct Investments are private investments directly into the equity or debt of selected operating companies, often together with the management of the company. Primary Investments are investments in newly established private equity partnerships where underlying portfolio companies are not known as of the time of investment. Secondary Investments are single or portfolios of assets acquired on the secondary market. Notwithstanding the foregoing, if the Fund reasonably determines that the strict application of the above definitions would not reflect the economic substance of any investment, the Fund may re-classify such investment as it deems appropriate. |
| ** | The Fair Value of any Direct Investment may not necessarily reflect the current or expected future performance of such Direct Investment or the Fair Value of the Fund’s interest in such Direct Investment. Furthermore, the Fair Value of any Direct Investment has not been calculated, reviewed, verified or in any way approved by such Direct Investment or its general partner, manager or sponsor (including any of its affiliates). Please see below for further details regarding the valuation policy of the Fund. |
| + | The fair value of the investment was determined using significant unobservable inputs. |
| a | Private equity investments are generally issued in private placement transactions and as such are generally restricted as to resale. Each investment may have been purchased on various dates and for different amounts. The date of the first purchase is reflected under Acquisition Date as shown in the Schedule of Investments. Total fair value of restricted investments as of June 30, 2026 was $261,627,079, or 89.90% of net assets. Total aggregated cost of restricted securities as of June 30, 2026 was $191,061,787. |
| b | Investment does not issue shares. |
| c | Non-income producing. |
| d | Investment has been committed to but has not been fully funded by the Fund. |
| e | The rate shown is the annualized seven-day yield as of June 30, 2026. |
| f | Net Assets include $8,535,195 of Repurchase amounts payable for tender offers. |
A summary of outstanding financial instruments at June 30, 2026 is as follows:
Forward Foreign Currency Contracts
| Settlement Date | Counterparty | Currency Purchased | Currency Sold | Value | Unrealized Appreciation (Depreciation) | |||||||||||||
| July 22, 2026 | State Street Bank International | £ | 9,516,000 | $ | 12,715,173 | $ | 12,715,207 | $ | 34 | |||||||||
| July 22, 2026 | State Street Bank International | $ | 2,840,746 | £ | 2,116,000 | $ | 2,827,383 | $ | 13,363 | |||||||||
| July 22, 2026 | State Street Bank International | $ | 9,904,839 | £ | 7,400,000 | $ | 9,887,823 | $ | 17,016 | |||||||||
| August 19, 2026 | State Street Bank International | $ | 3,186,701 | € | 2,730,000 | $ | 3,127,044 | $ | 59,657 | |||||||||
| August 19, 2026 | State Street Bank International | $ | 13,095,601 | € | 11,220,000 | $ | 12,851,805 | $ | 243,796 | |||||||||
| August 19, 2026 | State Street Bank International | $ | 39,672,781 | € | 33,470,000 | $ | 38,337,783 | $ | 1,334,998 | |||||||||
| October 28, 2026 | State Street Bank International | $ | 6,394,887 | £ | 4,770,000 | $ | 6,329,958 | $ | 64,929 | |||||||||
| October 28, 2026 | State Street Bank International | $ | 6,534,785 | £ | 4,860,000 | $ | 6,449,391 | $ | 85,394 | |||||||||
| October 28, 2026 | State Street Bank International | $ | 9,340,613 | £ | 7,060,000 | $ | 9,368,869 | $ | (28,256 | ) | ||||||||
| October 28, 2026 | State Street Bank International | $ | 12,709,598 | £ | 9,516,000 | $ | 12,628,067 | $ | 81,531 | |||||||||
| $ | 1,872,462 | |||||||||||||||||
The accompanying notes are an integral part of this Consolidated Schedule of Investments.
Partners Group Next Generation Infrastructure, LLC
(a Delaware Limited Liability Company)
Consolidated Schedule of Investments —
June 30, 2026 (Unaudited) (continued)
Legends:
| € | - Euro |
| £ | - British Pound |
The accompanying notes are an integral part of this Consolidated Schedule of Investments.
The information contained in this section should be read in conjunction with the Fund’s audited consolidated financial statements contained in its annual report for the year ended March 31, 2026.
Investments held by the Fund include direct equity investments in operating companies (“Direct Investments”) and primary and secondary investments in private equity funds (“Primary Investments” and “Secondary Investments”, respectively, and together, “Private Equity Fund Investments”; Direct Investments and Private Equity Fund Investments, collectively, “Private Equity Investments”).
Partners Group (USA) Inc. (the “Adviser”) determines the fair value of the Fund’s Private Equity Investments in conformity with U.S. generally accepted accounting principles (“U.S. GAAP”) and the Fund's valuation procedures (the “Valuation Procedures”), which have been approved by the board of managers of the Fund (the “Board”). As authorized by the Valuation Procedures, the Adviser values the Fund’s Private Equity Investments in consultation with its affiliates. The Valuation Procedures require evaluation of all relevant factors reasonably available to the Adviser and its affiliates at the time the Fund’s Private Equity Investments are valued.
The Valuation Procedures are implemented by the Adviser and State Street Bank and Trust Company, as the Fund’s administrator (the “Administrator”). Both the Adviser and the Administrator are subject to the oversight of, and report to, the Board. The Adviser and the Administrator monitor and review the methodologies of the various third-party pricing services that are employed by the Fund.
The Adviser and certain of its affiliates act as investment advisers to clients other than the Fund. However, the valuation attributed to a Private Equity Investment held by the Fund and to the same Private Equity Investment held by another client, one of the Adviser’s affiliates, or by a client of one of its affiliates might differ due to differences in accounting, regulatory or other factors applicable to the Fund, such other client or the Adviser’s affiliate.
In conformity with U.S. GAAP, investments are classified in their entirety based on the lowest level of input that is significant to the fair value measurement. Estimated fair values may differ from the values that would have been used if a ready market existed or if the investments were liquidated at the valuation date. A three-level hierarchy is used to distinguish between (A) inputs that reflect the assumptions market participants would use in pricing an asset or liability developed based on market data obtained from sources independent of the reporting entity (observable inputs) and (B) inputs that reflect the reporting entity’s own assumptions about the assumptions market participants would use in pricing an asset or liability developed based on the best information available in the circumstances (unobservable inputs). This distinction determines the classification of fair value measurements for disclosure purposes.
The various types of inputs used in determining the value of the Fund’s investments are summarized below for each of the three levels:
| ● | Level 1 – Pricing inputs are quoted prices available in active markets for identical investments as of the measurement date. The type of investments included in Level 1 include marketable securities that are primarily traded on one or more of the U.S. national securities exchanges, the Nasdaq Stock Market or any foreign stock exchange. The fair value is determined to be the last sale price on the determination date, or, if no sales occurred on that date, the closing bid price on the determination date. In accordance with authoritative guidance, the Fund does not apply a blockage discount to the quoted price for these investments, even in situations where the Fund holds a large position in an investment and a sale could reasonably impact the quoted price. |
| ● | Level 2 – Pricing inputs are observable inputs other than quoted prices for identical assets in active markets (i.e., not Level 1 inputs). Fair value is determined using models or other valuation methodologies through direct or indirect corroboration with observable market data. Investments that are generally included in this category include corporate notes, convertible notes, warrants and restricted public equity securities. The fair value of legally restricted equity securities may be discounted depending on the likely impact of the restrictions on liquidity and the Adviser’s estimates. |
| ● | Level 3 – Pricing inputs are unobservable for the investment and include situations where there is little, if any, market activity for the investment. The inputs into the determination of fair value require significant management judgment and/or estimation. Investments that are included in this category are private equity and debt investments, as well as convertible notes and warrants that are not actively traded. The fair value for investments using Level 3 pricing inputs is based on the Adviser’s estimates that consider a combination of various factors and performance measurements. These factors and measurements include the timing of the transaction; the market in which the investment operates; comparable market transactions; operational performance and projections of the investments; various performance multiples as applied to earnings before interest, taxes, depreciation, and amortization or a similar measure of earnings for the latest reporting period or a forward period; brokers’ quotes; and discounted cash flow analysis. |
Due to the inherent uncertainty of estimates, fair value determinations based on estimates may materially differ from the values that would have been used had a ready market for the securities existed. The following is a summary of the Fund's investments classified in the fair value hierarchy as of June 30, 2026:
| Investments | Level 1 | Level 2 | Level 3 | Total | ||||||||||||
| Direct Investments: | ||||||||||||||||
| Direct Equity Investments | $ | — | $ | — | $ | 114,538,319 | $ | 114,538,319 | ||||||||
| Total Direct Investments | $ | — | $ | — | $ | 114,538,319 | $ | 114,538,319 | ||||||||
| Secondary Investments | — | — | 136,214,475 | 136,214,475 | ||||||||||||
| Primary Investments | — | — | 10,874,285 | 10,874,285 | ||||||||||||
| Cash Equivalents | 44,479,029 | — | — | 44,479,029 | ||||||||||||
| Total Investments | $ | 44,479,029 | $ | — | $ | 261,627,079 | $ | 306,106,108 | ||||||||
| Other Financial Instruments | ||||||||||||||||
| Assets | ||||||||||||||||
| Foreign Currency Exchange Contracts | $ | — | $ | 1,900,718 | $ | — | $ | 1,900,718 | ||||||||
| Total Assets | $ | — | $ | 1,900,718 | $ | — | $ | 1,900,718 | ||||||||
| Liabilities | ||||||||||||||||
| Foreign Currency Exchange Contracts | $ | — | $ | (28,256 | ) | $ | — | $ | (28,256 | ) | ||||||
| Total Liabilities | $ | — | $ | (28,256 | ) | $ | — | $ | (28,256 | ) | ||||||
| Total Investments Net of Foreign Currency Exchange Contracts | $ | 44,479,029 | $ | 1,872,462 | $ | 261,627,079 | $ | 307,978,570 | ||||||||
The following is a reconciliation of the amount of the account balances on April 1, 2026 and June 30, 2026 of those investments in which significant unobservable inputs (Level 3) were used in determining value:
Balance as of April 1, 2026 | Realized Gain/(Loss) | Net Change in Unrealized Appreciation/ (Depreciation) | Gross Purchases | Gross Sales | Net (Premium) | Net Transfers In or Out of Level 3 | Balance as of June 30, 2026 | |||||||||||||||||||||||||
| Direct Investments: | ||||||||||||||||||||||||||||||||
| Direct Equity Investments | $ | 78,592,915 | $ | — | $ | 13,566,456 | $ | 23,610,870 | $ | (1,231,922 | ) | $ | — | $ | — | $ | 114,538,319 | |||||||||||||||
| Total Direct Investments* | $ | 78,592,915 | $ | — | $ | 13,566,456 | $ | 23,610,870 | $ | (1,231,922 | ) | $ | — | $ | — | $ | 114,538,319 | |||||||||||||||
| Secondary Investments* | 112,543,981 | 10,395 | 1,882,466 | 27,155,637 | (5,378,004 | ) | — | — | 136,214,475 | |||||||||||||||||||||||
| Primary Investments* | 9,244,390 | — | 108,799 | 1,942,193 | (421,097 | ) | — | — | 10,874,285 | |||||||||||||||||||||||
| Total | $ | 200,381,286 | $ | 10,395 | $ | 15,557,721 | $ | 52,708,700 | $ | (7,031,023 | ) | $ | — | $ | — | $ | 261,627,079 | |||||||||||||||
| * | For the purposes of the tables above: (i) “Direct Investments” are private investments directly in the equity or debt of selected operating companies, often together with the management of the investee operating company; (ii) “Primary Investments” are investments in newly established private equity partnerships where underlying portfolio companies are generally not known as of the time of investment; and “Secondary Investments” are single or portfolios of assets acquired on the secondary market. However, in the private equity market sector the term “Secondary Investments” is generally understood to mean Private Equity Fund Investments acquired in the secondary market. Notwithstanding the foregoing, if the Fund reasonably determines that the strict application of the above definitions would not reflect the economic substance of any investment, the Fund may re-classify such investment as it deems appropriate. |
Changes in inputs or methods used for valuing investments may result in transfers in or out of levels within the fair value hierarchy. The inputs or methods used for valuing investments may not necessarily be an indication of the risk associated with investing in those investments. Transfers between levels of the fair value hierarchy are reported at the beginning of the reporting period in which they occur.
The amount of the net change in unrealized appreciation (depreciation) for the three months ended June 30, 2026 relating to investments in Level 3 assets still held at June 30, 2026 is $15,557,721 which is included as a component of net change in unrealized appreciation (depreciation) on investments on the Consolidated Statement of Operations.
The following is a summary of quantitative information about significant unobservable valuation inputs approved by the Adviser for Level 3 Fair Value Measurements for investments held as of June 30, 2026:
| Type of Security | Fair Value at June 30, 2026 (000’s)* | Valuation Technique(s) | Unobservable Input | Range (weighted average) | ||||||
| Direct Investments: | ||||||||||
| Direct Equity | $ | 22,461 | Discounted cash flow | Discount factor | 8.50% – 16.54% (9.56%) | |||||
| 70,649 | Market comparable companies | Enterprise value to EBITDA multiple | 5.36x – 18.00x (11.20x) | |||||||
| 21,428 | Recent financing/transaction | Recent transaction price | n/a | |||||||
| Primary and Secondary Investments | $ | 147,089 | Adjusted reported net asset value | Reported net asset value | n/a | |||||
| * | Level 3 fair value includes accrued interest. |
Level 3 Direct Equity Investments valued using an unobservable input are directly affected by a change in that input. For Direct Investments, significant increases or decreases in these inputs in isolation would result in a significantly lower or higher fair value measurements.
Forward Foreign Currency Exchange Contracts
The Fund may enter forward foreign currency exchange contracts to manage foreign exchange rate risk. These contracts for the purchase or sale of a specific foreign currency at a fixed price on a future date may be entered into as a hedge against either specific transactions or portfolio positions. The objective of the Fund’s foreign currency hedging transactions is to reduce the risk that the U.S. Dollar value of the Fund’s foreign currency denominated investments will decline due to changes in foreign currency exchange rates. All forward foreign currency exchange contracts are “marked-to-market” daily at the applicable translation rates resulting in unrealized gains or losses. Realized gains or losses are recorded at the time the forward foreign currency exchange contract is offset by entering a closing transaction or by the delivery or receipt of the currency. The risk that counterparties may be unable to meet the terms of their contracts and the risk of unanticipated movements in the value of a foreign currency relative to the U.S. Dollar are inherent in forward foreign currency exchange contracts.
During the three months ended June 30, 2026, the Fund entered into 10 long/short forward foreign currency exchange contracts. The Fund had $(268,640) in net realized gains (losses) and $1,065,280 change in net unrealized appreciation (depreciation) on forward foreign currency contracts. The outstanding forward foreign currency exchange contract amounts at June 30, 2026 are representative of contract amounts during the period.
Subsequent Events
Management has evaluated the impact of all subsequent events on the Fund and determined that there were no subsequent events that require disclosure in the consolidated financial statements.