Shareholder Report
Jun. 30, 2026
USD ($)
$ / shares
WHAT WERE THE FUND COSTS FOR THE PAST YEAR? (based on a hypothetical $10,000 investment)
|
Class Name
|
Costs of a $10,000 investment
|
Costs paid as a percentage of a $10,000 investment
|
|
Institutional Class
|
$106
|
1.00%
|
HOW DID THE FUND PERFORM LAST YEAR AND WHAT AFFECTED ITS PERFORMANCE?
The past 12 months was again volatile, swinging on the Supreme Court’s rejection of the administration’s emergency tariff authority, to the outbreak of the U.S.–Iran conflict and the closure of the Strait of Hormuz late in the first quarter, to one of the strongest quarterly recoveries in twenty years during the second quarter of 2026. Much of the daily gyration was still driven by happenings in Washington, but this past year it was war and the resulting energy shock that did the most damage, taking the S&P 500 to the edge of correction territory before it recovered to a series of new record highs. Behind the headline news the Federal Reserve was less of a steadying factor than it was a year ago. After three cuts in late 2025 the Fed has sat at 3.50% to 3.75% all year. What seems to have powered the markets to new highs regularly is another 12 months of solid corporate earnings growth, and an expectation that it continues into 2027. The welcome change from last year is that the market is no longer so narrow. The Magnificent Seven actually detracted from index returns in the first half of 2026, leadership rotated into semiconductors, memory, and AI infrastructure, and the equal-weighted index, mid-caps, small caps, and international markets all participated. We remain cautiously optimistic on the U.S. economy over the next 12 months, but the risks have shifted: a Fed that might hike rates in an election year, a re-escalation in the Middle East, November midterms, and an AI capital spending cycle that dominates the market’s attention and earnings growth expectations. Equity markets are either oblivious to the risks or are just the best option in a troubled investing world. More likely the latter than the former. We continue to see pockets of value and are positioning the portfolio to weather the inevitable storms that lay on the horizon.
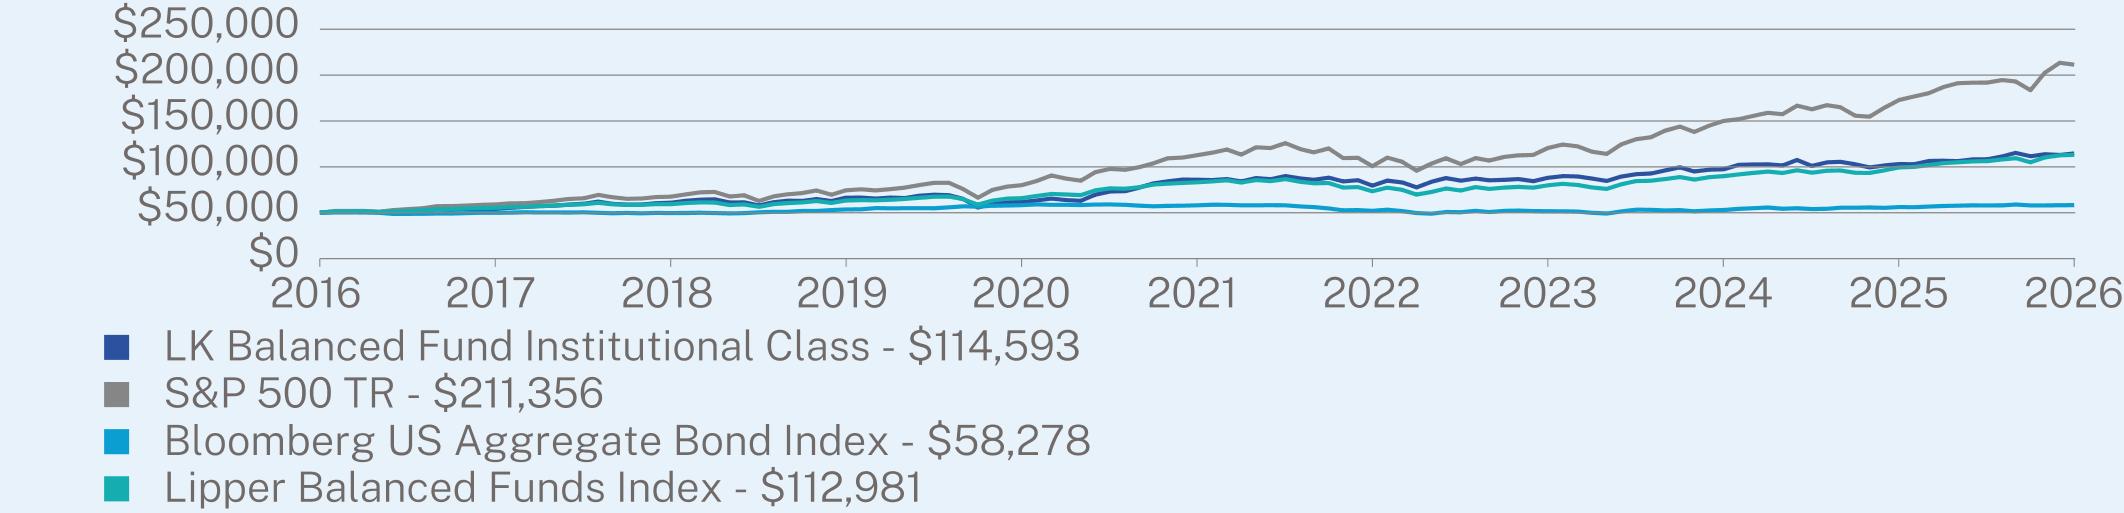
ANNUAL AVERAGE TOTAL RETURN (%)
|
|
1 Year
|
5 Year
|
10 Year
|
|
Institutional Class (without sales charge)
|
11.23
|
5.93
|
8.65
|
|
S&P 500 TR
|
22.32
|
13.41
|
15.51
|
|
Bloomberg US Aggregate Bond Index
|
3.79
|
0.08
|
1.54
|
|
Lipper Balanced Funds Index
|
13.79
|
6.32
|
8.49
|
Visit https://www.lkfunds.com/#literature for more recent performance information.
KEY FUND STATISTICS (as of June 30, 2026)
|
Net Assets
|
$26,286,943
|
|
Number of Holdings
|
50
|
|
Net Advisory Fee
|
$47,705
|
|
Portfolio Turnover
|
31%
|
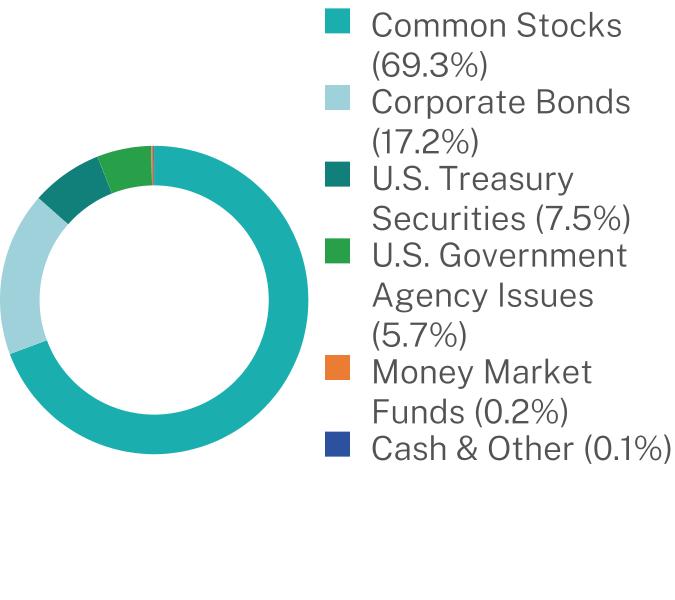
WHAT DID THE FUND INVEST IN? (as of June 30, 2026)
Security Type Breakdown (%)
|
Top 10 Issuers
|
(%)
|
|
|
United States Treasury Note/Bond
|
7.5
|
%
|
|
Texas Pacific Land
|
4.3
|
%
|
|
Berkshire Hathaway
|
3.8
|
%
|
|
Federal Home Loan Banks
|
3.8
|
%
|
|
Alphabet
|
3.4
|
%
|
|
Phillips 66
|
3.0
|
%
|
|
Cullen Frost Bankers
|
2.9
|
%
|
|
Aflac
|
2.9
|
%
|
|
Johnson & Johnson
|
2.9
|
%
|
|
Fifth Third Bancorp
|
2.8
|
%
|