Prior to November 1, 2017, the Fund was managed by C&O Funds Advisor, Inc. As of November 1, 2017, Gator, which is unaffiliated with the prior manager, took over as investment adviser to the Fund. The following performance information provides some indication of the risks of investing in the Fund. The bar chart below illustrates how the Fund’s total returns have varied from year to year. The table below illustrates how the Fund’s average annual total returns for 1, 5 and 10 years compare with those of a broad measure of market performance. The Fund’s past performance (before and after taxes) is not necessarily an indicator of how the Fund will perform in the future. Updated performance information is available on the Fund’s website at https://gatorcapital.com/mutual-funds/ or by calling the Fund toll-free at (800) 467-7903.
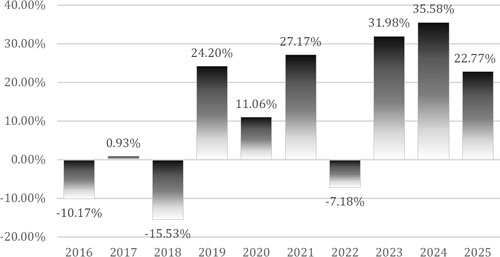
Best Quarter (in the last ten years): 4th quarter 2020, 31.51%
Worst Quarter (in the last ten years): 1st quarter 2020, (37.67)%
The Fund’s calendar year-to-date return as of June 30, 2026 was 7.04%.
After-tax returns are calculated using the historical highest individual U.S. federal marginal income tax rates and do not reflect the impact of state and local taxes. Actual after-tax returns depend on an investor’s tax situation and may differ from those shown. After-tax returns shown are not relevant to investors who hold their Fund shares through tax-deferred arrangements such as 401(k) plans or individual retirement accounts (IRAs). In certain cases, the figure representing “Return After Taxes on Distributions and Sale of Fund Shares” may be higher (more favorable) than the other return figures for the same period. A higher after-tax return results when a capital loss occurs upon redemption and translates into an assumed tax deduction that benefits the shareholder.
| Gator Capital Long/Short Fund | 1 Year | 5 Years | 10 Years |
| Return Before Taxes | 22.77% | 20.99% | 10.60% |
| Return After Taxes on Distributions | 21.50% | 20.70% | 10.47% |
| Return After Taxes on Distributions and Sale of Fund Shares | 14.40% | 17.22% | 8.80% |
| S&P
500® Total Return Index (reflects no deduction for fees, expenses or taxes) |
17.88% | 14.42% | 14.82% |
| Morningstar
Long/ Short Equity Category (reflects no deduction for fees, expenses or taxes) |
10.08% | 9.65% | 7.81% |
| Eurekahedge
Long Short Equities Hedge Fund Index (reflects no deduction for fees, expenses or taxes) |
15.22% | 6.75% | 7.50% |
The S&P 500® Total Return Index is a capitalization-weighted, unmanaged index of 500 large U.S. companies chosen for market capitalization, liquidity and industry group representation and includes reinvested dividends. You cannot invest directly in an index. The Morningstar Long/Short Equity Category represents portfolios that hold both long and short positions in equities, exchange-traded funds, and derivatives, aiming to reduce volatility and provide market exposure with less downside risk.
Prior to May 12, 2026, Eurekahedge Long Short Equities Hedge Fund Index (“Eurekahedge Index”) was the Fund’s secondary benchmark. According to its sponsor, Eurekahedge Pte. Ltd., the Eurekahedge Index is an equally weighted index of 1042 constituent funds designed to provide a broad measure of the performance of underlying hedge fund managers. The returns of the Eurekahedge Index do not include sales charges or fees, which would lower performance. You cannot invest directly in an index. Effective December 31, 2025, the Eurekahedge Index ceased to be published.