Performance: The following bar chart and table provide some indication of the risks of investing in the Fund. The Fund is adopting the performance of the Predecessor Mutual Fund as the result of the Reorganization. Prior to the Reorganization, the Fund had not yet commenced operations. The bar chart shows changes in the Predecessor Mutual Fund’s performance from year to year (represented by the performance of the Predecessor Mutual Fund’s Class I Shares). The table shows how the Predecessor Mutual Fund’s average annual returns (represented by the average annual returns of the Predecessor Mutual Fund’s Class I Shares) for 1 year and since inception compared with those of an appropriate broad-based securities market index and additional securities market indexes. Effective as of the Reorganization, the ICE BofA Low Duration U.S. ABS & CMBS Equal Par Index replaced the Bloomberg U.S. Mortgage-Backed Securities (MBS) Index as the Fund’s secondary benchmark index because the Adviser believes it more closely reflects the market segment in which the Fund invests. Had the Predecessor Mutual Fund been structured as an ETF, its performance may have differed. The Fund’s (and the Predecessor Mutual Fund’s) past performance (before and after taxes) is not necessarily an indication of how the Fund will perform in the future. Updated performance information will be available at no cost by visiting https://tcw.com or by calling (866) 364-1383.
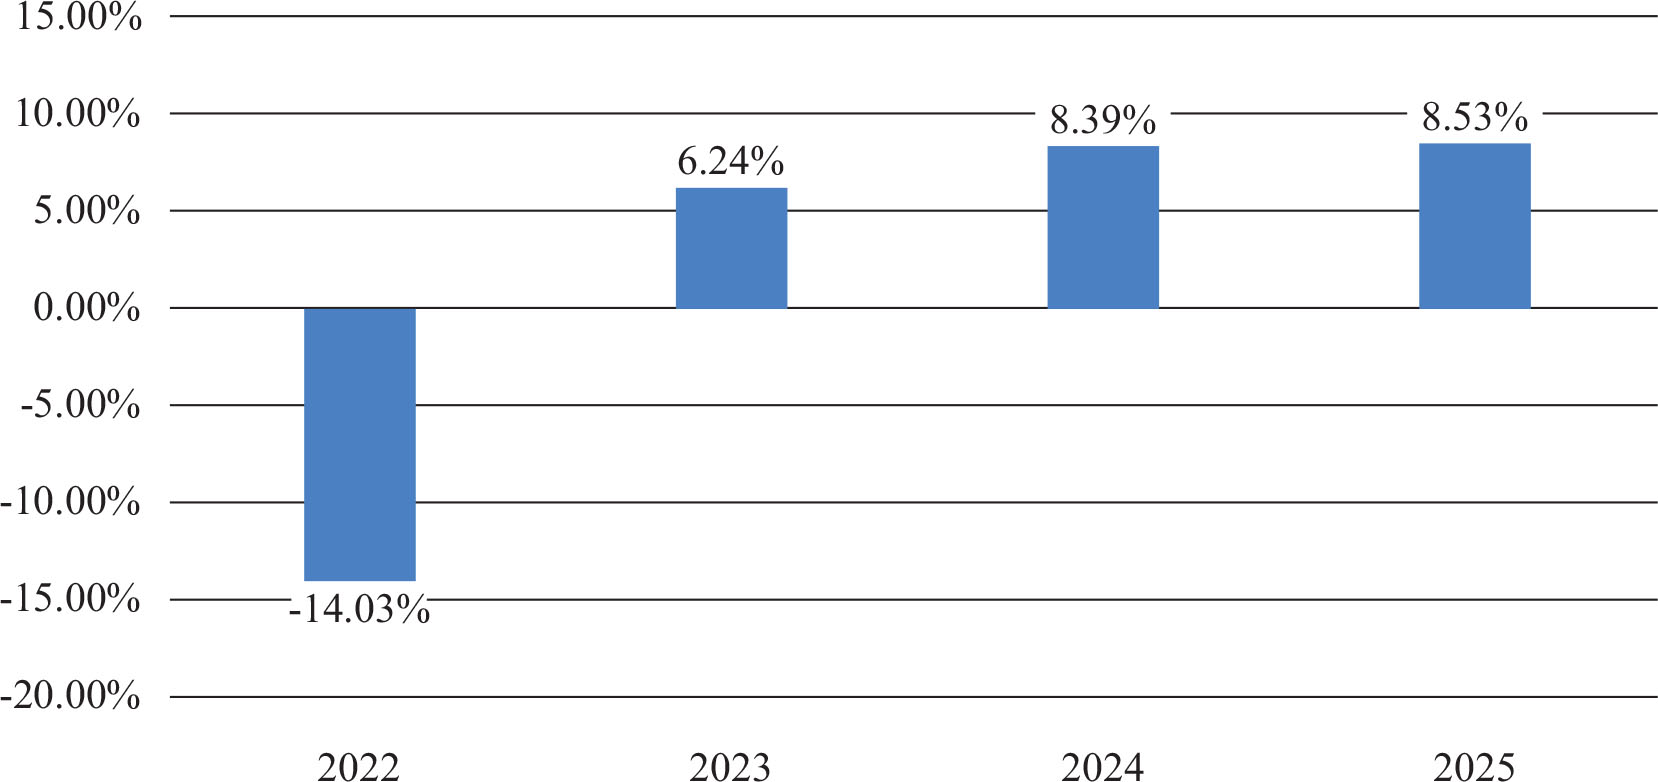
| * | For the period shown in the bar chart above: |
| Best Quarter | (quarter ended 12/31/2023) | 8.57% | ||
| Worst Quarter | (quarter ended 3/31/2022) | -5.54% |
| 1 Year | Since Inception |
|||||||
| Return Before Taxes | 8.53 | % | 1.62 | % | ||||
| Return After Taxes on Distributions | 6.36 | % | -0.26 | % | ||||
| Return After Taxes on Distributions and Sale of Fund Shares | 5.00 | % | 0.39 | %(1) | ||||
| Bloomberg U.S. Aggregate Bond Index(2) | 7.30 | % | 4.02 | % | ||||
| ICE BofA Low Duration U.S. ABS & CMBS Equal Par Index(3) | 5.89 | % | 3.18 | % | ||||
| Bloomberg U.S. Mortgage-Backed Securities (MBS) Index(4) | 8.58 | % | 0.33 | % | ||||
| (1) | The “After Taxes on Distributions and Sale of Shares” return is higher than the “After Taxes on Distributions” return because of realized losses that would have been sustained upon sale of Fund shares immediately after the relevant period. |
| (2) | The Bloomberg U.S. Aggregate Bond Index is a broad-based benchmark that measures the investment grade, U.S. dollar-denominated, fixed-rate taxable bond market. This includes Treasuries, government-related and corporate securities, mortgage-backed securities, asset-backed securities and collateralized mortgage-backed securities. |
| (3) | The ICE BofA Low Duration U.S. ABS & CMBS Equal Par Index measures the performance of short-term, U.S. dollar-denominated, investment grade, fixed and floating rate asset-backed securities (“ABS”) and commercial mortgage-backed securities (“CMBS”) publicly issued in the U.S. domestic market. |
| (4) | The Bloomberg U.S. Mortgage-Backed Securities (MBS) Index tracks fixed-rate agency mortgage backed pass-through securities guaranteed by Ginnie Mae, Fannie Mae, and Freddie Mac. |
The Predecessor Mutual Fund’s fiscal year end is March 31. The Fund’s fiscal year end is October 31. The Predecessor Mutual Fund’s most recent quarterly return (since the end of the last fiscal year) through the end of the most recent quarter (June 30, 2026) was 0.81%.