Pay Versus Performance
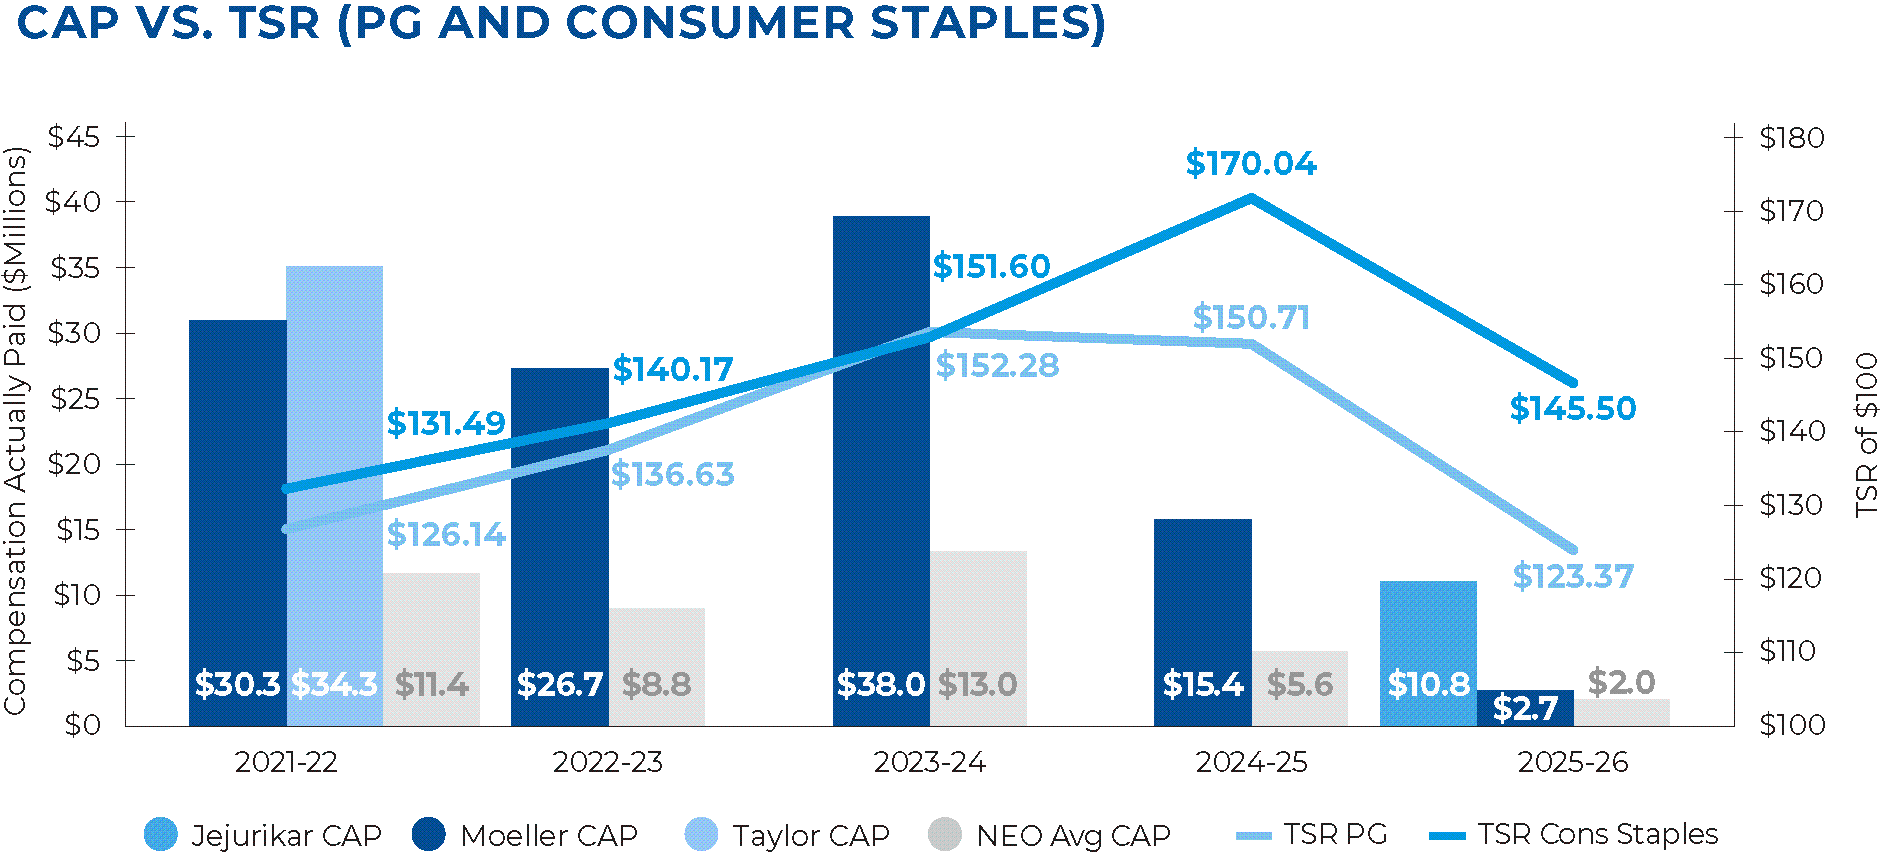
As discussed in the Compensation Discussion and Analysis section above, our fundamental and overriding objective is to create value for our shareholders at leadership levels on a consistent long-term basis. The C&LD Committee approaches CEO and overall executive compensation with an emphasis on Pay for Performance through alignment of our incentive compensation program outcomes with successful execution of our business strategies. Payouts are intended to reward executives who achieve or exceed Company and business unit goals, with lower or no payouts when executives do not meet goals. Equity awards are a key component of executive compensation with the goal of driving Total Shareholder Return through the use of stock options and time-vested RSUs under the LTIP and PSUs under the PSP.
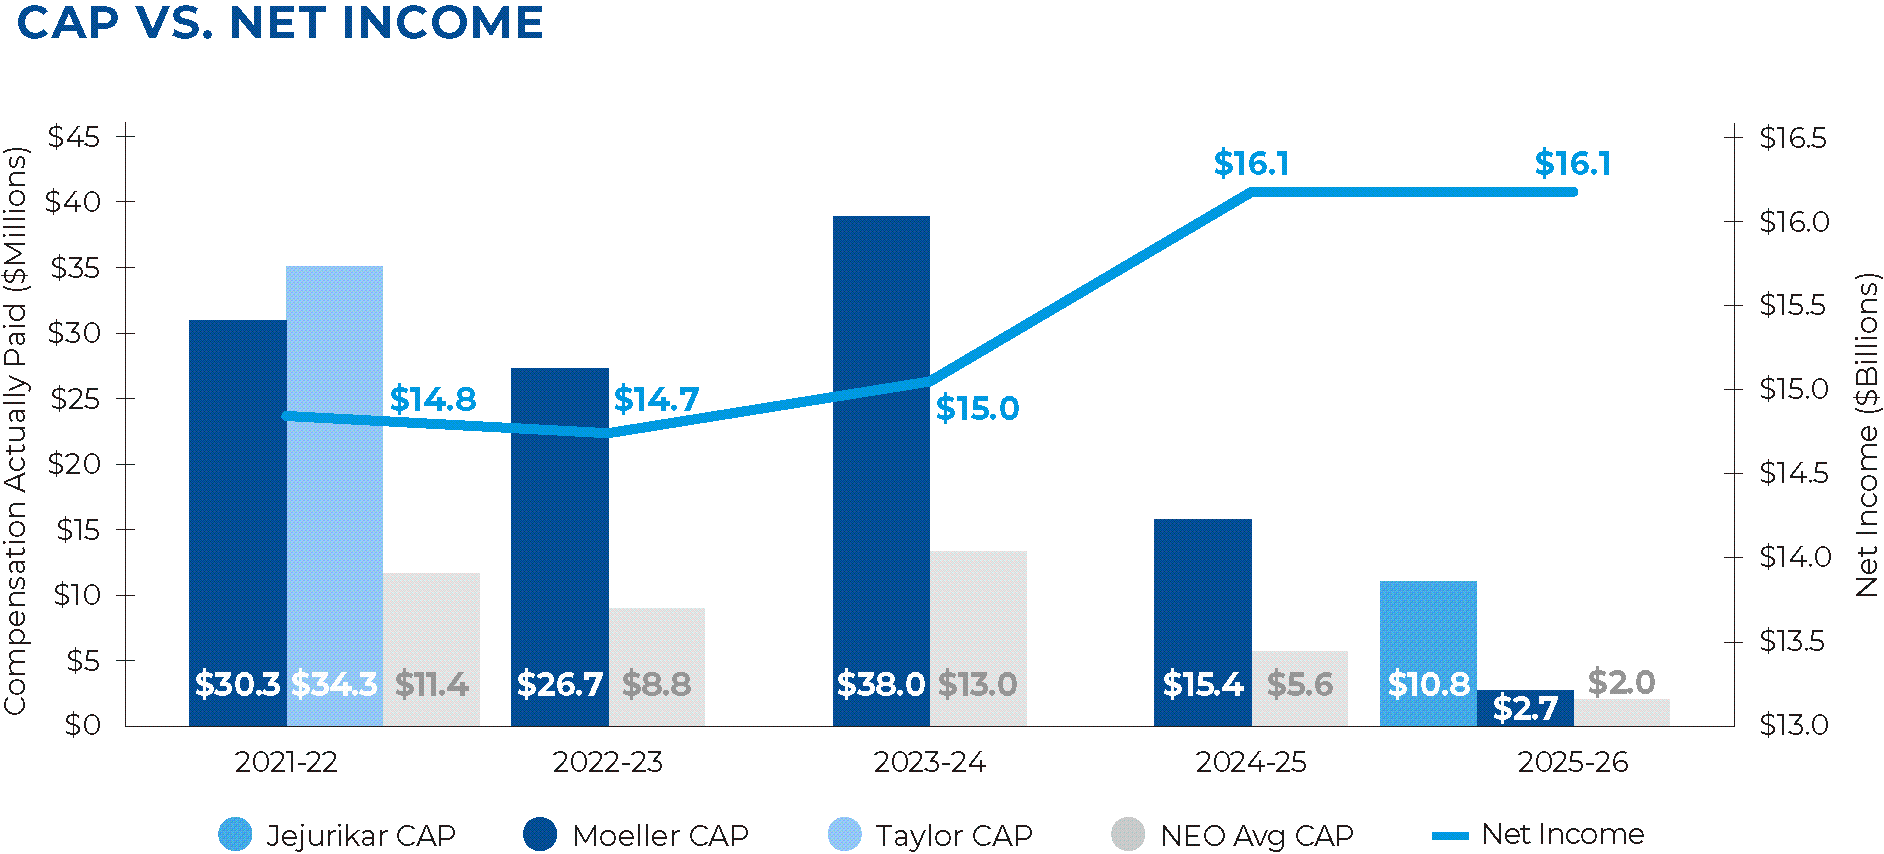
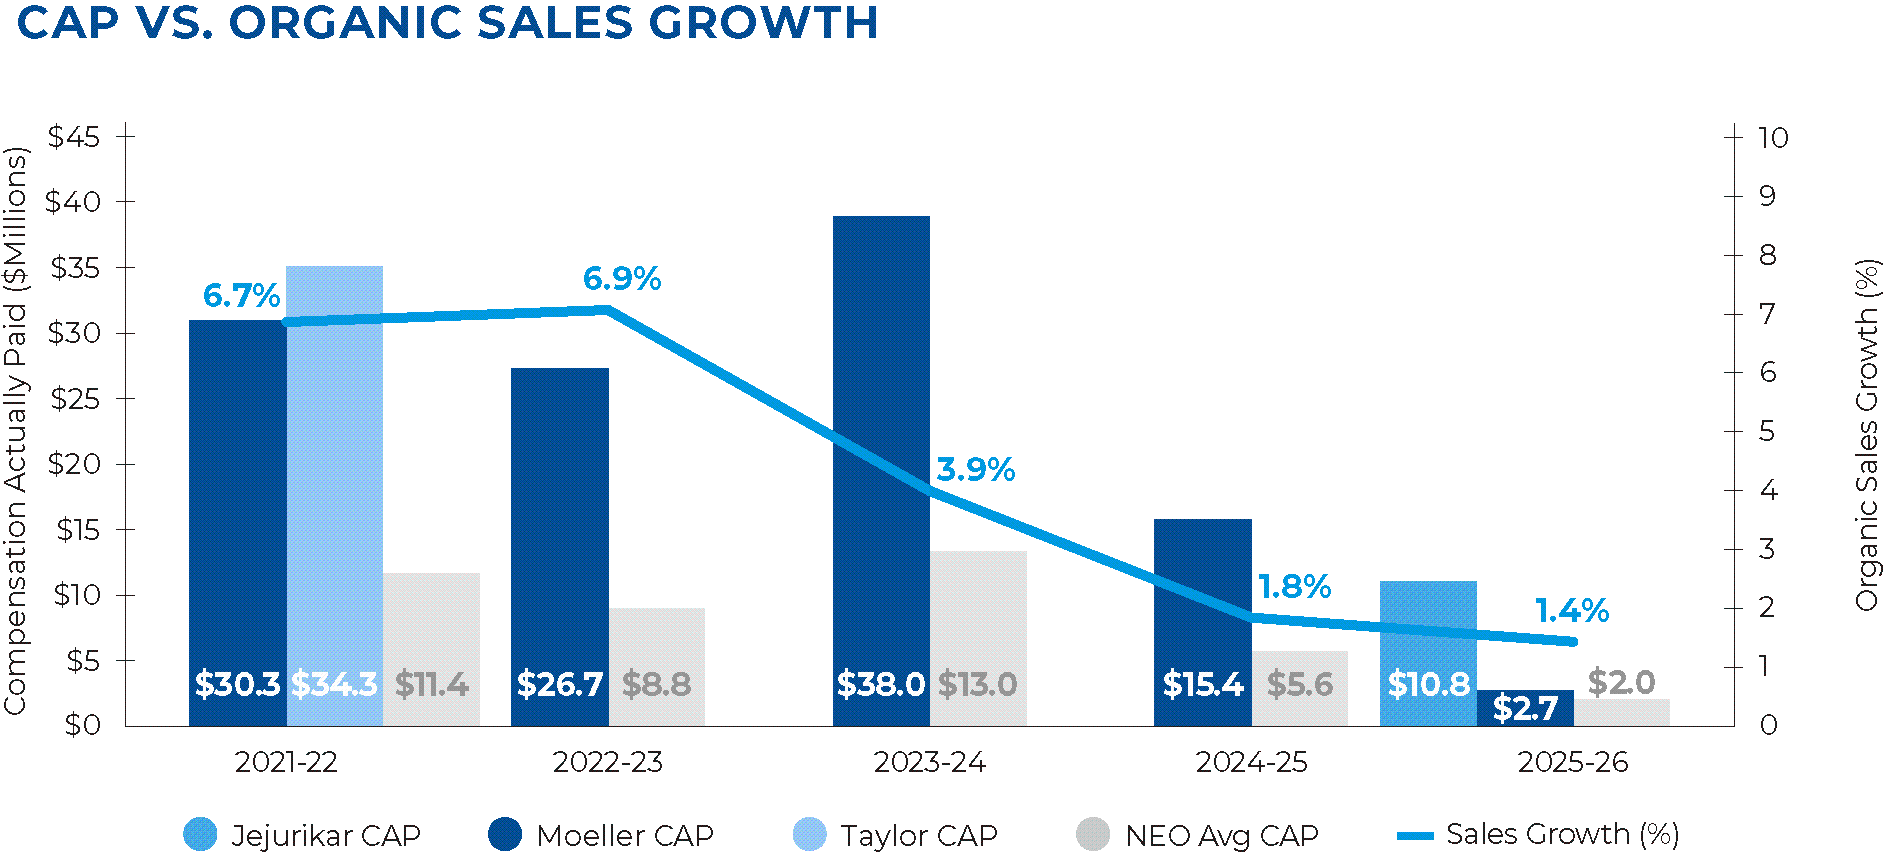
As required by Section 953(a) of the Dodd-Frank Wall Street Reform and Consumer Protection Act, and Item 402(v) of Regulation S-K, we are providing the following information about the relationship between “compensation actually paid” to our CEO and to our other non-CEO NEOs and certain financial performance measures of the Company for the past five fiscal years. Compensation actually paid (“CAP”), as determined under SEC requirements, does not reflect the actual amount of compensation earned by or paid to our executive officers during a covered year.
Pay Versus Performance (PVP) Table
|
|
|
|
|
|
|
|
|
Value of Initial Fixed $100 Investment Based on |
|
|
|
Year |
Summary Compensation |
Compensation Actually |
SCT |
Compensation |
SCT Total |
Compensation |
Average |
Average |
P&G TSR |
Peer Group TSR |
Net Income |
Organic Sales Growth5 |
(a) |
(b) |
(c) |
|
|
|
|
(d) |
(e) |
(f) |
(g) |
(h) |
(i) |
2025-26 |
18,976,742 |
10,804,041 |
19,073,909 |
2,707,148 |
|
|
6,959,950 |
2,024,214 |
123.37 |
145.50 |
16.1 |
1.4% |
2024-25 |
|
|
21,909,816 |
15,425,410 |
|
|
7,832,698 |
5,563,035 |
150.71 |
170.04 |
16.1 |
1.8% |
2023-24 |
|
|
22,963,881 |
37,998,329 |
|
|
8,191,635 |
12,964,390 |
152.28 |
151.60 |
15.0 |
3.9% |
2022-23 |
|
|
21,715,625 |
26,736,735 |
|
|
7,174,555 |
8,811,521 |
136.63 |
140.17 |
14.7 |
6.9% |
2021-22 |
|
|
17,716,015 |
30,332,659 |
18,595,382 |
34,333,232 |
6,783,743 |
11,363,522 |
126.14 |
131.49 |
14.8 |
6.7% |
(1) |
Mr. Jejurikar served 6 months as CEO during the second half of FY 2025-26. Mr. Moeller served as CEO for 6 months during the first half of FY 2025-26 and as Executive Chairman of the Board for 7 months from January 1, 2026 through his retirement from the Board on July 31, 2026. Mr. Moeller previously served as CEO for the entirety of FY 2022-23 through FY 2024-25. David Taylor is listed as the additional CEO in FY 2021-22. Mr. Taylor served 4 months as CEO and 8 months as Executive Chairman of the Board before retiring at the end of FY 2021-22. Mr. Moeller served 8 months as CEO in FY 2021-22.. |
|
(2) |
See section titled “Compensation Actually Paid Reconciliation” below for details on the CAP calculation. |
|
(3) |
The following non-CEO NEOs are included in the average compensation in columns (d) and (e) for each respective fiscal year above: |
|
|
• |
FY 2025-26 represented compensation for Andre Schulten, Gary A. Coombe, Marc S. Pritchard, Sundar G. Raman, Jennifer L. Davis, and Ma. Fatima D. Francisco |
|
• |
FY 2024-25 represented compensation for Andre Schulten, Shailesh G. Jejurikar, Jennifer L. Davis, and Sundar G. Raman |
|
• |
FY 2023-24 represented compensation for Andre Schulten, Shailesh G. Jejurikar, Ma. Fatima D. Francisco, and R. Alexandra Keith |
|
• |
FY 2022-23 represented compensation for Andre Schulten, Shailesh G. Jejurikar, Ma. Fatima D. Francisco, and R. Alexandra Keith |
|
• |
FY 2021-22 represented compensation for Andre Schulten, Shailesh G. Jejurikar, Ma. Fatima D. Francisco, R. Alexandra Keith, and Carolyn Tastad |
(4) |
The peer group used for the Pay versus Performance table is the S&P 500 Consumer Staples Index (SP500.30). |
|
(5) |
In accordance with SEC rules, the Company is required to include in the Pay versus Performance table the “most important” financial performance measures (as determined by the Company) used to link compensation actually paid to our executive officers to Company performance for the most recently completed fiscal year. The Company determined that Organic Sales Growth, which is a key driver of our annual and long-term incentive payouts, meets this requirement and therefore, we have included this performance measure in the Pay versus Performance table. Organic Sales Growth is a measure of sales growth excluding the impacts of acquisitions and divestitures and foreign exchange from year-over-year comparisons. See Exhibit A for a reconciliation of Organic Sales Growth to Net Sales Growth. |
|
Compensation Actually Paid Reconciliation
The tables below provide the reconciliation between the equity amounts reported in the Summary Compensation Table (“SCT”) and those used to calculate CAP for the CEOs and the average of all other NEOs. As described in the Compensation Discussion and Analysis section, our NEOs receive equity awards under the PSP, LTIP, and Retirement Restoration Programs. NEOs receive PSUs in the PSP program, retirement restricted RSUs in the Retirement Restoration Programs, and may select between stock options and RSUs in 25% increments in the LTIP program, except the CEO for whom the C&LD Committee determines the appropriate mix of stock options and RSUs. Measurement of vested and unvested stock option awards uses the same lattice model used for financial statement reporting purposes, while PSUs are re-valued using the same Monte Carlo simulation used for financial statement reporting purposes.
|
2025-26 |
2024-25 |
2023-24 |
2022-23 |
2021-22 |
|
||
Adjustments |
CEO(a) |
CEO(a) |
CEO(a) |
CEO(a) |
CEO(a) |
CEO(a) |
CEO(a) |
|
Summary Compensation Table Total |
18,976,742 |
19,073,909 |
21,909,816 |
22,963,881 |
21,715,625 |
18,595,382 |
17,716,015 |
|
(Deduct): Aggregate grant date fair value for stock awards and option awards included in the SCT (b) |
(14,535,219) |
(15,807,598) |
(18,082,160) |
(16,901,830) |
(14,997,563) |
(13,552,685) |
(12,044,670) |
|
Add: Fair value at fiscal year end of awards granted during the covered fiscal year that were outstanding and unvested at fiscal year end (c) |
13,157,944 |
14,051,539 |
11,863,926 |
21,316,676 |
18,527,276 |
12,022,907 |
14,208,859 |
|
Add: Year-over-year change in fair value at fiscal year end of awards granted in any prior fiscal year that were outstanding and unvested at the fiscal year end (d) |
(2,233,311) |
(5,049,043) |
(2,924,340) |
6,319,870 |
1,100,946 |
8,156,040 |
5,143,672 |
|
Add: Fair value at vesting date of Stock Awards and Options granted and vested during the fiscal year (e) |
115,672 |
379,673 |
360,238 |
351,275 |
281,459 |
339,121 |
205,328 |
|
Add/(Deduct): Change as of the vesting date (from the end of the prior fiscal year) in fair value of awards granted in any prior fiscal year for which vesting conditions were satisfied during the fiscal year (f) |
(3,648,787) |
(9,941,332) |
2,297,931 |
3,948,457 |
108,992 |
8,772,467 |
5,103,456 |
|
Add: Fair value at end of prior fiscal year of awards granted in any prior fiscal year that failed to meet the applicable vesting conditions during the covered fiscal year (g) |
0 |
0 |
0 |
0 |
0 |
0 |
0 |
|
(Deduct): Aggregate change in the actuarial present value of the accumulated benefit under any pension plan (h) |
(1,029,000) |
0 |
0 |
0 |
0 |
0 |
0 |
|
Add: Aggregate service cost and prior service cost for pension plans (i) |
0 |
0 |
0 |
0 |
0 |
0 |
0 |
|
Total value of adjustments |
(8,172,701) |
(16,366,761) |
(6,484,406) |
15,034,448 |
5,021,110 |
15,737,850 |
12,616,645 |
|
CAP Amounts (as calculated) |
10,804,041 |
2,707,148 |
15,425,410 |
37,998,329 |
26,736,735 |
34,333,232 |
30,332,659 |
|
For the “Other NEOs Average” columns below, all amounts reflect the average of the values for the applicable NEOs in each fiscal year in accordance with SEC rules.
|
|
Other NEOs Average |
|
||||
Adjustments |
|
2025-26 |
2024-25 |
2023-24 |
2022-23 |
2021-22 |
|
Summary Compensation Table Total |
|
6,959,950 |
7,832,698 |
8,191,635 |
7,174,555 |
6,783,743 |
|
(Deduct): Aggregate grant date fair value for stock awards and option awards included in the SCT (b) |
|
(4,902,762) |
(5,565,296) |
(5,256,231) |
(4,441,759) |
(4,432,973) |
|
Add: Fair value at fiscal year end of awards granted during the covered fiscal year that were outstanding and unvested at fiscal year end (c) |
|
4,288,547 |
3,562,295 |
6,620,680 |
5,502,775 |
5,110,606 |
|
Add: Year-over-year change in fair value at fiscal year end of awards granted in any prior fiscal year that were outstanding and unvested at the fiscal year end (d) |
|
(1,368,889) |
(932,960) |
2,152,092 |
494,333 |
2,005,209 |
|
Add: Fair value at vesting date of Stock Awards and Options granted and vested during the fiscal year (e) |
|
181,005 |
134,817 |
138,791 |
120,064 |
96,519 |
|
Add/(Deduct): Change as of the vesting date (from the end of the prior fiscal year) in fair value of awards granted in any prior fiscal year for which vesting conditions were satisfied during the fiscal year (f) |
|
(3,086,469) |
696,732 |
1,315,673 |
(28,946) |
1,800,418 |
|
Add: Fair value at end of prior fiscal year of awards granted in any prior fiscal year that failed to meet the applicable vesting conditions during the covered fiscal year (g) |
|
0 |
0 |
0 |
0 |
0 |
|
(Deduct): Aggregate change in the actuarial present value of the accumulated benefit under any pension plan (h) |
|
(47,167) |
(165,250) |
(198,250) |
(9,500) |
- |
|
Add: Aggregate service cost and prior service cost for pension plans (i) |
|
0 |
0 |
0 |
0 |
0 |
|
Total value of adjustments |
|
(4,935,735) |
(2,269,662) |
4,772,755 |
1,636,966 |
4,579,779 |
|
CAP Amounts (as calculated) |
|
2,024,214 |
5,563,035 |
12,964,390 |
8,811,521 |
11,363,522 |
|
a) |
See footnote (1) under the PVP table for explanation. |
b) |
Represents the aggregate grant date fair value as of the indicated fiscal year of the RSUs, PSUs, and options granted to the CEO, and the additional CEO in FY 2021-22 and FY 2025-26, and the average grant date fair values for the respective NEOs as applicable for each year, during such fiscal year, calculated using the same methodology used for financial statement reporting purposes. |
c) |
Represents the aggregate fair value as of the indicated fiscal year end of outstanding and unvested stock awards and option awards granted during such fiscal year. Stock option fair values are calculated using an industry standard lattice-based valuation model as of the measurement date, which is based on the stock price and assumptions (i.e., term, volatility, dividend yield, risk free rates) as of the measurement date. PSU fair values are calculated using the stock price and a Monte Carlo simulation as of the measurement date, as well as a modifier for forecasted performance. RSU fair values as of the measurement date are calculated using the stock price on the measurement date plus accrued dividends. In FY 2021-22, the additional CEO (Mr. Taylor) as well as one non-CEO NEO retired on June 30, 2022, and, as such, the fair value of their 2022 options, RSUs and PSUs were prorated at 75% to reflect their fiscal year service and did not vest until October and August 2025, respectively. |
d) |
Represents the aggregate change in fair value during the indicated fiscal year of the outstanding and unvested RSUs, PSUs, and options. See footnote (c) above for information about our equity valuations. |
e) |
Represents the aggregate fair value at vesting of RSUs, PSUs, and options that were granted and vested during the indicated fiscal year. See footnote (c) above for information about our equity valuations. Amounts in this row reflect the annual grant of RSUs under our PST Restoration Program and IRP, which is described in the Grants of Plan-Based Awards Table and footnotes. Additionally, for the CEO, an additional CEO in FY 2025-26 and FY 2021-22, and any other retirement-eligible NEOs, this row includes the portion of any current year RSUs that was withheld to pay required payroll employment tax (FICA/Medicare) obligations (and income taxes due on the amounts withheld) due in connection with the executive qualifying as retirement-eligible during the applicable year. |
f) |
Represents the aggregate change in fair value, measured from the prior fiscal year-end to the vesting date of each RSU, PSU, and option that was granted in a prior fiscal year and which vested during the indicated fiscal year. See footnote (c) above for information about our equity valuations. |
g) |
No amounts were required to be reported for any CEO, additional CEO, or other NEO. |
h) |
Represents the aggregate change in the actuarial present value of the accumulated benefit under pension plans. |
i) |
There are no service costs or prior service costs for any of the CEO or the other NEOs. The applicable executives earned pensions in their home country but have been localized to the United States. As such, they are no longer earning benefits in their home country pension plans. |
The peer group used for the Pay versus Performance table is the S&P 500 Consumer Staples Index (SP500.30).
|
2025-26 |
2024-25 |
2023-24 |
2022-23 |
2021-22 |
|
||
Adjustments |
CEO(a) |
CEO(a) |
CEO(a) |
CEO(a) |
CEO(a) |
CEO(a) |
CEO(a) |
|
Summary Compensation Table Total |
18,976,742 |
19,073,909 |
21,909,816 |
22,963,881 |
21,715,625 |
18,595,382 |
17,716,015 |
|
(Deduct): Aggregate grant date fair value for stock awards and option awards included in the SCT (b) |
(14,535,219) |
(15,807,598) |
(18,082,160) |
(16,901,830) |
(14,997,563) |
(13,552,685) |
(12,044,670) |
|
Add: Fair value at fiscal year end of awards granted during the covered fiscal year that were outstanding and unvested at fiscal year end (c) |
13,157,944 |
14,051,539 |
11,863,926 |
21,316,676 |
18,527,276 |
12,022,907 |
14,208,859 |
|
Add: Year-over-year change in fair value at fiscal year end of awards granted in any prior fiscal year that were outstanding and unvested at the fiscal year end (d) |
(2,233,311) |
(5,049,043) |
(2,924,340) |
6,319,870 |
1,100,946 |
8,156,040 |
5,143,672 |
|
Add: Fair value at vesting date of Stock Awards and Options granted and vested during the fiscal year (e) |
115,672 |
379,673 |
360,238 |
351,275 |
281,459 |
339,121 |
205,328 |
|
Add/(Deduct): Change as of the vesting date (from the end of the prior fiscal year) in fair value of awards granted in any prior fiscal year for which vesting conditions were satisfied during the fiscal year (f) |
(3,648,787) |
(9,941,332) |
2,297,931 |
3,948,457 |
108,992 |
8,772,467 |
5,103,456 |
|
Add: Fair value at end of prior fiscal year of awards granted in any prior fiscal year that failed to meet the applicable vesting conditions during the covered fiscal year (g) |
0 |
0 |
0 |
0 |
0 |
0 |
0 |
|
(Deduct): Aggregate change in the actuarial present value of the accumulated benefit under any pension plan (h) |
(1,029,000) |
0 |
0 |
0 |
0 |
0 |
0 |
|
Add: Aggregate service cost and prior service cost for pension plans (i) |
0 |
0 |
0 |
0 |
0 |
0 |
0 |
|
Total value of adjustments |
(8,172,701) |
(16,366,761) |
(6,484,406) |
15,034,448 |
5,021,110 |
15,737,850 |
12,616,645 |
|
CAP Amounts (as calculated) |
10,804,041 |
2,707,148 |
15,425,410 |
37,998,329 |
26,736,735 |
34,333,232 |
30,332,659 |
|
a) |
See footnote (1) under the PVP table for explanation. |
b) |
Represents the aggregate grant date fair value as of the indicated fiscal year of the RSUs, PSUs, and options granted to the CEO, and the additional CEO in FY 2021-22 and FY 2025-26, and the average grant date fair values for the respective NEOs as applicable for each year, during such fiscal year, calculated using the same methodology used for financial statement reporting purposes. |
c) |
Represents the aggregate fair value as of the indicated fiscal year end of outstanding and unvested stock awards and option awards granted during such fiscal year. Stock option fair values are calculated using an industry standard lattice-based valuation model as of the measurement date, which is based on the stock price and assumptions (i.e., term, volatility, dividend yield, risk free rates) as of the measurement date. PSU fair values are calculated using the stock price and a Monte Carlo simulation as of the measurement date, as well as a modifier for forecasted performance. RSU fair values as of the measurement date are calculated using the stock price on the measurement date plus accrued dividends. In FY 2021-22, the additional CEO (Mr. Taylor) as well as one non-CEO NEO retired on June 30, 2022, and, as such, the fair value of their 2022 options, RSUs and PSUs were prorated at 75% to reflect their fiscal year service and did not vest until October and August 2025, respectively. |
d) |
Represents the aggregate change in fair value during the indicated fiscal year of the outstanding and unvested RSUs, PSUs, and options. See footnote (c) above for information about our equity valuations. |
e) |
Represents the aggregate fair value at vesting of RSUs, PSUs, and options that were granted and vested during the indicated fiscal year. See footnote (c) above for information about our equity valuations. Amounts in this row reflect the annual grant of RSUs under our PST Restoration Program and IRP, which is described in the Grants of Plan-Based Awards Table and footnotes. Additionally, for the CEO, an additional CEO in FY 2025-26 and FY 2021-22, and any other retirement-eligible NEOs, this row includes the portion of any current year RSUs that was withheld to pay required payroll employment tax (FICA/Medicare) obligations (and income taxes due on the amounts withheld) due in connection with the executive qualifying as retirement-eligible during the applicable year. |
f) |
Represents the aggregate change in fair value, measured from the prior fiscal year-end to the vesting date of each RSU, PSU, and option that was granted in a prior fiscal year and which vested during the indicated fiscal year. See footnote (c) above for information about our equity valuations. |
g) |
No amounts were required to be reported for any CEO, additional CEO, or other NEO. |
h) |
Represents the aggregate change in the actuarial present value of the accumulated benefit under pension plans. |
i) |
There are no service costs or prior service costs for any of the CEO or the other NEOs. The applicable executives earned pensions in their home country but have been localized to the United States. As such, they are no longer earning benefits in their home country pension plans. |
For the “Other NEOs Average” columns below, all amounts reflect the average of the values for the applicable NEOs in each fiscal year in accordance with SEC rules.
|
|
Other NEOs Average |
|
||||
Adjustments |
|
2025-26 |
2024-25 |
2023-24 |
2022-23 |
2021-22 |
|
Summary Compensation Table Total |
|
6,959,950 |
7,832,698 |
8,191,635 |
7,174,555 |
6,783,743 |
|
(Deduct): Aggregate grant date fair value for stock awards and option awards included in the SCT (b) |
|
(4,902,762) |
(5,565,296) |
(5,256,231) |
(4,441,759) |
(4,432,973) |
|
Add: Fair value at fiscal year end of awards granted during the covered fiscal year that were outstanding and unvested at fiscal year end (c) |
|
4,288,547 |
3,562,295 |
6,620,680 |
5,502,775 |
5,110,606 |
|
Add: Year-over-year change in fair value at fiscal year end of awards granted in any prior fiscal year that were outstanding and unvested at the fiscal year end (d) |
|
(1,368,889) |
(932,960) |
2,152,092 |
494,333 |
2,005,209 |
|
Add: Fair value at vesting date of Stock Awards and Options granted and vested during the fiscal year (e) |
|
181,005 |
134,817 |
138,791 |
120,064 |
96,519 |
|
Add/(Deduct): Change as of the vesting date (from the end of the prior fiscal year) in fair value of awards granted in any prior fiscal year for which vesting conditions were satisfied during the fiscal year (f) |
|
(3,086,469) |
696,732 |
1,315,673 |
(28,946) |
1,800,418 |
|
Add: Fair value at end of prior fiscal year of awards granted in any prior fiscal year that failed to meet the applicable vesting conditions during the covered fiscal year (g) |
|
0 |
0 |
0 |
0 |
0 |
|
(Deduct): Aggregate change in the actuarial present value of the accumulated benefit under any pension plan (h) |
|
(47,167) |
(165,250) |
(198,250) |
(9,500) |
- |
|
Add: Aggregate service cost and prior service cost for pension plans (i) |
|
0 |
0 |
0 |
0 |
0 |
|
Total value of adjustments |
|
(4,935,735) |
(2,269,662) |
4,772,755 |
1,636,966 |
4,579,779 |
|
CAP Amounts (as calculated) |
|
2,024,214 |
5,563,035 |
12,964,390 |
8,811,521 |
11,363,522 |
|
a) |
See footnote (1) under the PVP table for explanation. |
b) |
Represents the aggregate grant date fair value as of the indicated fiscal year of the RSUs, PSUs, and options granted to the CEO, and the additional CEO in FY 2021-22 and FY 2025-26, and the average grant date fair values for the respective NEOs as applicable for each year, during such fiscal year, calculated using the same methodology used for financial statement reporting purposes. |
c) |
Represents the aggregate fair value as of the indicated fiscal year end of outstanding and unvested stock awards and option awards granted during such fiscal year. Stock option fair values are calculated using an industry standard lattice-based valuation model as of the measurement date, which is based on the stock price and assumptions (i.e., term, volatility, dividend yield, risk free rates) as of the measurement date. PSU fair values are calculated using the stock price and a Monte Carlo simulation as of the measurement date, as well as a modifier for forecasted performance. RSU fair values as of the measurement date are calculated using the stock price on the measurement date plus accrued dividends. In FY 2021-22, the additional CEO (Mr. Taylor) as well as one non-CEO NEO retired on June 30, 2022, and, as such, the fair value of their 2022 options, RSUs and PSUs were prorated at 75% to reflect their fiscal year service and did not vest until October and August 2025, respectively. |
d) |
Represents the aggregate change in fair value during the indicated fiscal year of the outstanding and unvested RSUs, PSUs, and options. See footnote (c) above for information about our equity valuations. |
e) |
Represents the aggregate fair value at vesting of RSUs, PSUs, and options that were granted and vested during the indicated fiscal year. See footnote (c) above for information about our equity valuations. Amounts in this row reflect the annual grant of RSUs under our PST Restoration Program and IRP, which is described in the Grants of Plan-Based Awards Table and footnotes. Additionally, for the CEO, an additional CEO in FY 2025-26 and FY 2021-22, and any other retirement-eligible NEOs, this row includes the portion of any current year RSUs that was withheld to pay required payroll employment tax (FICA/Medicare) obligations (and income taxes due on the amounts withheld) due in connection with the executive qualifying as retirement-eligible during the applicable year. |
f) |
Represents the aggregate change in fair value, measured from the prior fiscal year-end to the vesting date of each RSU, PSU, and option that was granted in a prior fiscal year and which vested during the indicated fiscal year. See footnote (c) above for information about our equity valuations. |
g) |
No amounts were required to be reported for any CEO, additional CEO, or other NEO. |
h) |
Represents the aggregate change in the actuarial present value of the accumulated benefit under pension plans. |
i) |
There are no service costs or prior service costs for any of the CEO or the other NEOs. The applicable executives earned pensions in their home country but have been localized to the United States. As such, they are no longer earning benefits in their home country pension plans. |
The following table shows the financial metrics that are most important in linking compensation actually paid to our CEO and other NEOs to the Company’s performance for the most recently completed fiscal year. These metrics are included in STAR and/or PSP, as detailed in the Compensation Discussion and Analysis section above:
Financial Metrics |
Organic Sales Growth |
Core EPS Growth |
Relative Organic Sales Growth |
Constant Currency Before Tax Operating Profit |
Free Cash Flow Productivity |
Relative TSR |