Pay vs Performance Disclosure - USD ($)
|
12 Months Ended |
Jun. 30, 2026 |
Jun. 30, 2025 |
Jun. 30, 2024 |
| Pay vs Performance Disclosure |
|
|
|
| Pay vs Performance Disclosure, Table |
| | | | | | | | | | | | | Year | | Summary Compensation Table Total for PEO ($) (1) | | Compensation Actually Paid to PEO ($) (2) | | Average Summary Compensation Table Total for Non-PEO Named Executive Officers ($) (3) | | Average Compensation Actually Paid to Non-PEO Named Executive Officers ($) (4) | | Value of Initial Fixed $100 Investment Based on Total Shareholder Return ($) (5) | | Net Income (Loss) ($) (6) | 2026 | | 382,620 | | 382,620 | | 487,095 | | 463,450 | | 108.4 | | (391,464) | 2025 | | 379,509 | | 572,037 | | 278,614 | | 398,944 | | 137.8 | | (874,831) | 2024 | | 383,817 | | 424,797 | | 288,134 | | 320,072 | | 120.3 | | (950,911) |
(1)Michael J. Koss (our Chairman of the Board and CEO) was the PEO for all years shown. The amounts reflect the total compensation reported for our PEO in the “Total” column of the Summary Compensation Table for each corresponding year. (2)The amounts reported represent the compensation actually paid to the PEO, computed in accordance with Item 402(v) of Regulation S-K. In accordance with Item 402(v) of Regulation S-K, below are the adjustments made to the amount reported for our PEO in column (1) above for each year to arrive at compensation actually paid to our PEO during each year shown.
|
|
|
| Named Executive Officers, Footnote |
Michael J. Koss (our Chairman of the Board and CEO) was the PEO for all years shown. The amounts reflect the total compensation reported for our PEO in the “Total” column of the Summary Compensation Table for each corresponding year.
|
|
|
| PEO Total Compensation Amount |
$ 382,620
|
$ 379,509
|
$ 383,817
|
| PEO Actually Paid Compensation Amount |
$ 382,620
|
572,037
|
424,797
|
| Adjustment To PEO Compensation, Footnote |
This column represents the adjustment to equity awards granted in prior years to arrive at “compensation actually paid” to Mr. Koss for 2026 (“Subject Year”). The adjusted amount is determined by adding (or subtracting, as applicable) the following: (i) the year-end fair value of any equity awards granted in the Subject Year that are outstanding and unvested as of the end of the Subject Year; (ii) the amount of change as of the end of the Subject Year (from the end of the prior fiscal year) in the fair value of any awards granted in prior years that are outstanding and unvested as of the end of the Subject Year; (iii) for awards that are granted and vest in the Subject Year, the fair value as of the vesting date; (iv) for awards granted in prior years that vest in the Subject Year, the amount equal to the change as of the vesting date (from the end of the prior fiscal year) in the fair value; (v) for awards granted in prior years that are determined to fail to meet the applicable vesting conditions during the Subject Year, a deduction for the amount equal to the fair value at the end of the prior fiscal year; and (vi) the dollar value of any dividends or other earnings paid on stock or option awards in the Subject Year prior to the vesting date that are not otherwise reflected in the fair value of such award or included in any other component of total compensation for the Subject Year. The valuation assumptions used to calculate fair values did not materially differ from those disclosed at the time of grant. The amounts added or subtracted to determine the adjusted amount are as follows:
|
|
|
| Non-PEO NEO Average Total Compensation Amount |
$ 487,095
|
278,614
|
288,134
|
| Non-PEO NEO Average Compensation Actually Paid Amount |
$ 463,450
|
398,944
|
320,072
|
| Adjustment to Non-PEO NEO Compensation Footnote |
This column represents the adjustment to equity awards granted in prior years to arrive at “compensation actually paid” to each NEO (excluding Mr. Koss) for that year, which is then averaged to determine the average “compensation actually paid” to the NEOs (excluding Mr. Koss) for that year. The adjustment is determined using the same methodology described above in Note 2(c). The amounts added or subtracted to determine the adjusted average amount are as follows:
|
|
|
| Compensation Actually Paid vs. Total Shareholder Return |
Header 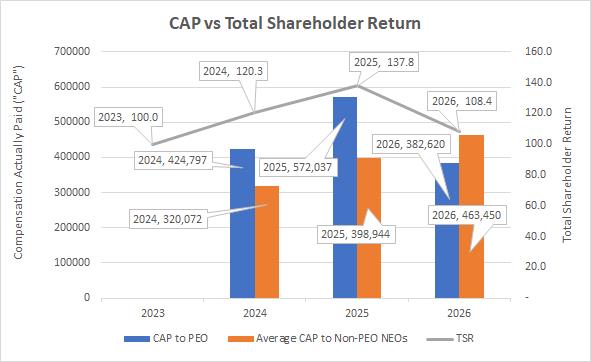
Footer Header
|
|
|
| Compensation Actually Paid vs. Net Income |
Footer 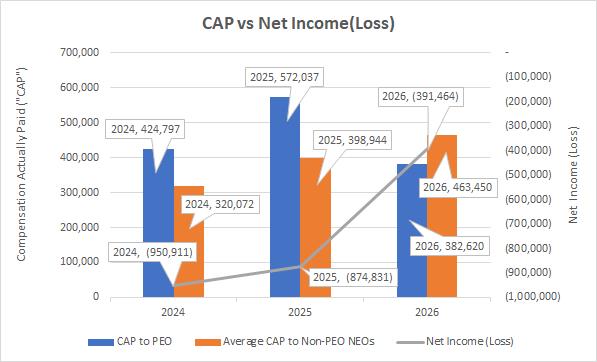 . .
|
|
|
| Total Shareholder Return Amount |
$ 108.4
|
137.8
|
120.3
|
| Net (loss) income |
$ (391,464)
|
$ (874,831)
|
$ (950,911)
|
| PEO Name |
Michael J. Koss
|
|
|
| Additional 402(v) Disclosure |
The amounts reported represent the compensation actually paid to the PEO, computed in accordance with Item 402(v) of Regulation S-K. In accordance with Item 402(v) of Regulation S-K, below are the adjustments made to the amount reported for our PEO in column (1) above for each year to arrive at compensation actually paid to our PEO during each year shown.
|
|
|
| PEO [Member] | Aggregate Grant Date Fair Value of Equity Award Amounts Reported in Summary Compensation Table [Member] |
|
|
|
| Pay vs Performance Disclosure |
|
|
|
| Adjustment to Compensation, Amount |
|
|
|
| PEO [Member] | Equity Awards Adjustments, Excluding Value Reported in the Compensation Table [Member] |
|
|
|
| Pay vs Performance Disclosure |
|
|
|
| Adjustment to Compensation, Amount |
|
|
|
| PEO [Member] | Year-end Fair Value of Equity Awards Granted in Covered Year that are Outstanding and Unvested [Member] |
|
|
|
| Pay vs Performance Disclosure |
|
|
|
| Adjustment to Compensation, Amount |
|
|
|
| PEO [Member] | Year-over-Year Change in Fair Value of Equity Awards Granted in Prior Years That are Outstanding and Unvested [Member] |
|
|
|
| Pay vs Performance Disclosure |
|
|
|
| Adjustment to Compensation, Amount |
|
|
|
| PEO [Member] | Vesting Date Fair Value of Equity Awards Granted and Vested in Covered Year [Member] |
|
|
|
| Pay vs Performance Disclosure |
|
|
|
| Adjustment to Compensation, Amount |
|
|
|
| PEO [Member] | Change in Fair Value as of Vesting Date of Prior Year Equity Awards Vested in Covered Year [Member] |
|
|
|
| Pay vs Performance Disclosure |
|
|
|
| Adjustment to Compensation, Amount |
|
|
|
| PEO [Member] | Prior Year End Fair Value of Equity Awards Granted in Any Prior Year that Fail to Meet Applicable Vesting Conditions During Covered Year [Member] |
|
|
|
| Pay vs Performance Disclosure |
|
|
|
| Adjustment to Compensation, Amount |
|
|
|
| PEO [Member] | Dividends or Other Earnings Paid on Equity Awards not Otherwise Reflected in Total Compensation for Covered Year [Member] |
|
|
|
| Pay vs Performance Disclosure |
|
|
|
| Adjustment to Compensation, Amount |
|
|
|
| Non-PEO NEO [Member] | Aggregate Grant Date Fair Value of Equity Award Amounts Reported in Summary Compensation Table [Member] |
|
|
|
| Pay vs Performance Disclosure |
|
|
|
| Adjustment to Compensation, Amount |
(213,810)
|
|
|
| Non-PEO NEO [Member] | Equity Awards Adjustments, Excluding Value Reported in the Compensation Table [Member] |
|
|
|
| Pay vs Performance Disclosure |
|
|
|
| Adjustment to Compensation, Amount |
190,165
|
|
|
| Non-PEO NEO [Member] | Year-end Fair Value of Equity Awards Granted in Covered Year that are Outstanding and Unvested [Member] |
|
|
|
| Pay vs Performance Disclosure |
|
|
|
| Adjustment to Compensation, Amount |
190,165
|
|
|
| Non-PEO NEO [Member] | Year-over-Year Change in Fair Value of Equity Awards Granted in Prior Years That are Outstanding and Unvested [Member] |
|
|
|
| Pay vs Performance Disclosure |
|
|
|
| Adjustment to Compensation, Amount |
|
|
|
| Non-PEO NEO [Member] | Vesting Date Fair Value of Equity Awards Granted and Vested in Covered Year [Member] |
|
|
|
| Pay vs Performance Disclosure |
|
|
|
| Adjustment to Compensation, Amount |
|
|
|
| Non-PEO NEO [Member] | Change in Fair Value as of Vesting Date of Prior Year Equity Awards Vested in Covered Year [Member] |
|
|
|
| Pay vs Performance Disclosure |
|
|
|
| Adjustment to Compensation, Amount |
|
|
|
| Non-PEO NEO [Member] | Prior Year End Fair Value of Equity Awards Granted in Any Prior Year that Fail to Meet Applicable Vesting Conditions During Covered Year [Member] |
|
|
|
| Pay vs Performance Disclosure |
|
|
|
| Adjustment to Compensation, Amount |
|
|
|
| Non-PEO NEO [Member] | Dividends or Other Earnings Paid on Equity Awards not Otherwise Reflected in Total Compensation for Covered Year [Member] |
|
|
|
| Pay vs Performance Disclosure |
|
|
|
| Adjustment to Compensation, Amount |
|
|
|