Pay vs Performance Disclosure - USD ($)
|
12 Months Ended |
Apr. 30, 2026 |
Apr. 30, 2025 |
Apr. 30, 2024 |
| Pay vs Performance Disclosure |
|
|
|
| Pay vs Performance Disclosure, Table |
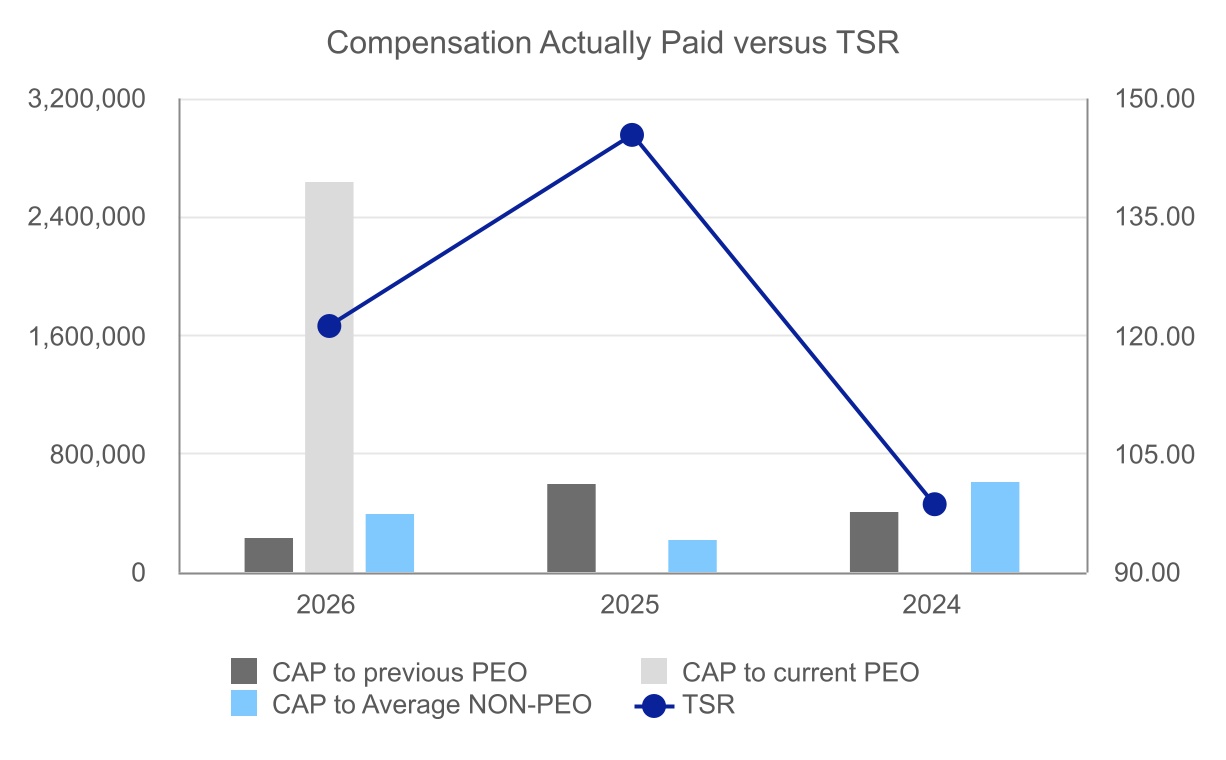
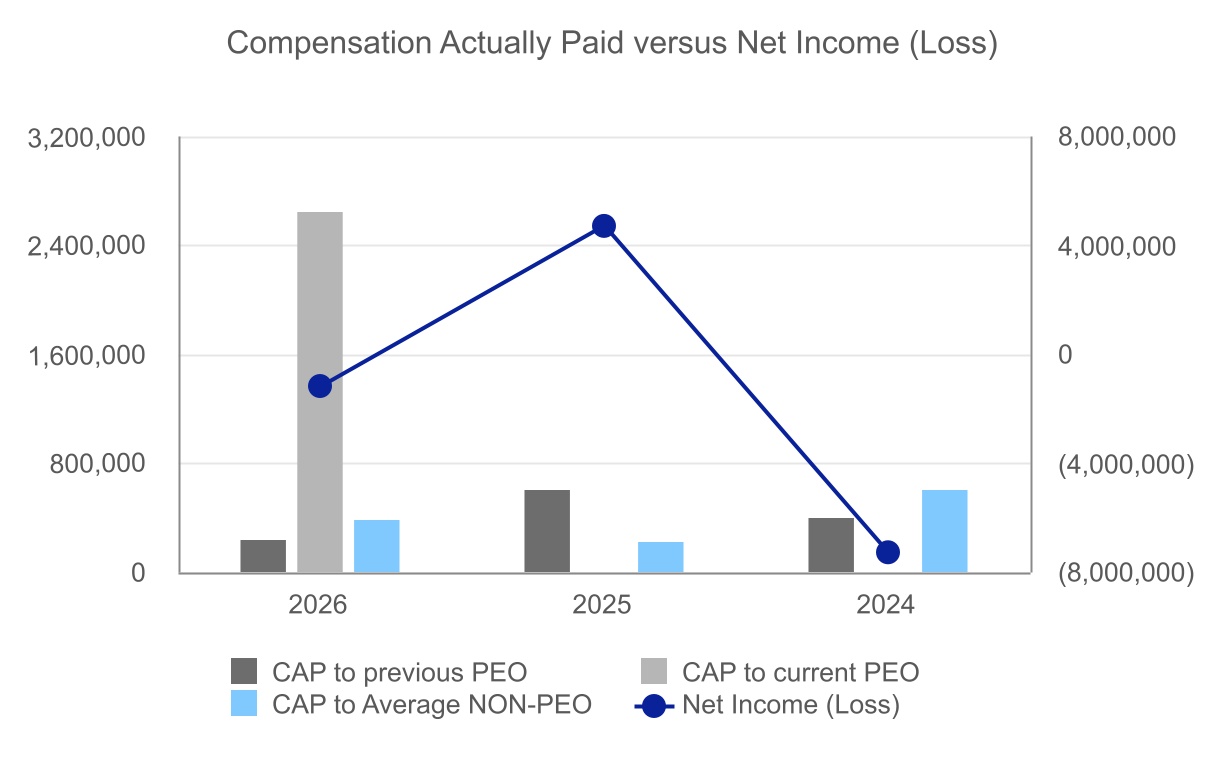
| | | | | | | | | | | | | | | | | | | | | | | | | | | | | | | | | | | | | | | | | | | | | | | | | | | | Year | | Summary Compen-sation Table Total for previous PEO(1) | | Compen-sation Actually Paid to previous PEO (2) (a) | | Summary Compen-sation Table Total for current PEO(3) | | Compen-sation Actually Paid to current PEO (2) (b) | | Average Summary Compen-sation Table Total for Non-PEO NEOs(4) | | Average Compen-sation Actually Paid to Non-PEO NEOs(5) | | Value of Initial Fixed $100 Investment based on TSR(6) | | Net Income (Loss) (000s) (7) | | 2026 | | $ | 233,333 | | | $ | 233,333 | | | $ | 3,567,022 | | | $ | 2,637,154 | | | $ | 388,464 | | | $ | 388,343 | | | $ | 121.14 | | | $ | (1,175) | | | 2025 | | $ | 600,000 | | | $ | 600,000 | | | $ | — | | | $ | — | | | $ | 243,930 | | | $ | 215,745 | | | $ | 145.33 | | | $ | 4,701 | | | 2024 | | $ | 400,000 | | | $ | 400,000 | | | $ | — | | | $ | — | | | $ | 803,105 | | | $ | 601,705 | | | $ | 98.58 | | | $ | (7,276) | |
|
|
|
| Named Executive Officers, Footnote |
For 2024 and 2025, the PEO was the Chief Executive Officer (CEO), Ronnie Morris. For 2026, the Company experienced a PEO and CEO transition with Dr. Morris serving as PEO and CEO for a portion of the year and Mr. Brainin serving as PEO and CEO for the remainder of the year. The values reflected in this column reflect the "Total Compensation" paid to Dr. Morris as set forth in the Summary of Compensation Table.
|
|
|
| Adjustment To PEO Compensation, Footnote |
The dollar amounts reported in these columns represent the amount of "compensation actually paid" to our Principal Executive Officers (PEOs), as computed in accordance with Item 402(v) of Regulation S-K. The dollar amounts do not reflect the actual amount of compensation earned by or paid to our PEOs during the applicable year. As noted, for 2026, the Company experienced a PEO transition, with Dr. Morris serving as PEO for a portion of the year and Mr. Brainin serving as PEO for the remainder of the year. In accordance with the requirements of Item 402(v) of Regulation S-K, the adjustments listed in the reconciliation table below were made to determine the "compensation actually paid" amounts reported for each PEO. (a) This column represents "compensation actually paid" to Dr. Morris. As Dr. Morris was not awarded equity compensation and held no outstanding unvested equity awards during the periods reported herein, no equity value adjustments were required for his calculation, and his total compensation from the Summary Compensation Table equals his Compensation Actually Paid.
(b) This column represents "compensation actually paid" to Mr. Brainin as demonstrated in the reconciliation table below and in accordance with the requirements of Item 402(v) of Regulation S-K. For a portion of 2026, the PEO was Chief Executive Officer, Mr. Robert Brainin. The values reflected in this column reflect the "Total Compensation" paid to Mr. Brainin as set forth in the Summary of Compensation Table. | | | | | | | | | | | | | | | | | | | | | | | | | | | | Reconciliation of Summary Compensation Table Totals for PEOs to Compensation Actually Paid to PEOs | | 2026 previous PEO | | 2026 current PEO | | 2025 | | 2024 | | Summary of Compensation | | $ | 233,333 | | | $ | 3,567,022 | | | $ | 600,000 | | | $ | 400,000 | | | Less: Grant Date Fair Value of Option and Stock Awards Granted in Fiscal Year | | $ | — | | | $ | (3,220,868) | | | $ | — | | | $ | — | | | Plus: Fair Value of Awards Granted during Applicable Fiscal Year that Remain Unvested as of Applicable Fiscal Year End, Determined as of Applicable Fiscal Year End | | $ | — | | | $ | 2,291,000 | | | $ | — | | | $ | — | | | Plus: Fair Value of Awards Granted During the Applicable Fiscal Year that Vested During the Applicable Fiscal Year, Determined as of the Vesting Date | | $ | — | | | $ | — | | | $ | — | | | $ | — | | | Plus (Less): Adjustment for Awards Granted During a Prior Fiscal Year that were Outstanding and Unvested as of the Applicable Fiscal Year End, Determined Based on the Change in ASC 718 Fair Value from Prior Fiscal year End to the Applicable Fiscal Year End | | $ | — | | | $ | — | | | $ | — | | | $ | — | | | Plus (Less): Adjustment for Awards Granted During a Prior Fiscal Year that Vested During the Applicable Fiscal year, Determined based on the Change in ASC 718 Fair Value from the Prior Fiscal Year End to the Vesting Date | | $ | — | | | $ | — | | | $ | — | | | $ | — | | | Less: ASC 718 Fair Value of Awards Granted During a Prior Fiscal Year that were Forfeited During the Applicable Fiscal Year, determined as of the Prior Fiscal Year End | | $ | — | | | $ | — | | | $ | — | | | $ | — | | | Plus: Dividends or Other Earnings Paid During the Applicable Fiscal year Prior to the Vesting Date | | $ | — | | | $ | — | | | $ | — | | | $ | — | | | Plus: Incremental Fair Value of Options/SARs Modified During the Applicable Fiscal Year | | $ | — | | | $ | — | | | $ | — | | | | | Compensation Actually Paid | | $ | 233,333 | | | $ | 2,637,154 | | | $ | 600,000 | | | $ | 400,000 | | | | | | | | | | |
|
|
|
| Non-PEO NEO Average Total Compensation Amount |
$ 388,464
|
$ 243,930
|
$ 803,105
|
| Non-PEO NEO Average Compensation Actually Paid Amount |
$ 388,343
|
215,745
|
601,705
|
| Adjustment to Non-PEO NEO Compensation Footnote |
For 2026, the sole non-PEO NEO was David Miller. For 2024 and 2025, the non-PEO NEOs were David Miller and Brady Davis. The values reflected in this column reflect the average "Total Compensation" paid to each of the non-PEO NEOs in the applicable year, as set forth in the Summary of Compensation Table for the applicable year.The dollar amounts reported in this column represent the average amount of "compensation actually paid” to the non-PEO NEOs, as a group, as computed in accordance with Item 402(v) of Regulation S-K. The dollar amounts do not necessarily reflect the actual average amount of compensation earned by or paid to such persons during the applicable year. In accordance with the requirements of Item 402(v) of Regulation S-K, the following adjustments were made to average total compensation for the non-PEO NEOs as a group for each year to determine the compensation actually paid: | | | | | | | | | | | | | | | | | | | | | | Reconciliation of Average Summary Compensation Table Totals for Non-PEO NEOs to Average Compensation Actually Paid to Non-PEO NEOs | | 2026 | | 2025 | | 2024 | | Average Summary of Compensation | | $ | 388,464 | | | $ | 243,930 | | | $ | 803,105 | | | Less: Grant Date Fair Value of Option and Stock Awards Granted in Fiscal Year | | $ | (48,450) | | | $ | (7,440) | | | $ | (846,210) | | | Plus: Fair Value of Awards Granted during Applicable Fiscal Year that Remain Unvested as of Applicable Fiscal Year End, Determined as of Applicable Fiscal Year End | | $ | 48,000 | | | $ | 6,075 | | | $ | 629,395 | | | Plus: Fair Value of Awards Granted During the Applicable Fiscal Year that Vested During the Applicable Fiscal Year, Determined as of the Vesting Date | | $ | — | | | $ | 6,075 | | | $ | — | | | Plus (Less): Adjustment for Awards Granted During a Prior Fiscal Year that were Outstanding and Unvested as of the Applicable Fiscal Year End, Determined Based on the Change in ASC 718 Fair Value from Prior Fiscal year End to the Applicable Fiscal Year End | | $ | — | | | $ | 1,325 | | | $ | 920 | | | Plus (Less): Adjustment for Awards Granted During a Prior Fiscal Year that Vested During the Applicable Fiscal year, Determined based on the Change in ASC 718 Fair Value from the Prior Fiscal Year End to the Vesting Date | | $ | 329 | | | $ | (34,220) | | | $ | 14,495 | | | Less: ASC 718 Fair Value of Awards Granted During a Prior Fiscal Year that were Forfeited During the Applicable Fiscal Year, determined as of the Prior Fiscal Year End | | $ | — | | | $ | — | | | $ | — | | | Plus: Dividends or Other Earnings Paid During the Applicable Fiscal year Prior to the Vesting Date | | $ | — | | | $ | — | | | $ | — | | | Plus: Incremental Fair Value of Options/SARs Modified During the Applicable Fiscal Year | | $ | — | | | $ | — | | | $ | — | | | Average Compensation Actually Paid | | $ | 388,343 | | | $ | 215,745 | | | $ | 601,705 | | | | | | | | |
|
|
|
| Compensation Actually Paid vs. Total Shareholder Return |
|
|
|
| Compensation Actually Paid vs. Net Income |
|
|
|
| Peer Group Total Shareholder Return Amount |
$ 121.14
|
145.33
|
98.58
|
| Net Income (Loss) |
$ (1,175)
|
$ 4,701
|
$ (7,276)
|
| PEO Name |
|
Ronnie Morris
|
Ronnie Morris
|
| Additional 402(v) Disclosure |
Total Shareholder Return ("TSR") is calculated by dividing the sum of the amount of dividends for the measurement period, assuming dividend reinvestment, and the difference between the Company’s share price at the end and the beginning of the measurement period by the Company’s share price at the beginning of the measurement period. The Company has never paid dividends.The dollar amounts reported represent the amount of net income (loss), in thousands, as reflected in the Company’s audited financial statements for the applicable year.
|
|
|
| Dr. Morris [Member] |
|
|
|
| Pay vs Performance Disclosure |
|
|
|
| PEO Total Compensation Amount |
$ 233,333
|
|
|
| PEO Actually Paid Compensation Amount |
$ 233,333
|
|
|
| PEO Name |
Dr. Morris
|
|
|
| Mr. Brainin [Member] |
|
|
|
| Pay vs Performance Disclosure |
|
|
|
| PEO Total Compensation Amount |
$ 3,567,022
|
|
|
| PEO Actually Paid Compensation Amount |
$ 2,637,154
|
|
|
| PEO Name |
Mr. Brainin
|
|
|
| Ronnie Morris [Member] |
|
|
|
| Pay vs Performance Disclosure |
|
|
|
| PEO Total Compensation Amount |
|
$ 600,000
|
$ 400,000
|
| PEO Actually Paid Compensation Amount |
|
600,000
|
400,000
|
| PEO | Dr. Morris [Member] | Aggregate Grant Date Fair Value of Equity Award Amounts Reported in Summary Compensation Table |
|
|
|
| Pay vs Performance Disclosure |
|
|
|
| Adjustment to Compensation, Amount |
$ 0
|
|
|
| PEO | Dr. Morris [Member] | Year-end Fair Value of Equity Awards Granted in Covered Year that are Outstanding and Unvested |
|
|
|
| Pay vs Performance Disclosure |
|
|
|
| Adjustment to Compensation, Amount |
0
|
|
|
| PEO | Dr. Morris [Member] | Year-over-Year Change in Fair Value of Equity Awards Granted in Prior Years That are Outstanding and Unvested |
|
|
|
| Pay vs Performance Disclosure |
|
|
|
| Adjustment to Compensation, Amount |
0
|
|
|
| PEO | Dr. Morris [Member] | Vesting Date Fair Value of Equity Awards Granted and Vested in Covered Year |
|
|
|
| Pay vs Performance Disclosure |
|
|
|
| Adjustment to Compensation, Amount |
0
|
|
|
| PEO | Dr. Morris [Member] | Change in Fair Value as of Vesting Date of Prior Year Equity Awards Vested in Covered Year |
|
|
|
| Pay vs Performance Disclosure |
|
|
|
| Adjustment to Compensation, Amount |
0
|
|
|
| PEO | Dr. Morris [Member] | Prior Year End Fair Value of Equity Awards Granted in Any Prior Year that Fail to Meet Applicable Vesting Conditions During Covered Year |
|
|
|
| Pay vs Performance Disclosure |
|
|
|
| Adjustment to Compensation, Amount |
0
|
|
|
| PEO | Dr. Morris [Member] | Dividends or Other Earnings Paid on Equity Awards not Otherwise Reflected in Total Compensation for Covered Year |
|
|
|
| Pay vs Performance Disclosure |
|
|
|
| Adjustment to Compensation, Amount |
0
|
|
|
| PEO | Dr. Morris [Member] | Incremental Fair Value of Options/SARs Modified During the Applicable Fiscal Year [Member] |
|
|
|
| Pay vs Performance Disclosure |
|
|
|
| Adjustment to Compensation, Amount |
0
|
|
|
| PEO | Mr. Brainin [Member] | Aggregate Grant Date Fair Value of Equity Award Amounts Reported in Summary Compensation Table |
|
|
|
| Pay vs Performance Disclosure |
|
|
|
| Adjustment to Compensation, Amount |
(3,220,868)
|
|
|
| PEO | Mr. Brainin [Member] | Year-end Fair Value of Equity Awards Granted in Covered Year that are Outstanding and Unvested |
|
|
|
| Pay vs Performance Disclosure |
|
|
|
| Adjustment to Compensation, Amount |
2,291,000
|
|
|
| PEO | Mr. Brainin [Member] | Year-over-Year Change in Fair Value of Equity Awards Granted in Prior Years That are Outstanding and Unvested |
|
|
|
| Pay vs Performance Disclosure |
|
|
|
| Adjustment to Compensation, Amount |
0
|
|
|
| PEO | Mr. Brainin [Member] | Vesting Date Fair Value of Equity Awards Granted and Vested in Covered Year |
|
|
|
| Pay vs Performance Disclosure |
|
|
|
| Adjustment to Compensation, Amount |
0
|
|
|
| PEO | Mr. Brainin [Member] | Change in Fair Value as of Vesting Date of Prior Year Equity Awards Vested in Covered Year |
|
|
|
| Pay vs Performance Disclosure |
|
|
|
| Adjustment to Compensation, Amount |
0
|
|
|
| PEO | Mr. Brainin [Member] | Prior Year End Fair Value of Equity Awards Granted in Any Prior Year that Fail to Meet Applicable Vesting Conditions During Covered Year |
|
|
|
| Pay vs Performance Disclosure |
|
|
|
| Adjustment to Compensation, Amount |
0
|
|
|
| PEO | Mr. Brainin [Member] | Dividends or Other Earnings Paid on Equity Awards not Otherwise Reflected in Total Compensation for Covered Year |
|
|
|
| Pay vs Performance Disclosure |
|
|
|
| Adjustment to Compensation, Amount |
0
|
|
|
| PEO | Mr. Brainin [Member] | Incremental Fair Value of Options/SARs Modified During the Applicable Fiscal Year [Member] |
|
|
|
| Pay vs Performance Disclosure |
|
|
|
| Adjustment to Compensation, Amount |
0
|
|
|
| PEO | Ronnie Morris [Member] | Aggregate Grant Date Fair Value of Equity Award Amounts Reported in Summary Compensation Table |
|
|
|
| Pay vs Performance Disclosure |
|
|
|
| Adjustment to Compensation, Amount |
|
0
|
0
|
| PEO | Ronnie Morris [Member] | Year-end Fair Value of Equity Awards Granted in Covered Year that are Outstanding and Unvested |
|
|
|
| Pay vs Performance Disclosure |
|
|
|
| Adjustment to Compensation, Amount |
|
0
|
0
|
| PEO | Ronnie Morris [Member] | Year-over-Year Change in Fair Value of Equity Awards Granted in Prior Years That are Outstanding and Unvested |
|
|
|
| Pay vs Performance Disclosure |
|
|
|
| Adjustment to Compensation, Amount |
|
0
|
0
|
| PEO | Ronnie Morris [Member] | Vesting Date Fair Value of Equity Awards Granted and Vested in Covered Year |
|
|
|
| Pay vs Performance Disclosure |
|
|
|
| Adjustment to Compensation, Amount |
|
0
|
0
|
| PEO | Ronnie Morris [Member] | Change in Fair Value as of Vesting Date of Prior Year Equity Awards Vested in Covered Year |
|
|
|
| Pay vs Performance Disclosure |
|
|
|
| Adjustment to Compensation, Amount |
|
0
|
0
|
| PEO | Ronnie Morris [Member] | Prior Year End Fair Value of Equity Awards Granted in Any Prior Year that Fail to Meet Applicable Vesting Conditions During Covered Year |
|
|
|
| Pay vs Performance Disclosure |
|
|
|
| Adjustment to Compensation, Amount |
|
0
|
0
|
| PEO | Ronnie Morris [Member] | Dividends or Other Earnings Paid on Equity Awards not Otherwise Reflected in Total Compensation for Covered Year |
|
|
|
| Pay vs Performance Disclosure |
|
|
|
| Adjustment to Compensation, Amount |
|
0
|
0
|
| PEO | Ronnie Morris [Member] | Incremental Fair Value of Options/SARs Modified During the Applicable Fiscal Year [Member] |
|
|
|
| Pay vs Performance Disclosure |
|
|
|
| Adjustment to Compensation, Amount |
|
0
|
|
| Non-PEO NEO | Aggregate Grant Date Fair Value of Equity Award Amounts Reported in Summary Compensation Table |
|
|
|
| Pay vs Performance Disclosure |
|
|
|
| Adjustment to Compensation, Amount |
(48,450)
|
(7,440)
|
(846,210)
|
| Non-PEO NEO | Year-end Fair Value of Equity Awards Granted in Covered Year that are Outstanding and Unvested |
|
|
|
| Pay vs Performance Disclosure |
|
|
|
| Adjustment to Compensation, Amount |
48,000
|
6,075
|
629,395
|
| Non-PEO NEO | Year-over-Year Change in Fair Value of Equity Awards Granted in Prior Years That are Outstanding and Unvested |
|
|
|
| Pay vs Performance Disclosure |
|
|
|
| Adjustment to Compensation, Amount |
0
|
1,325
|
920
|
| Non-PEO NEO | Vesting Date Fair Value of Equity Awards Granted and Vested in Covered Year |
|
|
|
| Pay vs Performance Disclosure |
|
|
|
| Adjustment to Compensation, Amount |
0
|
6,075
|
0
|
| Non-PEO NEO | Change in Fair Value as of Vesting Date of Prior Year Equity Awards Vested in Covered Year |
|
|
|
| Pay vs Performance Disclosure |
|
|
|
| Adjustment to Compensation, Amount |
329
|
(34,220)
|
14,495
|
| Non-PEO NEO | Prior Year End Fair Value of Equity Awards Granted in Any Prior Year that Fail to Meet Applicable Vesting Conditions During Covered Year |
|
|
|
| Pay vs Performance Disclosure |
|
|
|
| Adjustment to Compensation, Amount |
0
|
0
|
0
|
| Non-PEO NEO | Dividends or Other Earnings Paid on Equity Awards not Otherwise Reflected in Total Compensation for Covered Year |
|
|
|
| Pay vs Performance Disclosure |
|
|
|
| Adjustment to Compensation, Amount |
0
|
0
|
0
|
| Non-PEO NEO | Incremental Fair Value of Options/SARs Modified During the Applicable Fiscal Year [Member] |
|
|
|
| Pay vs Performance Disclosure |
|
|
|
| Adjustment to Compensation, Amount |
$ 0
|
$ 0
|
$ 0
|