Performance Management |
Apr. 30, 2026 |
|||||||||||||||||||||||||||||||||||||||||||||||||
|---|---|---|---|---|---|---|---|---|---|---|---|---|---|---|---|---|---|---|---|---|---|---|---|---|---|---|---|---|---|---|---|---|---|---|---|---|---|---|---|---|---|---|---|---|---|---|---|---|---|---|
| Cambria Shareholder Yield ETF | ||||||||||||||||||||||||||||||||||||||||||||||||||
| Prospectus [Line Items] | ||||||||||||||||||||||||||||||||||||||||||||||||||
| Bar Chart and Performance Table [Heading] | Performance | |||||||||||||||||||||||||||||||||||||||||||||||||
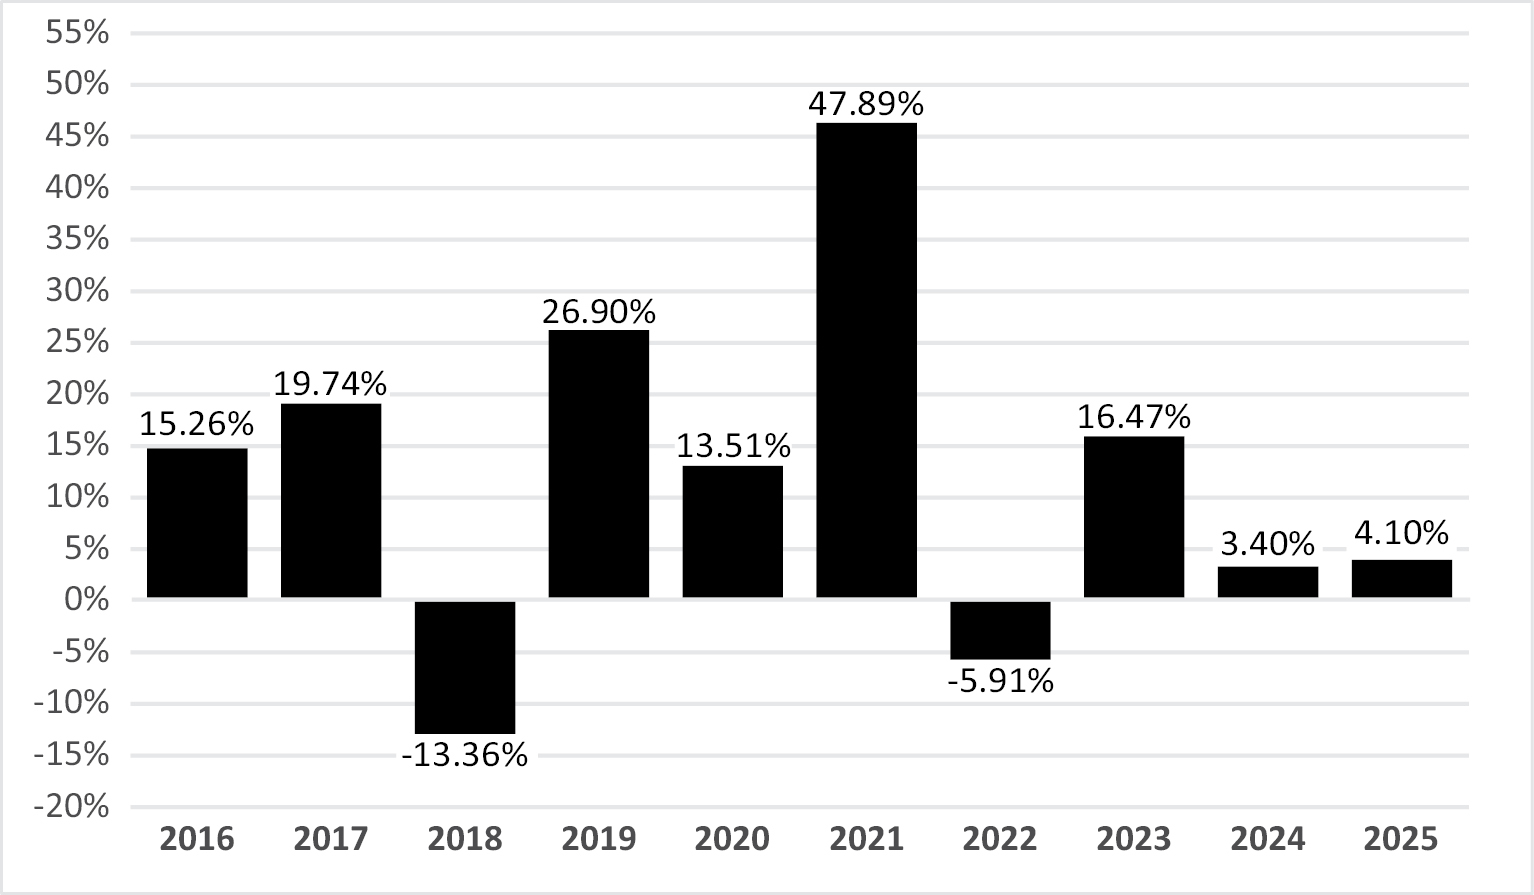
| Performance Narrative [Text Block] | The following bar chart and table indicate the risks of investing in the Fund by showing how the Fund’s average annual total returns compare with those of the S&P 500 Index, which is a relevant broad-based securities market index that provides a measure of the performance of the overall domestic equity market. Performance is also shown for an additional index, the S&P Composite 1500 Index, which represents a broad measure of the U.S. equity market. All returns include the reinvestment of dividends and distributions. As always, please note that the Fund’s past performance (before and after taxes) does not necessarily indicate how the Fund will perform in the future. Updated performance information is available at www.cambriafunds.com/syld. The Fund’s investment objective and strategies changed effective June 1, 2020. From March 26, 2018 to May 31, 2020, Fund performance reflects the investment objective of the Fund when it sought investment results that corresponded (before fees and expenses) generally to the price and yield performance of the Cambria Shareholder Yield Index. Prior to that period, Fund performance reflects the investment objective of the Fund when it was actively managed and sought income and capital appreciation with an emphasis on income from investments in the U.S. equity market. |
|||||||||||||||||||||||||||||||||||||||||||||||||
| Performance Past Does Not Indicate Future [Text] | As always, please note that the Fund’s past performance (before and after taxes) does not necessarily indicate how the Fund will perform in the future. | |||||||||||||||||||||||||||||||||||||||||||||||||
| Performance Information Illustrates Variability of Returns [Text] | The following bar chart and table indicate the risks of investing in the Fund by showing how the Fund’s average annual total returns compare with those of the S&P 500 Index, which is a relevant broad-based securities market index that provides a measure of the performance of the overall domestic equity market. | |||||||||||||||||||||||||||||||||||||||||||||||||
| Performance Additional Market Index [Text] | Performance is also shown for an additional index, the S&P Composite 1500 Index, which represents a broad measure of the U.S. equity market. | |||||||||||||||||||||||||||||||||||||||||||||||||
| Bar Chart [Heading] | Total Annual Returns for Calendar Year Ended December 31 | |||||||||||||||||||||||||||||||||||||||||||||||||
| Bar Chart [Table] |
|
|||||||||||||||||||||||||||||||||||||||||||||||||
| Bar Chart Closing [Text Block] | As of June 30, 2026, the Fund’s year-to-date total return was 14.78%. Best and Worst Quarter Returns (for the period reflected in the bar chart above) Best: 34.07%, for the quarter ended March 31, 2021. Worst: -36.94%, for the quarter ended March 31, 2020. |
|||||||||||||||||||||||||||||||||||||||||||||||||
| Year to Date Return, Label [Optional Text] | year-to-date total return | |||||||||||||||||||||||||||||||||||||||||||||||||
| Bar Chart, Year to Date Return | 14.78% | |||||||||||||||||||||||||||||||||||||||||||||||||
| Bar Chart, Year to Date Return, Date | Jun. 30, 2026 | |||||||||||||||||||||||||||||||||||||||||||||||||
| Highest Quarterly Return, Label [Optional Text] | Best | |||||||||||||||||||||||||||||||||||||||||||||||||
| Highest Quarterly Return | 34.07% | |||||||||||||||||||||||||||||||||||||||||||||||||
| Highest Quarterly Return, Date | Mar. 31, 2021 | |||||||||||||||||||||||||||||||||||||||||||||||||
| Lowest Quarterly Return, Label [Optional Text] | Worst | |||||||||||||||||||||||||||||||||||||||||||||||||
| Lowest Quarterly Return | (36.94%) | |||||||||||||||||||||||||||||||||||||||||||||||||
| Lowest Quarterly Return, Date | Mar. 31, 2020 | |||||||||||||||||||||||||||||||||||||||||||||||||
| Performance Table Heading | Average Annual Total Returns for the period ending December 31, 2025 | |||||||||||||||||||||||||||||||||||||||||||||||||
| Performance Table Uses Highest Federal Rate | After-tax returns are calculated using the historical highest individual federal marginal income tax rates and do not reflect the impact of state and local taxes. | |||||||||||||||||||||||||||||||||||||||||||||||||
| Performance Table Not Relevant to Tax Deferred | After-tax returns shown are not relevant to investors who hold shares through tax-deferred arrangements, such as 401(k) plans or individual retirement plans. | |||||||||||||||||||||||||||||||||||||||||||||||||
| Performance [Table] |
|
|||||||||||||||||||||||||||||||||||||||||||||||||
| Index No Deduction for Fees, Expenses, or Taxes [Text] | Reflects no deduction for fees, expenses or taxes | |||||||||||||||||||||||||||||||||||||||||||||||||
| Performance Table Closing [Text Block] | Average annual total returns are shown on a before- and after-tax basis for the Fund. After-tax returns are calculated using the historical highest individual federal marginal income tax rates and do not reflect the impact of state and local taxes. Actual after-tax returns depend on an investor’s tax situation and may differ from those shown. After-tax returns shown are not relevant to investors who hold shares through tax-deferred arrangements, such as 401(k) plans or individual retirement plans. |
|||||||||||||||||||||||||||||||||||||||||||||||||
| Performance Availability Website Address [Text] | www.cambriafunds.com/syld | |||||||||||||||||||||||||||||||||||||||||||||||||
| Cambria Foreign Shareholder Yield ETF | ||||||||||||||||||||||||||||||||||||||||||||||||||
| Prospectus [Line Items] | ||||||||||||||||||||||||||||||||||||||||||||||||||
| Bar Chart and Performance Table [Heading] | Performance | |||||||||||||||||||||||||||||||||||||||||||||||||
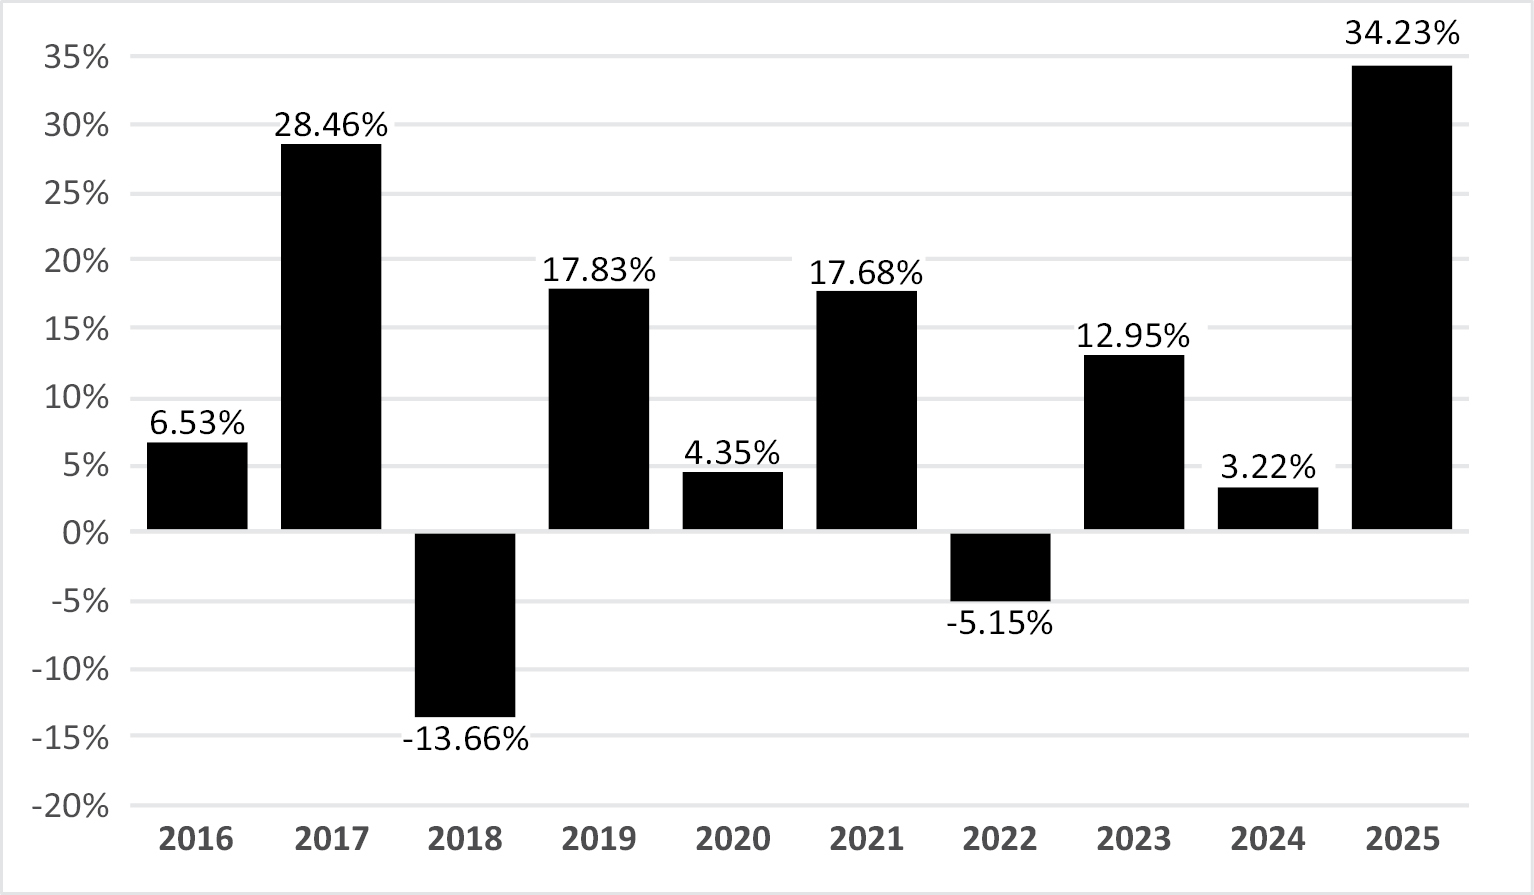
| Performance Narrative [Text Block] | The following bar chart and table indicate the risks of investing in the Fund by showing how the Fund’s average annual total returns compare with those of the MSCI EAFE + Canada Index, which is a relevant broad-based securities market index that provides a measure of the performance of the overall international ex-US equity market. Performance is also shown for an additional index, the MSCI EAFE Index, which represents the overall international equity market, excluding the United States and Canada. All returns include the reinvestment of dividends and distributions. As always, please note that the Fund’s past performance (before and after taxes) does not necessarily indicate how the Fund will perform in the future. Updated performance information is available at www.cambriafunds.com/fyld. The Fund’s investment objective and strategies changed effective June 1, 2020. Prior to that date, Fund performance reflects the investment objective of the Fund when it sought investment results that corresponded (before fees and expenses) generally to the price and yield performance of the Cambria Foreign Shareholder Yield Index. |
|||||||||||||||||||||||||||||||||||||||||||||||||
| Performance Past Does Not Indicate Future [Text] | As always, please note that the Fund’s past performance (before and after taxes) does not necessarily indicate how the Fund will perform in the future. | |||||||||||||||||||||||||||||||||||||||||||||||||
| Performance Information Illustrates Variability of Returns [Text] | The following bar chart and table indicate the risks of investing in the Fund by showing how the Fund’s average annual total returns compare with those of the MSCI EAFE + Canada Index, which is a relevant broad-based securities market index that provides a measure of the performance of the overall international ex-US equity market. | |||||||||||||||||||||||||||||||||||||||||||||||||
| Performance Additional Market Index [Text] | Performance is also shown for an additional index, the MSCI EAFE Index, which represents the overall international equity market, excluding the United States and Canada. | |||||||||||||||||||||||||||||||||||||||||||||||||
| Bar Chart [Heading] | Total Annual Returns for Calendar Year Ended December 31 | |||||||||||||||||||||||||||||||||||||||||||||||||
| Bar Chart [Table] |
|
|||||||||||||||||||||||||||||||||||||||||||||||||
| Bar Chart Closing [Text Block] | As of June 30, 2026, the Fund’s year-to-date total return was 13.49%. Best and Worst Quarter Returns (for the period reflected in the bar chart above) Best: 22.68%, for the quarter ended December 31, 2020. Worst: -31.93%, for the quarter ended March 31, 2020. |
|||||||||||||||||||||||||||||||||||||||||||||||||
| Year to Date Return, Label [Optional Text] | year-to-date total return | |||||||||||||||||||||||||||||||||||||||||||||||||
| Bar Chart, Year to Date Return | 13.49% | |||||||||||||||||||||||||||||||||||||||||||||||||
| Bar Chart, Year to Date Return, Date | Jun. 30, 2026 | |||||||||||||||||||||||||||||||||||||||||||||||||
| Highest Quarterly Return, Label [Optional Text] | Best | |||||||||||||||||||||||||||||||||||||||||||||||||
| Highest Quarterly Return | 22.68% | |||||||||||||||||||||||||||||||||||||||||||||||||
| Highest Quarterly Return, Date | Dec. 31, 2020 | |||||||||||||||||||||||||||||||||||||||||||||||||
| Lowest Quarterly Return, Label [Optional Text] | Worst | |||||||||||||||||||||||||||||||||||||||||||||||||
| Lowest Quarterly Return | (31.93%) | |||||||||||||||||||||||||||||||||||||||||||||||||
| Lowest Quarterly Return, Date | Mar. 31, 2020 | |||||||||||||||||||||||||||||||||||||||||||||||||
| Performance Table Heading | Average Annual Total Returns for the period ending December 31, 2025 | |||||||||||||||||||||||||||||||||||||||||||||||||
| Performance Table Uses Highest Federal Rate | After-tax returns are calculated using the historical highest individual federal marginal income tax rates and do not reflect the impact of state and local taxes. | |||||||||||||||||||||||||||||||||||||||||||||||||
| Performance Table Not Relevant to Tax Deferred | After-tax returns shown are not relevant to investors who hold shares through tax-deferred arrangements, such as 401(k) plans or individual retirement plans. | |||||||||||||||||||||||||||||||||||||||||||||||||
| Performance [Table] |
|
|||||||||||||||||||||||||||||||||||||||||||||||||
| Index No Deduction for Fees, Expenses, or Taxes [Text] | Reflects no deduction for fees, expenses or taxes | |||||||||||||||||||||||||||||||||||||||||||||||||
| Performance Table Closing [Text Block] | Average annual total returns are shown on a before- and after-tax basis for the Fund. After-tax returns are calculated using the historical highest individual federal marginal income tax rates and do not reflect the impact of state and local taxes. Actual after-tax returns depend on an investor’s tax situation and may differ from those shown. After-tax returns shown are not relevant to investors who hold shares through tax-deferred arrangements, such as 401(k) plans or individual retirement plans. |
|||||||||||||||||||||||||||||||||||||||||||||||||
| Performance Availability Website Address [Text] | www.cambriafunds.com/fyld | |||||||||||||||||||||||||||||||||||||||||||||||||
| Cambria Emerging Shareholder Yield ETF | ||||||||||||||||||||||||||||||||||||||||||||||||||
| Prospectus [Line Items] | ||||||||||||||||||||||||||||||||||||||||||||||||||
| Bar Chart and Performance Table [Heading] | Performance | |||||||||||||||||||||||||||||||||||||||||||||||||
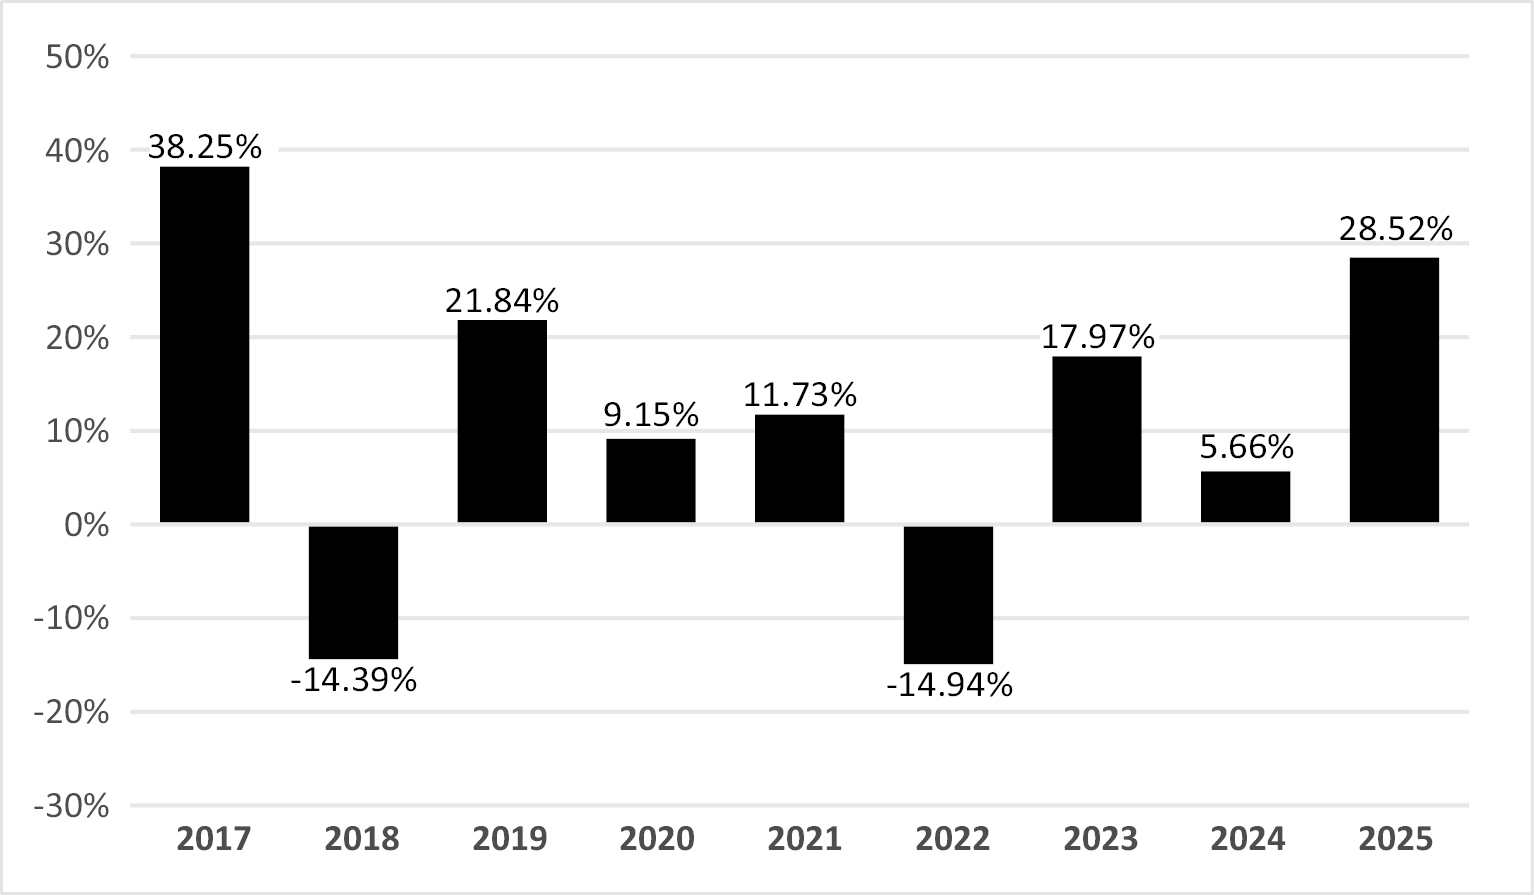
| Performance Narrative [Text Block] | The following bar chart and table indicate the risks of investing in the Fund by showing how the Fund’s average annual total returns compare with those of the MSCI Emerging Markets Index, which is a relevant broad-based securities market index that provides a measure of the performance of the overall emerging markets equity market. All returns include the reinvestment of dividends and distributions. As always, please note that the Fund’s past performance (before and after taxes) does not necessarily indicate how the Fund will perform in the future. Updated performance information is available at www.cambriafunds.com/eyld. The Fund’s investment objective and strategies changed effective June 29, 2020. Prior to that date, Fund performance reflects the investment objective of the Fund when it sought investment results that corresponded (before fees and expenses) generally to the price and yield performance of the Cambria Emerging Shareholder Yield Index. |
|||||||||||||||||||||||||||||||||||||||||||||||||
| Performance Past Does Not Indicate Future [Text] | As always, please note that the Fund’s past performance (before and after taxes) does not necessarily indicate how the Fund will perform in the future. | |||||||||||||||||||||||||||||||||||||||||||||||||
| Performance Information Illustrates Variability of Returns [Text] | The following bar chart and table indicate the risks of investing in the Fund by showing how the Fund’s average annual total returns compare with those of the MSCI Emerging Markets Index, which is a relevant broad-based securities market index that provides a measure of the performance of the overall emerging markets equity market. | |||||||||||||||||||||||||||||||||||||||||||||||||
| Bar Chart [Heading] | Total Annual Returns for Calendar Year Ended December 31 | |||||||||||||||||||||||||||||||||||||||||||||||||
| Bar Chart [Table] |
|
|||||||||||||||||||||||||||||||||||||||||||||||||
| Bar Chart Closing [Text Block] | As of June 30, 2026, the Fund’s year-to-date total return was 19.41%. Best and Worst Quarter Returns (for the period reflected in the bar chart above) Best: 22.74%, for the quarter ended December 31, 2020. Worst: -31.18%, for the quarter ended March 31, 2020. |
|||||||||||||||||||||||||||||||||||||||||||||||||
| Year to Date Return, Label [Optional Text] | year-to-date total return | |||||||||||||||||||||||||||||||||||||||||||||||||
| Bar Chart, Year to Date Return | 19.41% | |||||||||||||||||||||||||||||||||||||||||||||||||
| Bar Chart, Year to Date Return, Date | Jun. 30, 2026 | |||||||||||||||||||||||||||||||||||||||||||||||||
| Highest Quarterly Return, Label [Optional Text] | Best | |||||||||||||||||||||||||||||||||||||||||||||||||
| Highest Quarterly Return | 22.74% | |||||||||||||||||||||||||||||||||||||||||||||||||
| Highest Quarterly Return, Date | Dec. 31, 2020 | |||||||||||||||||||||||||||||||||||||||||||||||||
| Lowest Quarterly Return, Label [Optional Text] | Worst | |||||||||||||||||||||||||||||||||||||||||||||||||
| Lowest Quarterly Return | (31.18%) | |||||||||||||||||||||||||||||||||||||||||||||||||
| Lowest Quarterly Return, Date | Mar. 31, 2020 | |||||||||||||||||||||||||||||||||||||||||||||||||
| Performance Table Heading | Average Annual Total Returns for the period ending December 31, 2025 | |||||||||||||||||||||||||||||||||||||||||||||||||
| Performance Table Uses Highest Federal Rate | After-tax returns are calculated using the historical highest individual federal marginal income tax rates and do not reflect the impact of state and local taxes. | |||||||||||||||||||||||||||||||||||||||||||||||||
| Performance Table Not Relevant to Tax Deferred | After-tax returns shown are not relevant to investors who hold shares through tax-deferred arrangements, such as 401(k) plans or individual retirement plans. | |||||||||||||||||||||||||||||||||||||||||||||||||
| Performance [Table] |
|
|||||||||||||||||||||||||||||||||||||||||||||||||
| Index No Deduction for Fees, Expenses, or Taxes [Text] | Reflects no deduction for fees, expenses or taxes | |||||||||||||||||||||||||||||||||||||||||||||||||
| Performance Table Closing [Text Block] | Average annual total returns are shown on a before- and after-tax basis for the Fund. After-tax returns are calculated using the historical highest individual federal marginal income tax rates and do not reflect the impact of state and local taxes. Actual after-tax returns depend on an investor’s tax situation and may differ from those shown. After-tax returns shown are not relevant to investors who hold shares through tax-deferred arrangements, such as 401(k) plans or individual retirement plans. |
|||||||||||||||||||||||||||||||||||||||||||||||||
| Performance Availability Website Address [Text] | www.cambriafunds.com/eyld | |||||||||||||||||||||||||||||||||||||||||||||||||
| Cambria Global Value ETF | ||||||||||||||||||||||||||||||||||||||||||||||||||
| Prospectus [Line Items] | ||||||||||||||||||||||||||||||||||||||||||||||||||
| Bar Chart and Performance Table [Heading] | Performance | |||||||||||||||||||||||||||||||||||||||||||||||||
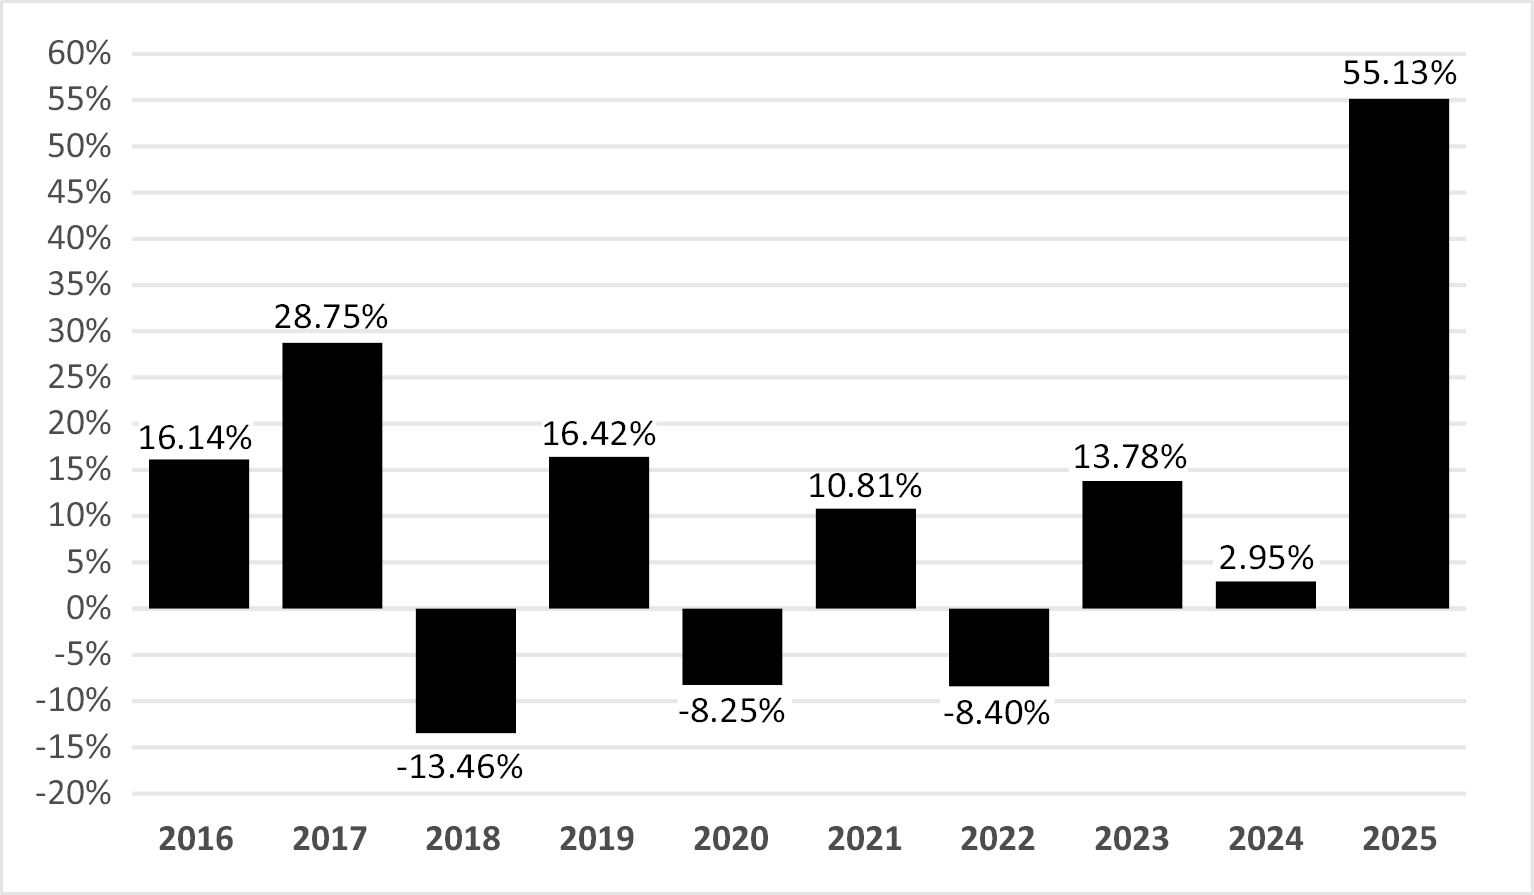
| Performance Narrative [Text Block] | The following bar chart and table indicate the risks of investing in the Fund by showing how the Fund’s average annual total returns compare with those of the MSCI ACWI Index, which is a relevant broad-based securities market index that provides a measure of the performance of the overall global equity market. All returns include the reinvestment of dividends and distributions. As always, please note that the Fund’s past performance (before and after taxes) does not necessarily indicate how the Fund will perform in the future. Updated performance information is available at www.cambriafunds.com/gval. The Fund’s investment objective and strategies changed effective June 29, 2020. Prior to that date, Fund performance reflects the investment objective of the Fund when it sought investment results that corresponded (before fees and expenses) generally to the price and yield performance of the Cambria Global Value Index. |
|||||||||||||||||||||||||||||||||||||||||||||||||
| Performance Past Does Not Indicate Future [Text] | As always, please note that the Fund’s past performance (before and after taxes) does not necessarily indicate how the Fund will perform in the future. | |||||||||||||||||||||||||||||||||||||||||||||||||
| Performance Information Illustrates Variability of Returns [Text] | The following bar chart and table indicate the risks of investing in the Fund by showing how the Fund’s average annual total returns compare with those of the MSCI ACWI Index, which is a relevant broad-based securities market index that provides a measure of the performance of the overall global equity market. | |||||||||||||||||||||||||||||||||||||||||||||||||
| Bar Chart [Heading] | Total Annual Returns for Calendar Year Ended December 31 | |||||||||||||||||||||||||||||||||||||||||||||||||
| Bar Chart [Table] |
|
|||||||||||||||||||||||||||||||||||||||||||||||||
| Bar Chart Closing [Text Block] | As of June 30, 2026, the Fund’s year-to-date total return was 15.52%. Best and Worst Quarter Returns (for the period reflected in the bar chart above) Best: 24.79%, for the quarter ended December 31, 2020. Worst: -34.31%, for the quarter ended March 31, 2020. |
|||||||||||||||||||||||||||||||||||||||||||||||||
| Year to Date Return, Label [Optional Text] | year-to-date total return | |||||||||||||||||||||||||||||||||||||||||||||||||
| Bar Chart, Year to Date Return | 15.52% | |||||||||||||||||||||||||||||||||||||||||||||||||
| Bar Chart, Year to Date Return, Date | Jun. 30, 2026 | |||||||||||||||||||||||||||||||||||||||||||||||||
| Highest Quarterly Return, Label [Optional Text] | Best | |||||||||||||||||||||||||||||||||||||||||||||||||
| Highest Quarterly Return | 24.79% | |||||||||||||||||||||||||||||||||||||||||||||||||
| Highest Quarterly Return, Date | Dec. 31, 2020 | |||||||||||||||||||||||||||||||||||||||||||||||||
| Lowest Quarterly Return, Label [Optional Text] | Worst | |||||||||||||||||||||||||||||||||||||||||||||||||
| Lowest Quarterly Return | (34.31%) | |||||||||||||||||||||||||||||||||||||||||||||||||
| Lowest Quarterly Return, Date | Mar. 31, 2020 | |||||||||||||||||||||||||||||||||||||||||||||||||
| Performance Table Heading | Average Annual Total Returns for the period ending December 31, 2025 | |||||||||||||||||||||||||||||||||||||||||||||||||
| Performance Table Uses Highest Federal Rate | After-tax returns are calculated using the historical highest individual federal marginal income tax rates and do not reflect the impact of state and local taxes. | |||||||||||||||||||||||||||||||||||||||||||||||||
| Performance Table Not Relevant to Tax Deferred | After-tax returns shown are not relevant to investors who hold shares through tax-deferred arrangements, such as 401(k) plans or individual retirement plans. | |||||||||||||||||||||||||||||||||||||||||||||||||
| Performance [Table] |
|
|||||||||||||||||||||||||||||||||||||||||||||||||
| Index No Deduction for Fees, Expenses, or Taxes [Text] | Reflects no deduction for fees, expenses or taxes | |||||||||||||||||||||||||||||||||||||||||||||||||
| Performance Table Closing [Text Block] | Average annual total returns are shown on a before- and after-tax basis for the Fund. After-tax returns are calculated using the historical highest individual federal marginal income tax rates and do not reflect the impact of state and local taxes. Actual after-tax returns depend on an investor’s tax situation and may differ from those shown. After-tax returns shown are not relevant to investors who hold shares through tax-deferred arrangements, such as 401(k) plans or individual retirement plans. |
|||||||||||||||||||||||||||||||||||||||||||||||||
| Performance Availability Website Address [Text] | www.cambriafunds.com/gval | |||||||||||||||||||||||||||||||||||||||||||||||||
| Cambria Global Momentum ETF | ||||||||||||||||||||||||||||||||||||||||||||||||||
| Prospectus [Line Items] | ||||||||||||||||||||||||||||||||||||||||||||||||||
| Bar Chart and Performance Table [Heading] | Performance | |||||||||||||||||||||||||||||||||||||||||||||||||
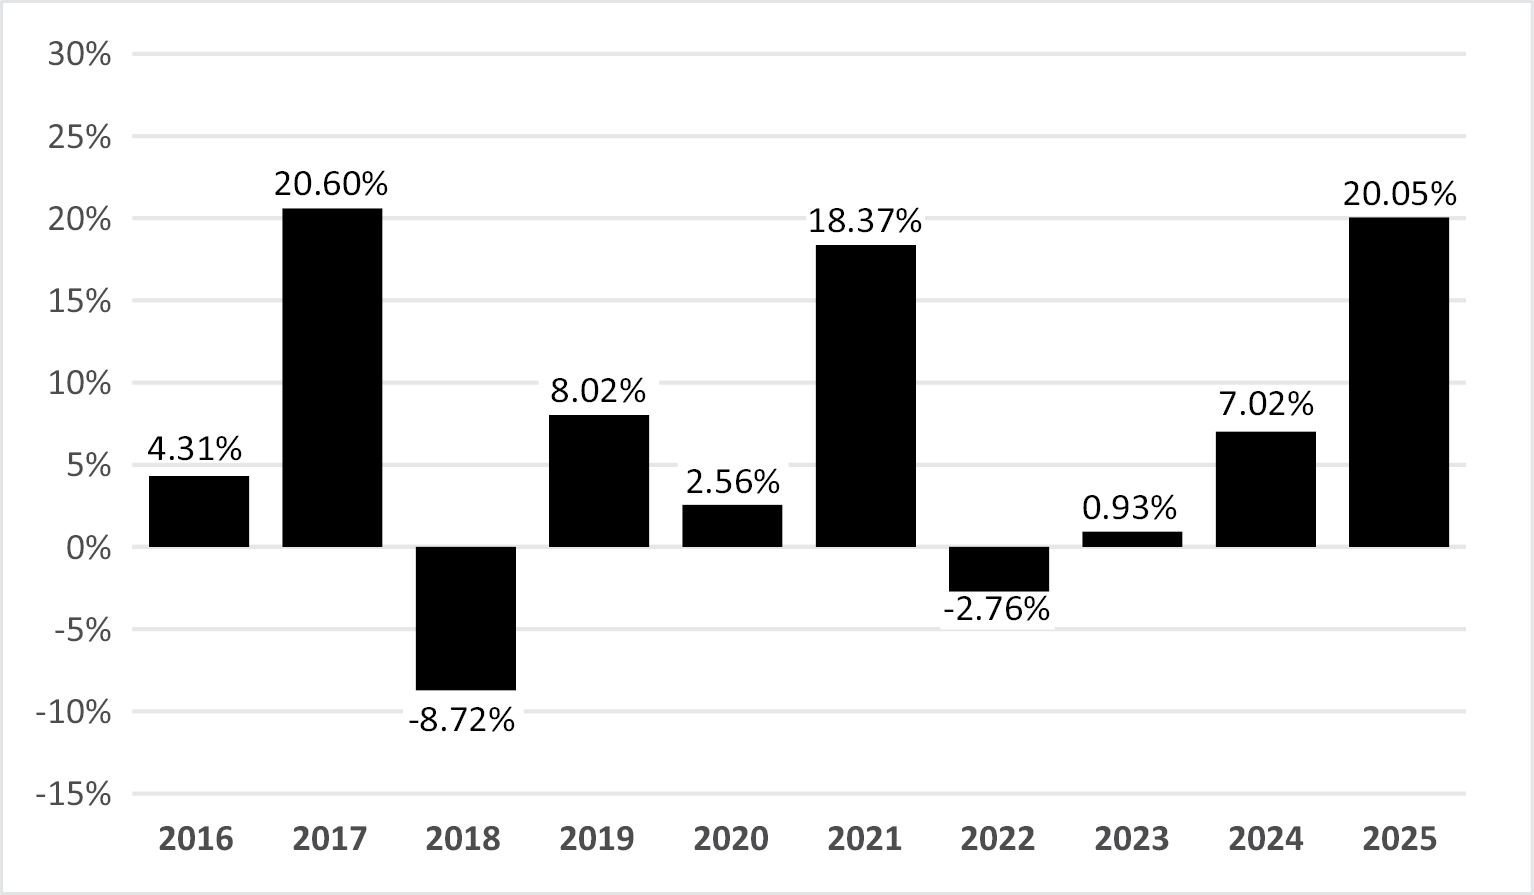
| Performance Narrative [Text Block] | The following bar chart and table indicate the risks of investing in the Fund by showing how the Fund’s average annual total returns compare with those of the Bloomberg Global Aggregate Index and the MSCI ACWI Index, each of which is a relevant broad-based securities market index. The Bloomberg Global Aggregate Index provides a measure of the performance of the overall global debt market, and the MSCI ACWI Index provides a measure of the performance of the overall global equity market. Performance is also shown for an additional index, the S&P Balanced Equity & Bond Moderate Index, which provides a measure for broad asset allocation strategies. All returns include the reinvestment of dividends and distributions. As always, please note that the Fund’s past performance (before and after taxes) does not necessarily indicate how the Fund will perform in the future. Updated performance information is available at www.cambriafunds.com/gmom. |
|||||||||||||||||||||||||||||||||||||||||||||||||
| Performance Past Does Not Indicate Future [Text] | As always, please note that the Fund’s past performance (before and after taxes) does not necessarily indicate how the Fund will perform in the future. | |||||||||||||||||||||||||||||||||||||||||||||||||
| Performance Information Illustrates Variability of Returns [Text] | The following bar chart and table indicate the risks of investing in the Fund by showing how the Fund’s average annual total returns compare with those of the Bloomberg Global Aggregate Index and the MSCI ACWI Index, each of which is a relevant broad-based securities market index. | |||||||||||||||||||||||||||||||||||||||||||||||||
| Performance Additional Market Index [Text] | Performance is also shown for an additional index, the S&P Balanced Equity & Bond Moderate Index, which provides a measure for broad asset allocation strategies. | |||||||||||||||||||||||||||||||||||||||||||||||||
| Bar Chart [Heading] | Total Annual Returns for Calendar Year Ended December 31 | |||||||||||||||||||||||||||||||||||||||||||||||||
| Bar Chart [Table] |
|
|||||||||||||||||||||||||||||||||||||||||||||||||
| Bar Chart Closing [Text Block] | As of June 30, 2026, the Fund’s year-to-date total return was 6.62%. Best and Worst Quarter Returns (for the period reflected in the bar chart above) Best: 9.62%, for the quarter ended March 31, 2021. Worst: -10.77%, for the quarter ended March 31, 2020. |
|||||||||||||||||||||||||||||||||||||||||||||||||
| Year to Date Return, Label [Optional Text] | year-to-date total return | |||||||||||||||||||||||||||||||||||||||||||||||||
| Bar Chart, Year to Date Return | 6.62% | |||||||||||||||||||||||||||||||||||||||||||||||||
| Bar Chart, Year to Date Return, Date | Jun. 30, 2026 | |||||||||||||||||||||||||||||||||||||||||||||||||
| Highest Quarterly Return, Label [Optional Text] | Best | |||||||||||||||||||||||||||||||||||||||||||||||||
| Highest Quarterly Return | 9.62% | |||||||||||||||||||||||||||||||||||||||||||||||||
| Highest Quarterly Return, Date | Mar. 31, 2021 | |||||||||||||||||||||||||||||||||||||||||||||||||
| Lowest Quarterly Return, Label [Optional Text] | Worst | |||||||||||||||||||||||||||||||||||||||||||||||||
| Lowest Quarterly Return | (10.77%) | |||||||||||||||||||||||||||||||||||||||||||||||||
| Lowest Quarterly Return, Date | Mar. 31, 2020 | |||||||||||||||||||||||||||||||||||||||||||||||||
| Performance Table Heading | Average Annual Total Returns for the period ending December 31, 2025 | |||||||||||||||||||||||||||||||||||||||||||||||||
| Performance Table Uses Highest Federal Rate | After-tax returns are calculated using the historical highest individual federal marginal income tax rates and do not reflect the impact of state and local taxes. | |||||||||||||||||||||||||||||||||||||||||||||||||
| Performance Table Not Relevant to Tax Deferred | After-tax returns shown are not relevant to investors who hold shares through tax-deferred arrangements, such as 401(k) plans or individual retirement plans. | |||||||||||||||||||||||||||||||||||||||||||||||||
| Performance [Table] |
|
|||||||||||||||||||||||||||||||||||||||||||||||||
| Index No Deduction for Fees, Expenses, or Taxes [Text] | Reflects no deduction for fees, expenses or taxes | |||||||||||||||||||||||||||||||||||||||||||||||||
| Performance Table Closing [Text Block] | Average annual total returns are shown on a before- and after-tax basis for the Fund. After-tax returns are calculated using the historical highest individual federal marginal income tax rates and do not reflect the impact of state and local taxes. Actual after-tax returns depend on an investor’s tax situation and may differ from those shown. After-tax returns shown are not relevant to investors who hold shares through tax-deferred arrangements, such as 401(k) plans or individual retirement plans. |
|||||||||||||||||||||||||||||||||||||||||||||||||
| Performance Availability Website Address [Text] | www.cambriafunds.com/gmom | |||||||||||||||||||||||||||||||||||||||||||||||||
| Cambria Value and Momentum Hedged Equity ETF (formerly, Cambria Value and Momentum ETF) | ||||||||||||||||||||||||||||||||||||||||||||||||||
| Prospectus [Line Items] | ||||||||||||||||||||||||||||||||||||||||||||||||||
| Bar Chart and Performance Table [Heading] | Performance | |||||||||||||||||||||||||||||||||||||||||||||||||
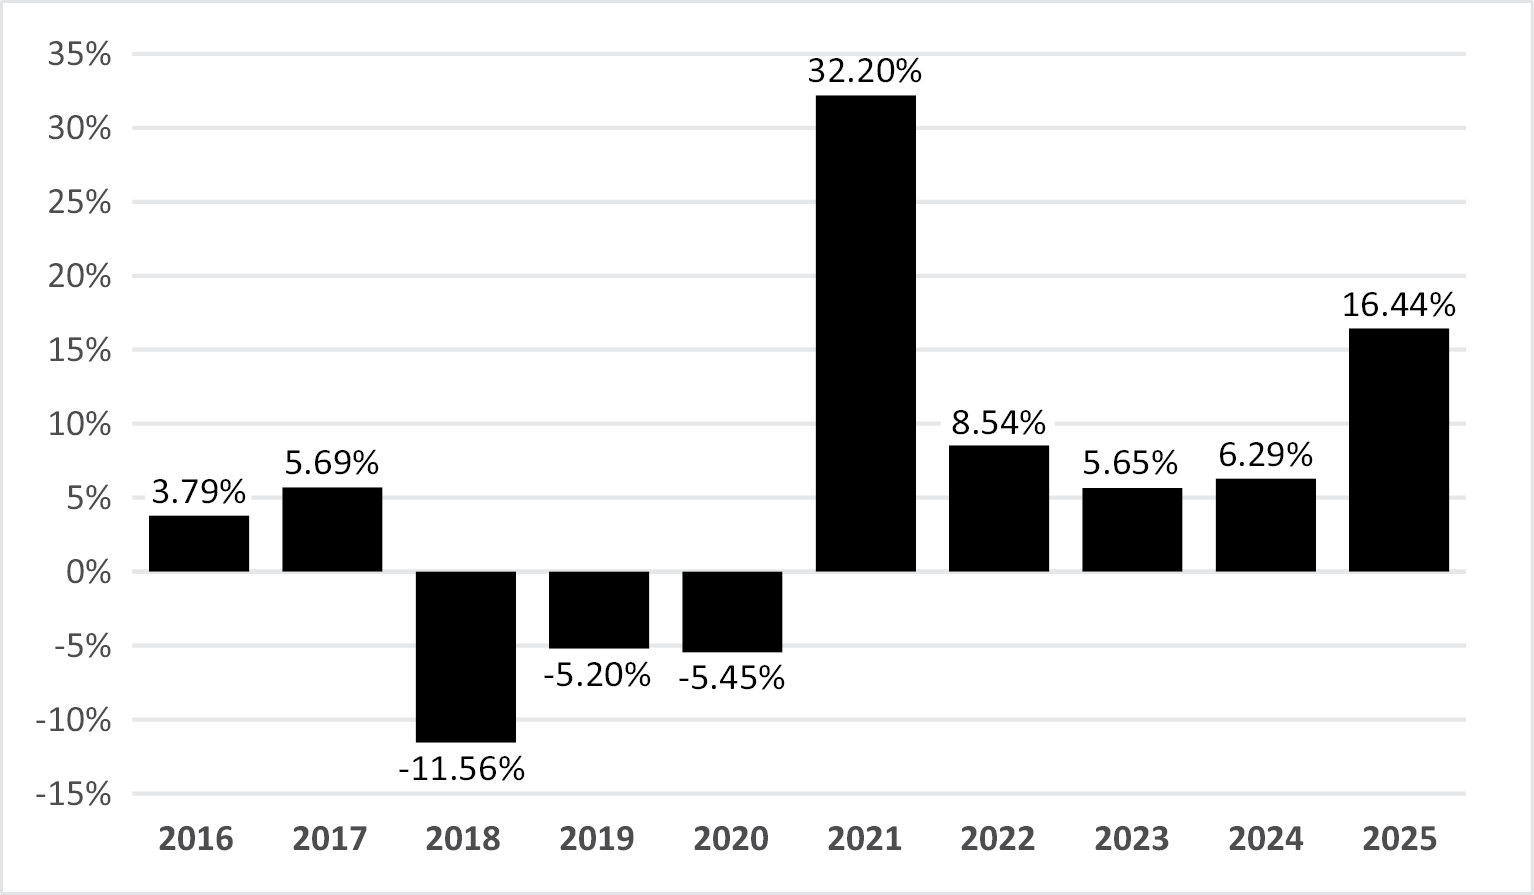
| Performance Narrative [Text Block] | The following bar chart and table indicate the risks of investing in the Fund by showing how the Fund’s average annual total returns compare with those of the S&P 500 Index, which is a relevant broad-based securities market index that provides a measure of the performance of the overall domestic equity market. All returns include the reinvestment of dividends and distributions. As always, please note that the Fund’s past performance (before and after taxes) does not necessarily indicate how the Fund will perform in the future. Updated performance information is available at www.cambriafunds.com/vamo. |
|||||||||||||||||||||||||||||||||||||||||||||||||
| Performance Past Does Not Indicate Future [Text] | As always, please note that the Fund’s past performance (before and after taxes) does not necessarily indicate how the Fund will perform in the future. | |||||||||||||||||||||||||||||||||||||||||||||||||
| Performance Information Illustrates Variability of Returns [Text] | The following bar chart and table indicate the risks of investing in the Fund by showing how the Fund’s average annual total returns compare with those of the S&P 500 Index, which is a relevant broad-based securities market index that provides a measure of the performance of the overall domestic equity market. | |||||||||||||||||||||||||||||||||||||||||||||||||
| Bar Chart [Heading] | Total Annual Returns for Calendar Year Ended December 31 | |||||||||||||||||||||||||||||||||||||||||||||||||
| Bar Chart [Table] |
|
|||||||||||||||||||||||||||||||||||||||||||||||||
| Bar Chart Closing [Text Block] | As of June 30, 2026, the Fund’s year-to-date total return was 5.44%. Best and Worst Quarter Returns (for the period reflected in the bar chart above) Best: 20.21%, for the quarter ended March 31, 2021. Worst: -18.87% for the quarter ended March 31, 2020. |
|||||||||||||||||||||||||||||||||||||||||||||||||
| Year to Date Return, Label [Optional Text] | year-to-date total return | |||||||||||||||||||||||||||||||||||||||||||||||||
| Bar Chart, Year to Date Return | 5.44% | |||||||||||||||||||||||||||||||||||||||||||||||||
| Bar Chart, Year to Date Return, Date | Jun. 30, 2026 | |||||||||||||||||||||||||||||||||||||||||||||||||
| Highest Quarterly Return, Label [Optional Text] | Best | |||||||||||||||||||||||||||||||||||||||||||||||||
| Highest Quarterly Return | 20.21% | |||||||||||||||||||||||||||||||||||||||||||||||||
| Highest Quarterly Return, Date | Mar. 31, 2021 | |||||||||||||||||||||||||||||||||||||||||||||||||
| Lowest Quarterly Return, Label [Optional Text] | Worst | |||||||||||||||||||||||||||||||||||||||||||||||||
| Lowest Quarterly Return | (18.87%) | |||||||||||||||||||||||||||||||||||||||||||||||||
| Lowest Quarterly Return, Date | Mar. 31, 2020 | |||||||||||||||||||||||||||||||||||||||||||||||||
| Performance Table Heading | Average Annual Total Returns for the period ending December 31, 2025 | |||||||||||||||||||||||||||||||||||||||||||||||||
| Performance Table Uses Highest Federal Rate | After-tax returns are calculated using the historical highest individual federal marginal income tax rates and do not reflect the impact of state and local taxes. | |||||||||||||||||||||||||||||||||||||||||||||||||
| Performance Table Not Relevant to Tax Deferred | After-tax returns shown are not relevant to investors who hold shares through tax-deferred arrangements, such as 401(k) plans or individual retirement plans. | |||||||||||||||||||||||||||||||||||||||||||||||||
| Performance [Table] |
|
|||||||||||||||||||||||||||||||||||||||||||||||||
| Index No Deduction for Fees, Expenses, or Taxes [Text] | Reflects no deduction for fees, expenses or taxes | |||||||||||||||||||||||||||||||||||||||||||||||||
| Performance Table Closing [Text Block] | Average annual total returns are shown on a before- and after-tax basis for the Fund. After-tax returns are calculated using the historical highest individual federal marginal income tax rates and do not reflect the impact of state and local taxes. Actual after-tax returns depend on an investor’s tax situation and may differ from those shown. After-tax returns shown are not relevant to investors who hold shares through tax-deferred arrangements, such as 401(k) plans or individual retirement plans. |
|||||||||||||||||||||||||||||||||||||||||||||||||
| Performance Availability Website Address [Text] | www.cambriafunds.com/vamo | |||||||||||||||||||||||||||||||||||||||||||||||||
| Cambria Global Asset Allocation ETF | ||||||||||||||||||||||||||||||||||||||||||||||||||
| Prospectus [Line Items] | ||||||||||||||||||||||||||||||||||||||||||||||||||
| Bar Chart and Performance Table [Heading] | Performance | |||||||||||||||||||||||||||||||||||||||||||||||||
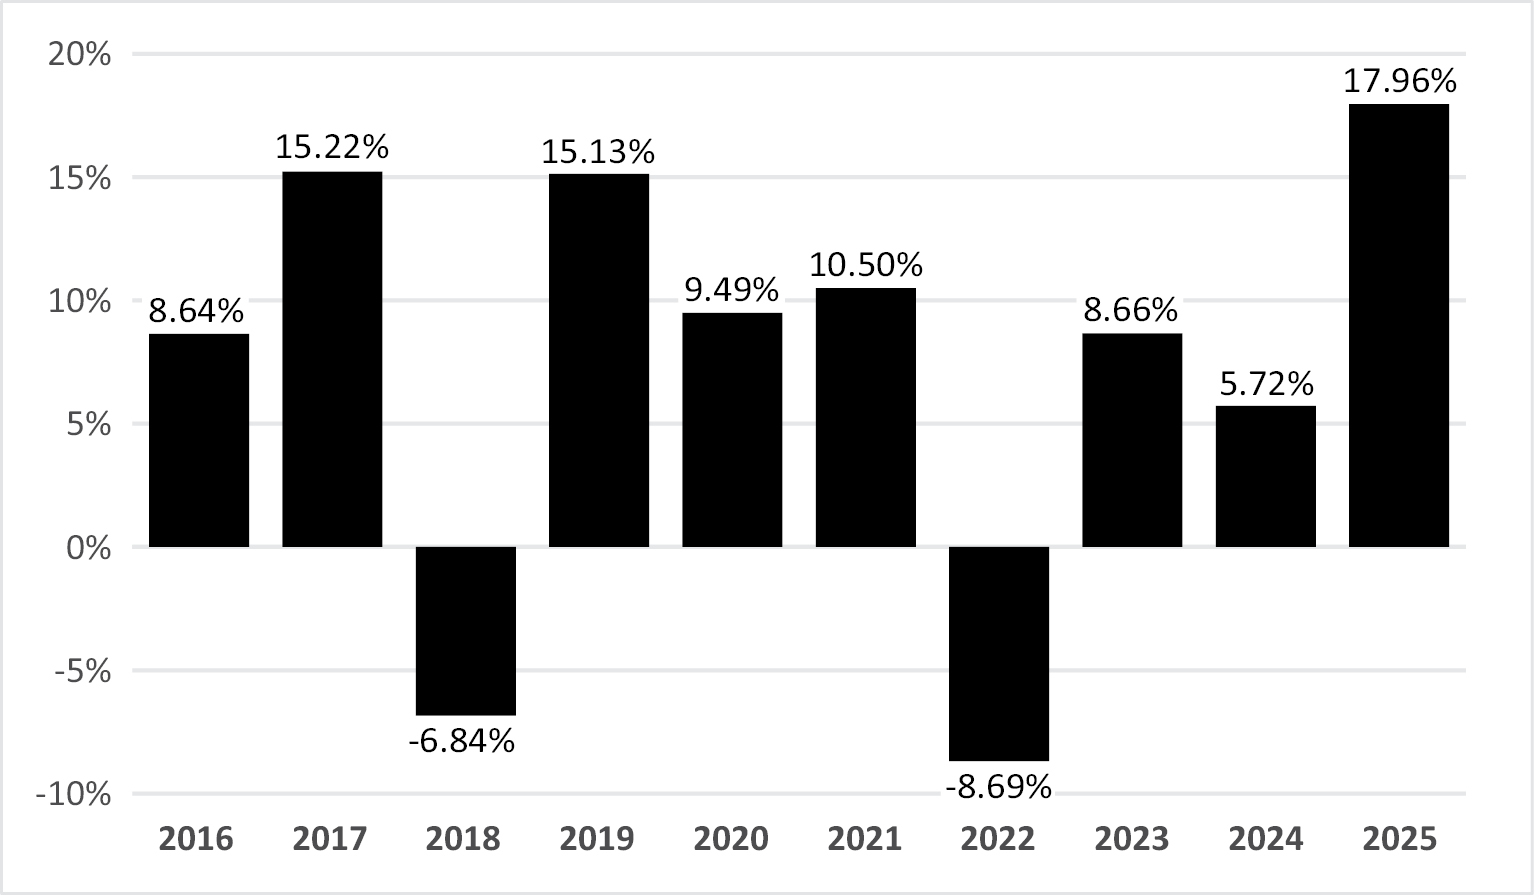
| Performance Narrative [Text Block] | The following bar chart and table indicate the risks of investing in the Fund by showing how the Fund’s average annual total returns compare with those of the Bloomberg Global Aggregate Index and the MSCI ACWI Index, each of which is a relevant broad-based securities market index. The Bloomberg Global Aggregate Index provides a measure of the performance of the overall global debt market, and the MSCI ACWI Index provides a measure of the performance of the overall global equity market. Performance is also shown for an additional index, the S&P Balanced Equity & Bond Moderate Index, which provides a measure for broad asset allocation strategies. All returns include the reinvestment of dividends and distributions. As always, please note that the Fund’s past performance (before and after taxes) does not necessarily indicate how the Fund will perform in the future. Updated performance information is available at www.cambriafunds.com/gaa. The Fund’s investment objective and strategies changed effective January 1, 2019. From December 9, 2014 to December 31, 2018, Fund performance reflects the investment objective of the Fund when it sought investment results that corresponded (before fees and expenses) generally to the price and yield performance of the Cambria Global Asset Allocation Index. |
|||||||||||||||||||||||||||||||||||||||||||||||||
| Performance Past Does Not Indicate Future [Text] | As always, please note that the Fund’s past performance (before and after taxes) does not necessarily indicate how the Fund will perform in the future. | |||||||||||||||||||||||||||||||||||||||||||||||||
| Performance Information Illustrates Variability of Returns [Text] | The following bar chart and table indicate the risks of investing in the Fund by showing how the Fund’s average annual total returns compare with those of the Bloomberg Global Aggregate Index and the MSCI ACWI Index, each of which is a relevant broad-based securities market index. | |||||||||||||||||||||||||||||||||||||||||||||||||
| Performance Additional Market Index [Text] | Performance is also shown for an additional index, the S&P Balanced Equity & Bond Moderate Index, which provides a measure for broad asset allocation strategies. | |||||||||||||||||||||||||||||||||||||||||||||||||
| Bar Chart [Heading] | Total Annual Returns for Calendar Year Ended December 31 | |||||||||||||||||||||||||||||||||||||||||||||||||
| Bar Chart [Table] |
|
|||||||||||||||||||||||||||||||||||||||||||||||||
| Bar Chart Closing [Text Block] | As of June 30, 2026, the Fund’s year-to-date total return was 8.66%. Best and Worst Quarter Returns (for the period reflected in the bar chart above) Best: 11.92%, for the quarter ended June 30, 2020. Worst: -15.68%, for the quarter ended March 31, 2020. |
|||||||||||||||||||||||||||||||||||||||||||||||||
| Year to Date Return, Label [Optional Text] | year-to-date total return | |||||||||||||||||||||||||||||||||||||||||||||||||
| Bar Chart, Year to Date Return | 8.66% | |||||||||||||||||||||||||||||||||||||||||||||||||
| Bar Chart, Year to Date Return, Date | Jun. 30, 2026 | |||||||||||||||||||||||||||||||||||||||||||||||||
| Highest Quarterly Return, Label [Optional Text] | Best | |||||||||||||||||||||||||||||||||||||||||||||||||
| Highest Quarterly Return | 11.92% | |||||||||||||||||||||||||||||||||||||||||||||||||
| Highest Quarterly Return, Date | Jun. 30, 2020 | |||||||||||||||||||||||||||||||||||||||||||||||||
| Lowest Quarterly Return, Label [Optional Text] | Worst | |||||||||||||||||||||||||||||||||||||||||||||||||
| Lowest Quarterly Return | (15.68%) | |||||||||||||||||||||||||||||||||||||||||||||||||
| Lowest Quarterly Return, Date | Mar. 31, 2020 | |||||||||||||||||||||||||||||||||||||||||||||||||
| Performance Table Heading | Average Annual Total Returns for the period ending December 31, 2025 | |||||||||||||||||||||||||||||||||||||||||||||||||
| Performance Table Uses Highest Federal Rate | After-tax returns are calculated using the historical highest individual federal marginal income tax rates and do not reflect the impact of state and local taxes. | |||||||||||||||||||||||||||||||||||||||||||||||||
| Performance Table Not Relevant to Tax Deferred | After-tax returns shown are not relevant to investors who hold shares through tax-deferred arrangements, such as 401(k) plans or individual retirement plans. | |||||||||||||||||||||||||||||||||||||||||||||||||
| Performance [Table] |
* The Fund’s objective changed effective January 1, 2019. Prior to that date, the Fund was passively managed and sought to track the performance, before fees and expenses, of the Cambria Global Asset Allocation Index. As of January 1, 2019, the Fund is actively managed and seeks income and capital appreciation. |
|||||||||||||||||||||||||||||||||||||||||||||||||
| Index No Deduction for Fees, Expenses, or Taxes [Text] | Reflects no deduction for fees, expenses or taxes | |||||||||||||||||||||||||||||||||||||||||||||||||
| Performance Table Closing [Text Block] | Average annual total returns are shown on a before- and after-tax basis for the Fund. After-tax returns are calculated using the historical highest individual federal marginal income tax rates and do not reflect the impact of state and local taxes. Actual after-tax returns depend on an investor’s tax situation and may differ from those shown. After-tax returns shown are not relevant to investors who hold shares through tax-deferred arrangements, such as 401(k) plans or individual retirement plans. |
|||||||||||||||||||||||||||||||||||||||||||||||||
| Performance Availability Website Address [Text] | www.cambriafunds.com/gaa | |||||||||||||||||||||||||||||||||||||||||||||||||
| Cambria Tail Risk ETF | ||||||||||||||||||||||||||||||||||||||||||||||||||
| Prospectus [Line Items] | ||||||||||||||||||||||||||||||||||||||||||||||||||
| Bar Chart and Performance Table [Heading] | Performance | |||||||||||||||||||||||||||||||||||||||||||||||||
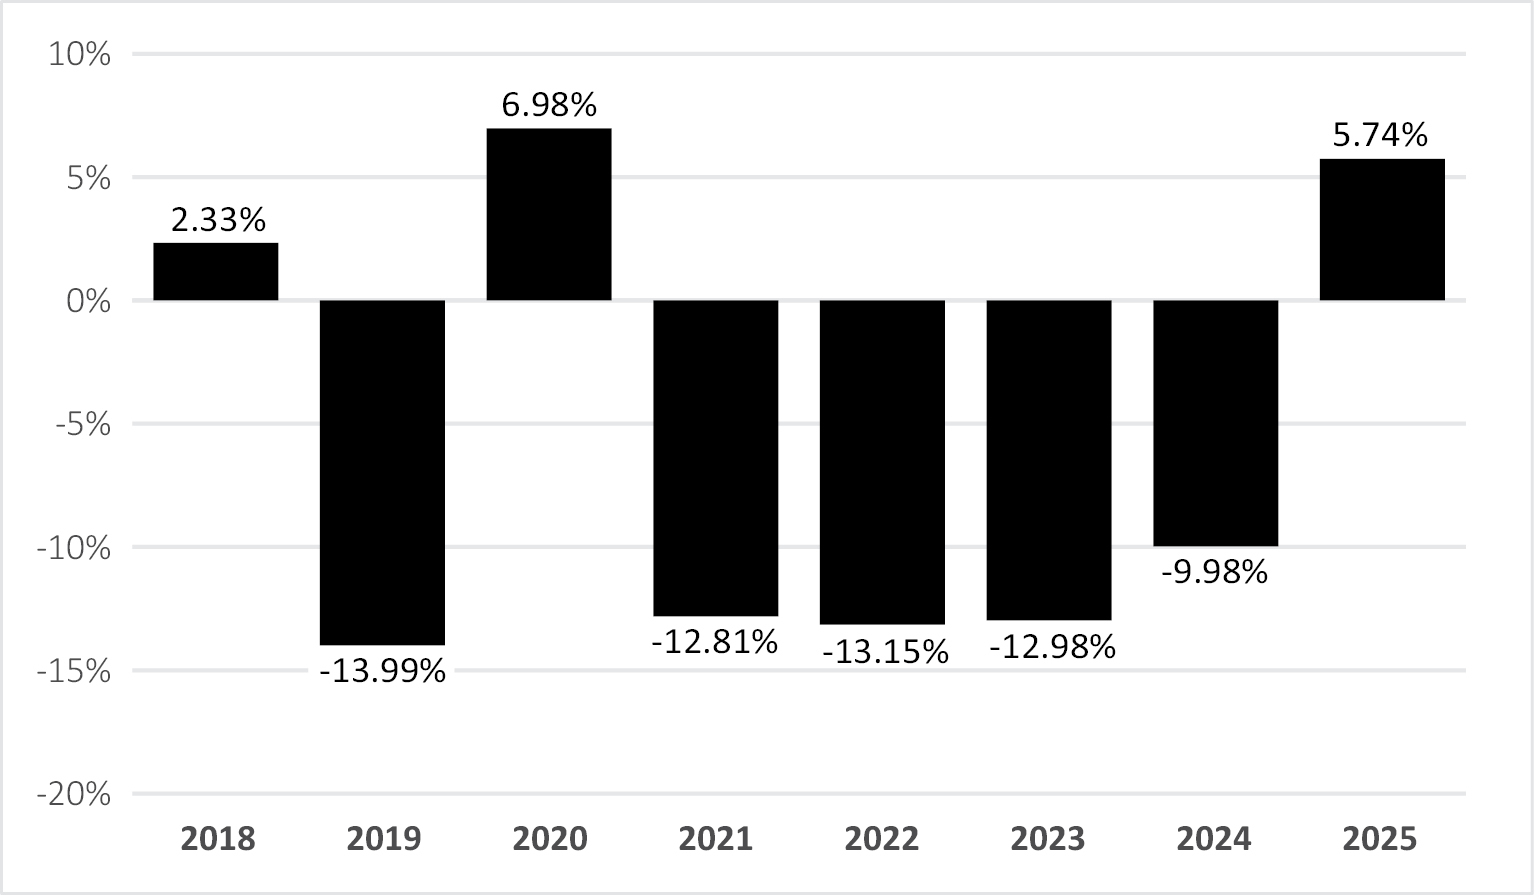
| Performance Narrative [Text Block] | The following bar chart and table indicate the risks of investing in the Fund by showing how the Fund’s average annual total returns compare with those of the S&P 500 Index, which is a relevant broad-based securities market index that provides a measure of the performance of the overall domestic equity market. Performance is also shown for an additional index, the Bloomberg Short Treasury Index, which is composed of zero-coupon Treasury Bills and fixed-rate Treasury bonds with a maturity between one and 12 months. All returns include the reinvestment of dividends and distributions. As always, please note that the Fund’s past performance (before and after taxes) does not necessarily indicate how the Fund will perform in the future. Updated performance information is available at www.cambriafunds.com/tail. |
|||||||||||||||||||||||||||||||||||||||||||||||||
| Performance Past Does Not Indicate Future [Text] | As always, please note that the Fund’s past performance (before and after taxes) does not necessarily indicate how the Fund will perform in the future. | |||||||||||||||||||||||||||||||||||||||||||||||||
| Performance Information Illustrates Variability of Returns [Text] | The following bar chart and table indicate the risks of investing in the Fund by showing how the Fund’s average annual total returns compare with those of the S&P 500 Index, which is a relevant broad-based securities market index that provides a measure of the performance of the overall domestic equity market. | |||||||||||||||||||||||||||||||||||||||||||||||||
| Performance Additional Market Index [Text] | Performance is also shown for an additional index, the Bloomberg Short Treasury Index, which is composed of zero-coupon Treasury Bills and fixed-rate Treasury bonds with a maturity between one and 12 months. | |||||||||||||||||||||||||||||||||||||||||||||||||
| Bar Chart [Heading] | Total Annual Returns for Calendar Year Ended December 31 | |||||||||||||||||||||||||||||||||||||||||||||||||
| Bar Chart [Table] |
|
|||||||||||||||||||||||||||||||||||||||||||||||||
| Bar Chart Closing [Text Block] | As of June 30, 2026, the Fund’s year-to-date total return was -6.38%. Best and Worst Quarter Returns (for the period reflected in the bar chart above) Best: 23.49%, for the quarter ended March 31, 2020. Worst: -10.32%, for the quarter ended March 31, 2019. |
|||||||||||||||||||||||||||||||||||||||||||||||||
| Year to Date Return, Label [Optional Text] | year-to-date total return | |||||||||||||||||||||||||||||||||||||||||||||||||
| Bar Chart, Year to Date Return | (6.38%) | |||||||||||||||||||||||||||||||||||||||||||||||||
| Bar Chart, Year to Date Return, Date | Jun. 30, 2026 | |||||||||||||||||||||||||||||||||||||||||||||||||
| Highest Quarterly Return, Label [Optional Text] | Best | |||||||||||||||||||||||||||||||||||||||||||||||||
| Highest Quarterly Return | 23.49% | |||||||||||||||||||||||||||||||||||||||||||||||||
| Highest Quarterly Return, Date | Mar. 31, 2020 | |||||||||||||||||||||||||||||||||||||||||||||||||
| Lowest Quarterly Return, Label [Optional Text] | Worst | |||||||||||||||||||||||||||||||||||||||||||||||||
| Lowest Quarterly Return | (10.32%) | |||||||||||||||||||||||||||||||||||||||||||||||||
| Lowest Quarterly Return, Date | Mar. 31, 2019 | |||||||||||||||||||||||||||||||||||||||||||||||||
| Performance Table Heading | Average Annual Total Returns for the period ending December 31, 2025 | |||||||||||||||||||||||||||||||||||||||||||||||||
| Performance Table Uses Highest Federal Rate | After-tax returns are calculated using the historical highest individual federal marginal income tax rates and do not reflect the impact of state and local taxes. | |||||||||||||||||||||||||||||||||||||||||||||||||
| Performance Table Not Relevant to Tax Deferred | After-tax returns shown are not relevant to investors who hold shares through tax-deferred arrangements, such as 401(k) plans or individual retirement plans. | |||||||||||||||||||||||||||||||||||||||||||||||||
| Performance [Table] |
|
|||||||||||||||||||||||||||||||||||||||||||||||||
| Index No Deduction for Fees, Expenses, or Taxes [Text] | Reflects no deduction for fees, expenses or taxes | |||||||||||||||||||||||||||||||||||||||||||||||||
| Performance Table Closing [Text Block] | Average annual total returns are shown on a before- and after-tax basis for the Fund. After-tax returns are calculated using the historical highest individual federal marginal income tax rates and do not reflect the impact of state and local taxes. Actual after-tax returns depend on an investor’s tax situation and may differ from those shown. After-tax returns shown are not relevant to investors who hold shares through tax-deferred arrangements, such as 401(k) plans or individual retirement plans. |
|||||||||||||||||||||||||||||||||||||||||||||||||
| Performance Availability Website Address [Text] | www.cambriafunds.com/tail | |||||||||||||||||||||||||||||||||||||||||||||||||
| Cambria Trinity ETF | ||||||||||||||||||||||||||||||||||||||||||||||||||
| Prospectus [Line Items] | ||||||||||||||||||||||||||||||||||||||||||||||||||
| Bar Chart and Performance Table [Heading] | Performance | |||||||||||||||||||||||||||||||||||||||||||||||||
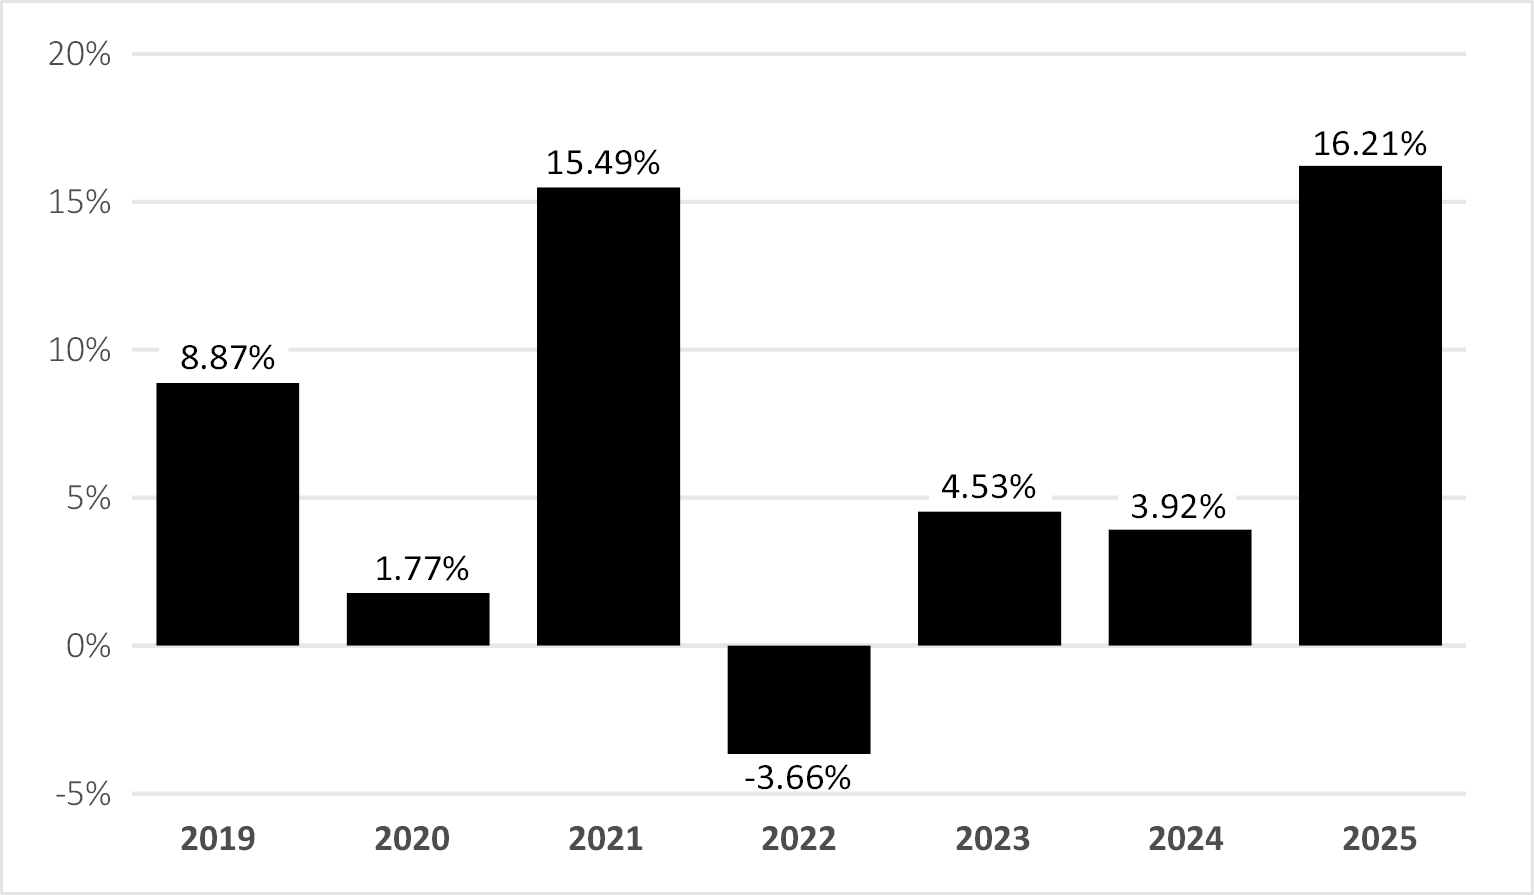
| Performance Narrative [Text Block] | The following bar chart and table indicate the risks of investing in the Fund by showing how the Fund’s average annual total returns compare with those of the Bloomberg Global Aggregate Index and the MSCI ACWI Index, each of which is a relevant broad-based securities market index. The Bloomberg Global Aggregate Index provides a measure of the performance of the overall global debt market, and the MSCI ACWI Index provides a measure of the performance of the overall global equity market. Performance is also shown for an additional index, the S&P Balanced Equity & Bond Moderate Index, which provides a measure for broad asset allocation strategies. All returns include the reinvestment of dividends and distributions. As always, please note that the Fund’s past performance (before and after taxes) does not necessarily indicate how the Fund will perform in the future. Updated performance information is available at www.cambriafunds.com/trty. The Fund’s investment objective and strategies changed effective January 1, 2019. Prior to that date, Fund performance reflects the investment objective of the Fund when it sought investment results that corresponded (before fees and expenses) generally to the price and yield performance of the Cambria Trinity Index. |
|||||||||||||||||||||||||||||||||||||||||||||||||
| Performance Past Does Not Indicate Future [Text] | As always, please note that the Fund’s past performance (before and after taxes) does not necessarily indicate how the Fund will perform in the future. | |||||||||||||||||||||||||||||||||||||||||||||||||
| Performance Information Illustrates Variability of Returns [Text] | The following bar chart and table indicate the risks of investing in the Fund by showing how the Fund’s average annual total returns compare with those of the Bloomberg Global Aggregate Index and the MSCI ACWI Index, each of which is a relevant broad-based securities market index. | |||||||||||||||||||||||||||||||||||||||||||||||||
| Performance Additional Market Index [Text] | Performance is also shown for an additional index, the S&P Balanced Equity & Bond Moderate Index, which provides a measure for broad asset allocation strategies. | |||||||||||||||||||||||||||||||||||||||||||||||||
| Bar Chart [Heading] | Total Annual Returns for Calendar Year Ended December 31 | |||||||||||||||||||||||||||||||||||||||||||||||||
| Bar Chart [Table] |
|
|||||||||||||||||||||||||||||||||||||||||||||||||
| Bar Chart Closing [Text Block] | As of June 30, 2026, the Fund’s year-to-date total return was 7.47%. Best and Worst Quarter Returns (for the period reflected in the bar chart above) Best: 10.17%, for the quarter ended December 31, 2020. Worst: -14.96%, for the quarter ended March 31, 2020. |
|||||||||||||||||||||||||||||||||||||||||||||||||
| Year to Date Return, Label [Optional Text] | year-to-date total return | |||||||||||||||||||||||||||||||||||||||||||||||||
| Bar Chart, Year to Date Return | 7.47% | |||||||||||||||||||||||||||||||||||||||||||||||||
| Bar Chart, Year to Date Return, Date | Jun. 30, 2026 | |||||||||||||||||||||||||||||||||||||||||||||||||
| Highest Quarterly Return, Label [Optional Text] | Best | |||||||||||||||||||||||||||||||||||||||||||||||||
| Highest Quarterly Return | 10.17% | |||||||||||||||||||||||||||||||||||||||||||||||||
| Highest Quarterly Return, Date | Dec. 31, 2020 | |||||||||||||||||||||||||||||||||||||||||||||||||
| Lowest Quarterly Return, Label [Optional Text] | Worst | |||||||||||||||||||||||||||||||||||||||||||||||||
| Lowest Quarterly Return | (14.96%) | |||||||||||||||||||||||||||||||||||||||||||||||||
| Lowest Quarterly Return, Date | Mar. 31, 2020 | |||||||||||||||||||||||||||||||||||||||||||||||||
| Performance Table Heading | Average Annual Total Returns for the period ending December 31, 2025 | |||||||||||||||||||||||||||||||||||||||||||||||||
| Performance Table Uses Highest Federal Rate | After-tax returns are calculated using the historical highest individual federal marginal income tax rates and do not reflect the impact of state and local taxes. | |||||||||||||||||||||||||||||||||||||||||||||||||
| Performance Table Not Relevant to Tax Deferred | After-tax returns shown are not relevant to investors who hold shares through tax-deferred arrangements, such as 401(k) plans or individual retirement plans. | |||||||||||||||||||||||||||||||||||||||||||||||||
| Performance [Table] |
* The Fund’s objective changed effective January 1, 2019. Prior to that date, the Fund was passively managed and sought to track the performance, before fees and expenses, of the Cambria Trinity Index. As of January 1, 2019, the Fund is actively managed and seeks income and capital appreciation. |
|||||||||||||||||||||||||||||||||||||||||||||||||
| Index No Deduction for Fees, Expenses, or Taxes [Text] | Reflects no deduction for fees, expenses or taxes | |||||||||||||||||||||||||||||||||||||||||||||||||
| Performance Table Closing [Text Block] | Average annual total returns are shown on a before- and after-tax basis for the Fund. After-tax returns are calculated using the historical highest individual federal marginal income tax rates and do not reflect the impact of state and local taxes. Actual after-tax returns depend on an investor’s tax situation and may differ from those shown. After-tax returns shown are not relevant to investors who hold shares through tax-deferred arrangements, such as 401(k) plans or individual retirement plans. |
|||||||||||||||||||||||||||||||||||||||||||||||||
| Performance Availability Website Address [Text] | www.cambriafunds.com/trty | |||||||||||||||||||||||||||||||||||||||||||||||||
| Cambria Global Real Estate ETF | ||||||||||||||||||||||||||||||||||||||||||||||||||
| Prospectus [Line Items] | ||||||||||||||||||||||||||||||||||||||||||||||||||
| Bar Chart and Performance Table [Heading] | Performance | |||||||||||||||||||||||||||||||||||||||||||||||||
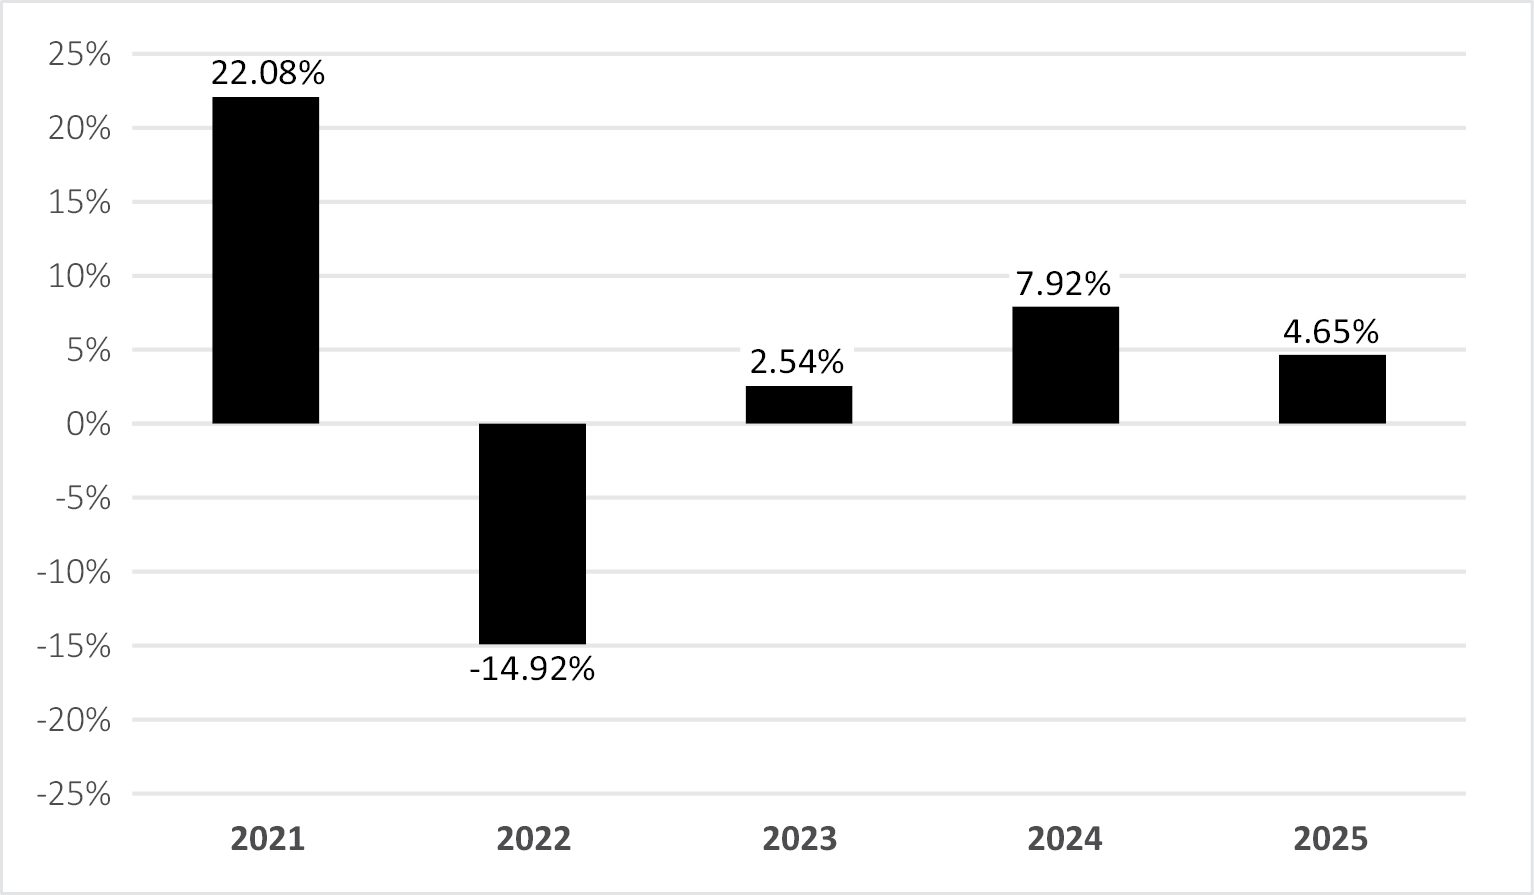
| Performance Narrative [Text Block] | The following bar chart and table indicate the risks of investing in the Fund by showing how the Fund’s average annual total returns compare with those of the MSCI ACWI Index, which is a relevant broad-based securities market index that provides a measure of the performance of the overall global equity market. Performance is also shown for an additional index, the FTSE EPRA Nareit Global REITs Index, which measures the total return of size- and liquidity-screened stocks of certain real estate companies that qualify for REIT status under the tax law in the country of domicile. All returns include the reinvestment of dividends and distributions. As always, please note that the Fund’s past performance (before and after taxes) does not necessarily indicate how the Fund will perform in the future. Updated performance information is available at www.cambriafunds.com/bldg. |
|||||||||||||||||||||||||||||||||||||||||||||||||
| Performance Past Does Not Indicate Future [Text] | As always, please note that the Fund’s past performance (before and after taxes) does not necessarily indicate how the Fund will perform in the future. | |||||||||||||||||||||||||||||||||||||||||||||||||
| Performance Information Illustrates Variability of Returns [Text] | The following bar chart and table indicate the risks of investing in the Fund by showing how the Fund’s average annual total returns compare with those of the MSCI ACWI Index, which is a relevant broad-based securities market index that provides a measure of the performance of the overall global equity market. | |||||||||||||||||||||||||||||||||||||||||||||||||
| Performance Additional Market Index [Text] | Performance is also shown for an additional index, the FTSE EPRA Nareit Global REITs Index, which measures the total return of size- and liquidity-screened stocks of certain real estate companies that qualify for REIT status under the tax law in the country of domicile. | |||||||||||||||||||||||||||||||||||||||||||||||||
| Bar Chart [Heading] | Total Annual Returns for Calendar Year Ended December 31 | |||||||||||||||||||||||||||||||||||||||||||||||||
| Bar Chart [Table] |
|
|||||||||||||||||||||||||||||||||||||||||||||||||
| Bar Chart Closing [Text Block] | As of June 30, 2026, the Fund’s year-to-date total return was 11.36%. Best and Worst Quarter Returns (for the period reflected in the bar chart above) Best: 15.69%, for the quarter ended September 30, 2024. Worst: -14.52%, for the quarter ended June 30, 2022. |
|||||||||||||||||||||||||||||||||||||||||||||||||
| Year to Date Return, Label [Optional Text] | year-to-date total return | |||||||||||||||||||||||||||||||||||||||||||||||||
| Bar Chart, Year to Date Return | 11.36% | |||||||||||||||||||||||||||||||||||||||||||||||||
| Bar Chart, Year to Date Return, Date | Jun. 30, 2026 | |||||||||||||||||||||||||||||||||||||||||||||||||
| Highest Quarterly Return, Label [Optional Text] | Best | |||||||||||||||||||||||||||||||||||||||||||||||||
| Highest Quarterly Return | 15.69% | |||||||||||||||||||||||||||||||||||||||||||||||||
| Highest Quarterly Return, Date | Sep. 30, 2024 | |||||||||||||||||||||||||||||||||||||||||||||||||
| Lowest Quarterly Return, Label [Optional Text] | Worst | |||||||||||||||||||||||||||||||||||||||||||||||||
| Lowest Quarterly Return | (14.52%) | |||||||||||||||||||||||||||||||||||||||||||||||||
| Lowest Quarterly Return, Date | Jun. 30, 2022 | |||||||||||||||||||||||||||||||||||||||||||||||||
| Performance Table Heading | Average Annual Total Returns for the period ending December 31, 2025 | |||||||||||||||||||||||||||||||||||||||||||||||||
| Performance Table Uses Highest Federal Rate | After-tax returns are calculated using the historical highest individual federal marginal income tax rates and do not reflect the impact of state and local taxes. | |||||||||||||||||||||||||||||||||||||||||||||||||
| Performance Table Not Relevant to Tax Deferred | After-tax returns shown are not relevant to investors who hold shares through tax-deferred arrangements, such as 401(k) plans or individual retirement plans. | |||||||||||||||||||||||||||||||||||||||||||||||||
| Performance [Table] |
|
|||||||||||||||||||||||||||||||||||||||||||||||||
| Index No Deduction for Fees, Expenses, or Taxes [Text] | Reflects no deduction for fees, expenses or taxes | |||||||||||||||||||||||||||||||||||||||||||||||||
| Performance Table Closing [Text Block] | Average annual total returns are shown on a before- and after-tax basis for the Fund. After-tax returns are calculated using the historical highest individual federal marginal income tax rates and do not reflect the impact of state and local taxes. Actual after-tax returns depend on an investor’s tax situation and may differ from those shown. After-tax returns shown are not relevant to investors who hold shares through tax-deferred arrangements, such as 401(k) plans or individual retirement plans. |
|||||||||||||||||||||||||||||||||||||||||||||||||
| Performance Availability Website Address [Text] | www.cambriafunds.com/bldg | |||||||||||||||||||||||||||||||||||||||||||||||||
| Cambria Micro and SmallCap Shareholder Yield ETF | ||||||||||||||||||||||||||||||||||||||||||||||||||
| Prospectus [Line Items] | ||||||||||||||||||||||||||||||||||||||||||||||||||
| Bar Chart and Performance Table [Heading] | Performance | |||||||||||||||||||||||||||||||||||||||||||||||||
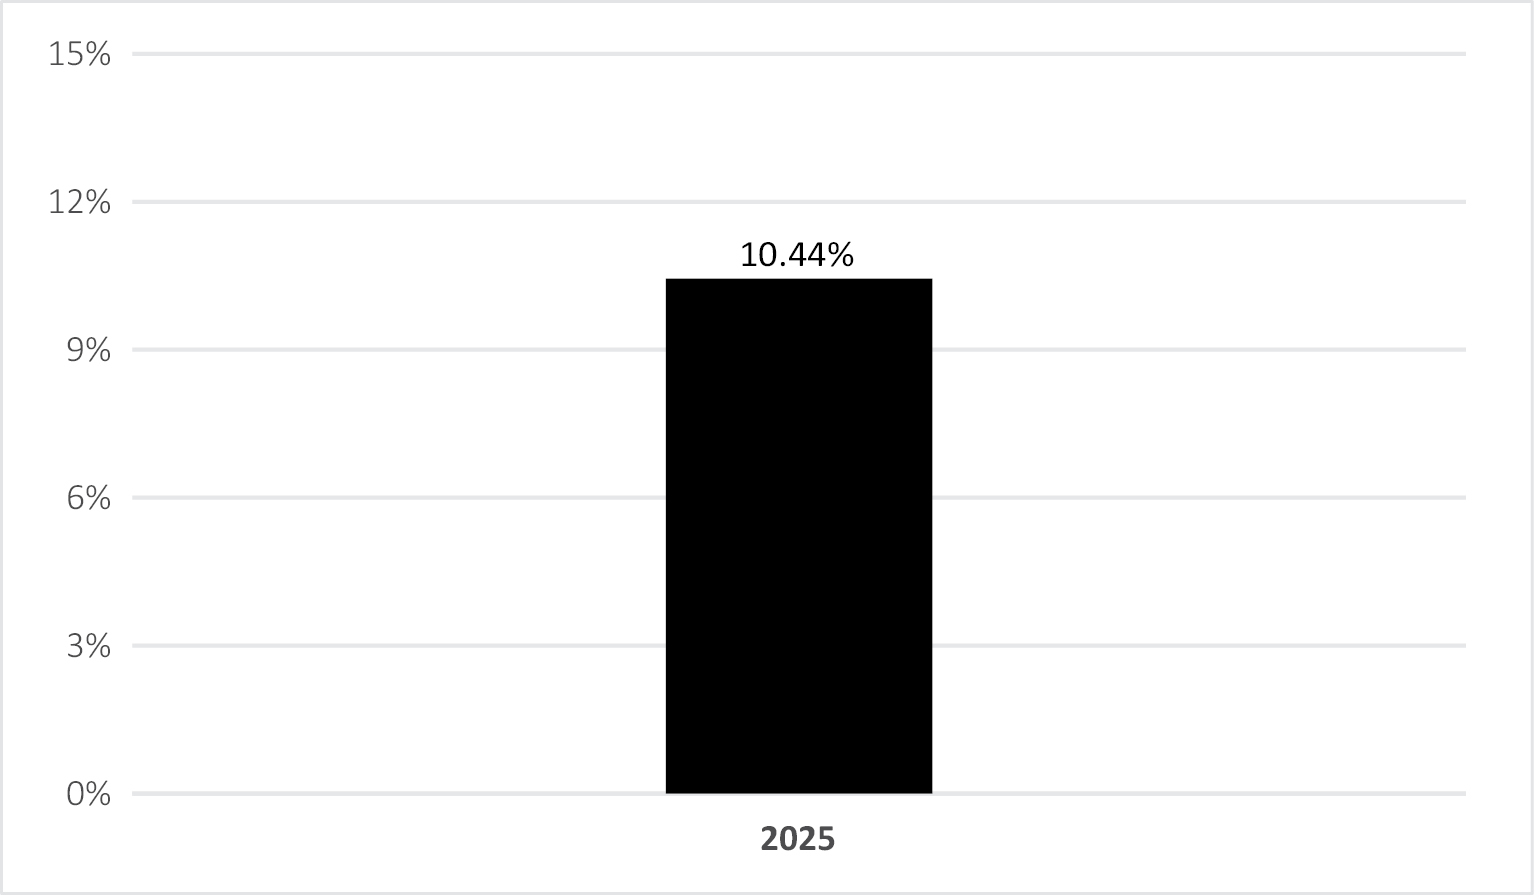
| Performance Narrative [Text Block] | The following bar chart and table indicate the risks of investing in the Fund by showing how the Fund’s average annual total returns compare with those of the S&P 500 Index, which is a relevant broad-based securities market index that provides a measure of the performance of the overall domestic equity market. Performance is also shown for an additional index, the S&P SmallCap 600 Index, which represents the U.S. small capitalization equity market. All returns include the reinvestment of dividends and distributions. As always, please note that the Fund’s past performance (before and after taxes) does not necessarily indicate how the Fund will perform in the future. Updated performance information is available at www.cambriafunds.com/myld. |
|||||||||||||||||||||||||||||||||||||||||||||||||
| Performance Past Does Not Indicate Future [Text] | As always, please note that the Fund’s past performance (before and after taxes) does not necessarily indicate how the Fund will perform in the future. | |||||||||||||||||||||||||||||||||||||||||||||||||
| Performance Information Illustrates Variability of Returns [Text] | The following bar chart and table indicate the risks of investing in the Fund by showing how the Fund’s average annual total returns compare with those of the S&P 500 Index, which is a relevant broad-based securities market index that provides a measure of the performance of the overall domestic equity market. | |||||||||||||||||||||||||||||||||||||||||||||||||
| Performance Additional Market Index [Text] | Performance is also shown for an additional index, the S&P SmallCap 600 Index, which represents the U.S. small capitalization equity market. | |||||||||||||||||||||||||||||||||||||||||||||||||
| Bar Chart [Heading] | Total Annual Returns for Calendar Year Ended December 31 | |||||||||||||||||||||||||||||||||||||||||||||||||
| Bar Chart [Table] |
|
|||||||||||||||||||||||||||||||||||||||||||||||||
| Bar Chart Closing [Text Block] | As of June 30, 2026, the Fund’s year-to-date total return was 20.64%. Best and Worst Quarter Returns (for the period reflected in the bar chart above) Best: 13.37%, for the quarter ended September 30, 2025. Worst: -8.80%, for the quarter ended March 31, 2025. |
|||||||||||||||||||||||||||||||||||||||||||||||||
| Year to Date Return, Label [Optional Text] | year-to-date total return | |||||||||||||||||||||||||||||||||||||||||||||||||
| Bar Chart, Year to Date Return | 20.64% | |||||||||||||||||||||||||||||||||||||||||||||||||
| Bar Chart, Year to Date Return, Date | Jun. 30, 2026 | |||||||||||||||||||||||||||||||||||||||||||||||||
| Highest Quarterly Return, Label [Optional Text] | Best | |||||||||||||||||||||||||||||||||||||||||||||||||
| Highest Quarterly Return | 13.37% | |||||||||||||||||||||||||||||||||||||||||||||||||
| Highest Quarterly Return, Date | Sep. 30, 2025 | |||||||||||||||||||||||||||||||||||||||||||||||||
| Lowest Quarterly Return, Label [Optional Text] | Worst | |||||||||||||||||||||||||||||||||||||||||||||||||
| Lowest Quarterly Return | (8.80%) | |||||||||||||||||||||||||||||||||||||||||||||||||
| Lowest Quarterly Return, Date | Mar. 31, 2025 | |||||||||||||||||||||||||||||||||||||||||||||||||
| Performance Table Heading | Average Annual Total Returns for the period ending December 31, 2025 | |||||||||||||||||||||||||||||||||||||||||||||||||
| Performance Table Uses Highest Federal Rate | After-tax returns are calculated using the historical highest individual federal marginal income tax rates and do not reflect the impact of state and local taxes. | |||||||||||||||||||||||||||||||||||||||||||||||||
| Performance Table Not Relevant to Tax Deferred | After-tax returns shown are not relevant to investors who hold shares through tax-deferred arrangements, such as 401(k) plans or individual retirement plans. | |||||||||||||||||||||||||||||||||||||||||||||||||
| Performance [Table] |
|
|||||||||||||||||||||||||||||||||||||||||||||||||
| Index No Deduction for Fees, Expenses, or Taxes [Text] | Reflects no deduction for fees, expenses or taxes | |||||||||||||||||||||||||||||||||||||||||||||||||
| Performance Table Closing [Text Block] | Average annual total returns are shown on a before- and after-tax basis for the Fund. After-tax returns are calculated using the historical highest individual federal marginal income tax rates and do not reflect the impact of state and local taxes. Actual after-tax returns depend on an investor’s tax situation and may differ from those shown. After-tax returns shown are not relevant to investors who hold shares through tax-deferred arrangements, such as 401(k) plans or individual retirement plans. |
|||||||||||||||||||||||||||||||||||||||||||||||||
| Performance Availability Website Address [Text] | www.cambriafunds.com/myld | |||||||||||||||||||||||||||||||||||||||||||||||||
| Cambria Tactical Yield ETF | ||||||||||||||||||||||||||||||||||||||||||||||||||
| Prospectus [Line Items] | ||||||||||||||||||||||||||||||||||||||||||||||||||
| Bar Chart and Performance Table [Heading] | Performance | |||||||||||||||||||||||||||||||||||||||||||||||||
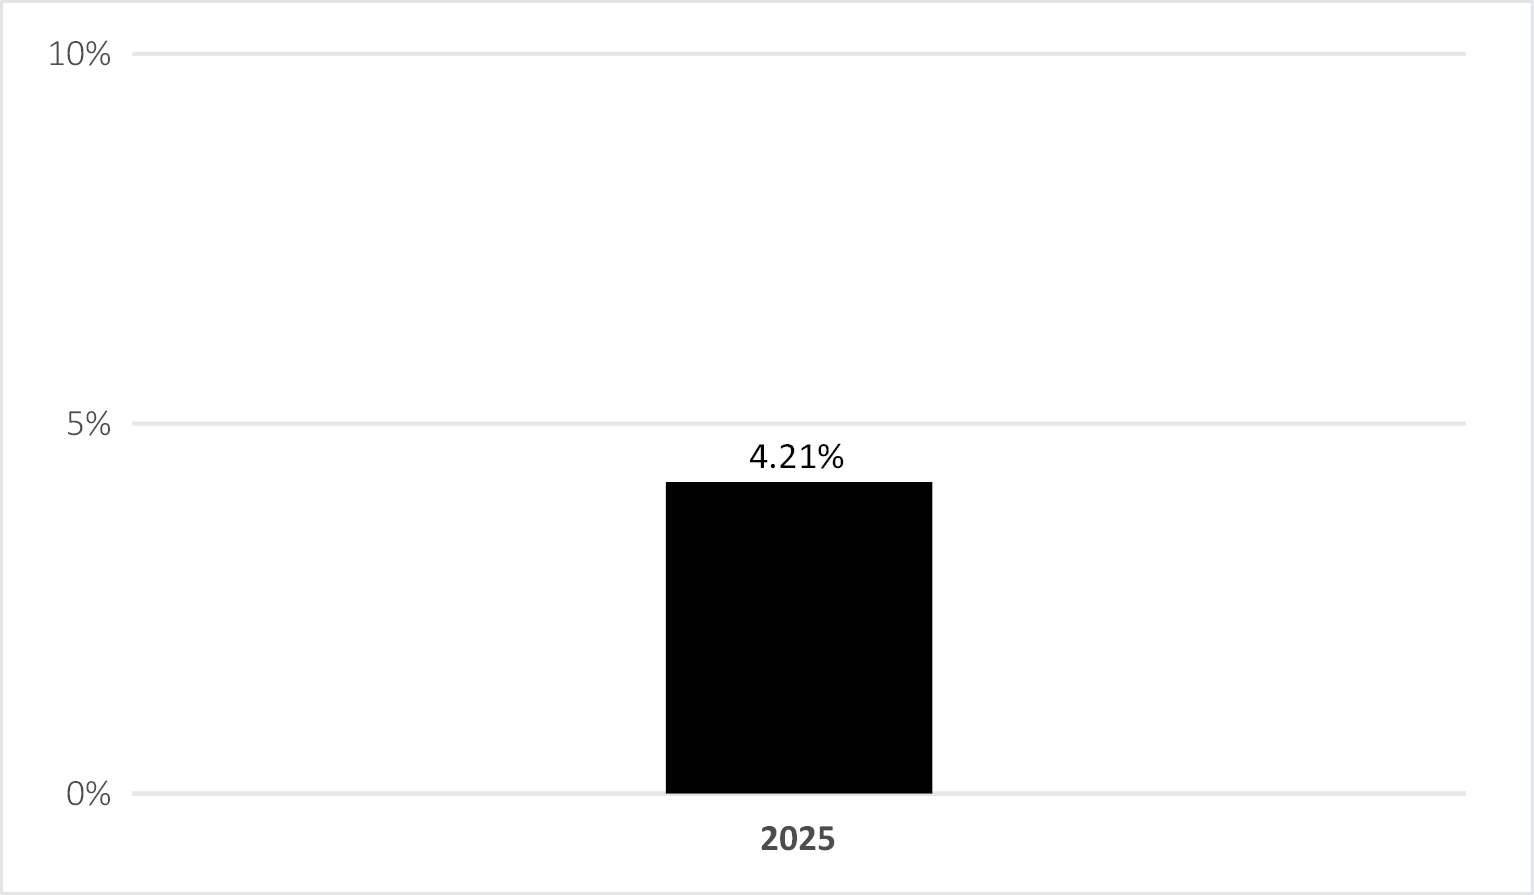
| Performance Narrative [Text Block] | The following bar chart and table indicate the risks of investing in the Fund by showing how the Fund’s average annual total returns compare with those of the Bloomberg Global Aggregate Index, a broad measure of the global investment grade fixed income market. Performance is also shown for an additional index, the ICE BofA US 3-Month Treasury Bill Total Return Index which represents U.S. dollar-denominated Treasury bills with approximately 90 days to final maturity. All returns include the reinvestment of dividends and distributions. As always, please note that the Fund’s past performance (before and after taxes) does not necessarily indicate how the Fund will perform in the future. Updated performance information is available at www.cambriafunds.com/tyld. |
|||||||||||||||||||||||||||||||||||||||||||||||||
| Performance Past Does Not Indicate Future [Text] | As always, please note that the Fund’s past performance (before and after taxes) does not necessarily indicate how the Fund will perform in the future. | |||||||||||||||||||||||||||||||||||||||||||||||||
| Performance Information Illustrates Variability of Returns [Text] | The following bar chart and table indicate the risks of investing in the Fund by showing how the Fund’s average annual total returns compare with those of the Bloomberg Global Aggregate Index, a broad measure of the global investment grade fixed income market. | |||||||||||||||||||||||||||||||||||||||||||||||||
| Performance Additional Market Index [Text] | Performance is also shown for an additional index, the ICE BofA US 3-Month Treasury Bill Total Return Index which represents U.S. dollar-denominated Treasury bills with approximately 90 days to final maturity. | |||||||||||||||||||||||||||||||||||||||||||||||||
| Bar Chart [Heading] | Total Annual Returns for Calendar Year Ended December 31 | |||||||||||||||||||||||||||||||||||||||||||||||||
| Bar Chart [Table] |
|
|||||||||||||||||||||||||||||||||||||||||||||||||
| Bar Chart Closing [Text Block] | As of June 30, 2026, the Fund’s year-to-date total return was 1.69%. Best and Worst Quarter Returns (for the period reflected in the bar chart above) Best: 1.10%, for the quarter ended September 30, 2025. Worst: 1.01%, for the quarter ended December 31, 2025. |
|||||||||||||||||||||||||||||||||||||||||||||||||
| Year to Date Return, Label [Optional Text] | year-to-date total return | |||||||||||||||||||||||||||||||||||||||||||||||||
| Bar Chart, Year to Date Return | 1.69% | |||||||||||||||||||||||||||||||||||||||||||||||||
| Bar Chart, Year to Date Return, Date | Jun. 30, 2026 | |||||||||||||||||||||||||||||||||||||||||||||||||
| Highest Quarterly Return, Label [Optional Text] | Best | |||||||||||||||||||||||||||||||||||||||||||||||||
| Highest Quarterly Return | 1.10% | |||||||||||||||||||||||||||||||||||||||||||||||||
| Highest Quarterly Return, Date | Sep. 30, 2025 | |||||||||||||||||||||||||||||||||||||||||||||||||
| Lowest Quarterly Return, Label [Optional Text] | Worst | |||||||||||||||||||||||||||||||||||||||||||||||||
| Lowest Quarterly Return | 1.01% | |||||||||||||||||||||||||||||||||||||||||||||||||
| Lowest Quarterly Return, Date | Dec. 31, 2025 | |||||||||||||||||||||||||||||||||||||||||||||||||
| Performance Table Heading | Average Annual Total Returns for the period ending December 31, 2025 | |||||||||||||||||||||||||||||||||||||||||||||||||
| Performance Table Uses Highest Federal Rate | After-tax returns are calculated using the historical highest individual federal marginal income tax rates and do not reflect the impact of state and local taxes. | |||||||||||||||||||||||||||||||||||||||||||||||||
| Performance Table Not Relevant to Tax Deferred | After-tax returns shown are not relevant to investors who hold shares through tax-deferred arrangements, such as 401(k) plans or individual retirement plans. | |||||||||||||||||||||||||||||||||||||||||||||||||
| Performance [Table] |
|
|||||||||||||||||||||||||||||||||||||||||||||||||
| Index No Deduction for Fees, Expenses, or Taxes [Text] | Reflects no deduction for fees, expenses or taxes | |||||||||||||||||||||||||||||||||||||||||||||||||
| Performance Table Closing [Text Block] | Average annual total returns are shown on a before- and after-tax basis for the Fund. After-tax returns are calculated using the historical highest individual federal marginal income tax rates and do not reflect the impact of state and local taxes. Actual after-tax returns depend on an investor’s tax situation and may differ from those shown. After-tax returns shown are not relevant to investors who hold shares through tax-deferred arrangements, such as 401(k) plans or individual retirement plans. |
|||||||||||||||||||||||||||||||||||||||||||||||||
| Performance Availability Website Address [Text] | www.cambriafunds.com/tyld | |||||||||||||||||||||||||||||||||||||||||||||||||
| Cambria LargeCap Shareholder Yield ETF | ||||||||||||||||||||||||||||||||||||||||||||||||||
| Prospectus [Line Items] | ||||||||||||||||||||||||||||||||||||||||||||||||||
| Bar Chart and Performance Table [Heading] | Performance | |||||||||||||||||||||||||||||||||||||||||||||||||
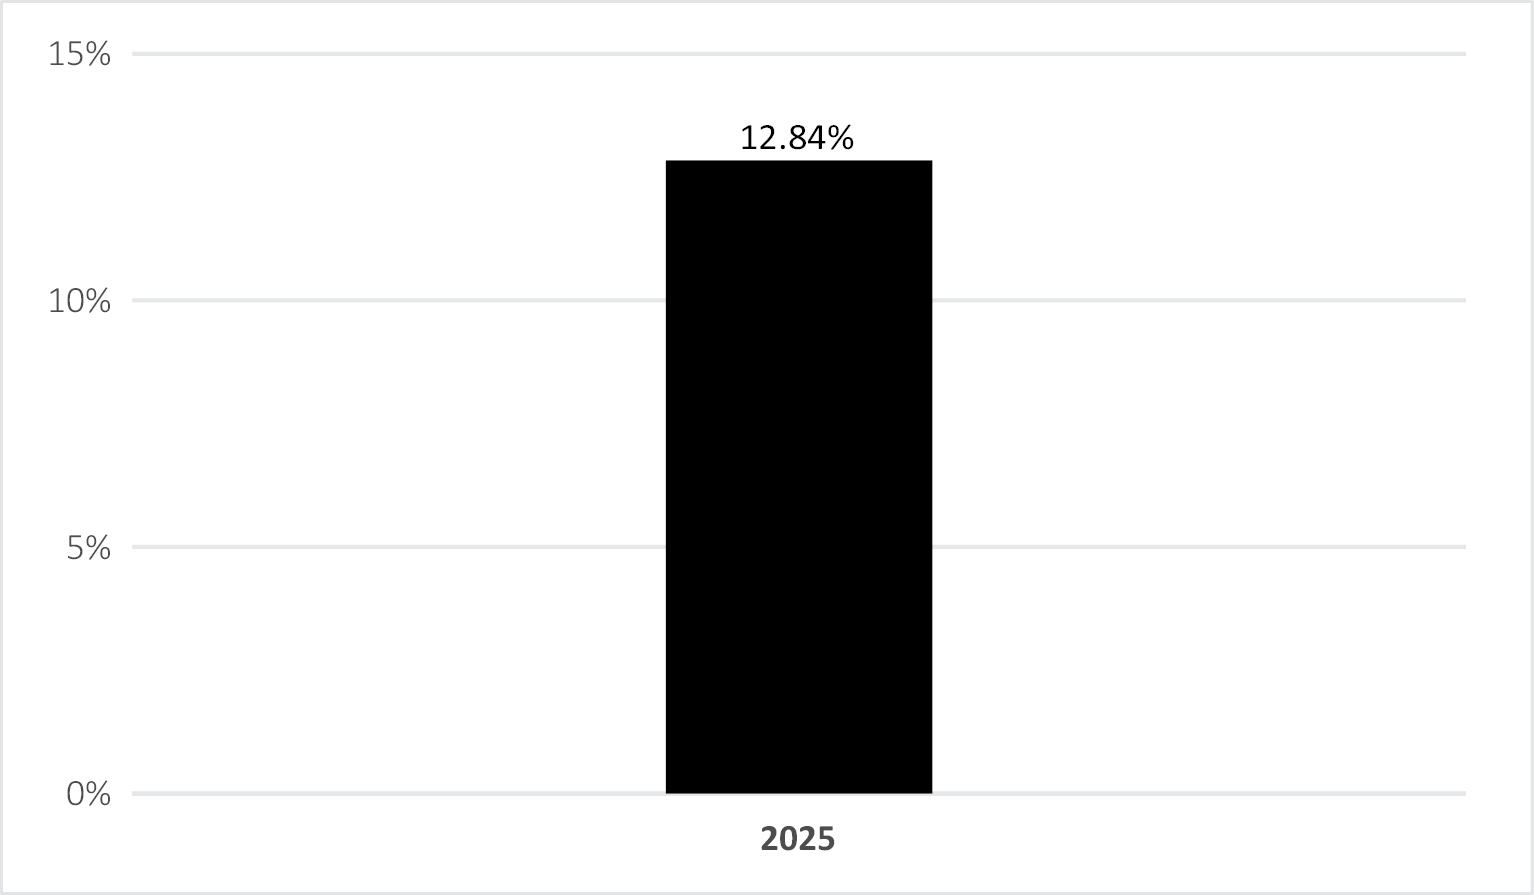
| Performance Narrative [Text Block] | The following bar chart and table indicate the risks of investing in the Fund by showing how the Fund’s average annual total returns compare with those of the S&P 500 Index, which is a relevant broad-based securities market index that provides a measure of the performance of the overall domestic equity market. All returns include the reinvestment of dividends and distributions. As always, please note that the Fund’s past performance (before and after taxes) does not necessarily indicate how the Fund will perform in the future. Updated performance information is available at www.cambriafunds.com/lyld. |
|||||||||||||||||||||||||||||||||||||||||||||||||
| Performance Past Does Not Indicate Future [Text] | As always, please note that the Fund’s past performance (before and after taxes) does not necessarily indicate how the Fund will perform in the future. | |||||||||||||||||||||||||||||||||||||||||||||||||
| Performance Information Illustrates Variability of Returns [Text] | The following bar chart and table indicate the risks of investing in the Fund by showing how the Fund’s average annual total returns compare with those of the S&P 500 Index, which is a relevant broad-based securities market index that provides a measure of the performance of the overall domestic equity market. | |||||||||||||||||||||||||||||||||||||||||||||||||
| Bar Chart [Heading] | Total Annual Returns for Calendar Year Ended December 31 | |||||||||||||||||||||||||||||||||||||||||||||||||
| Bar Chart [Table] |
|
|||||||||||||||||||||||||||||||||||||||||||||||||
| Bar Chart Closing [Text Block] | As of June 30, 2026, the Fund’s year-to-date total return was 8.48%. Best and Worst Quarter Returns (for the period reflected in the bar chart above) Best: 6.19%, for the quarter ended September 30, 2025. Worst: 1.40%, for the quarter ended December 31, 2025. |
|||||||||||||||||||||||||||||||||||||||||||||||||
| Year to Date Return, Label [Optional Text] | year-to-date total return | |||||||||||||||||||||||||||||||||||||||||||||||||
| Bar Chart, Year to Date Return | 8.48% | |||||||||||||||||||||||||||||||||||||||||||||||||
| Bar Chart, Year to Date Return, Date | Jun. 30, 2026 | |||||||||||||||||||||||||||||||||||||||||||||||||
| Highest Quarterly Return, Label [Optional Text] | Best | |||||||||||||||||||||||||||||||||||||||||||||||||
| Highest Quarterly Return | 6.19% | |||||||||||||||||||||||||||||||||||||||||||||||||
| Highest Quarterly Return, Date | Sep. 30, 2025 | |||||||||||||||||||||||||||||||||||||||||||||||||
| Lowest Quarterly Return, Label [Optional Text] | Worst | |||||||||||||||||||||||||||||||||||||||||||||||||
| Lowest Quarterly Return | 1.40% | |||||||||||||||||||||||||||||||||||||||||||||||||
| Lowest Quarterly Return, Date | Dec. 31, 2025 | |||||||||||||||||||||||||||||||||||||||||||||||||
| Performance Table Heading | Average Annual Total Returns for the period ending December 31, 2025 | |||||||||||||||||||||||||||||||||||||||||||||||||
| Performance Table Uses Highest Federal Rate | After-tax returns are calculated using the historical highest individual federal marginal income tax rates and do not reflect the impact of state and local taxes. | |||||||||||||||||||||||||||||||||||||||||||||||||
| Performance Table Not Relevant to Tax Deferred | After-tax returns shown are not relevant to investors who hold shares through tax-deferred arrangements, such as 401(k) plans or individual retirement plans. | |||||||||||||||||||||||||||||||||||||||||||||||||
| Performance [Table] |
|
|||||||||||||||||||||||||||||||||||||||||||||||||
| Index No Deduction for Fees, Expenses, or Taxes [Text] | Reflects no deduction for fees, expenses or taxes | |||||||||||||||||||||||||||||||||||||||||||||||||
| Performance Table Closing [Text Block] | Average annual total returns are shown on a before- and after-tax basis for the Fund. After-tax returns are calculated using the historical highest individual federal marginal income tax rates and do not reflect the impact of state and local taxes. Actual after-tax returns depend on an investor’s tax situation and may differ from those shown. After-tax returns shown are not relevant to investors who hold shares through tax-deferred arrangements, such as 401(k) plans or individual retirement plans. |
|||||||||||||||||||||||||||||||||||||||||||||||||
| Performance Availability Website Address [Text] | www.cambriafunds.com/lyld | |||||||||||||||||||||||||||||||||||||||||||||||||
| Cambria Fixed Income Trend ETF | ||||||||||||||||||||||||||||||||||||||||||||||||||
| Prospectus [Line Items] | ||||||||||||||||||||||||||||||||||||||||||||||||||
| Bar Chart and Performance Table [Heading] | Performance | |||||||||||||||||||||||||||||||||||||||||||||||||
| Performance Narrative [Text Block] | The Fund commenced operations on March 27, 2025, and therefore does not yet have performance history for a full calendar year. Performance information will be available in the Prospectus after the Fund has been in operation for one full calendar year. When provided, the information will provide some indication of the risks of investing in the Fund by showing how the Fund’s average annual total returns compare with a broad measure of market performance. As always, please note that the Fund’s past performance (before and after taxes) does not necessarily indicate how the Fund will perform in the future. Updated performance information will be available at www.cambriafunds.com/cfit. |
|||||||||||||||||||||||||||||||||||||||||||||||||
| Performance Past Does Not Indicate Future [Text] | As always, please note that the Fund’s past performance (before and after taxes) does not necessarily indicate how the Fund will perform in the future. | |||||||||||||||||||||||||||||||||||||||||||||||||
| Performance Information Illustrates Variability of Returns [Text] | Performance information will be available in the Prospectus after the Fund has been in operation for one full calendar year. When provided, the information will provide some indication of the risks of investing in the Fund by showing how the Fund’s average annual total returns compare with a broad measure of market performance. | |||||||||||||||||||||||||||||||||||||||||||||||||
| Performance One Year or Less [Text] | The Fund commenced operations on March 27, 2025, and therefore does not yet have performance history for a full calendar year. Performance information will be available in the Prospectus after the Fund has been in operation for one full calendar year. | |||||||||||||||||||||||||||||||||||||||||||||||||
| Performance Availability Website Address [Text] | www.cambriafunds.com/cfit |