Pay vs Performance Disclosure - USD ($)
Apr. 30, 2026
Apr. 30, 2025
Apr. 30, 2024
Apr. 30, 2023
Apr. 30, 2022
| Fiscal Year | Summary Compensation Table Total for PEO 1(1) | Compensation Actually Paid to PEO 1(2) | Summary Compensation Table Total for PEO 2(1) | Compensation Actually Paid to PEO 2(2) | Average Summary Compensation Table Total for Non-PEO NEOs (3) | Average Compensation Actually Paid to Non-PEO NEOs (4) | Value of Initial Fixed $100 Investment Based On: | Net Income (loss) (millions) (7) | Revenue (millions) (8) | |||||||||||||||||||||||
Total Shareholder Return (5) | Peer Group Total Shareholder Return (6) | |||||||||||||||||||||||||||||||
| (a) | (b) | (c) | (d) | (e) | (f) | (g) | (h) | (i) | (j) | (k) | ||||||||||||||||||||||
| 2026 | $ | 24,308,723 | $ | (13,700,439) | $ | 36,167,342 | $ | 20,075,265 | $ | 5,456,389 | $ | (2,621,987) | $ | 13.33 | $ | 256.94 | $ | (470.4) | $ | 250.3 | ||||||||||||
| 2025 | $ | 25,516,876 | $ | 39,480,848 | $ | — | $ | — | $ | 5,932,374 | $ | 6,545,806 | $ | 33.22 | $ | 172.25 | $ | (288.7) | $ | 389.1 | ||||||||||||
| 2024 | $ | 24,764,958 | $ | 82,190,636 | $ | — | $ | — | $ | 3,514,867 | $ | 6,928,664 | $ | 34.00 | $ | 151.38 | $ | (279.7) | $ | 310.6 | ||||||||||||
| 2023 | $ | 31,712,200 | $ | 49,955,502 | $ | — | $ | — | $ | 16,224,783 | $ | 14,368,424 | $ | 26.89 | $ | 110.13 | $ | (268.8) | $ | 266.8 | ||||||||||||
| 2022 | $ | 26,865,979 | $ | (488,891,227) | $ | — | $ | — | $ | 17,608,679 | $ | (8,285,912) | $ | 25.64 | $ | 101.89 | $ | (192.1) | $ | 252.8 | ||||||||||||
PEO 1:
| Fiscal Year | Reported Summary Compensation Table Total for PEO 1 | Reported Value of Equity Awards(a) | Equity Award Adjustments(b) | Compensation Actually Paid to PEO 1 | ||||||||||
| 2026 | $ | 24,308,723 | $ | (23,000,004) | $ | (15,009,158) | $ | (13,700,439) | ||||||
PEO 2:
| Fiscal Year | Reported Summary Compensation Table Total for PEO 2 | Reported Value of Equity Awards(a) | Equity Award Adjustments(b) | Compensation Actually Paid to PEO 2 | ||||||||||
| 2026 | $ | 36,167,342 | $ | (35,000,013) | $ | 18,907,936 | $ | 20,075,265 | ||||||
PEO 1:
| Fiscal Year | Year End Fair Value of Equity Awards Granted in the Fiscal Year and Outstanding and Unvested at Fiscal Year End | Change in Fair Value from the end of the prior Fiscal Year to the end of the Fiscal Year of Outstanding and Unvested Equity Awards Granted in Prior Years | Fair Value as of Vesting Date of Equity Awards Granted and Vested in the Fiscal Year | Change in Fair Value from the End of the Prior Fiscal Year to the Vesting Date of Equity Awards Granted in Prior Fiscal Years that Vested in the Fiscal Year | Fair Value at the End of the Prior Fiscal Year of Equity Awards that Failed to Meet Vesting Conditions in the Fiscal Year | Total Equity Award Adjustments | ||||||||||||||
| 2026 | $ | 11,748,613 | $ | (22,086,235) | $ | 900,004 | $ | (5,571,540) | $ | — | $ | (15,009,158) | ||||||||
PEO 2:
| Fiscal Year | Year End Fair Value of Equity Awards Granted in the Fiscal Year and Outstanding and Unvested at Fiscal Year End | Change in Fair Value from the end of the prior Fiscal Year to the end of the Fiscal Year of Outstanding and Unvested Equity Awards Granted in Prior Years | Fair Value as of Vesting Date of Equity Awards Granted and Vested in the Fiscal Year | Change in Fair Value from the End of the Prior Fiscal Year to the Vesting Date of Equity Awards Granted in Prior Fiscal Years that Vested in the Fiscal Year | Fair Value at the End of the Prior Year of Equity Awards that Failed to Meet Vesting Conditions in the Year | Total Equity Award Adjustments | ||||||||||||||
| 2026 | $ | 11,450,196 | $ | — | $ | 7,457,740 | $ | — | $ | — | $ | 18,907,936 | ||||||||
| Fiscal Year | Average Reported Summary Compensation Table Total for Non-PEO NEOs | Average Reported Value of Equity Awards | Average Equity Award Adjustments(a) | Average Compensation Actually Paid to Non-PEO NEOs | ||||||||||
| 2026 | $ | 5,456,389 | $ | (4,524,010) | $ | (3,554,366) | $ | (2,621,987) | ||||||
| Fiscal Year | Average Fiscal Year End Fair Value of Equity Awards Granted in the Fiscal Year and Outstanding and Unvested at Fiscal Year End | Average Change in Fair Value from the end of the prior Fiscal Year to the end of the Fiscal Year of Outstanding and Unvested Equity Awards Granted in Prior Years | Average Fair Value as of Vesting Date of Equity Awards Granted and Vested in the Fiscal Year | Average Change in Fair Value from the End of the Prior Fiscal Year to the Vesting Date of Equity Awards Granted in Prior Fiscal Years that Vested in the Fiscal Year | Average Fair Value at the End of the Prior Fiscal Year of Equity Awards that Failed to Meet Vesting Conditions in the Fiscal Year | Total Average Equity Award Adjustments | ||||||||||||||
| 2026 | $ | 2,002,303 | $ | (5,022,700) | $ | 437,272 | $ | (971,241) | $ | — | $ | (3,554,366) | ||||||||
Compensation Actually Paid and Cumulative TSR
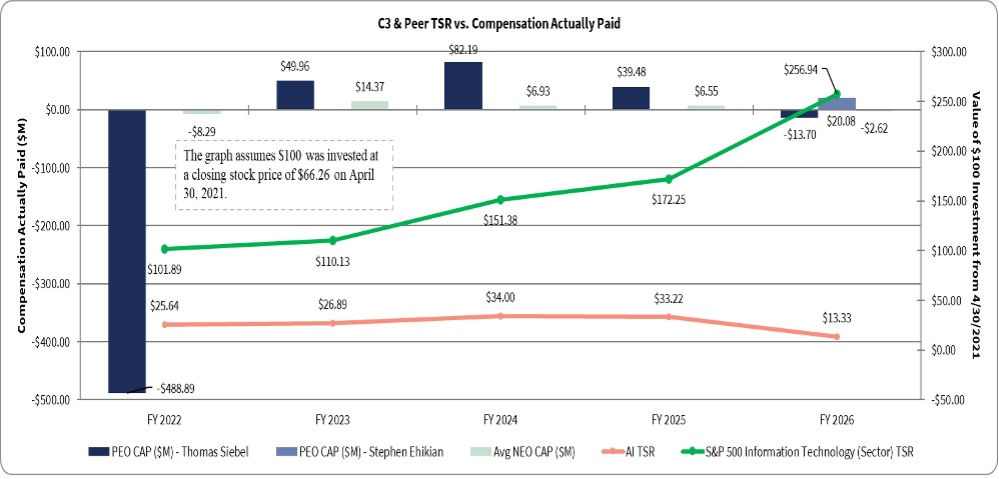
The chart below shows the relationship between the compensation actually paid to Mr. Siebel and Mr. Ehikian and the average compensation actually paid to our other NEOs, on the one hand, to our cumulative TSR and the cumulative TSR of our Peer Group measured over the period commencing on April 30, 2021 and ending on April 30, 2026 (which is the last day of our last completed fiscal year), on the other.
Compensation Actually Paid and Net Income (Loss)
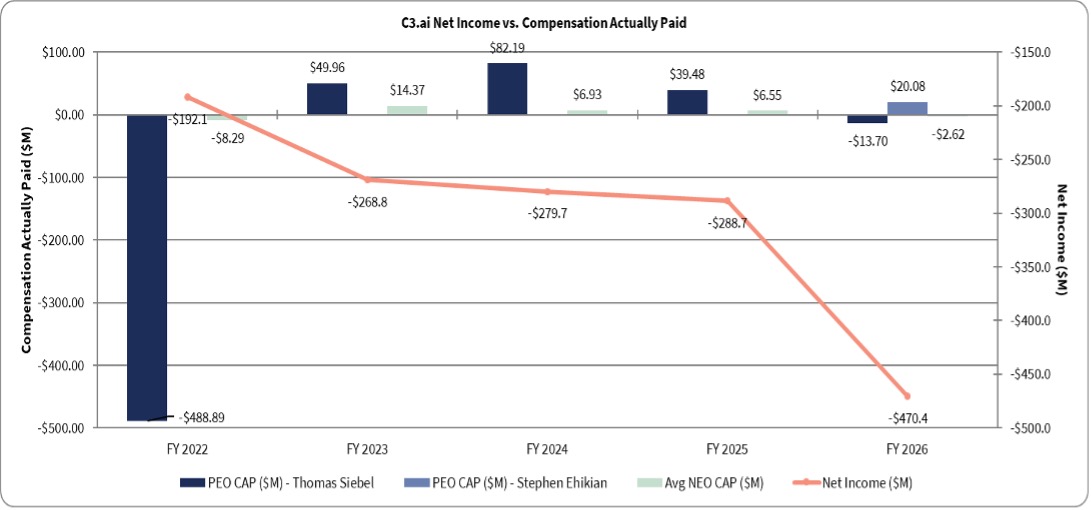
The following graph shows the relationship between the compensation actually paid to Mr. Siebel and Mr. Ehikian and the average compensation actually paid to our other NEOs, on the one hand, to our annual net income (loss) for each of the periods presented in the Pay Versus Performance table.
Compensation Actually Paid and Revenue
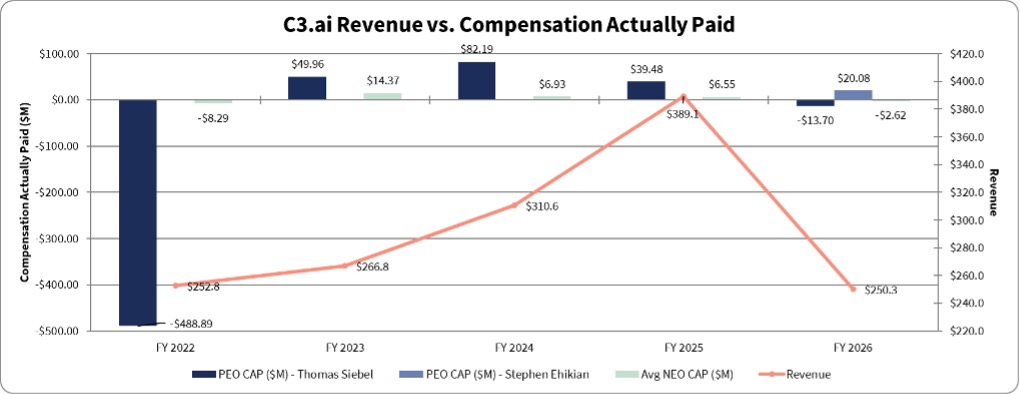
The following graph shows the relationship between the compensation actually paid to Mr. Siebel and Mr. Ehikian and the average compensation actually paid to our other NEOs, on the one hand, to our annual revenue for each of the periods presented in the Pay Versus Performance table.
Cumulative TSR of the Company and Cumulative TSR of the Peer Group
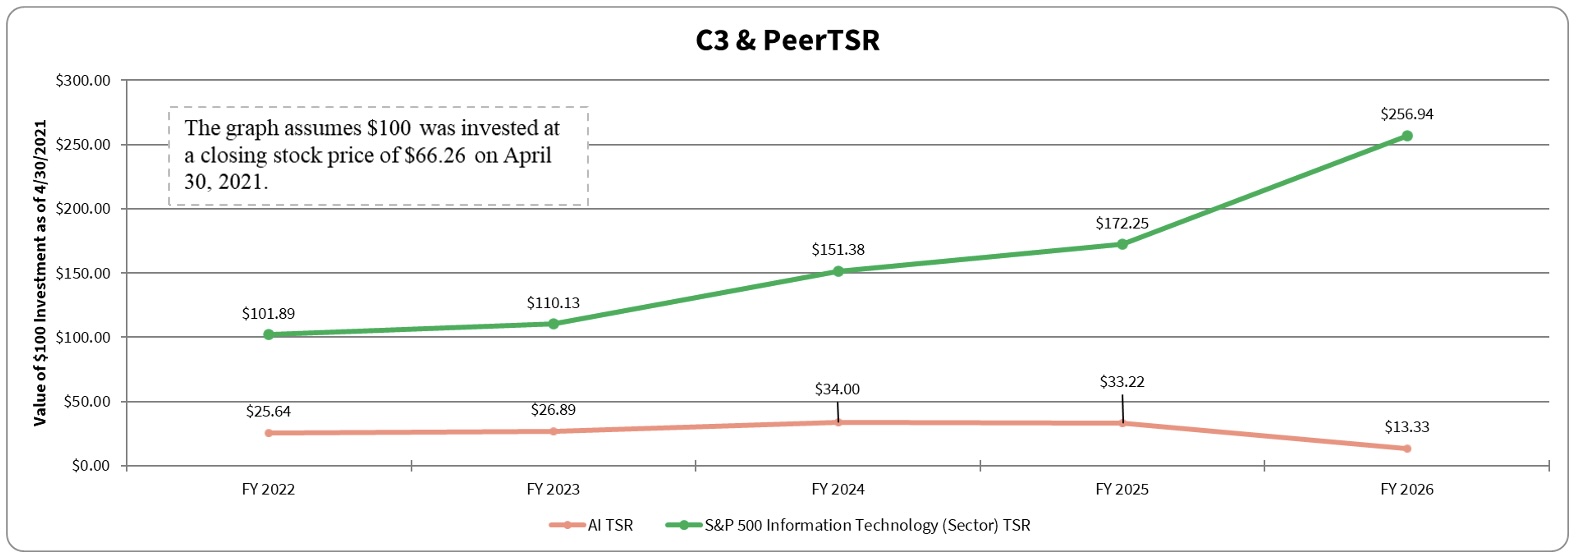
The chart below shows the relationship between our cumulative TSR for the period commencing on April 30, 2021 and ending on April 30, 2026 (which is the last day of our last completed fiscal year) to the cumulative TSR of the companies comprising the S&P 500 Information Technology Index for the same period.
•Revenue
•Stock Price
As required by Item 402(v) of Regulation S-K, we are providing the following information about the relationship between executive compensation that the SEC deems to have been actually paid to our principal executive officer (“PEO”) and other named executive officers (“NEOs”) and certain indicators of our financial performance. Please note that Item 402(v) requires the amounts included in the “compensation actually paid” columns of the table below to be calculated according to a particular formula that treats the increase or decrease in the value of outstanding equity awards as amounts “actually paid” to the NEO, regardless of whether the NEO realized any gain from such fluctuation in equity value. For further information concerning the Company’s pay-for-performance philosophy and how the Company aligns executive compensation with the Company’s performance, refer to “Executive Compensation – Compensation Discussion and Analysis.”
The grant date fair value of equity awards represents the total of the amounts reported in the “Stock Awards” and “Option Awards” columns in the Summary Compensation Table for the applicable year.The dollar amounts reported in column (f) represent the average of the amounts reported for the Company’s NEOs as a group (excluding Mr. Siebel, who has served as our Chief Executive Officer since 2011 and Mr. Ehikian) in the “Total” column of the Summary Compensation Table in each applicable year. The names of each of the NEOs (excluding Mr. Siebel and Mr. Ehikian) included for purposes of calculating the average amounts in each applicable year are as follows: (i) for 2026, Hitesh Lath; (ii) for 2025, Edward Abbo, Hitesh Lath and Merel Witteveen; (iii) for 2024, Edward Abbo, Juho Parkkinen, Houman Behzadi, Hitesh Lath and Guy Wanger; (iv) for 2023, Edward Abbo, Juho Parkkinen, Houman Behzadi and Richard Lutton; and (v) for 2022, David Barter, Edward Abbo, Juho Parkkinen, Houman Behzadi, Richard Lutton and Adeel Manzoor .Represents the total stockholder return (“TSR”) of a $100 investment in our stock as of April 30, 2021, valued again on each of April 30, 2022, 2023, 2024, 2025 and 2026. Cumulative TSR is calculated by dividing the sum of the cumulative amount of dividends for the measurement period, assuming dividend reinvestment, and the difference between the Company’s share price at the end and the beginning of the measurement period by the Company’s share price at the beginning of the measurement period.The dollar amounts reported represent the amount of net income (loss) reflected in the Company’s audited financial statements for the applicable year.Reflects “revenue” for each fiscal year as set forth in our Consolidated Statements of Operations included in our Annual Report on Form 10-K for each of the fiscal years.Financial Performance Measures
As described in greater detail in “Executive Compensation – Compensation Discussion and Analysis,” the Company’s executive compensation program reflects a pay-for-performance philosophy. The metrics that the Company uses for both our long-term and short-term incentive awards are selected based on an objective of incentivizing our NEOs to increase the value of our enterprise for our shareholders. The most important financial performance measures used by the Company to link executive compensation actually paid to the Company’s NEOs, for the most recently completed fiscal year, to the Company’s performance are as follows:
Analysis of the Information Presented in the Pay versus Performance Table
As described in more detail in the section “Executive Compensation – Compensation Discussion and Analysis,” the Company’s executive compensation program reflects a pay-for-performance philosophy. While the Company utilizes several performance measures to align executive compensation with Company performance, not all of those Company performance measures are presented in the Pay versus Performance table. Moreover, the Company generally seeks to incentivize long-term performance, and therefore does not specifically align the Company’s performance measures with compensation that is actually paid (as computed in accordance with Item 402(v) of Regulation S-K) for a particular year. In accordance with Item 402(v) of Regulation S-K, the Company is providing the following descriptions of the relationships between information presented in the Pay versus Performance table.
All of the information provided above under the “Pay Versus Performance” heading will not be deemed to be incorporated by reference into any filing of the Company under the Securities Act of 1933, as amended, or the Securities Exchange Act of 1934, as amended, whether made before or after the date hereof and irrespective of any general incorporation language in any such filing, except to the extent the Company specifically incorporates such information by reference.