The bar chart and performance table below show the variability of the Fund’s returns, which is some indication of the risks of investing in the Fund. The bar chart shows performance of the Fund’s Class I shares for each calendar year since the Fund’s inception. Returns for Investor Class shares and Class A shares, which are not presented in the bar chart, will vary from the returns of Class I shares. Investor Class shares and Class A shares are invested in the same portfolio of securities as the Class I shares and the annual returns differ only to the extent that the Classes do not have the same expenses. Sales loads or account fees are not reflected in the bar chart. If these amounts were reflected, returns would be less than those shown. The performance table compares the performance of the Fund’s shares over time to the performance of a broad-based securities market index. After-tax returns for Investor Class shares and Class A shares, which are not presented in the performance table, will vary from the returns of Class I shares. You should be aware that the Fund’s past performance (before and after taxes) may not be an indication of how the Fund will perform in the future. Updated performance information will be available at no cost by visiting www.holbrookholdings.com or by calling 1-877-345-8646.
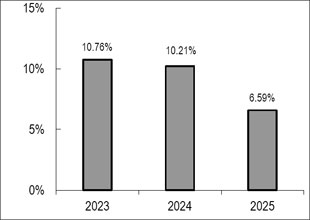
| Best Quarter | 9/30/2023 | 3.41% |
| Worst Quarter | 06/30/2025 | 1.20% |
The year-to-date return as of the most recent calendar quarter, which ended June 30, 2026, was 2.81%.
| Class I Shares | One
Year |
Since Inception(1) |
| Return before taxes | 6.59% | 8.66% |
| Return after taxes on Distributions | 3.68% | 4.79% |
| Return after taxes on Distributions and Sale of Fund Shares | 3.85% | 4.92% |
| Investor Class Shares | ||
| Return before taxes | 6.06% | 8.13% |
| Class A Shares | ||
| Return before taxes | 3.88% | 7.69% |
| Bloomberg
U.S. Aggregate Bond Index(2) (reflects no deduction for fees, expenses or taxes) |
7.30% | 2.85% |
| (1) | Inception date is May 2, 2022. |
| (2) | The Bloomberg US Aggregate Bond Index: The index is a broad-based flagship benchmark that measures the investment grade, US dollar-denominated, fixed-rate taxable bond market. The index includes Treasuries, government-related and corporate securities, MBS (agency fixed-rate pass-throughs), ABS and CMBS (agency and non-agency). Investors cannot invest directly in an index or benchmark. |
After-tax returns for Class I shares are calculated using the historical highest individual federal marginal income tax rates and do not reflect the impact of state and local taxes. Actual after-tax returns depend on an investor’s tax situation and may differ from those shown above, and after-tax returns shown are not relevant to investors who hold their Fund shares through tax-deferred arrangements, such as 401(k) plans or individual retirement accounts.
The bar chart and performance table below show the variability of the Fund’s returns, which is some indication of the risks of investing in the Fund. The bar chart shows performance of the Fund’s Class I shares for each calendar year since the Fund’s inception. Returns for Investor Class shares and Class A shares, which are not presented in the bar chart, will vary from the returns of Class I shares. Investor Class shares and Class A shares are invested in the same portfolio of securities as the Class I shares and the annual returns differ only to the extent that the Classes do not have the same expenses. Sales loads or account fees are not reflected in the bar chart. If these amounts were reflected, returns would be less than those shown. The performance table compares the performance of the Fund’s shares over time to the performance of a broad-based market index, as well as against a performance index which the Adviser believes better represents the Fund’s investment strategy. After-tax returns for Investor Class shares and Class A shares, which are not presented in the performance table, will vary from the returns of Class I shares. You should be aware that the Fund’s past performance (before and after taxes) may not be an indication of how the Fund will perform in the future. Updated performance information will be available at no cost by visiting www.holbrookholdings.com or by calling 1-877-345-8646.
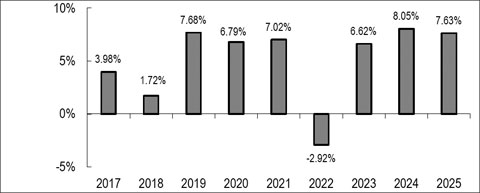
| Best Quarter | Second Quarter 2020 | 13.41% |
| Worst Quarter | First Quarter 2020 | -16.01% |
The year-to-date return as of the most recent calendar quarter, which ended June 30, 2026, was 2.74%.
| Class I Shares | One
Year |
Five Years |
Since Inception(1) |
| Return before taxes | 7.63% | 5.19% | 5.09% |
| Return after taxes on Distributions | 4.85% | 2.58% | 2.99% |
| Return after taxes on Distributions and Sale of Fund Shares | 4.47% | 2.83% | 3.05% |
| Investor Class Shares | |||
| Return before taxes | 7.19% | 4.69% | 4.58% |
| Class A Shares | |||
| Return before taxes | 6.04% | N/A | 3.83% |
| Bloomberg
U.S. Aggregate Bond Index(2) (reflects no deduction for fees, expenses or taxes) |
7.30% | -0.36% | 1.50%(4) |
| Bank
of America/Merrill Lynch 1-3 Year U.S. Corporate & Government Bond Index(3) (reflects no deduction for fees, expenses or taxes) |
5.34% | 2.00% | 2.05%(5) |
| (1) | Inception date is July 6, 2016, for Class I and Investor Class shares. Inception date is July 23, 2021, for Class A shares. |
| (2) | The Bloomberg US Aggregate Bond Index is a broad-based flagship benchmark that measures the investment grade, US dollar-denominated, fixed-rate taxable bond market. The index includes Treasuries, government-related and corporate securities, MBS (agency fixed-rate pass-throughs), ABS and CMBS (agency and non-agency). Investors cannot invest directly in an index or benchmark. Index returns are gross of any fees, brokerage commissions or other expenses of investing |
| (3) | The Bank of America /Merrill Lynch 1-3 Year U.S. Corporate & Government Bond Index is a subset of the Bank of America Merrill Lynch U.S. Government/Corporate Index and tracks the performance of investment-grade debt securities with a remaining term to final maturity of less than 3 years. Investors cannot invest directly in an index or benchmark. Index returns are gross of any fees, brokerage commissions or other expenses of investing. |
| (4) | Performance since July 23, 2021, (the inception date of the Class A shares) is -0.24%. |
| (5) | Performance since July 23, 2021, (the inception date of the Class A shares) is 2.22%. |
After-tax returns for Class I shares are calculated using the historical highest individual federal marginal income tax rates and do not reflect the impact of state and local taxes. Actual after-tax returns depend on an investor’s tax situation and may differ from those shown above, and after-tax returns shown are not relevant to investors who hold their Fund shares through tax-deferred arrangements, such as 401(k) plans or individual retirement accounts.
Because the Fund has less than a full calendar year of investment operations, no performance information is presented for the Fund at this time. In the future, performance information will be presented in this section of this Prospectus. In addition, shareholder reports containing financial and performance information will be available to shareholders semi-annually. Updated performance information will be available at no cost by visiting www.holbrookfunds.com or by calling 1-877-345-8646.