Shareholder Report
Jun. 30, 2026
USD ($)
Holding
What were the Fund costs for the last year?
(Based on a hypothetical $10,000 investment)
The table below explains the costs that you would have paid within the reporting period.
Fund |
Costs of a $10,000 investment |
Costs paid as a percentage of a $10,000 investment |
||||||
Alabama Tax-Free Income Series |
$ | 70 | 0.70% | |||||
How did the Fund perform last year?
Longer-dated municipal bonds generally outperformed shorter-dated municipal bonds during the
12-month
period ended June 30, 2026 (the “Review Period”). The Federal Reserve cut the fed funds rate three times during the Review Period, causing yields to decline and bond prices to rise. The Fund provided a total return of 8.51% during the Review Period, which was higher than the total return of 7.03% provided by the Bloomberg Municipal Bond Index (the “Muni Index”). The Fund’s outperformance was primarily due to the fact that it had a longer, average nominal maturity of 15.73 years versus 13.39 years for the Muni Index, which gave the Fund greater sensitivity to interest rate changes and allowed it to benefit more from the decline in yields during the Review Period.
During the Review Period, the Fund’s use of its current investment strategy did not cause the Fund’s performance to deviate materially from the manager’s expectations.
How has the Fund historically performed?
The following graph compares the initial and subsequent account values at the end of each of the most recently completed 10 fiscal
ye
ars of the Fund. It assumes a $10,000 initial investment at the beginning of the first fiscal year in an appropriate broad-based securities market index for the same period. 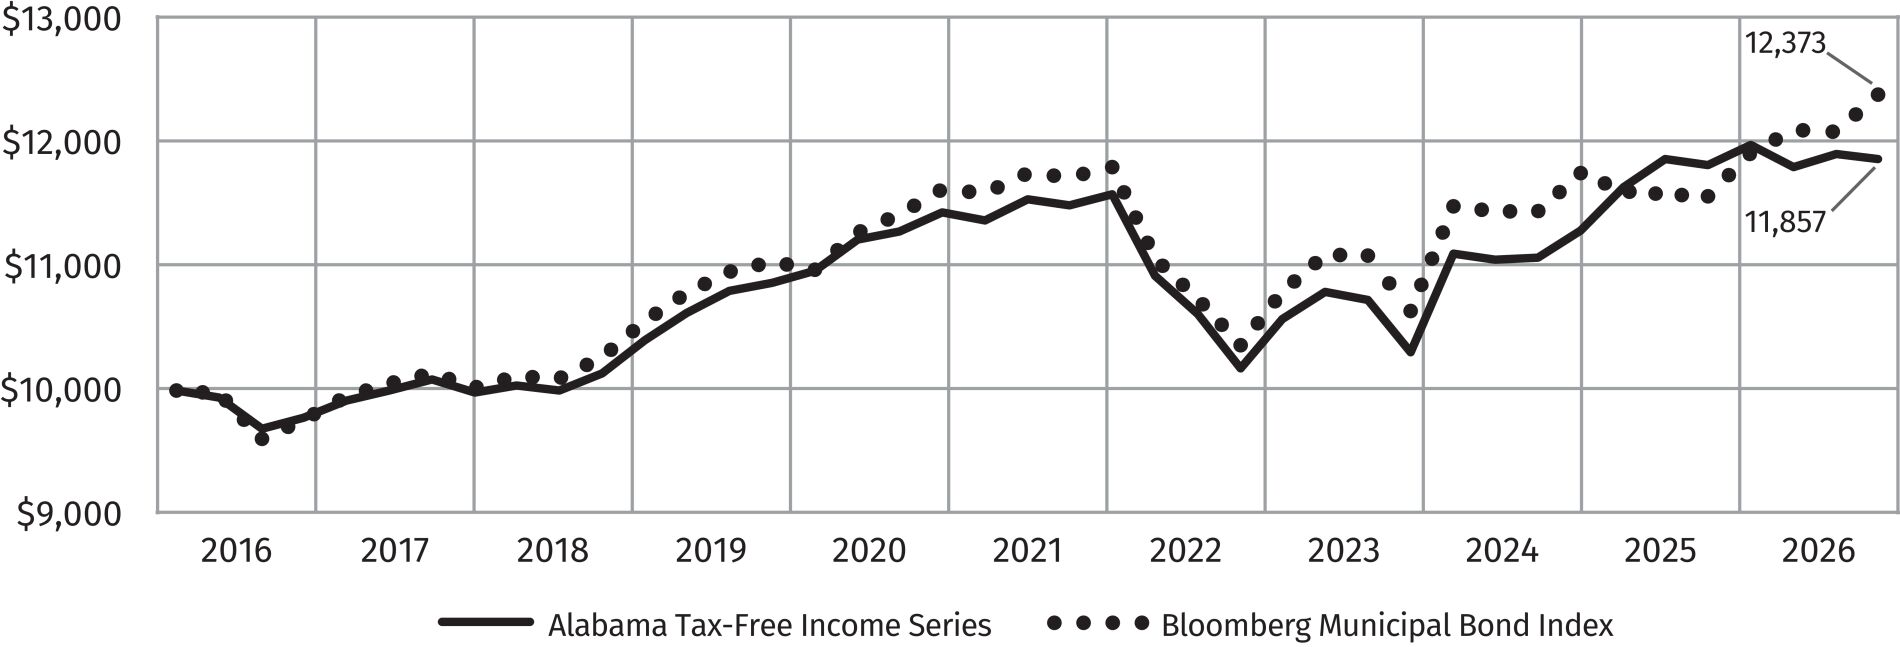
Average annual total return values (as of June 30, 2026):
1 Year |
5 Years |
10 Years |
||||||||||
Alabama Tax-Free Income Series |
8.51 | % | 0.57 | % | 1.73 | % | ||||||
Bloomberg Municipal Bond Index |
7.03 | % | 1.05 | % | 2.14 | % | ||||||
What are the Key Fund statistics you should know?
The following table outlines key Fund statistics that you should pay attention to:
Fund’s net assets |
$ | 18,326,323 | ||
Total number of portfolio holdings |
61 | |||
Total advisory fees paid |
$ | 58,564 | ||
Portfolio turnover rate as of the end of year |
5.24% | |||
What is the Fund invested in?
The tables and charts below show the inves
tm
ent makeup of the Fund, repre
senting the percentage of total investments and/or total net assets of the Fund. Composition
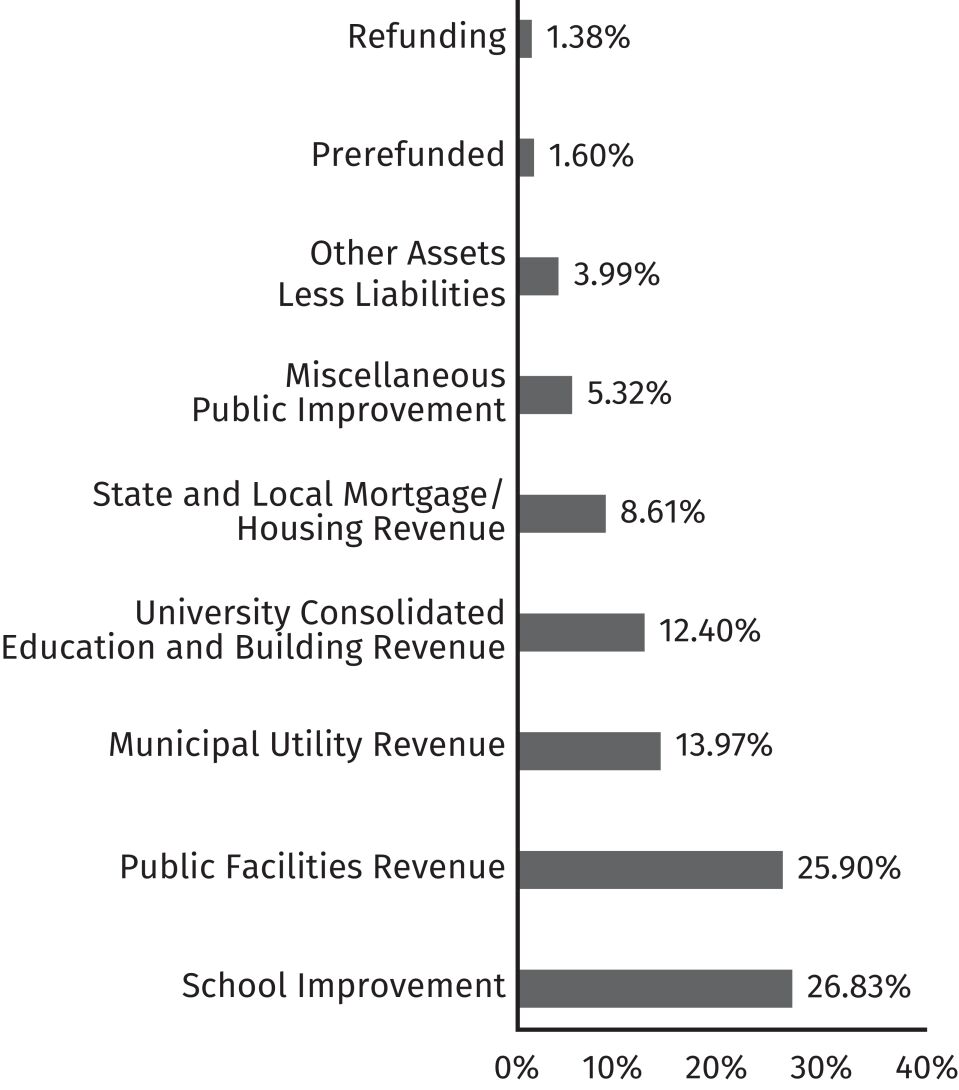
Credit Quality*
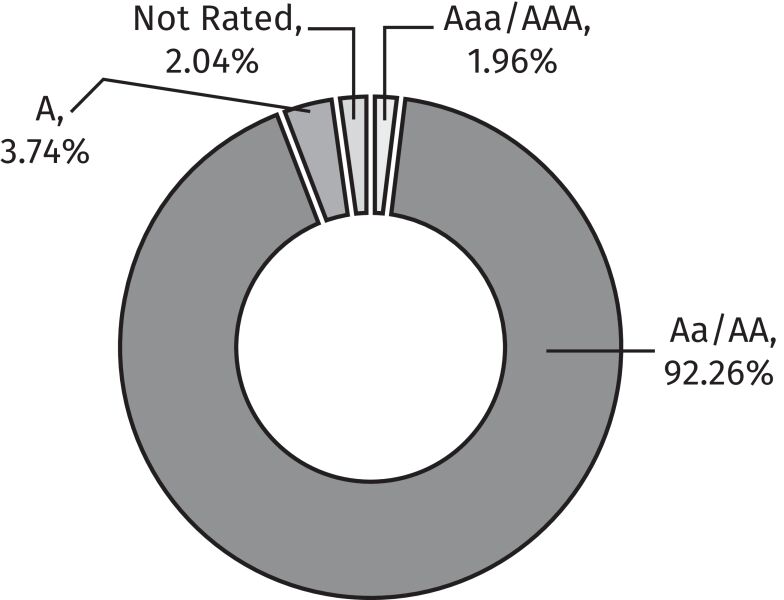
All ratings are assigned by Moody’s Ratings, a Nationally Recognized Statistical Rating Organization (“NRSRO”), unless otherwise noted. Moody’s Ratings was selected because it is recognized as a leading NRSRO that offers a transparent and reliable rating process for debt instruments. See Schedules of Portfolio Investments for individual bond ratings. Visit our website at
www.dupree-funds.com/documents
. What were the Fund costs for the last year?
(Based on a hypothetical $10,000 investment)
The table below explains the costs that you would have paid within the reporting period.
Fund |
Costs of a $10,000 investment |
Costs paid as a percentage of a $10,000 investment |
||||||
Kentucky Tax-Free Income Series |
$ | 60 | 0.60% | |||||
How did the Fund perform last year?
Longer-dated municipal bonds generally outperformed shorter-dated bonds during the
12-month
period ended June 30, 2026 (the “Review Period”). The Federal Reserve cut the fed funds rate three times during the Review Period, causing yields to decline and bond prices to rise. The Fund provided a total return of 7.65% during the Review Period which was higher than the Bloomberg Municipal Bond Index (“Muni Index”) which provided a total return of 7.03%. The Fund’s outperformance was primarily due to the fact that it had an average nominal maturity of 13.94 years versus 13.39 years for the Muni Index, which gave the Fund greater price sensitivity to the decline in interest rates during the Review Period and, in turn, greater price appreciation than the Muni Index.
During the Review Period, the Fund’s use of its current investment strategy did not cause the Fund’s performance to deviate materially from the manager’s expectations.
How has the Fund historically performed?
The following graph compares the initial and subsequent account v
alue
s at the end of each of the most recently completed 10 fiscal years of the Fund. It assumes a $10,000 initial investment at the beginning of the first fiscal year in an appropriate broad-based securities market index for the same period. 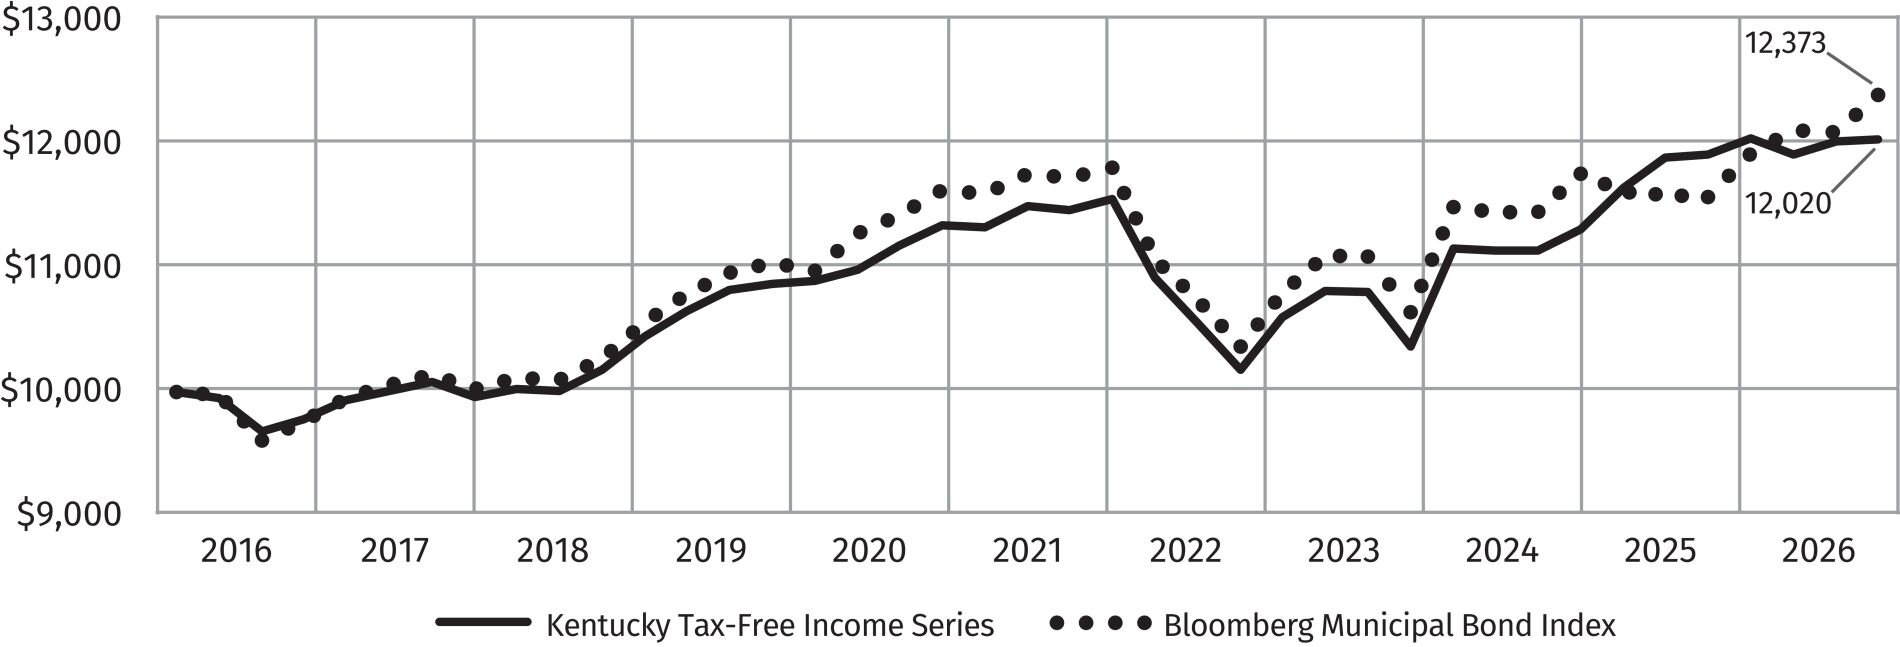
Average annual total return values (as of June 30, 2026):
1 Year |
5 Years |
10 Years |
||||||||||
Kentucky Tax-Free Income Series |
7.65 | % | 0.81 | % | 1.80 | % | ||||||
Bloomberg Municipal Bond Index |
7.03 | % | 1.05 | % | 2.14 | % | ||||||
What are the Key Fund statistics you should know?
The following table outlines key Fund statistics that you should pay attention to:
Fund’s net assets |
$ | 701,781,961 | ||
Total number of portfolio holdings |
400 | |||
Total advisory fees paid |
$ | 2,823,278 | ||
Portfolio turnover rate as of the end of year |
8.49% | |||
What is the Fund invested in?
The tables and charts below show the investment makeup of the Fund, representing the percentage of total investments and/or total net assets of the Fund.
Composition
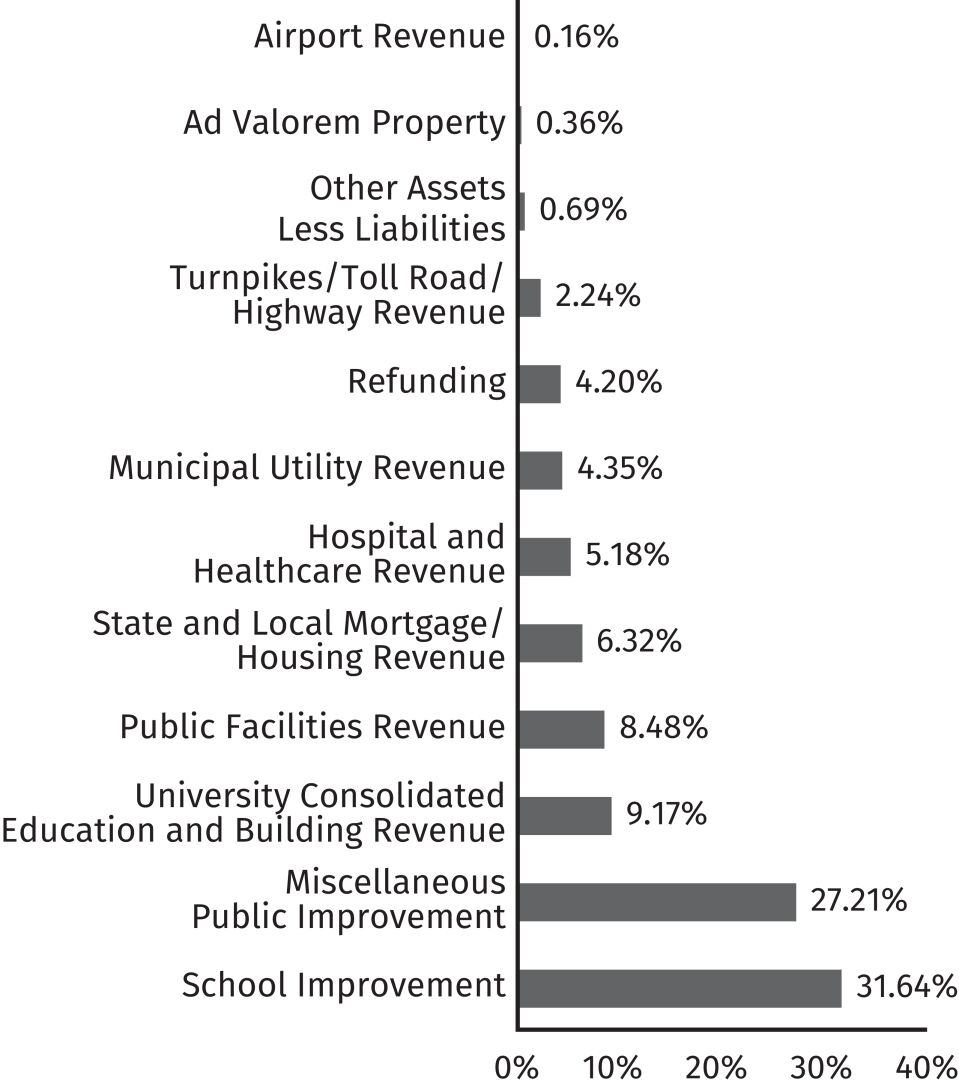
Credit Quality*
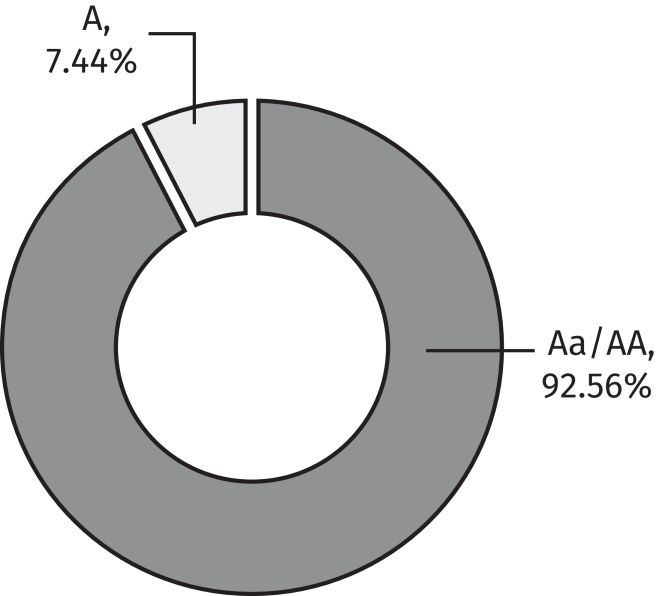
All ratings are assigned by Moody’s ratings, a Nationally Recognized Statistical Rating Organization (“NRSRO”), unless otherwise noted. Moody’s Ratings was selected because it is recognized as a leading NRSRO that offers a transparent and reliable rating process for debt instruments.
See Schedules of Portfolio Investments for individual bond ratings.
Visit our website at www.dupree-funds.com/documents. All ratings are assigned by Moody’s ratings, a Nationally Recognized Statistical Rating Organization (“NRSRO”), unless otherwise noted. Moody’s Ratings was selected because it is recognized as a leading NRSRO that offers a transparent and reliable rating process for debt instruments.
See Schedules of Portfolio Investments for individual bond ratings.
What were the Fund costs for the last year?
(Based on a hypothetical $10,000 investment)
The table below explains the costs that you would have paid within the reporting period.
Fund |
Costs of a $10,000 investment |
Costs paid as a percentage of a $10,000 investment |
||||||
Mississippi Tax-Free Income Series |
$ | 70 | 0.70% | |||||
How did the Fund perform last year?
Longer-dated municipal bonds generally outperformed shorter-dated bonds during the
12-month
period ended June 30, 2026 (the “Review Period”). The Federal Reserve cut the fed funds rate three times during the Review Period, causing yields to decline and bond prices to rise. The Fund provided a total return of 6.93% during the Review Period which was lower than the 7.03% total return provided by the Bloomberg Municipal Bond Index (the “Muni Index”). The Fund’s slight underperformance relative to the Muni Index was due primarily to the Fund’s shorter duration, as the Fund’s duration of 4.56 years, versus 6.48 years for the Muni Index., reduced the Fund’s sensitivity to interest rate movements and resulted in comparatively lower returns during the Review Period. Additionally, unlike the Fund, the Muni Index does not reflect any expenses and/or transaction costs.
During the Review Period, the Fund’s use of its current investment strategy did not cause the Fund’s performance to deviate materially from the manager’s expectations.
How has the Fund historically performed?
The following graph compares the initial and subsequent account values at the end of each of the most recently completed 10 fiscal years of the Fund. It assumes a $10,000 initial investment at the beginning of the first fiscal year in an appropriate broad-based securities market index for the same period.
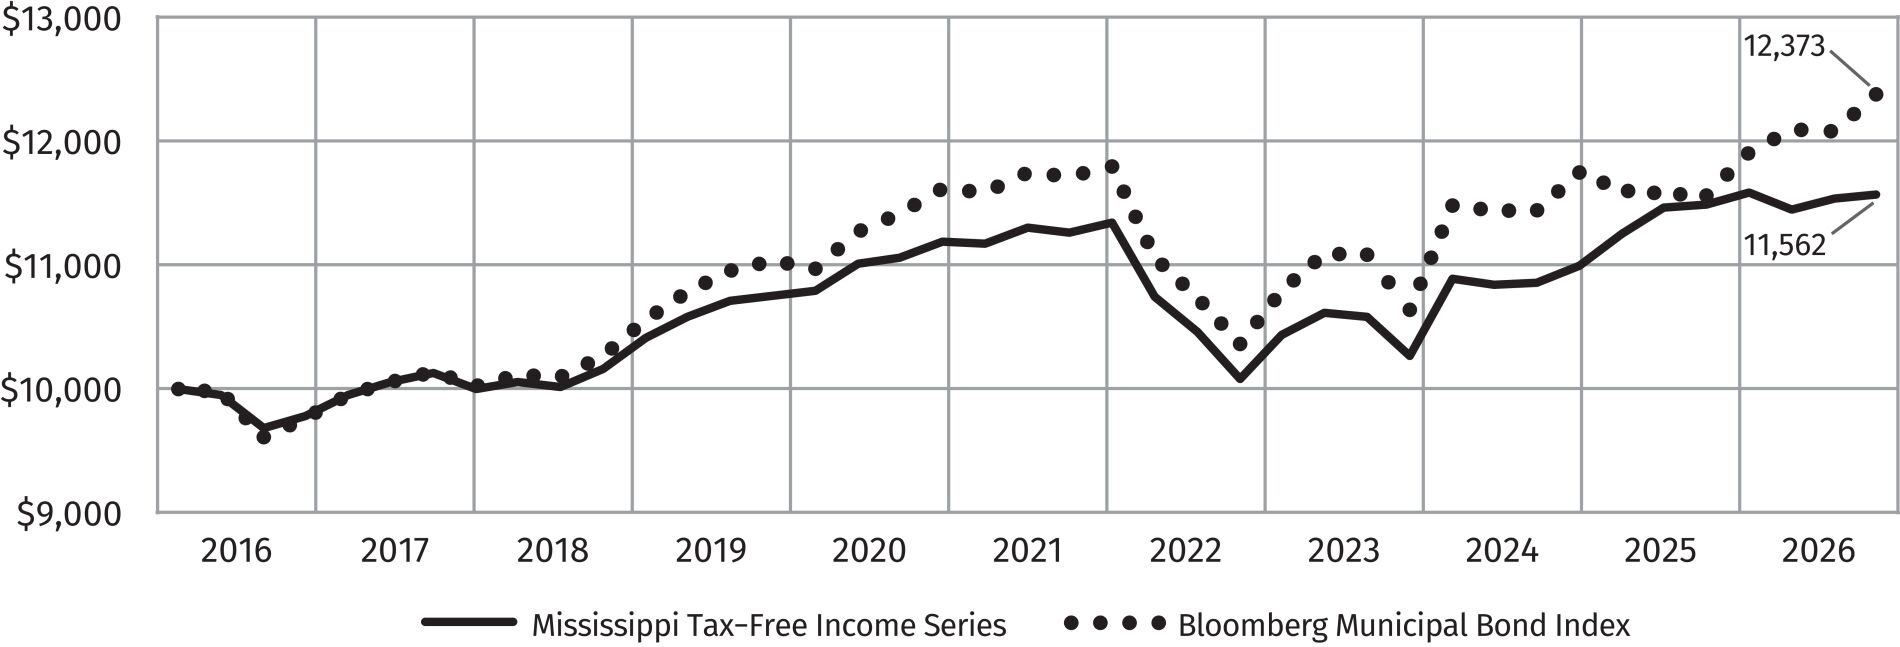
Average annual total return values (as of June 30, 2026):
1 Year |
5 Years |
10 Years |
||||||||||
Mississippi Tax-Free Income Series |
6.93 | % | 0.55 | % | 1.51 | % | ||||||
Bloomberg Municipal Bond Index |
7.03 | % | 1.05 | % | 2.14 | % | ||||||
What are the Key Fund statistics you should know?
The following table outlines key Fund statistics that you should pay attention to:
Fund’s net assets |
$ | 4,180,107 | ||
Total number of portfolio holdings |
27 | |||
Total advisory fees paid |
$ | 0 | ||
Portfolio turnover rate as of the end of year |
2.97% | |||
What is the Fund invested in?
The tables and charts below show the investment makeup of the Fund, representing the percentage of total investments and/or total net assets of the Fund.
Composition
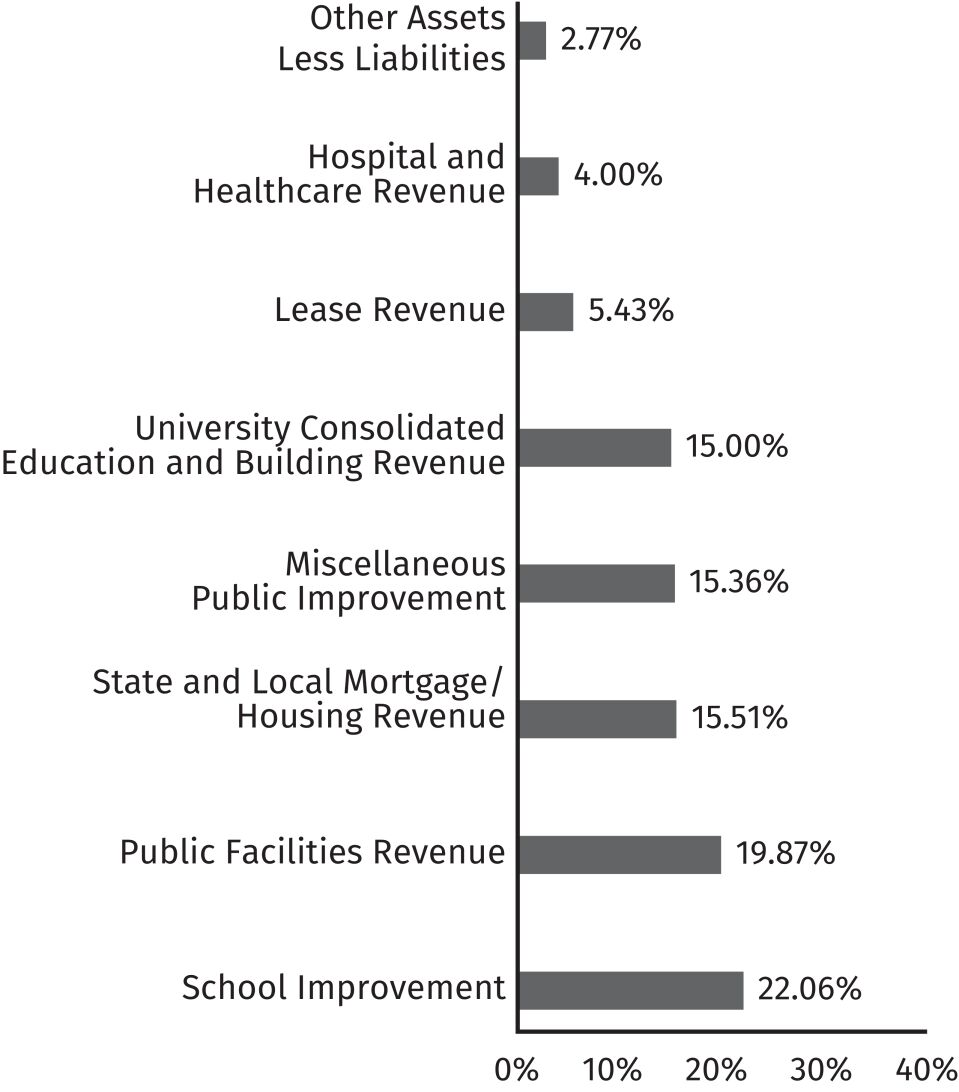
Credit Quality*
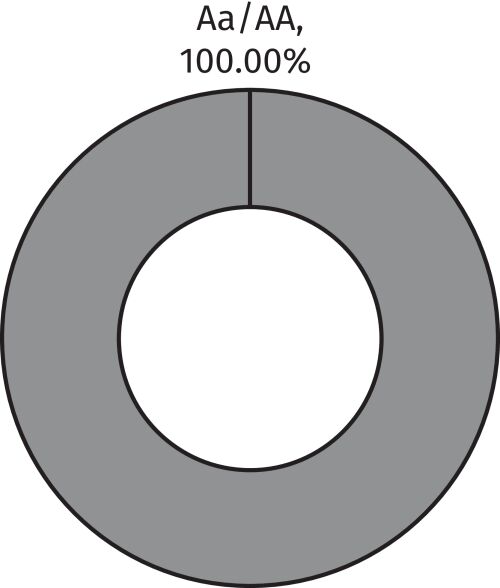
All ratings are assigned by Moody’s Ratings, a Nationally Recognized Statistical Rating Organization (“NRSRO”), unless otherwise noted. Moody’s Ratings was selected because it is recognized as a leading NRSRO that offers a transparent and reliable rating process for debt instruments. See Schedules of Portfolio Investments for individual bond ratings. Visit our website at www.dupree-funds.com/documents.
What were the Fund costs for the last year?
(Based on a hypothetical $10,000 investment)
The table below explains the costs that you would have paid within the reporting period.
Fund (Class) |
Costs of a $10,000 investment |
Costs paid as a percentage of a $10,000 investment |
||||||
North Carolina Tax-Free Income Series |
$ | 70 | 0.70% | |||||
How did the Fund perform last year?
Longer-dated municipal bonds generally outperformed shorter-dated bonds during the
12-month
period ended June 30, 2026 (the “Review Period”). The Federal Reserve cut the fed funds rate three times during the Review Period, causing yields to decline and bond prices to rise. The Fund provided a total return of 7.13% during the Review Period, which was higher than the total return of 7.03% provided by the Bloomberg Municipal Bond Index (the “Muni Index”). The outperformance of the Fund was due primarily to the fact that it had a longer nominal maturity of 14.05 years versus 13.39 years for the Muni Index, which gave the Fund greater sensitivity to interest rate changes and allowed it to benefit more from the decline in yields during the Review Period.
During the Review Period, the Fund’s use of its current investment strategy did not cause the Fund’s performance to deviate materially from the manager’s expectations.
How has the Fund historically performed?
The following graph compares the initial and subsequent account values at the end of each of the most recently completed 10 fiscal years of the Fund. It assumes a $10,000 initial investment at the beginning of the first fiscal year in an appropriate broad-based securities market index for the same period.
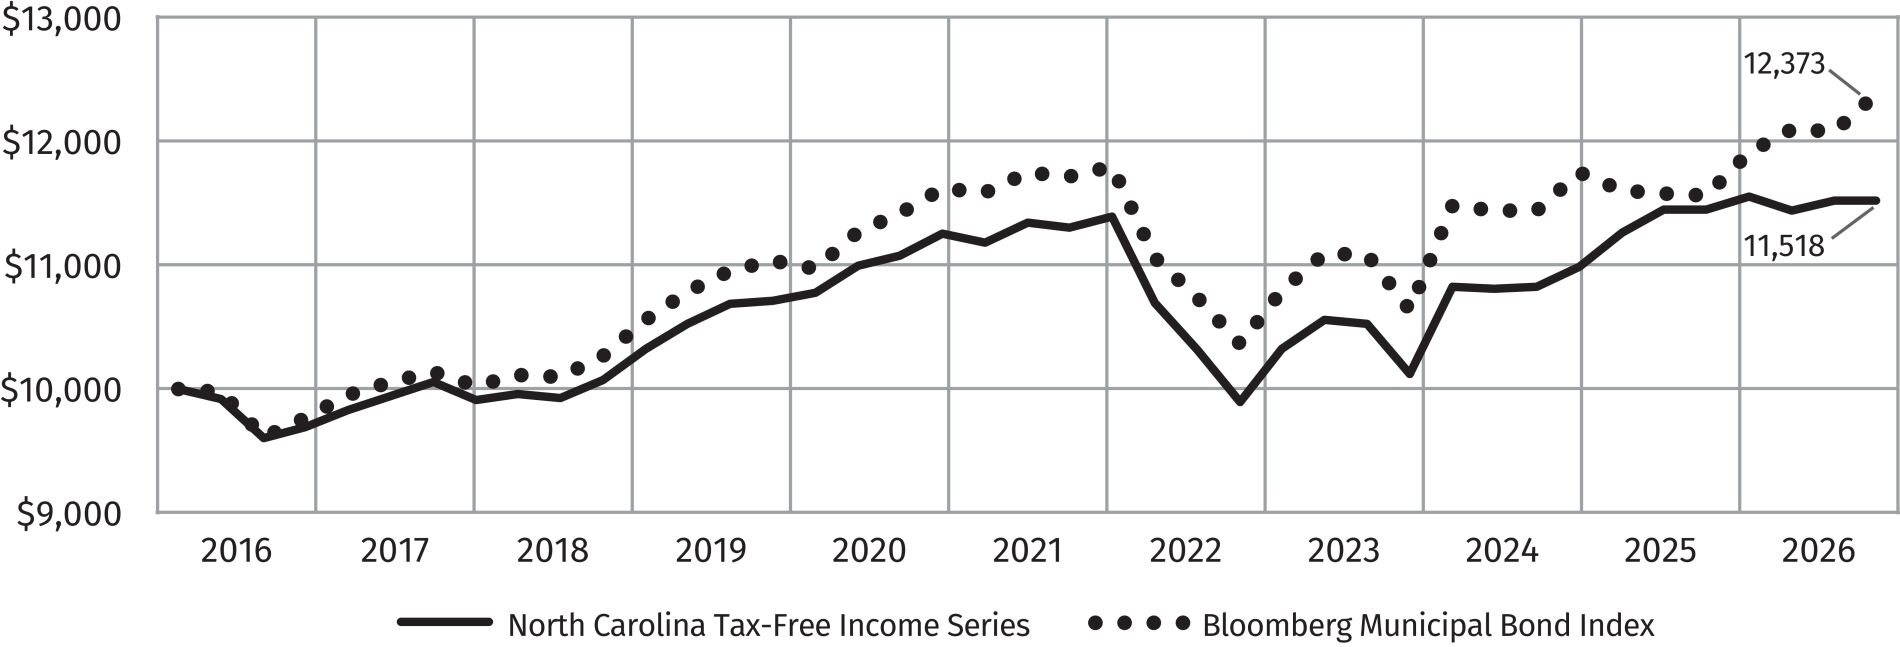
Average annual total return values (as of June 30, 2026):
1 Year |
5 Years |
10 Years |
||||||||||
North Carolina Tax-Free Income Series |
7.13 | % | 0.46 | % | 1.50 | % | ||||||
Bloomberg Municipal Bond Index |
7.03 | % | 1.05 | % | 2.14 | % | ||||||
What are the Key Fund statistics you should know?
The following table outlines key Fund statistics that you should pay attention to:
Fund’s net assets |
$ | 107,986,393 | ||
Total number of portfolio holdings |
170 | |||
Total advisory fees paid |
$ | 482,283 | ||
Portfolio turnover rate as of the end of year |
6.89% | |||
What is the Fund invested in?
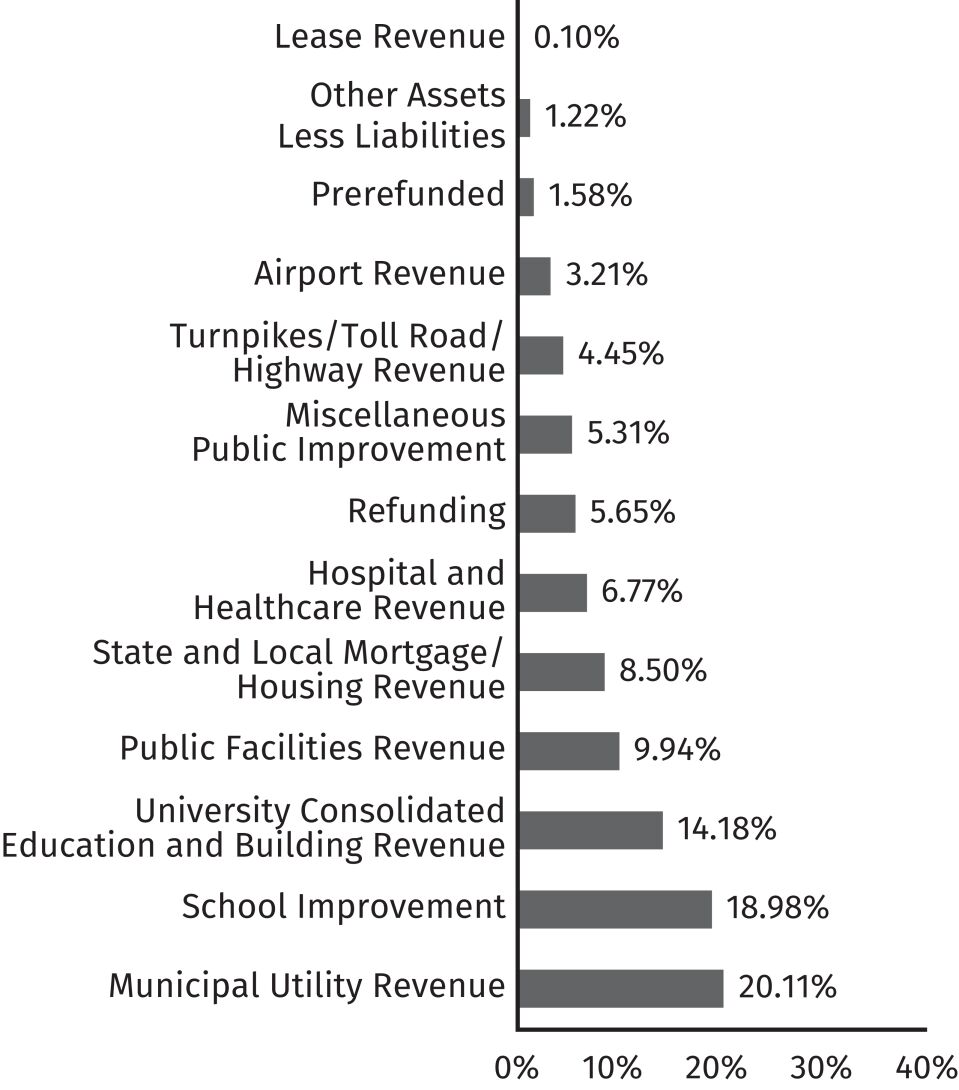
The tables and charts below show the investment makeup of the Fund, representing the percentage of total investments and/or total net assets of the Fund.
Composition
Credit Quality*
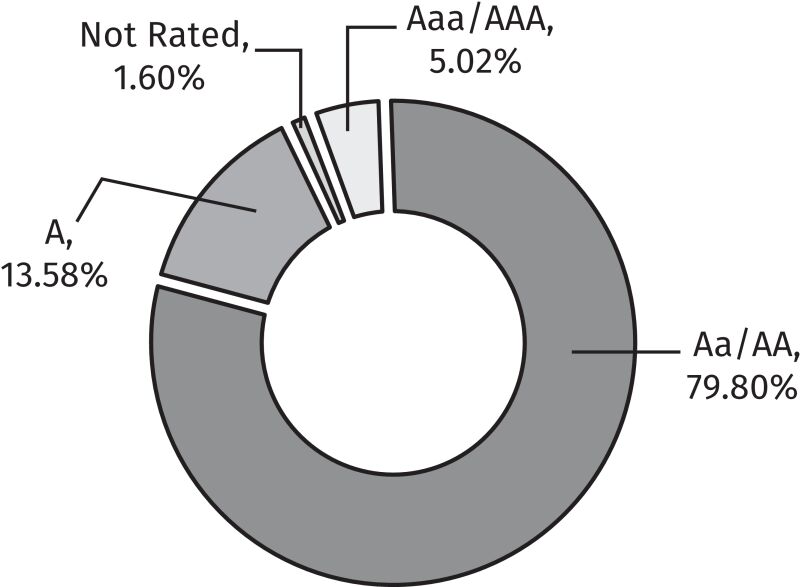
All ratings are assigned by Moody’s Ratings, a Nationally Recognized Statistical Rating Organization (“NRSRO”), unless otherwise noted. Moody’s Ratings was selected because it is recognized as a leading NRSRO that offers a transparent and reliable rating process for debt instruments. See Schedules of Portfolio Investments for individual bond ratings. Visit our website at www.dupree-funds.com/documents.
What were the Fund costs for the last year?
(Based on a hypothetical $10,000 investment)
The table below explains the costs that you would have paid within the reporting period.
Fund |
Costs of a $10,000 investment |
Costs paid as a percentage of a $10,000 investment |
||||||
Tennessee Tax-Free Income Series |
$ | 70 | 0.70% | |||||
How did the Fund perform last year?
Longer-dated municipal bonds generally outperformed shorter-dated bonds during the
12-month
period ended June 30, 2026 (the “Review Period”). The Federal Reserve cut the fed funds rate three times during the Review Period, causing yields to decline and bond prices to rise. The Fund provided a total return of 8.35% during the Review Period which was higher than the Bloomberg Municipal Bond Index (the “Muni Index”) which provided a total return of 7.03%. The outperformance of the Fund was primarily due to the fact that the Fund had an average nominal maturity of 15.05 years versus 13.39 years for the Muni Index, which lengthened the Fund’s duration and made it more sensitive to the decline in interest rates during the Review Period, resulting in greater price appreciation relative to the Muni Index.
During the Review Period, the Fund’s use of its current investment strategy did not cause the Fund’s performance to deviate materially from the manager’s expectations.
How has the Fund historically performed?
The following graph compares the initial and subsequent account values at the end of each of the most recently completed 10 fiscal years of the Fund. It assumes a $10,000 initial investment at the beginning of the first fiscal year in an appropriate broad-based securities market index for the same period.
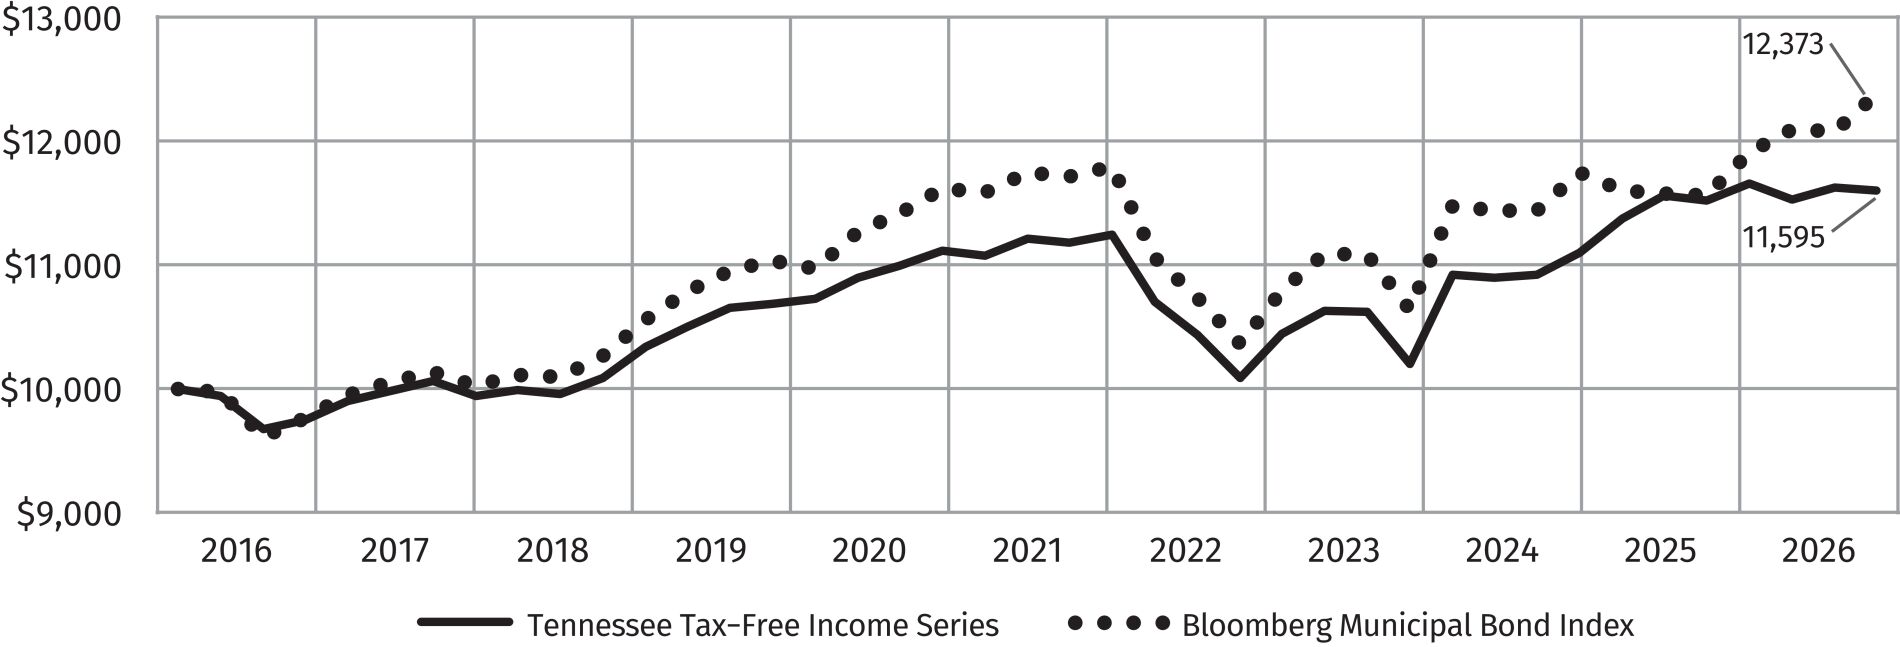
Average annual total return values (as of June 30, 2026):
1 Year |
5 Years |
10 Years |
||||||||||
Tennessee Tax-Free Income Series |
8.35 | % | 0.89 | % | 1.59 | % | ||||||
Bloomberg Municipal Bond Index |
7.03 | % | 1.05 | % | 2.14 | % | ||||||
What are the Key Fund statistics you should know?
The following table outlines key Fund statistics that you should pay attention to:
Fund’s net assets |
$ | 50,163,888 | ||
Total number of portfolio holdings |
77 | |||
Total advisory fees paid |
$ | 209,851 | ||
Portfolio turnover rate as of the end of year |
11.48% | |||
What is the Fund invested in?
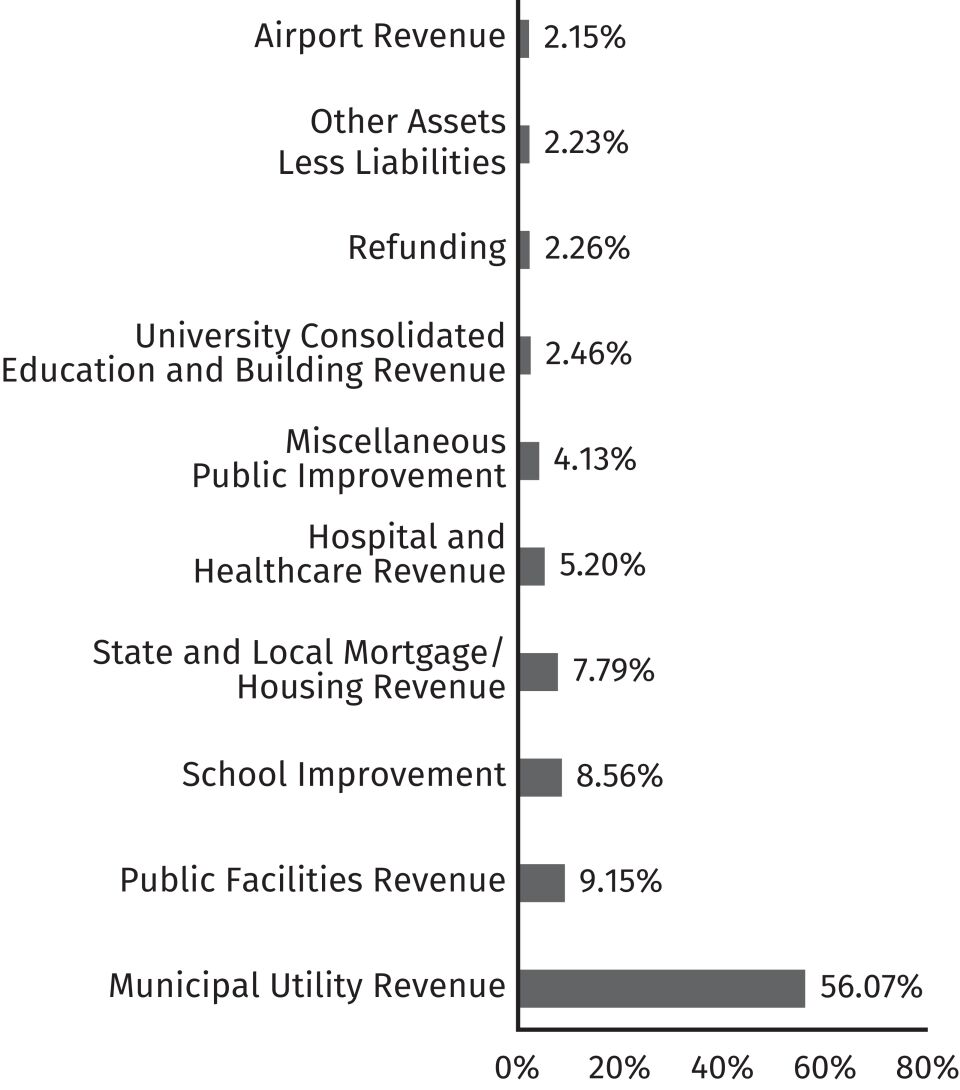
The tables and charts below show the investment makeup of the Fund, representing the percentage of total investments and/or total net assets of the Fund.
Composition
Credit Quality*
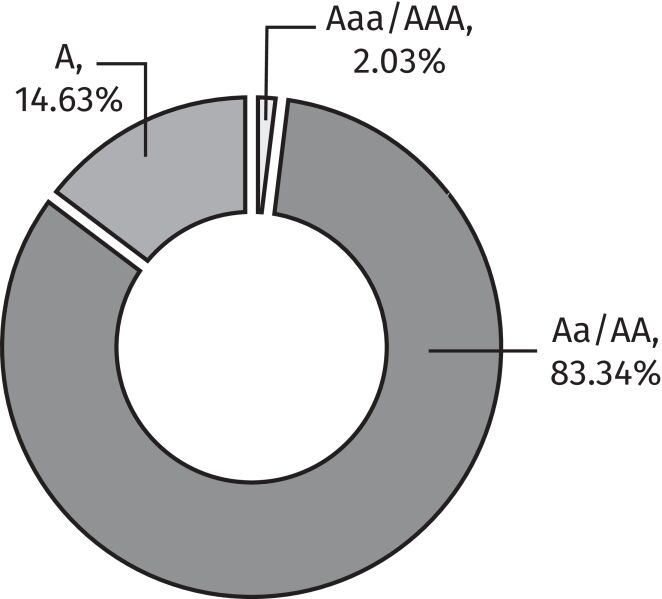
All ratings are assigned by Moody’s Ratings, a Nationally Recognized Statistical Rating Organization (“NRSRO”), unless otherwise noted. Moody’s Ratings was selected because it is recognized as a leading NRSRO that offers a transparent and reliable rating process for debt instruments. See Schedules of Portfolio Investments for individual bond ratings. Visit our website at www.dupree-funds.com/documents.
What were the Fund costs for the last year?
(Based on a hypothetical $10,000 investment)
The table below explains the costs that you would have paid within the reporting period.
Fund |
Costs of a $10,000 investment |
Costs paid as a percentage of a $10,000 investment |
||||||
Intermediate Government Bond Series |
$ | 70 | 0.70% | |||||
How did the Fund perform last year?
Longer-dated government bonds (i.e., U.S. Treasuries and Agencies) generally underperformed shorter-dated government bonds during the twelve-month period ending June 30, 2026 (the “Review Period”). Despite the fact that the Federal Reserve cut the fed funds rate on three separate occasions during the Review Period, short-term treasuries outperformed longer-term U.S. Treasuries because the yield curve remained inverted during the Review Period with yields on the
long-end
of the yield curve moving higher (bond prices lower). A resilient economy, sticky inflation, and heightened geopolitical tensions caused investors to demand higher yields on longer-dated bonds. The Fund provided a total return of 2.35% during the Review Period, which was lower than the total return of 2.67% provided by the Bloomberg Intermediate U.S. Government Bond Index (“Gov. Bond Index”). The Fund’s slight underperformance was mostly due to the fact that the Gov. Bond Index holds a number of Tennessee Valley Authority Agency bonds (“TVA bonds”) in its portfolio which typically yield more than other agencies (the Fund does not hold any TVA bonds). Additionally, unlike the Fund, the Gov. Bond Index does not reflect any expenses and/or transaction costs.
During the Review Period, the Fund’s use of its current investment strategy did not cause the performance to deviate materially from the manager’s expectations.
How has the Fund historically performed?
The following graph compares the initial and subsequent account values at the end of each of the most recently completed 10 fiscal years of the Fund. It assumes a $10,000 initial investment at the beginning of the first fiscal year in an appropriate broad-based securities market index for the same period.
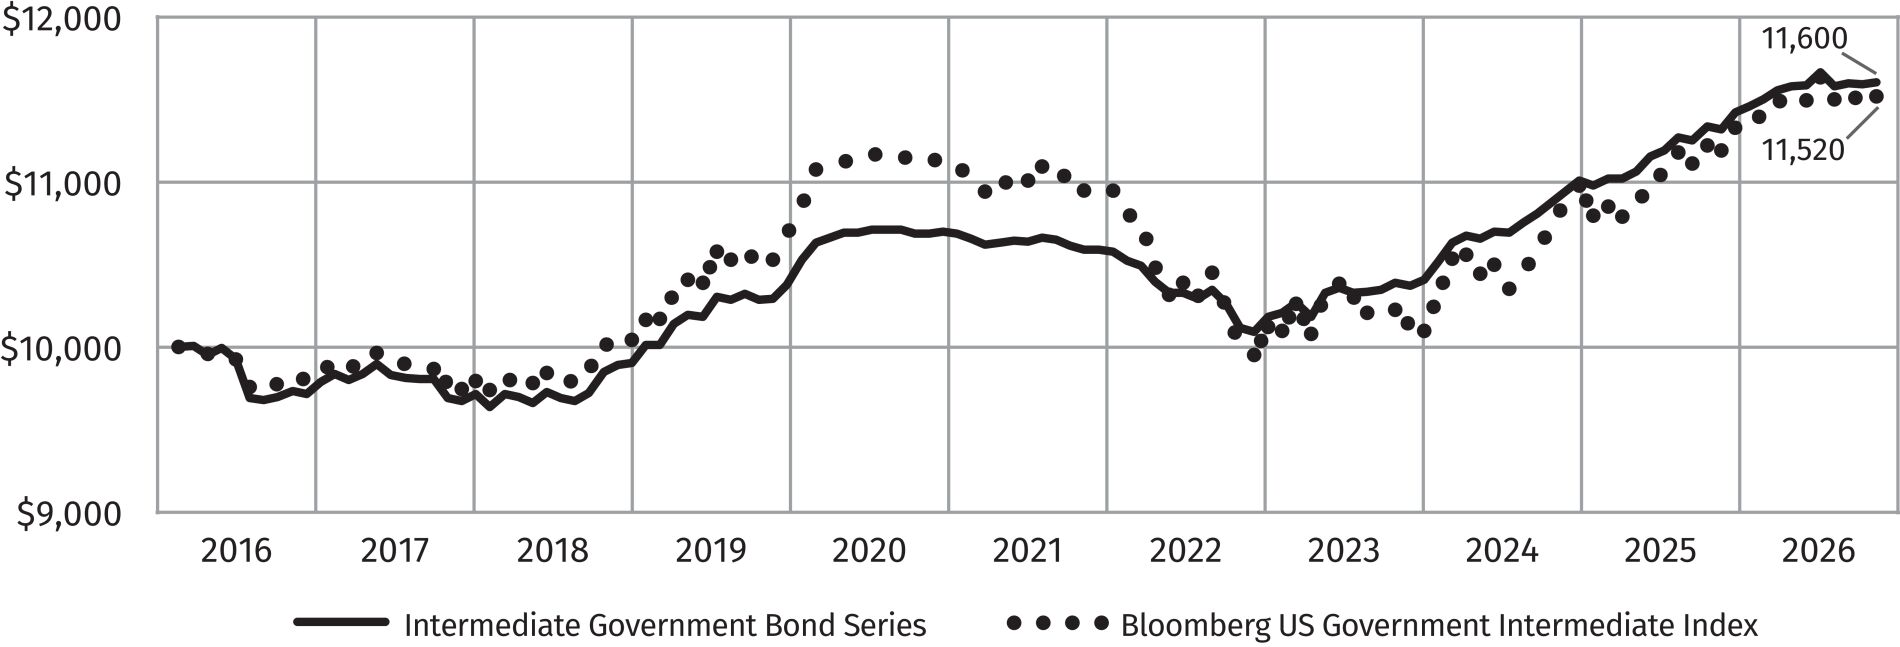
Average annual total return values (as of June 30, 2026):
1 Year |
5 Years |
10 Years |
||||||||||
Intermediate Government Bond Series |
2.35 | % | 1.74 | % | 1.50 | % | ||||||
Bloomberg Intermediate U.S. Government Bond Index |
2.67 | % | 0.91 | % | 1.42 | % | ||||||
What are the Key Fund statistics you should know?
The following table outlines key Fund statistics that you should pay attention to:
Fund’s net assets |
$ | 7,701,815 | ||
Total number of portfolio holdings |
24 | |||
Total advisory fees paid |
$ | 0 | ||
Portfolio turnover rate as of the end of year |
62.17% | |||
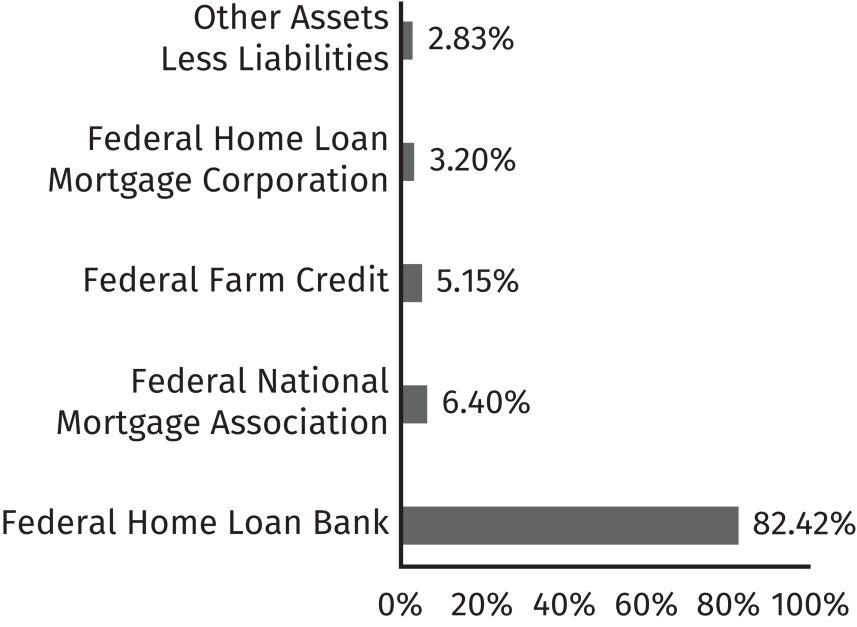
What is the Fund invested in?
The tables and charts below show the investment makeup of the Fund, representing the percentage of total investments and/or total net assets of the Fund.
Composition
Credit Quality*
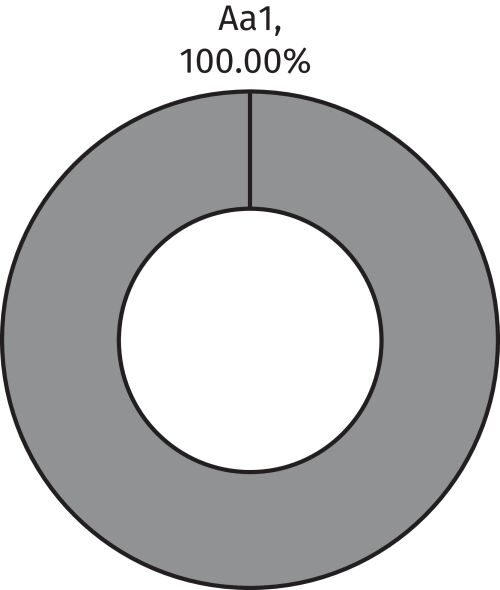
All ratings are assigned by Moody’s Ratings, a Nationally Recognized Statistical Rating Organization (“NRSRO”), unless otherwise noted. Moody’s Ratings was selected because it is recognized as a leading NRSRO that offers a transparent and reliable rating process for debt instruments. See Schedules of Portfolio Investments for individual bond ratings. Visit our website at www.dupree-funds.com/documents.
What were the Fund costs for the last year?
(Based on a hypothetical $10,000 investment)
The table below explains the costs that you would have paid within the reporting period.
Fund |
Costs of a $10,000 investment |
Costs paid as a percentage of a $10,000 investment |
||||||
Taxable Municipal Bond Series |
$ | 86 | 0.86% | |||||
How did the Fund perform last
year
? Longer-dated taxable municipal bonds generally outperformed shorter-dated taxable municipal bonds during the
12-month
period ended June 30, 2026 (the “Review Period”). The Federal Reserve cut the fed funds rate three times during the Review Period, causing yields to decline and bond prices to rise. The Fund provided a total return of 5.23% during the Review Period which was higher than the Bloomberg Taxable Municipal Bond Index (“Taxable Muni Index”) which provided a total return of 5.13%. The Fund’s outperformance was due primarily to its longer average nominal maturity of 17.89 years, versus 13.99 years for the Taxable Muni Index, which made the Fund more sensitive to the declining yields during the Review Period and resulted in greater price appreciation relative to the Taxable Muni Index.
During the Review Period, the Fund’s use of its current investment strategy did not cause the performance to deviate materially from the manager’s expectations.
How has the Fund historically performed?
The following graph compares the initial and subsequent account values at the end of each of the most recently completed 10 fiscal years of the Fund. It assumes a $10,000 initial investment at the beginning of the first fiscal year in an appropriate broad-based securities market index for the same period.
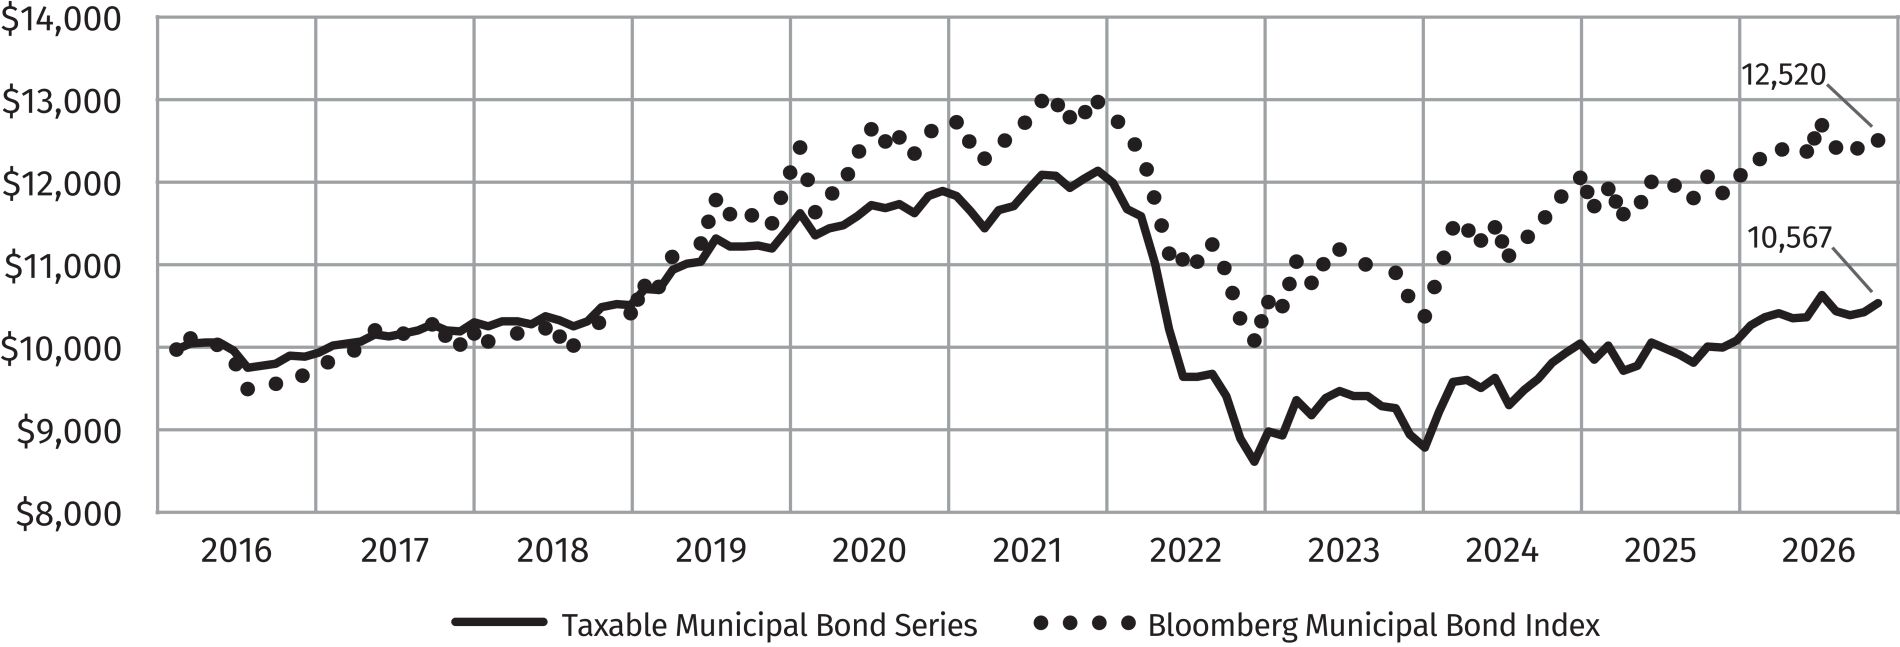
Average annual total return values (as of June 30, 2026):
1 Year |
5 Years |
10 Years |
||||||||||
Taxable Municipal Bond Series |
5.23 | % | (2.38) | % | 0.55 | % | ||||||
Bloomberg Taxable Municipal Bond Index |
5.13 | % | (0.11) | % | 2.42 | % | ||||||
What are the Key Fund statistics you should know?
The following table outlines key Fund statistics that you should pay attention to:
Fund’s net assets |
$ | 3,054,944 | ||
Total number of portfolio holdings |
19 | |||
Total advisory fees paid |
$ | 0 | ||
Portfolio turnover rate as of the end of year |
6.68% | |||
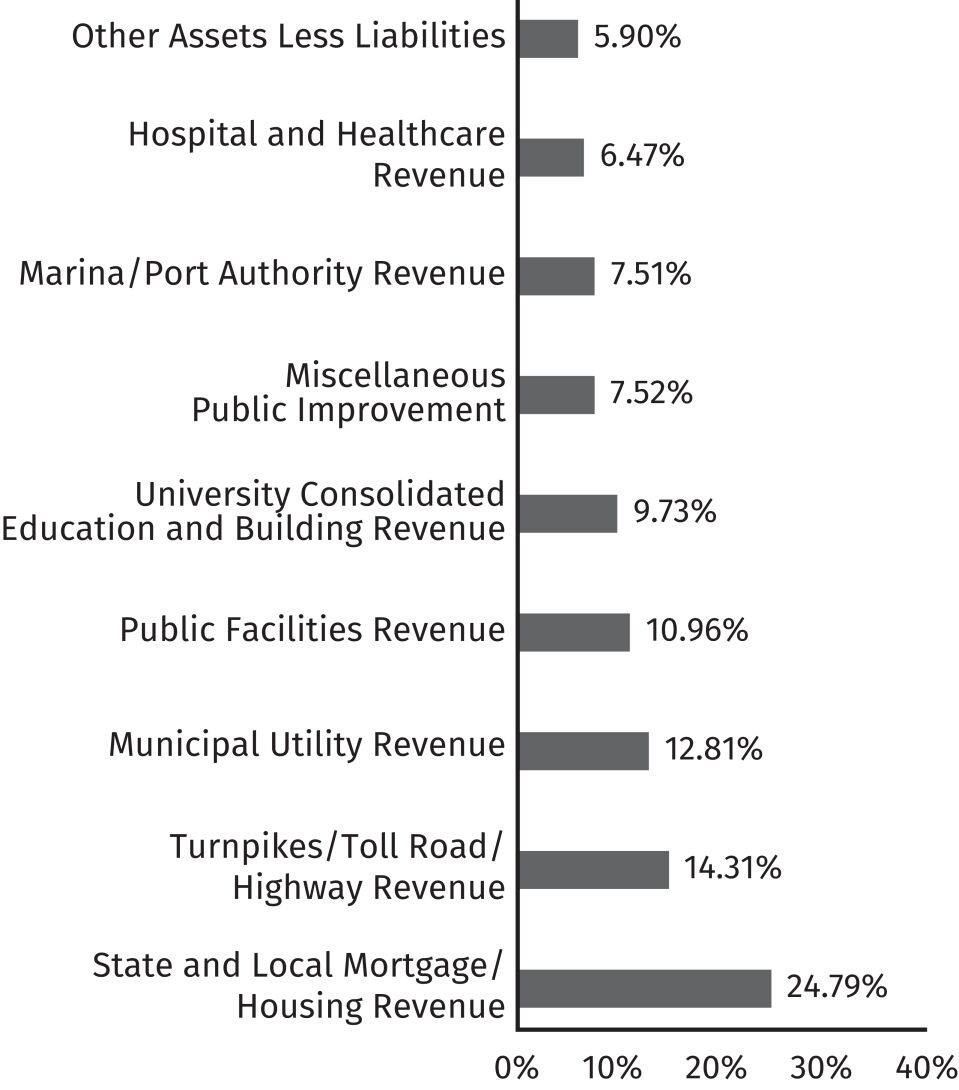
What is the Fund invested in?
The tables and charts below show the investment makeup of the Fund, representing the percentage of total investments and/or total net assets of the Fund.
Composition
Credit Quality*
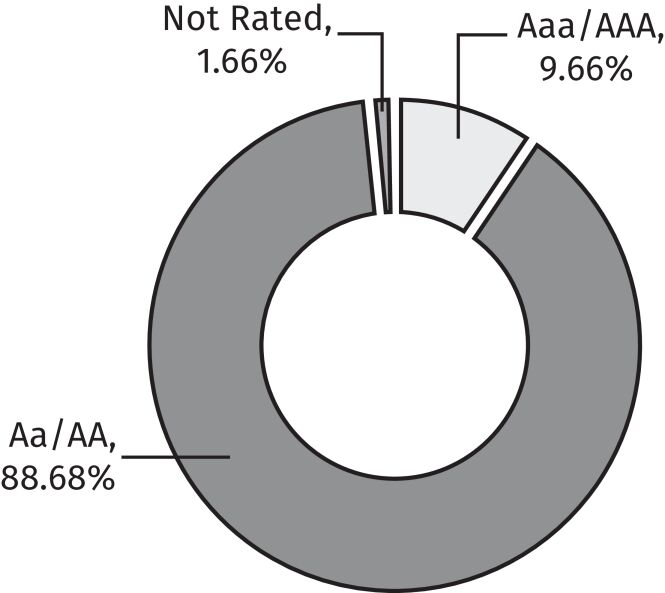
All ratings are assigned by Moody’s Ratings, a Nationally Recognized Statistical Rating Organization (“NRSRO”), unless otherwise noted. Moody’s Ratings was selected because it is recognized as a leading NRSRO that offers a transparent and reliable rating process for debt instruments. See Schedules of Portfolio Investments for individual bond ratings. Visit our website at www.dupree-funds.com/documents.