Shareholder Report
|
12 Months Ended |
|
Jun. 30, 2026
USD ($)
Holding
|
|---|
| Shareholder Report [Line Items] |
|
| Document Type |
N-CSR
|
| Amendment Flag |
false
|
| Registrant Name |
HC Capital Trust
|
| Entity Central Index Key |
0000934563
|
| Entity Investment Company Type |
N-1A
|
| Document Period End Date |
Jun. 30, 2026
|
| Shareholder Report Annual or Semi-Annual |
Annual Shareholder Report
|
| C000025694 |
|
| Shareholder Report [Line Items] |
|
| Fund Name |
The U.S. Equity Portfolio
|
| Trading Symbol |
HCEGX
|
| Annual or Semi-Annual Statement [Text Block] |
This annual shareholder report contains important information about The U.S. Equity Portfolio for the period of July 1, 2025 to June 30, 2026.
|
| Additional Information Phone Number |
(800) 242-9596
|
| Additional Information Website |
www.hccapitalsolutions.com
|
| Expenses [Text Block] |
What were the Fund's costs for the last year? (based on a hypothetical $10,000 investment) Table SummaryFund Name | Costs of a $10,000
investment | Costs paid as a percentage of a
$10,000 investment |
|---|
The U.S. Equity Portfolio | $17 | 0.15% |
|---|
|
| Expenses Paid, Amount |
$ 17
|
| Expense Ratio, Percent |
0.15%
|
| Factors Affecting Performance [Text Block] |
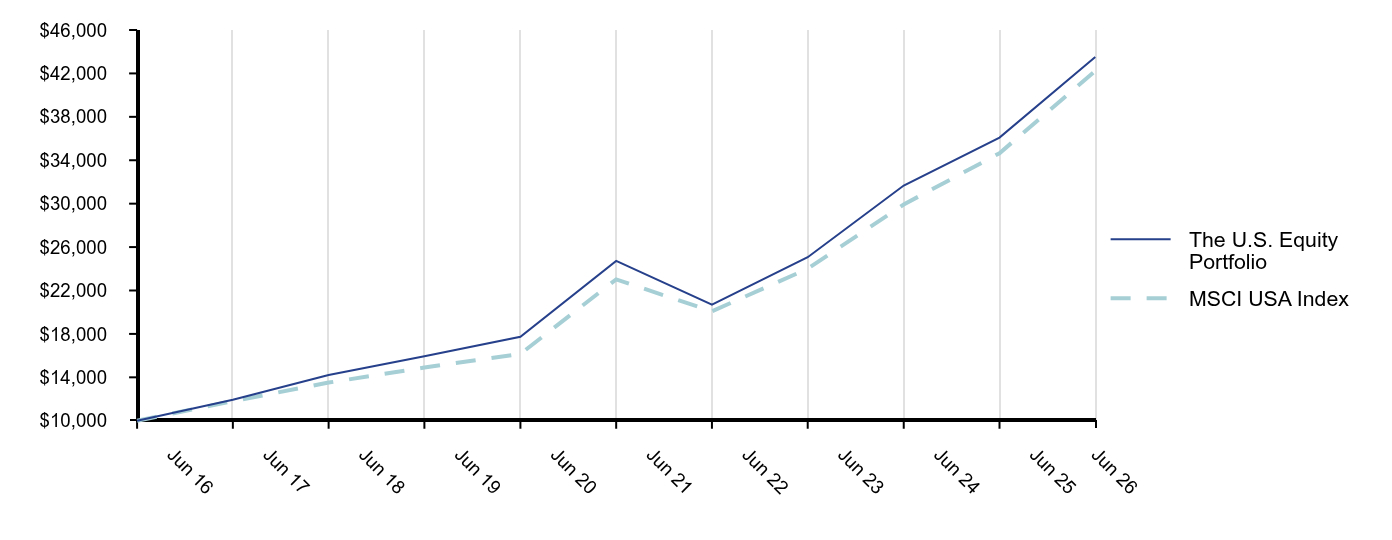
How did the Fund perform last year?The U.S. Equity Portfolio (the “Portfolio”) managed by Parametric Portfolio Associates, LLC (“Parametric”) returned 20.58% for the fiscal year compared to 21.89% for the MSCI USA Index. The fiscal year ended June 30, 2026 was marked by strong equity market performance despite heightened geopolitical uncertainty and higher interest rates. Resilient corporate earnings and continued investment in AI infrastructure helped drive broad market gains, although leadership remained highly concentrated among a relatively small group of companies. The Portfolio underperformed its benchmark over the period. The tax-managed strategy run by Parametric focuses on minimizing taxable gains subject to a tracking error constraint relative to the broad U.S. market (i.e., both value and growth stocks). The tax management stock implementation underperformed during the period. |
| Performance Past Does Not Indicate Future [Text] |
Past performance is not an indication of future results.
|
| Line Graph [Table Text Block] |
Table Summary | The U.S. Equity Portfolio | MSCI USA Index |
|---|
Jun 26 | 43,513 | 42,230 |
|---|
Jun 25 | 36,088 | 34,647 |
|---|
Jun 24 | 31,670 | 29,925 |
|---|
Jun 23 | 25,066 | 24,007 |
|---|
Jun 22 | 20,693 | 20,077 |
|---|
Jun 21 | 24,723 | 23,023 |
|---|
Jun 20 | 17,732 | 16,156 |
|---|
Jun 19 | 15,950 | 14,901 |
|---|
Jun 18 | 14,213 | 13,516 |
|---|
Jun 17 | 11,931 | 11,802 |
|---|
Jun 16 | 10,000 | 10,000 |
|---|
|
| Average Annual Return [Table Text Block] |
Table Summary | 1 Year | 5 Years | 10 Years |
|---|
The U.S. Equity Portfolio | 20.58% | 11.97% | 15.84% |
|---|
MSCI USA Index | 21.89% | 12.90% | 15.49% |
|---|
|
| No Deduction of Taxes [Text Block] |
Performance results do not include the deduction of taxes that a shareholder would pay on fund distributions or redemptions of fund shares.
|
| AssetsNet |
$ 2,092,812,372
|
| Holdings Count | Holding |
616
|
| Advisory Fees Paid, Amount |
$ 1,521,016
|
| InvestmentCompanyPortfolioTurnover |
8.00%
|
| Additional Fund Statistics [Text Block] |
Table SummaryNet Assets | $2,092,812,372 |
|---|
Number of Portfolio Holdings | 616 |
|---|
Net Investment Advisory Fees | $1,521,016 |
|---|
Portfolio Turnover Rate | 8% |
|---|
|
| Holdings [Text Block] |
Table SummaryInvestments | Percent of Net Assets |
|---|
Information Technology | 37.1% | Financials | 11.9% | Communication Services | 9.7% | Industrials | 9.3% | Health Care | 9.2% | Consumer Discretionary | 9.2% | Consumer Staples | 4.5% | Energy | 3.2% | Utilities | 2.4% | Materials | 1.7% | Real Estate | 1.6% | Other Investments | 0.2% | |
| Material Fund Change [Text Block] |
There were no material fund changes during the reporting period. |
| Summary of Change Legend [Text Block] |
There were no material fund changes during the reporting period.
|
| C000062556 |
|
| Shareholder Report [Line Items] |
|
| Fund Name |
The Institutional U.S. Equity Portfolio
|
| Trading Symbol |
HCIGX
|
| Annual or Semi-Annual Statement [Text Block] |
This annual shareholder report contains important information about The Institutional U.S. Equity Portfolio for the period of July 1, 2025 to June 30, 2026.
|
| Additional Information Phone Number |
(800) 242-9596
|
| Additional Information Website |
www.hccapitalsolutions.com
|
| Expenses [Text Block] |
What were the Fund's costs for the last year? (based on a hypothetical $10,000 investment) Table SummaryFund Name | Costs of a $10,000
investment | Costs paid as a percentage of a
$10,000 investment |
|---|
The Institutional U.S. Equity Portfolio | $15 | 0.14% |
|---|
|
| Expenses Paid, Amount |
$ 15
|
| Expense Ratio, Percent |
0.14%
|
| Factors Affecting Performance [Text Block] |
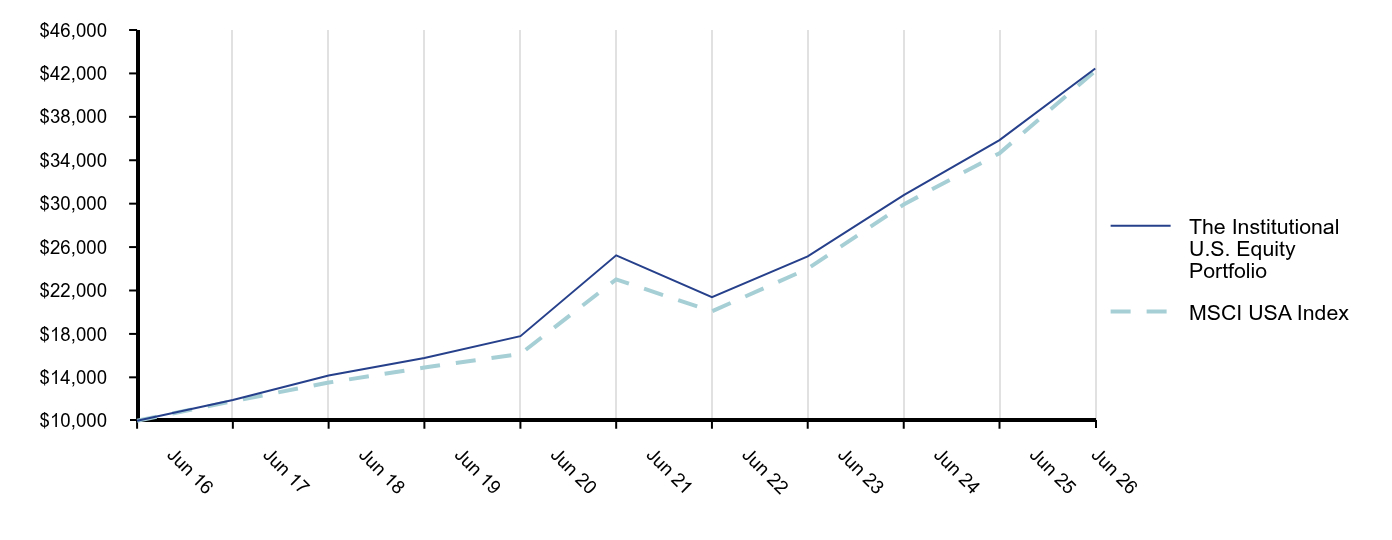
How did the Fund perform last year?The Institutional U.S. Equity Portfolio (the “Portfolio”) managed by Mellon Investments Corporation (“Mellon”), Parametric Portfolio Associates, LLC, RhumbLine Advisers (“RhumbLine”) and Wellington Management Company, LLP (“Wellington”) returned 18.39% for the fiscal year compared to 21.89% for the MSCI USA Index. The fiscal year ended June 30, 2026 was marked by strong equity market performance despite heightened geopolitical uncertainty and higher interest rates. Resilient corporate earnings and continued investment in AI infrastructure helped drive broad market gains, although leadership remained highly concentrated among a relatively small group of companies. The Portfolio underperformed the benchmark primarily due to Parametric's modest bias toward developed markets outside the U.S. Mellon underperformed due to its modest bias towards low-volatility stocks. During the fiscal year, RhumbLine’s performance of 21.92% was slightly behind its Russell 1000 Index benchmark which returned 21.99%. The Russell 1000 Index modestly outperformed the MSCI USA Index due to its exposure to a more diversified set of U.S. securities that resulted in a bias towards securities with smaller market capitalization than the benchmark. Wellington implements a public real estate strategy which, while in line with the real estate market, underperformed broad equity markets as elevated rates caused REITs to lag. |
| Performance Past Does Not Indicate Future [Text] |
Past performance is not an indication of future results.
|
| Line Graph [Table Text Block] |
Table Summary | The Institutional U.S. Equity Portfolio | MSCI USA Index |
|---|
Jun 26 | 42,452 | 42,230 |
|---|
Jun 25 | 35,859 | 34,647 |
|---|
Jun 24 | 30,777 | 29,925 |
|---|
Jun 23 | 25,145 | 24,007 |
|---|
Jun 22 | 21,380 | 20,077 |
|---|
Jun 21 | 25,243 | 23,023 |
|---|
Jun 20 | 17,790 | 16,156 |
|---|
Jun 19 | 15,784 | 14,901 |
|---|
Jun 18 | 14,161 | 13,516 |
|---|
Jun 17 | 11,903 | 11,802 |
|---|
Jun 16 | 10,000 | 10,000 |
|---|
|
| Average Annual Return [Table Text Block] |
Table Summary | 1 Year | 5 Years | 10 Years |
|---|
The Institutional U.S. Equity Portfolio | 18.39% | 10.96% | 15.56% |
|---|
MSCI USA Index | 21.89% | 12.90% | 15.49% |
|---|
|
| No Deduction of Taxes [Text Block] |
Performance results do not include the deduction of taxes that a shareholder would pay on fund distributions or redemptions of fund shares.
|
| AssetsNet |
$ 3,168,418,906
|
| Holdings Count | Holding |
1,072
|
| Advisory Fees Paid, Amount |
$ 2,310,809
|
| InvestmentCompanyPortfolioTurnover |
42.00%
|
| Additional Fund Statistics [Text Block] |
Table SummaryNet Assets | $3,168,418,906 |
|---|
Number of Portfolio Holdings | 1,072 |
|---|
Net Investment Advisory Fees | $2,310,809 |
|---|
Portfolio Turnover Rate | 42% |
|---|
|
| Holdings [Text Block] |
Table SummaryInvestments | Percent of Net Assets |
|---|
Information Technology | 18.8% | Investment Companies - Money Market Funds | 16.4% | Investment Companies - International Equity | 8.4% | Financials | 8.3% | Health Care | 7.6% | Industrials | 6.9% | Consumer Discretionary | 6.6% | Real Estate | 6.2% | Communication Services | 5.1% | Consumer Staples | 4.1% | Investment Companies - Domestic Equity | 3.4% | Other Investments | 5.8% | |
| Material Fund Change [Text Block] |
There were no material fund changes during the reporting period. |
| Summary of Change Legend [Text Block] |
There were no material fund changes during the reporting period.
|
| C000157800 |
|
| Shareholder Report [Line Items] |
|
| Fund Name |
The ESG Growth Portfolio
|
| Trading Symbol |
HCESX
|
| Annual or Semi-Annual Statement [Text Block] |
This annual shareholder report contains important information about The ESG Growth Portfolio for the period of July 1, 2025 to June 30, 2026.
|
| Additional Information Phone Number |
(800) 242-9596
|
| Additional Information Website |
www.hccapitalsolutions.com
|
| Expenses [Text Block] |
What were the Fund's costs for the last year? (based on a hypothetical $10,000 investment) Table SummaryFund Name | Costs of a $10,000
investment | Costs paid as a percentage of a
$10,000 investment |
|---|
The ESG Growth Portfolio | $31 | 0.28% |
|---|
|
| Expenses Paid, Amount |
$ 31
|
| Expense Ratio, Percent |
0.28%
|
| Factors Affecting Performance [Text Block] |
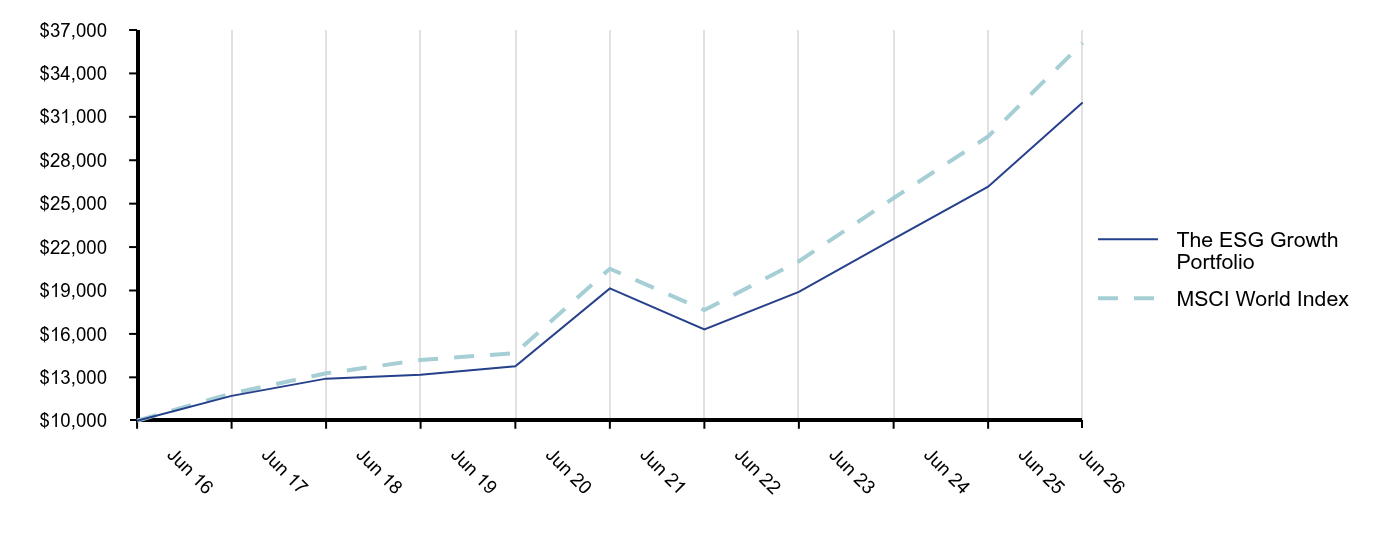
How did the Fund perform last year?The ESG Growth Portfolio (the “Portfolio”) managed by Mellon Investments Corporation (“Mellon”) and Parametric Portfolio Associates, LLC (“Parametric”) returned 22.25% for the fiscal year compared to 21.81% for the MSCI World Index. The Portfolio’s outperformance can be attributed to the Global ESG screening strategy, which was run by Mellon and outperformed. The Portfolio requires that the underlying managers integrate ESG criteria in their investment selection. Mellon uses third-party ESG data to better understand the environmental, social and governance risks and opportunities when making investment decisions. Parametric replicates the benchmark index using futures. This allows the Portfolio to have cash on hand to meet redemptions and invest opportunistically. |
| Performance Past Does Not Indicate Future [Text] |
Past performance is not an indication of future results.
|
| Line Graph [Table Text Block] |
Table Summary | The ESG Growth Portfolio | MSCI World Index |
|---|
Jun 26 | 31,997 | 36,104 |
|---|
Jun 25 | 26,172 | 29,639 |
|---|
Jun 24 | 22,572 | 25,384 |
|---|
Jun 23 | 18,903 | 21,021 |
|---|
Jun 22 | 16,308 | 17,645 |
|---|
Jun 21 | 19,141 | 20,504 |
|---|
Jun 20 | 13,768 | 14,680 |
|---|
Jun 19 | 13,176 | 14,197 |
|---|
Jun 18 | 12,910 | 13,276 |
|---|
Jun 17 | 11,719 | 11,886 |
|---|
Jun 16 | 10,000 | 10,000 |
|---|
|
| Average Annual Return [Table Text Block] |
Table Summary | 1 Year | 5 Years | 10 Years |
|---|
The ESG Growth Portfolio | 22.25% | 10.82% | 12.33% |
|---|
MSCI World Index | 21.81% | 11.98% | 13.70% |
|---|
|
| No Deduction of Taxes [Text Block] |
Performance results do not include the deduction of taxes that a shareholder would pay on fund distributions or redemptions of fund shares.
|
| AssetsNet |
$ 124,259,177
|
| Holdings Count | Holding |
1,244
|
| Advisory Fees Paid, Amount |
$ 129,028
|
| InvestmentCompanyPortfolioTurnover |
6.00%
|
| Additional Fund Statistics [Text Block] |
Table SummaryNet Assets | $124,259,177 |
|---|
Number of Portfolio Holdings | 1,244 |
|---|
Net Investment Advisory Fees | $129,028 |
|---|
Portfolio Turnover Rate | 6% |
|---|
|
| Holdings [Text Block] |
Table SummaryInvestments | Percent of Net Assets |
|---|
Information Technology | 30.6% | Financials | 16.2% | Industrials | 11.7% | Health Care | 9.3% | Consumer Discretionary | 9.1% | Communication Services | 6.7% | Consumer Staples | 4.5% | Energy | 3.7% | Materials | 3.4% | Utilities | 2.7% | Real Estate | 1.7% | Other Investments | 0.2% | |
| Material Fund Change [Text Block] |
There were no material fund changes during the reporting period. |
| Summary of Change Legend [Text Block] |
There were no material fund changes during the reporting period.
|
| C000164403 |
|
| Shareholder Report [Line Items] |
|
| Fund Name |
The Catholic SRI Growth Portfolio
|
| Trading Symbol |
HCSRX
|
| Annual or Semi-Annual Statement [Text Block] |
This annual shareholder report contains important information about The Catholic SRI Growth Portfolio for the period of July 1, 2025 to June 30, 2026.
|
| Additional Information Phone Number |
(800) 242-9596
|
| Additional Information Website |
www.hccapitalsolutions.com
|
| Expenses [Text Block] |
What were the Fund's costs for the last year? (based on a hypothetical $10,000 investment) Table SummaryFund Name | Costs of a $10,000
investment | Costs paid as a percentage of a
$10,000 investment |
|---|
The Catholic SRI Growth Portfolio | $32 | 0.29% |
|---|
|
| Expenses Paid, Amount |
$ 32
|
| Expense Ratio, Percent |
0.29%
|
| Factors Affecting Performance [Text Block] |
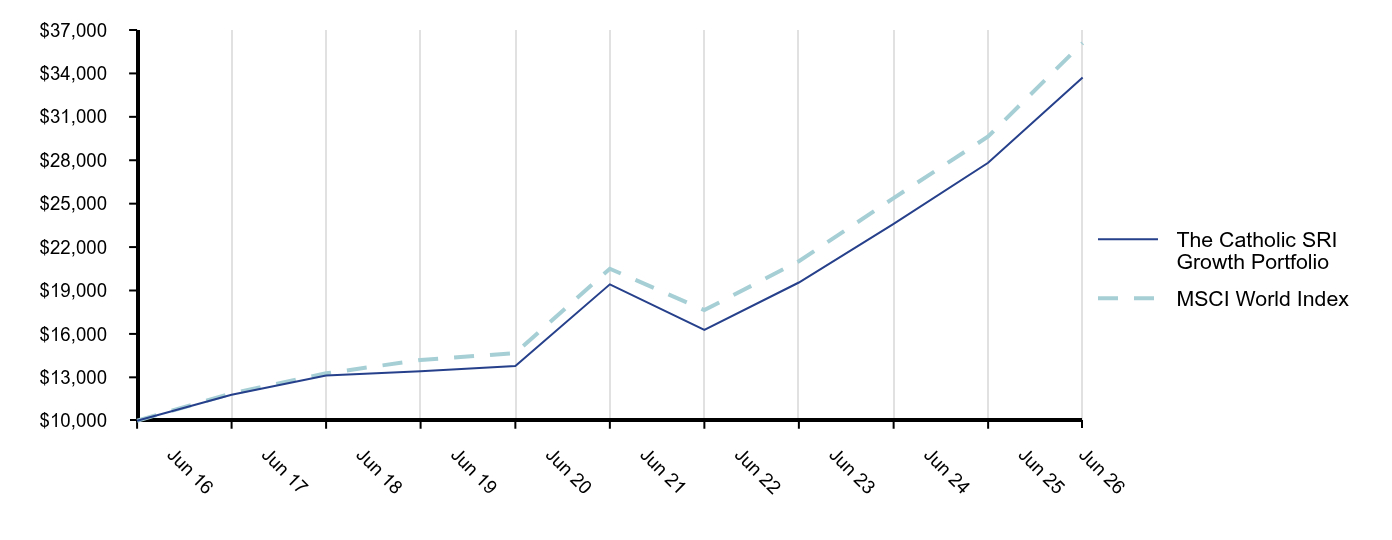
How did the Fund perform last year?The Catholic SRI Growth Portfolio (the “Portfolio”) managed by Mellon Investments Corporation (“Mellon”) returned 21.16% for the fiscal year compared to 21.81% for the MSCI World Index. The Portfolio’s under-performance can be attributed primarily to the screening that is required to adhere to Catholic values, which is managed by Mellon. The screening resulted in an underweight to the health care sector relative to the benchmark, and this positioning was the largest detractor from relative performance. The Portfolio is diversified across securities to ensure proper portfolio diversification, with the goal of providing competitive long-term returns in as consistent a manner as possible. As a result, it is expected that some styles will be leading at times, while others are lagging and vice versa. The Portfolio expects to participate in this cyclicality of styles by maintaining market exposure comparable to MSCI World Index. The Portfolio requires that the underlying managers integrate Catholic values in their investment selections, which includes negative screens. Mellon uses third-party data to implement the negative screens in the Portfolio. |
| Performance Past Does Not Indicate Future [Text] |
Past performance is not an indication of future results.
|
| Line Graph [Table Text Block] |
Table Summary | The Catholic SRI Growth Portfolio | MSCI World Index |
|---|
Jun 26 | 33,712 | 36,104 |
|---|
Jun 25 | 27,826 | 29,639 |
|---|
Jun 24 | 23,598 | 25,384 |
|---|
Jun 23 | 19,552 | 21,021 |
|---|
Jun 22 | 16,283 | 17,645 |
|---|
Jun 21 | 19,425 | 20,504 |
|---|
Jun 20 | 13,776 | 14,680 |
|---|
Jun 19 | 13,412 | 14,197 |
|---|
Jun 18 | 13,128 | 13,276 |
|---|
Jun 17 | 11,802 | 11,886 |
|---|
Jun 16 | 10,000 | 10,000 |
|---|
|
| Average Annual Return [Table Text Block] |
Table Summary | 1 Year | 5 Years | 10 Years |
|---|
The Catholic SRI Growth Portfolio | 21.16% | 11.66% | 12.92% |
|---|
MSCI World Index | 21.81% | 11.98% | 13.70% |
|---|
|
| No Deduction of Taxes [Text Block] |
Performance results do not include the deduction of taxes that a shareholder would pay on fund distributions or redemptions of fund shares.
|
| AssetsNet |
$ 80,956,941
|
| Holdings Count | Holding |
1,160
|
| Advisory Fees Paid, Amount |
$ 70,148
|
| InvestmentCompanyPortfolioTurnover |
40.00%
|
| Additional Fund Statistics [Text Block] |
Table SummaryNet Assets | $80,956,941 |
|---|
Number of Portfolio Holdings | 1,160 |
|---|
Net Investment Advisory Fees | $70,148 |
|---|
Portfolio Turnover Rate | 40% |
|---|
|
| Holdings [Text Block] |
Table SummaryInvestments | Percent of Net Assets |
|---|
Information Technology | 33.9% | Financials | 17.8% | Industrials | 9.9% | Consumer Discretionary | 9.8% | Communication Services | 9.2% | Consumer Staples | 4.3% | Energy | 4.1% | Materials | 3.7% | Utilities | 3.0% | Health Care | 2.4% | Real Estate | 1.8% | Other Investments | 0.1% | |
| Material Fund Change [Text Block] |
There were no material fund changes during the reporting period. |
| Summary of Change Legend [Text Block] |
There were no material fund changes during the reporting period.
|
| C000025696 |
|
| Shareholder Report [Line Items] |
|
| Fund Name |
The International Equity Portfolio
|
| Trading Symbol |
HCIEX
|
| Annual or Semi-Annual Statement [Text Block] |
This annual shareholder report contains important information about The International Equity Portfolio for the period of July 1, 2025 to June 30, 2026.
|
| Additional Information Phone Number |
(800) 242-9596
|
| Additional Information Website |
www.hccapitalsolutions.com
|
| Expenses [Text Block] |
What were the Fund's costs for the last year? (based on a hypothetical $10,000 investment) Table SummaryFund Name | Costs of a $10,000
investment | Costs paid as a percentage of a
$10,000 investment |
|---|
The International Equity Portfolio | $19 | 0.17% |
|---|
|
| Expenses Paid, Amount |
$ 19
|
| Expense Ratio, Percent |
0.17%
|
| Factors Affecting Performance [Text Block] |
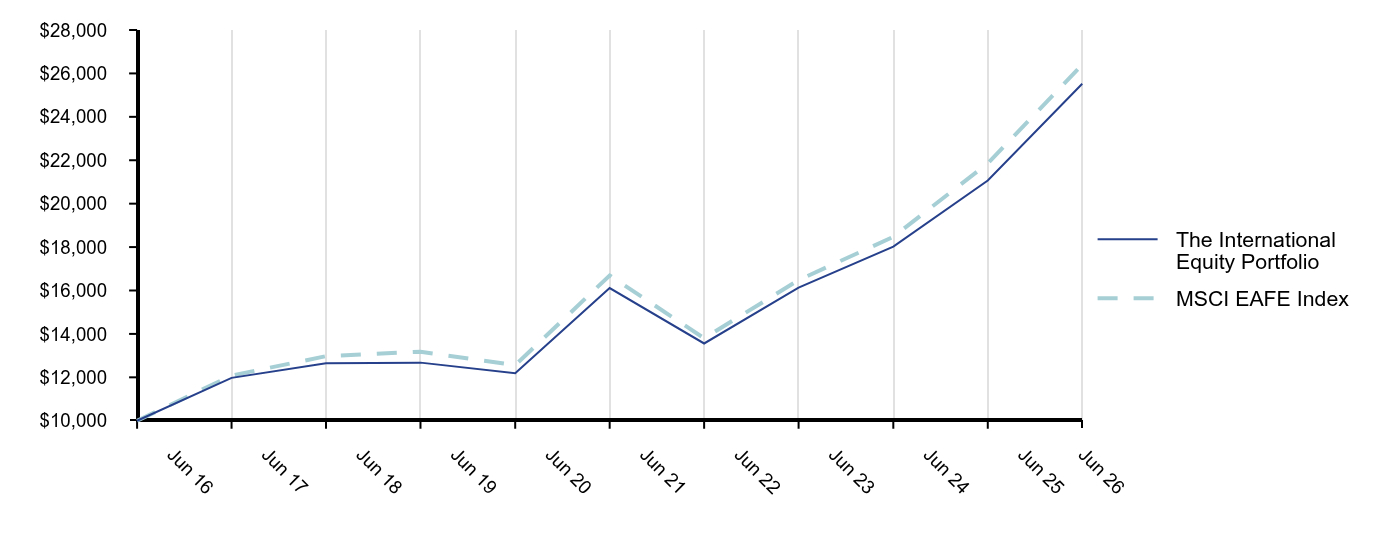
How did the Fund perform last year?The International Equity Portfolio (the “Portfolio”) managed by Parametric Portfolio Associates, LLC (“Parametric”) returned 21.19% for the fiscal year compared to 20.80% for the MSCI EAFE Index. The fiscal year ended June 30, 2026 was marked by strong international equity market performance despite heightened geopolitical uncertainty and higher interest rates. Both International Developed and Emerging Market Equities posted strong returns, supported by resilient corporate earnings, improving economic sentiment and continued investment in AI infrastructure, particularly across Taiwan and South Korea. The Portfolio outperformed the benchmark. The tax-managed strategy run by Parametric focuses on minimizing taxable gains subject to a tracking error constraint. The tracking error generated by tax minimization contributed to before-tax performance during the period. |
| Performance Past Does Not Indicate Future [Text] |
Past performance is not an indication of future results.
|
| Line Graph [Table Text Block] |
Table Summary | The International Equity Portfolio | MSCI EAFE Index |
|---|
Jun 26 | 25,527 | 26,404 |
|---|
Jun 25 | 21,064 | 21,857 |
|---|
Jun 24 | 18,022 | 18,471 |
|---|
Jun 23 | 16,136 | 16,478 |
|---|
Jun 22 | 13,559 | 13,800 |
|---|
Jun 21 | 16,113 | 16,694 |
|---|
Jun 20 | 12,193 | 12,559 |
|---|
Jun 19 | 12,677 | 13,182 |
|---|
Jun 18 | 12,646 | 12,974 |
|---|
Jun 17 | 11,975 | 12,083 |
|---|
Jun 16 | 10,000 | 10,000 |
|---|
|
| Average Annual Return [Table Text Block] |
Table Summary | 1 Year | 5 Years | 10 Years |
|---|
The International Equity Portfolio | 21.19% | 9.64% | 9.82% |
|---|
MSCI EAFE Index | 20.80% | 9.60% | 10.20% |
|---|
|
| No Deduction of Taxes [Text Block] |
Performance results do not include the deduction of taxes that a shareholder would pay on fund distributions or redemptions of fund shares.
|
| AssetsNet |
$ 714,103,355
|
| Holdings Count | Holding |
374
|
| Advisory Fees Paid, Amount |
$ 519,622
|
| InvestmentCompanyPortfolioTurnover |
13.00%
|
| Additional Fund Statistics [Text Block] |
Table SummaryNet Assets | $714,103,355 |
|---|
Number of Portfolio Holdings | 374 |
|---|
Net Investment Advisory Fees | $519,622 |
|---|
Portfolio Turnover Rate | 13% |
|---|
|
| Holdings [Text Block] |
Table SummaryInvestments | Percent of Net Assets |
|---|
Financials | 26.1% | Industrials | 16.8% | Information Technology | 12.2% | Health Care | 8.3% | Consumer Discretionary | 7.0% | Materials | 6.3% | Consumer Staples | 5.4% | Energy | 5.0% | Utilities | 3.4% | Communication Services | 3.2% | Investment Companies - International Equity | 2.9% | Other Investments | 2.4% | |
| Material Fund Change [Text Block] |
There were no material fund changes during the reporting period. |
| Summary of Change Legend [Text Block] |
There were no material fund changes during the reporting period.
|
| C000065218 |
|
| Shareholder Report [Line Items] |
|
| Fund Name |
The Institutional International Equity Portfolio
|
| Trading Symbol |
HCINX
|
| Annual or Semi-Annual Statement [Text Block] |
This annual shareholder report contains important information about The Institutional International Equity Portfolio for the period of July 1, 2025 to June 30, 2026.
|
| Additional Information Phone Number |
(800) 242-9596
|
| Additional Information Website |
www.hccapitalsolutions.com
|
| Expenses [Text Block] |
What were the Fund's costs for the last year? (based on a hypothetical $10,000 investment) Table SummaryFund Name | Costs of a $10,000
investment | Costs paid as a percentage of a
$10,000 investment |
|---|
The Institutional International Equity Portfolio | $25 | 0.23% |
|---|
|
| Expenses Paid, Amount |
$ 25
|
| Expense Ratio, Percent |
0.23%
|
| Factors Affecting Performance [Text Block] |
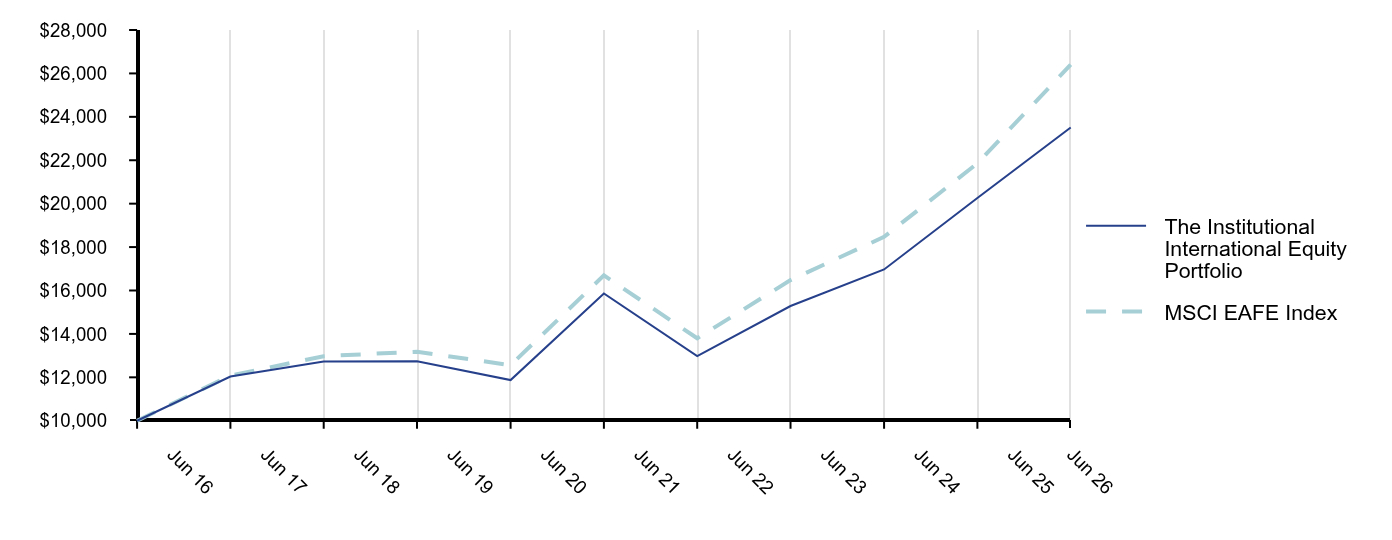
How did the Fund perform last year?The Institutional International Equity Portfolio (the “Institutional Portfolio”) managed by City of London Investment Management Company, Limited (“City of London”), Mellon Investments Corporation (“Mellon”) and Parametric returned 16.02% for the fiscal year compared to 20.80% for the MSCI EAFE Index. The fiscal year ended June 30, 2026, was marked by strong international equity market performance despite heightened geopolitical uncertainty and higher interest rates. Both International Developed and Emerging Market Equities posted strong returns, supported by resilient corporate earnings, improving economic sentiment and continued investment in AI infrastructure, particularly across Taiwan and South Korea. The Institutional Portfolio underperformed its benchmark. The majority of the assets are managed by Mellon and Parametric with a core mandate to provide passive exposure to the benchmark index (MSCI EAFE Index). Parametric underperformed due to its underweight to Japan equities. Within its Japan exposure, Parametric had a modest bias toward small cap stocks which detracted from relative performance. This allows the Portfolio to have cash on hand to meet redemptions and invest opportunistically. Mellon underperformed due to its bias towards low-volatility stocks. City of London underperformed due to an unfavorable environment for its closed-end fund strategy that seeks portfolio appreciation derived from a top-down macro process, bottom-up stock picking and a narrowing of the closed-end fund discount to net asset value. The Portfolios are diversified across multiple managers and strategies, with the goal of providing superior long-term returns in as stable and consistent a manner as possible. As a result, some managers and styles will periodically lead or lag, and the Portfolio expects performance to reflect this style cyclicality. |
| Performance Past Does Not Indicate Future [Text] |
Past performance is not an indication of future results.
|
| Line Graph [Table Text Block] |
Table Summary | The Institutional International Equity Portfolio | MSCI EAFE Index |
|---|
Jun 26 | 23,507 | 26,404 |
|---|
Jun 25 | 20,261 | 21,857 |
|---|
Jun 24 | 16,969 | 18,471 |
|---|
Jun 23 | 15,285 | 16,478 |
|---|
Jun 22 | 12,980 | 13,800 |
|---|
Jun 21 | 15,860 | 16,694 |
|---|
Jun 20 | 11,874 | 12,559 |
|---|
Jun 19 | 12,744 | 13,182 |
|---|
Jun 18 | 12,733 | 12,974 |
|---|
Jun 17 | 12,038 | 12,083 |
|---|
Jun 16 | 10,000 | 10,000 |
|---|
|
| Average Annual Return [Table Text Block] |
Table Summary | 1 Year | 5 Years | 10 Years |
|---|
The Institutional International Equity Portfolio | 16.02% | 8.19% | 8.92% |
|---|
MSCI EAFE Index | 20.80% | 9.60% | 10.20% |
|---|
|
| No Deduction of Taxes [Text Block] |
Performance results do not include the deduction of taxes that a shareholder would pay on fund distributions or redemptions of fund shares.
|
| AssetsNet |
$ 1,262,721,045
|
| Holdings Count | Holding |
847
|
| Advisory Fees Paid, Amount |
$ 1,694,720
|
| InvestmentCompanyPortfolioTurnover |
54.00%
|
| Additional Fund Statistics [Text Block] |
Table SummaryNet Assets | $1,262,721,045 |
|---|
Number of Portfolio Holdings | 847 |
|---|
Net Investment Advisory Fees | $1,694,720 |
|---|
Portfolio Turnover Rate | 54% |
|---|
|
| Holdings [Text Block] |
Table SummaryInvestments | Percent of Net Assets |
|---|
Investment Companies - International Equity | 34.9% | Investment Companies - Money Market Funds | 18.3% | Industrials | 9.0% | Financials | 8.7% | Consumer Discretionary | 5.3% | Health Care | 5.1% | Information Technology | 5.0% | Consumer Staples | 3.4% | Materials | 2.5% | Utilities | 2.1% | Communication Services | 1.7% | Other Investments | 1.9% | |
| Material Fund Change [Text Block] |
There were no material fund changes during the reporting period. |
| Summary of Change Legend [Text Block] |
There were no material fund changes during the reporting period.
|
| C000065289 |
|
| Shareholder Report [Line Items] |
|
| Fund Name |
The Emerging Markets Portfolio
|
| Trading Symbol |
HCEMX
|
| Additional Information Phone Number |
(800) 242-9596
|
| Additional Information Website |
www.hccapitalsolutions.com
|
| Expenses [Text Block] |
What were the Fund's costs for the last year? (based on a hypothetical $10,000 investment) Table SummaryFund Name | Costs of a $10,000
investment | Costs paid as a percentage of a
$10,000 investment |
|---|
The Emerging Markets Portfolio | $49 | 0.40% |
|---|
|
| Expenses Paid, Amount |
$ 49
|
| Expense Ratio, Percent |
0.40%
|
| Factors Affecting Performance [Text Block] |
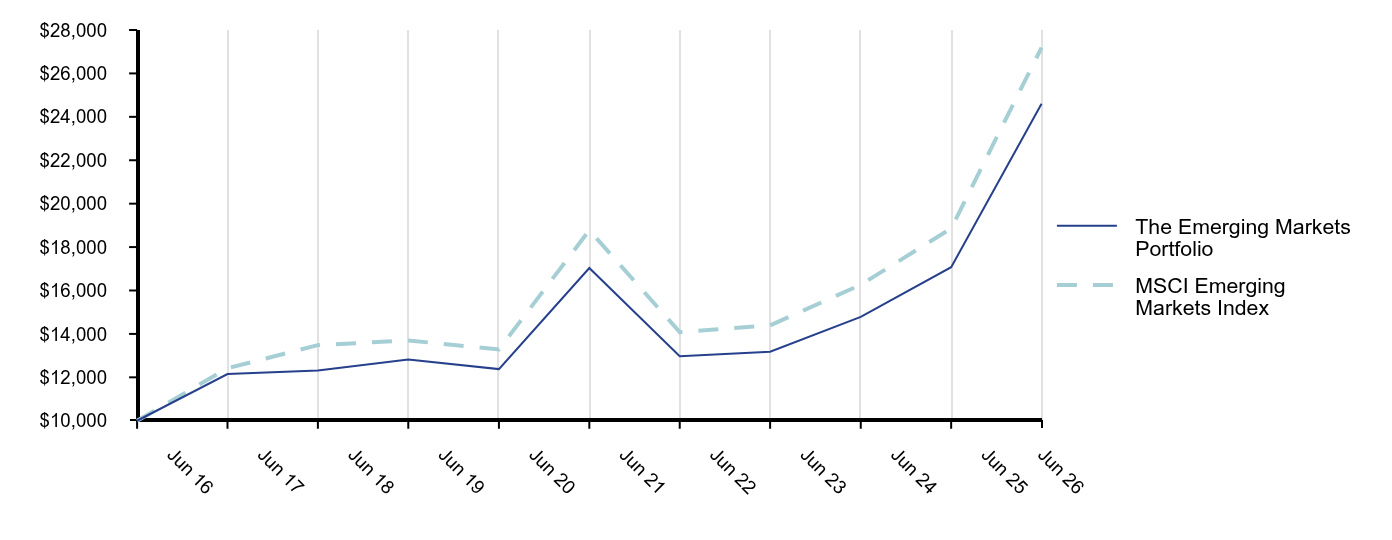
How did the Fund perform last year?The Emerging Markets Portfolio (the “Portfolio”) managed by City of London Investment Management Company, Limited (“City of London”), Mellon Investments Corporation (“Mellon”) and Parametric Portfolio Associates, LLC (“Parametric”) returned 44.13% for the fiscal year compared to 44.18% for the MSCI Emerging Markets Index. The fiscal year ended June 30, 2026 was marked by strong equity market performance despite heightened geopolitical uncertainty and higher interest rates. Emerging Market Equities posted exceptional returns, driven by robust earnings growth and sustained demand for semiconductors and AI infrastructure, particularly across Taiwan and South Korea. In fiscal year 2026, the Portfolio modestly underperformed the benchmark. The allocation to City of London contributed positively, aided by favorable conditions for its closed-end fund strategy. Parametric underperformed due to its exposure to onshore China equities. The Portfolio provides broad access to international emerging markets equity. Managed with multiple managers to provide diversification of manager style as well as diversification of firm specific risks. Mellon’s strategy provides passive exposure to the MSCI Emerging Markets Index. The Portfolio diversifies amongst a large number of names and across geographies and sectors. Parametric replicates benchmark index (MSCI Emerging Markets Index) using futures. This allows the Portfolio to have cash on hand to meet redemptions and invest opportunistically. |
| Performance Past Does Not Indicate Future [Text] |
Past performance is not an indication of future results.
|
| Line Graph [Table Text Block] |
Table Summary | The Emerging Markets Portfolio | MSCI Emerging Markets Index |
|---|
Jun 26 | 24,605 | 27,192 |
|---|
Jun 25 | 17,071 | 18,859 |
|---|
Jun 24 | 14,786 | 16,262 |
|---|
Jun 23 | 13,180 | 14,395 |
|---|
Jun 22 | 12,969 | 14,083 |
|---|
Jun 21 | 17,035 | 18,776 |
|---|
Jun 20 | 12,379 | 13,283 |
|---|
Jun 19 | 12,820 | 13,700 |
|---|
Jun 18 | 12,313 | 13,484 |
|---|
Jun 17 | 12,151 | 12,417 |
|---|
Jun 16 | 10,000 | 10,000 |
|---|
|
| Average Annual Return [Table Text Block] |
Table Summary | 1 Year | 5 Years | 10 Years |
|---|
The Emerging Markets Portfolio | 44.13% | 7.63% | 9.42% |
|---|
MSCI Emerging Markets Index | 44.18% | 7.69% | 10.52% |
|---|
|
| No Deduction of Taxes [Text Block] |
Performance results do not include the deduction of taxes that a shareholder would pay on fund distributions or redemptions of fund shares.
|
| AssetsNet |
$ 860,221,794
|
| Holdings Count | Holding |
922
|
| Advisory Fees Paid, Amount |
$ 1,817,414
|
| InvestmentCompanyPortfolioTurnover |
14.00%
|
| Additional Fund Statistics [Text Block] |
Table SummaryNet Assets | $860,221,794 |
|---|
Number of Portfolio Holdings | 922 |
|---|
Net Investment Advisory Fees | $1,817,414 |
|---|
Portfolio Turnover Rate | 14% |
|---|
|
| Holdings [Text Block] |
Table SummaryInvestments | Percent of Net Assets |
|---|
Investment Companies - International Equity | 29.9% | Information Technology | 29.6% | Financials | 11.7% | Communication Services | 6.0% | Consumer Discretionary | 5.0% | Industrials | 4.8% | Materials | 3.5% | Investment Companies - Money Market Funds | 2.0% | Energy | 2.0% | Consumer Staples | 1.7% | Health Care | 1.5% | Other Investments | 2.0% | |
| Material Fund Change [Text Block] |
There were no material fund changes during the reporting period. |
| Summary of Change Legend [Text Block] |
There were no material fund changes during the reporting period.
|
| C000025697 |
|
| Shareholder Report [Line Items] |
|
| Fund Name |
The Core Fixed Income Portfolio
|
| Trading Symbol |
HCIIX
|
| Annual or Semi-Annual Statement [Text Block] |
This annual shareholder report contains important information about The Core Fixed Income Portfolio for the period of July 1, 2025 to June 30, 2026.
|
| Material Fund Change Notice [Text Block] |
Effective October 10, 2025, the Portfolio implemented a 1-for-5 reverse stock split.
Effective January 23, 2026, This fund acquired U.S. Government Fixed Income Securities Portfolio, The U.S. Corporate Fixed Income Securities Portfolio and The U.S. Mortgage/Asset Backed Fixed Income Securities Portfolio as a result of a merger.
|
| Additional Information Phone Number |
(800) 242-9596
|
| Additional Information Website |
www.hccapitalsolutions.com
|
| Expenses [Text Block] |
What were the Fund's costs for the last year? (based on a hypothetical $10,000 investment) Table SummaryFund Name | Costs of a $10,000
investment | Costs paid as a percentage of a
$10,000 investment |
|---|
The Core Fixed Income Portfolio | $14 | 0.14% |
|---|
|
| Expenses Paid, Amount |
$ 14
|
| Expense Ratio, Percent |
0.14%
|
| Factors Affecting Performance [Text Block] |
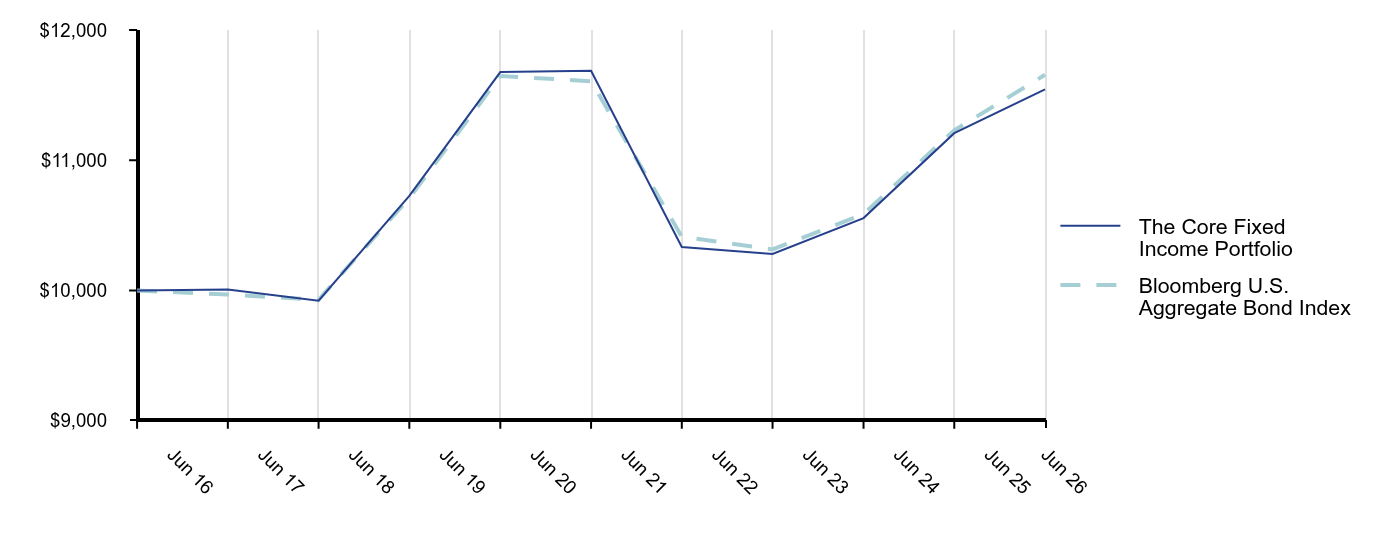
How did the Fund perform last year?The Core Fixed Income Portfolio (the “Portfolio”) managed by Agincourt Capital Management, LLC (“Agincourt”) and Mellon Investments Corporation returned 3.00% for the fiscal year compared to 3.79% for the Bloomberg U.S. Aggregate Bond Index (“Bar Cap”). Bond markets experienced heightened volatility during the year as resilient economic growth, persistent inflation concerns and geopolitical uncertainty caused investors to reassess the path of interest rates. Treasury yields moved higher for much of the year as expectations shifted toward a higher-for-longer rate environment, weighing on longer-duration bonds. Despite these headwinds, higher starting yields continued to provide attractive income, and core fixed income delivered modest positive returns while maintaining its role as a source of portfolio diversification. The Portfolio underperformed the benchmark. A reduced allocation to spread sectors, including corporate and securitized credit, detracted from performance. The Portfolio is allocated across the three major Bar Cap Index sectors: governments, credit and asset-backed securities. Government and asset-backed sectors are passively managed to track their benchmarks, with slight variances due to cash flows and representative holdings. The credit portfolio characteristics, such as duration, yield and credit quality, remain aligned with the benchmark. |
| Performance Past Does Not Indicate Future [Text] |
Past performance is not an indication of future results.
|
| Line Graph [Table Text Block] |
Table Summary | The Core Fixed Income Portfolio | Bloomberg U.S. Aggregate Bond Index |
|---|
Jun 26 | 11,544 | 11,656 |
|---|
Jun 25 | 11,208 | 11,230 |
|---|
Jun 24 | 10,556 | 10,587 |
|---|
Jun 23 | 10,281 | 10,315 |
|---|
Jun 22 | 10,334 | 10,413 |
|---|
Jun 21 | 11,687 | 11,607 |
|---|
Jun 20 | 11,677 | 11,646 |
|---|
Jun 19 | 10,727 | 10,710 |
|---|
Jun 18 | 9,922 | 9,929 |
|---|
Jun 17 | 10,007 | 9,969 |
|---|
Jun 16 | 10,000 | 10,000 |
|---|
|
| Average Annual Return [Table Text Block] |
Table Summary | 1 Year | 5 Years | 10 Years |
|---|
The Core Fixed Income Portfolio | 3.00% | -0.25% | 1.45% |
|---|
Bloomberg U.S. Aggregate Bond Index | 3.79% | 0.08% | 1.54% |
|---|
|
| No Deduction of Taxes [Text Block] |
Performance results do not include the deduction of taxes that a shareholder would pay on fund distributions or redemptions of fund shares.
|
| AssetsNet |
$ 2,110,750,209
|
| Holdings Count | Holding |
2,486
|
| Advisory Fees Paid, Amount |
$ 430,097
|
| InvestmentCompanyPortfolioTurnover |
23.00%
|
| Additional Fund Statistics [Text Block] |
Table SummaryNet Assets | $2,110,750,209 |
|---|
Number of Portfolio Holdings | 2,486 |
|---|
Net Investment Advisory Fees | $430,097 |
|---|
Portfolio Turnover Rate | 23% |
|---|
|
| Holdings [Text Block] |
Table SummaryInvestments | Percent of Net Assets |
|---|
U.S. Treasury Obligations | 37.4% | Investment Companies - Domestic Fixed Income | 26.6% | Investment Companies - Money Market Funds | 11.4% | U.S. Government Agency Mortgages | 10.2% | Financials | 4.8% | Communication Services | 1.4% | Utilities | 1.4% | Health Care | 1.1% | Information Technology | 0.9% | Industrials | 0.9% | Energy | 0.9% | Other Investments | 3.6% | |
| Material Fund Change [Text Block] |
This is a summary of certain changes of the Portfolio since July 1, 2025. More complete information can be found in the Fund's current prospectus. Effective October 10, 2025, the Portfolio implemented a 1-for-5 reverse stock split.
Effective January 23, 2026, This fund acquired U.S. Government Fixed Income Securities Portfolio, The U.S. Corporate Fixed Income Securities Portfolio and The U.S. Mortgage/Asset Backed Fixed Income Securities Portfolio as a result of a merger.
|
| Summary of Change Legend [Text Block] |
This is a summary of certain changes of the Portfolio since July 1, 2025. More complete information can be found in the Fund's current prospectus.
|
| C000025698 |
|
| Shareholder Report [Line Items] |
|
| Fund Name |
The Corporate Opportunities Portfolio
|
| Trading Symbol |
HCHYX
|
| Additional Information Phone Number |
(800) 242-9596
|
| Additional Information Website |
www.hccapitalsolutions.com
|
| Expenses [Text Block] |
What were the Fund's costs for the last year? (based on a hypothetical $10,000 investment) Table SummaryFund Name | Costs of a $10,000
investment | Costs paid as a percentage of a
$10,000 investment |
|---|
The Corporate Opportunities Portfolio | $26 | 0.25% |
|---|
|
| Expenses Paid, Amount |
$ 26
|
| Expense Ratio, Percent |
0.25%
|
| Factors Affecting Performance [Text Block] |
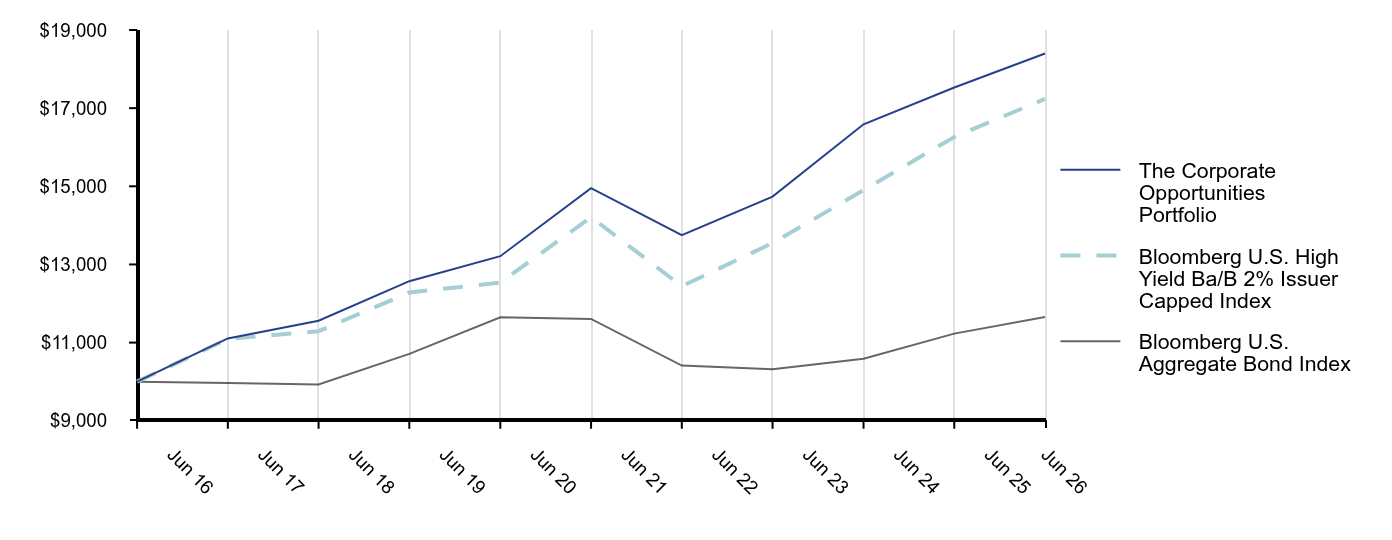
How did the Fund perform last year?The Corporate Opportunities Portfolio (the “Portfolio”) managed by City of London Investment Management Company, Limited (“City of London”) and Parametric Portfolio Associates, LLC (“Parametric”) returned 4.97% for the fiscal year compared to 5.99% for the Bloomberg U.S. High Yield Ba/B 2% Issuer Capped Index and 3.79% for the U.S. Aggregate Bond Index. The Portfolio underperformed the benchmark due to the Parametric strategy which seeks to both replicate the risk profile of the benchmark while providing protection from widening credit spreads. Parametric manages a portfolio of futures contracts that reflects the underlying risks of the asset class as well as credit default swap index contracts. During the fiscal year, high yield credit spreads remained historically tight despite periodic market volatility, creating a challenging environment for strategies that benefited from wider spreads and serving as the principal driver of under-performance. Parametric uses a mix of equity and fixed income futures that replicate the risk profile of the benchmark. A component of the equity mix at Parametric was replaced with City of London's equity strategy which underperformed the MSCI USA Index due to security selection and a widening of the discounts among the closed-end funds it held. City of London attempts to deliver excess returns through its top-down macro process, bottom-up stock picking and a narrowing of the closed-end fund discount to net asset value. |
| Performance Past Does Not Indicate Future [Text] |
Past performance is not an indication of future results.
|
| Line Graph [Table Text Block] |
Table Summary | The Corporate Opportunities Portfolio | Bloomberg U.S. High Yield Ba/B 2% Issuer Capped Index | Bloomberg U.S. Aggregate Bond Index |
|---|
Jun 26 | 18,398 | 17,237 | 11,656 |
|---|
Jun 25 | 17,527 | 16,263 | 11,230 |
|---|
Jun 24 | 16,586 | 14,902 | 10,587 |
|---|
Jun 23 | 14,735 | 13,546 | 10,315 |
|---|
Jun 22 | 13,751 | 12,443 | 10,413 |
|---|
Jun 21 | 14,951 | 14,211 | 11,607 |
|---|
Jun 20 | 13,211 | 12,535 | 11,646 |
|---|
Jun 19 | 12,572 | 12,282 | 10,710 |
|---|
Jun 18 | 11,558 | 11,292 | 9,929 |
|---|
Jun 17 | 11,107 | 11,092 | 9,969 |
|---|
Jun 16 | 10,000 | 10,000 | 10,000 |
|---|
|
| Average Annual Return [Table Text Block] |
Table Summary | 1 Year | 5 Years | 10 Years |
|---|
The Corporate Opportunities Portfolio | 4.97% | 4.24% | 6.29% |
|---|
Bloomberg U.S. High Yield Ba/B 2% Issuer Capped Index | 5.99% | 3.94% | 5.60% |
|---|
Bloomberg U.S. Aggregate Bond Index | 3.79% | 0.08% | 1.54% |
|---|
|
| No Deduction of Taxes [Text Block] |
Performance results do not include the deduction of taxes that a shareholder would pay on fund distributions or redemptions of fund shares.
|
| AssetsNet |
$ 206,101,153
|
| Holdings Count | Holding |
26
|
| Advisory Fees Paid, Amount |
$ 288,858
|
| InvestmentCompanyPortfolioTurnover |
17.00%
|
| Additional Fund Statistics [Text Block] |
Table SummaryNet Assets | $206,101,153 |
|---|
Number of Portfolio Holdings | 26 |
|---|
Net Investment Advisory Fees | $288,858 |
|---|
Portfolio Turnover Rate | 17% |
|---|
|
| Holdings [Text Block] |
Table SummaryInvestments | Percent of Net Assets |
|---|
Investment Companies - Money Market Funds | 71.0% | Investment Companies - Domestic Equity | 14.2% | Investment Companies - International Equity | 10.9% | Financials | 0.8% | Futures | 0.7% | Credit Default Swap | -2.9% | |
| Material Fund Change [Text Block] |
There were no material fund changes during the reporting period. |
| Summary of Change Legend [Text Block] |
There were no material fund changes during the reporting period.
|
| C000025699 |
|
| Shareholder Report [Line Items] |
|
| Fund Name |
The Short-Term Municipal Bond Portfolio
|
| Trading Symbol |
HCSBX
|
| Annual or Semi-Annual Statement [Text Block] |
This annual shareholder report contains important information about The Short-Term Municipal Bond Portfolio for the period of July 1, 2025 to June 30, 2026.
|
| Additional Information Phone Number |
(800) 242-9596
|
| Additional Information Website |
www.hccapitalsolutions.com
|
| Expenses [Text Block] |
What were the Fund's costs for the last year? (based on a hypothetical $10,000 investment) Table SummaryFund Name | Costs of a $10,000
investment | Costs paid as a percentage of a
$10,000 investment |
|---|
The Short-Term Municipal Bond Portfolio | $30 | 0.30% |
|---|
|
| Expenses Paid, Amount |
$ 30
|
| Expense Ratio, Percent |
0.30%
|
| Factors Affecting Performance [Text Block] |
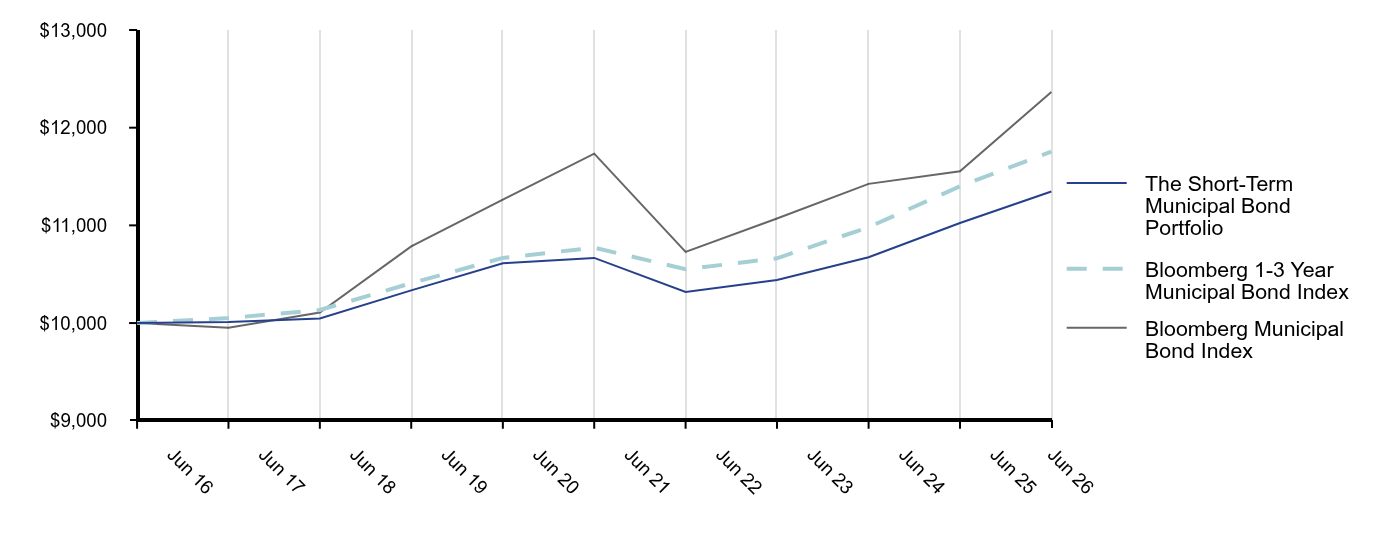
How did the Fund perform last year?The Short-Term Municipal Bond Portfolio (the “Portfolio”) managed by Breckinridge Capital Advisors, Inc. returned 2.93% for the fiscal year compared to 3.10% for the Bloomberg 1-3 Year Municipal Bond Index and 7.03% for the Bloomberg Municipal Bond Index. Bond markets experienced heightened volatility during the year as resilient economic growth, persistent inflation concerns and geopolitical uncertainty reinforced expectations for a higher-for-longer interest rate environment. The portfolio underperformed its benchmark, largely due to a longer duration position. Additionally, fees and expenses further detracted from relative performance. |
| Performance Past Does Not Indicate Future [Text] |
Past performance is not an indication of future results.
|
| Line Graph [Table Text Block] |
Table Summary | The Short-Term Municipal Bond Portfolio | Bloomberg 1-3 Year Municipal Bond Index | Bloomberg Municipal Bond Index |
|---|
Jun 26 | 11,347 | 11,754 | 12,365 |
|---|
Jun 25 | 11,024 | 11,400 | 11,553 |
|---|
Jun 24 | 10,674 | 10,981 | 11,425 |
|---|
Jun 23 | 10,441 | 10,663 | 11,070 |
|---|
Jun 22 | 10,318 | 10,551 | 10,728 |
|---|
Jun 21 | 10,667 | 10,772 | 11,734 |
|---|
Jun 20 | 10,613 | 10,667 | 11,264 |
|---|
Jun 19 | 10,335 | 10,408 | 10,785 |
|---|
Jun 18 | 10,046 | 10,134 | 10,107 |
|---|
Jun 17 | 10,012 | 10,051 | 9,951 |
|---|
Jun 16 | 10,000 | 10,000 | 10,000 |
|---|
|
| Average Annual Return [Table Text Block] |
Table Summary | 1 Year | 5 Years | 10 Years |
|---|
The Short-Term Municipal Bond Portfolio | 2.93% | 1.24% | 1.27% |
|---|
Bloomberg 1-3 Year Municipal Bond Index | 3.10% | 1.76% | 1.63% |
|---|
Bloomberg Municipal Bond Index | 7.03% | 1.05% | 2.15% |
|---|
|
| No Deduction of Taxes [Text Block] |
Performance results do not include the deduction of taxes that a shareholder would pay on fund distributions or redemptions of fund shares.
|
| AssetsNet |
$ 64,768,386
|
| Holdings Count | Holding |
47
|
| Advisory Fees Paid, Amount |
$ 85,483
|
| InvestmentCompanyPortfolioTurnover |
34.00%
|
| Additional Fund Statistics [Text Block] |
Table SummaryNet Assets | $64,768,386 |
|---|
Number of Portfolio Holdings | 47 |
|---|
Net Investment Advisory Fees | $85,483 |
|---|
Portfolio Turnover Rate | 34% |
|---|
|
| Holdings [Text Block] |
Table SummaryInvestments | Percent of Net Assets |
|---|
General Obligation | 49.7% | Revenue Bonds | 47.7% | Investment Companies - Money Market Funds | 3.7% | |
| Material Fund Change [Text Block] |
There were no material fund changes during the reporting period. |
| Summary of Change Legend [Text Block] |
There were no material fund changes during the reporting period.
|
| C000025691 |
|
| Shareholder Report [Line Items] |
|
| Fund Name |
The Intermediate Term Municipal Bond Portfolio
|
| Trading Symbol |
HCIMX
|
| Annual or Semi-Annual Statement [Text Block] |
This annual shareholder report contains important information about The Intermediate Term Municipal Bond Portfolio for the period of July 1, 2025 to June 30, 2026.
|
| Additional Information Phone Number |
(800) 242-9596
|
| Additional Information Website |
www.hccapitalsolutions.com
|
| Expenses [Text Block] |
What were the Fund's costs for the last year? (based on a hypothetical $10,000 investment) Table SummaryFund Name | Costs of a $10,000
investment | Costs paid as a percentage of a
$10,000 investment |
|---|
The Intermediate Term Municipal Bond Portfolio | $26 | 0.25% |
|---|
|
| Expenses Paid, Amount |
$ 26
|
| Expense Ratio, Percent |
0.25%
|
| Factors Affecting Performance [Text Block] |
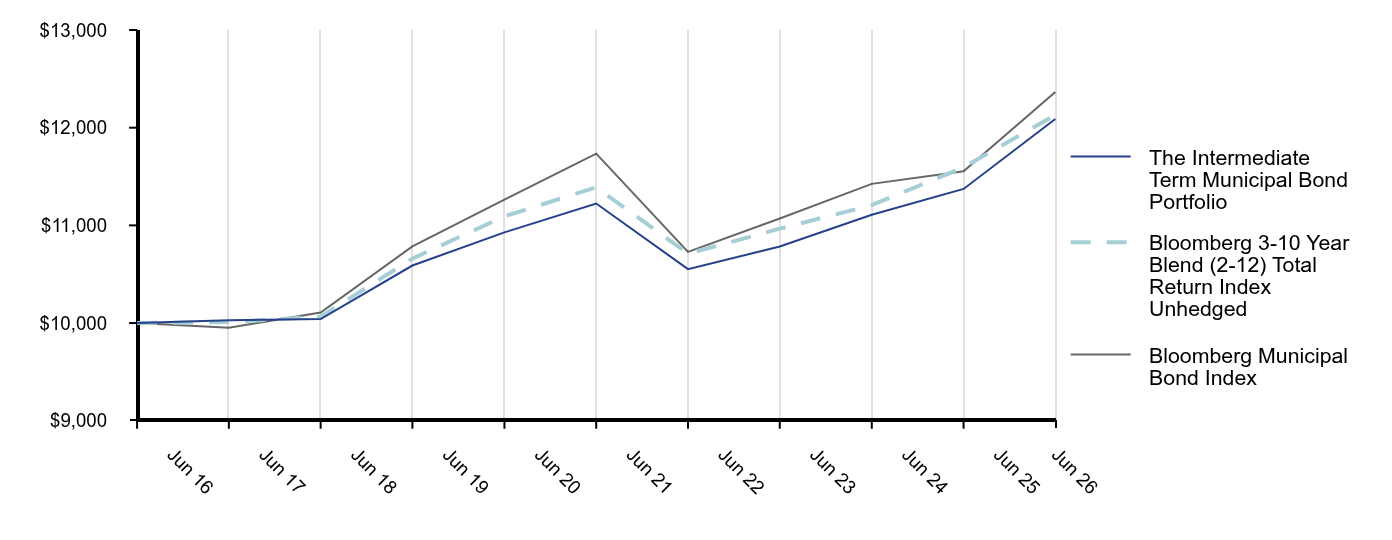
How did the Fund perform last year?The Intermediate Term Municipal Bond Portfolio managed by Insight North America LLC (“Insight”) returned 6.29% for the fiscal year compared to 4.63% for the Bloomberg 3-10 Year Blend (2-12) Total Return Index Unhedged and 7.03% for the Bloomberg Municipal Bond Index. Bond markets experienced heightened volatility during the year as resilient economic growth, persistent inflation concerns and geopolitical uncertainty reinforced expectations for a higher-for-longer interest rate environment. Treasury yields moved higher for much of the year, weighing on longer-duration bonds. The portfolio outperformed its benchmark during the twelve-month reporting period. An allocation to closed-end funds managed by City of London contributed positively to performance. |
| Performance Past Does Not Indicate Future [Text] |
Past performance is not an indication of future results.
|
| Line Graph [Table Text Block] |
Table Summary | The Intermediate Term Municipal Bond Portfolio | Bloomberg 3-10 Year Blend (2-12) Total Return Index Unhedged | Bloomberg Municipal Bond Index |
|---|
Jun 26 | 12,089 | 12,131 | 12,365 |
|---|
Jun 25 | 11,373 | 11,594 | 11,553 |
|---|
Jun 24 | 11,108 | 11,207 | 11,425 |
|---|
Jun 23 | 10,784 | 10,966 | 11,070 |
|---|
Jun 22 | 10,552 | 10,711 | 10,728 |
|---|
Jun 21 | 11,224 | 11,389 | 11,734 |
|---|
Jun 20 | 10,928 | 11,093 | 11,264 |
|---|
Jun 19 | 10,589 | 10,660 | 10,785 |
|---|
Jun 18 | 10,041 | 10,065 | 10,107 |
|---|
Jun 17 | 10,028 | 10,010 | 9,951 |
|---|
Jun 16 | 10,000 | 10,000 | 10,000 |
|---|
|
| Average Annual Return [Table Text Block] |
Table Summary | 1 Year | 5 Years | 10 Years |
|---|
The Intermediate Term Municipal Bond Portfolio | 6.29% | 1.50% | 1.91% |
|---|
Bloomberg 3-10 Year Blend (2-12) Total Return Index Unhedged | 4.63% | 1.27% | 1.95% |
|---|
Bloomberg Municipal Bond Index | 7.03% | 1.05% | 2.15% |
|---|
|
| No Deduction of Taxes [Text Block] |
Performance results do not include the deduction of taxes that a shareholder would pay on fund distributions or redemptions of fund shares.
|
| AssetsNet |
$ 566,878,909
|
| Holdings Count | Holding |
279
|
| Advisory Fees Paid, Amount |
$ 949,896
|
| InvestmentCompanyPortfolioTurnover |
19.00%
|
| Additional Fund Statistics [Text Block] |
Table SummaryNet Assets | $566,878,909 |
|---|
Number of Portfolio Holdings | 279 |
|---|
Net Investment Advisory Fees | $949,896 |
|---|
Portfolio Turnover Rate | 19% |
|---|
|
| Holdings [Text Block] |
Table SummaryInvestments | Percent of Net Assets |
|---|
Revenue Bonds | 64.3% | General Obligation | 15.9% | Investment Companies - Domestic Fixed Income | 12.4% | Certificates of Participation | 3.4% | Investment Companies - Money Market Funds | 1.7% | Special Tax | 0.4% | Tax Allocation | 0.4% | |
| Material Fund Change [Text Block] |
There were no material fund changes during the reporting period. |
| Summary of Change Legend [Text Block] |
There were no material fund changes during the reporting period.
|