Shareholder Report
Jun. 30, 2026
USD ($)
holding
Jun. 30, 2026
USD ($)
holding
Jun. 30, 2026
USD ($)
holding
Jun. 30, 2026
USD ($)
holding
Jun. 30, 2026
USD ($)
holding
Jun. 30, 2026
USD ($)
holding
Jun. 30, 2026
USD ($)
holding
Jun. 30, 2026
USD ($)
holding
This annual shareholder report contains important information about the Strive 1000 Dividend Growth ETF (the “Fund”) for the period of July 1, 2025 to June 30, 2026 (the “Period”). You can find additional information about the Fund at https://www.strivefunds.com/stxd. You can also request this information by contacting us at (215) 330-4476. For information regarding your Fund shares or account, including account balances, transactions, or distributions, please contact your financial intermediary. | |||||||||||
Availability of Additional Information
For additional information about the Fund, including its prospectus, financial information, holdings, and proxy information, visit https://www.strivefunds.com/stxd. You can also request information by calling (215) 330-4476.
Householding
Householding is an option available to certain investors of the Fund. Householding is a method of delivery, based on the preference of the individual investor, in which a single copy of certain shareholder documents can be delivered to investors who share the same address, even if their accounts are registered under different names. Householding for the Fund is available through certain broker-dealers. If you are interested in enrolling in householding and receiving a single copy of prospectuses and other shareholder documents or you are currently enrolled in householding and wish to change your householding status, please contact your broker-dealer.
| WHAT WERE THE FUND COSTS FOR THE PERIOD? (based on a hypothetical $10,000 investment) | |||||||||||
| COST OF $10,000 INVESTMENT | COST PAID AS A PERCENTAGE OF $10,000 INVESTMENT | ||||||||||
| $38 | 0.35% | ||||||||||
| WHAT FACTORS INFLUENCED PERFORMANCE FOR THE PERIOD? | |||||||||||
| HOW DID THE FUND PERFORM FOR THE PERIOD? | |||||||||||
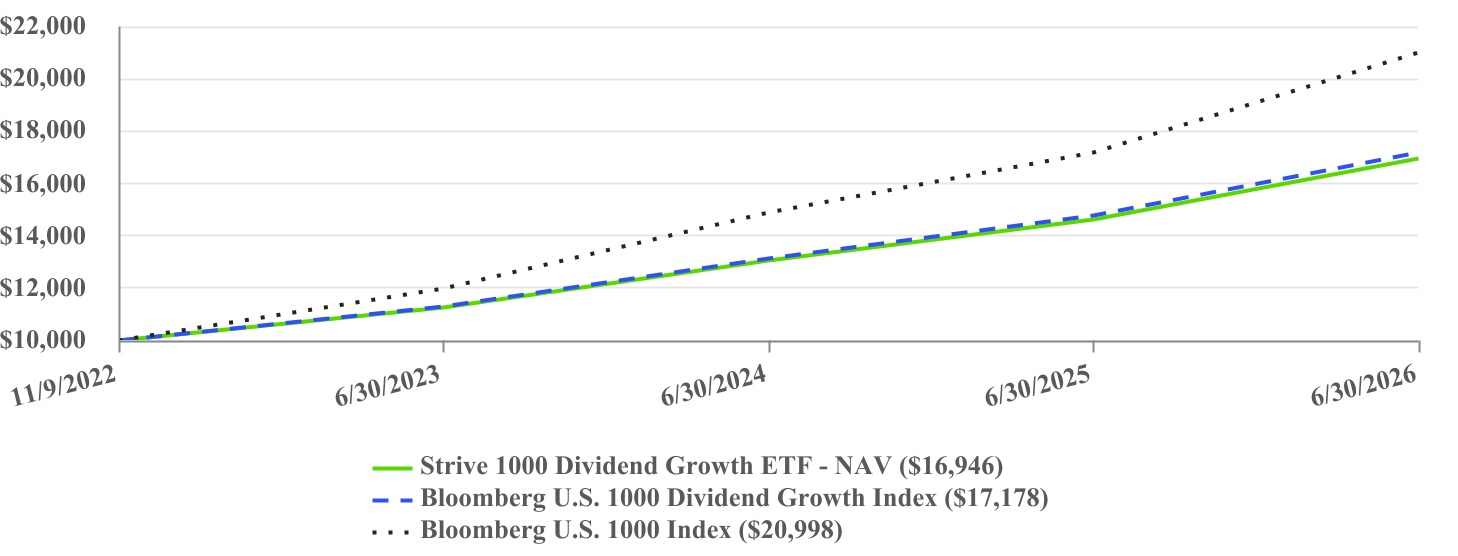
| PERFORMANCE | ||||||||||||||
| One Year | Since Inception (11/9/2022) | |||||||||||||
| Strive 1000 Dividend Growth ETF - NAV | 15.90% | 15.60% | ||||||||||||
| Bloomberg U.S. 1000 Dividend Growth Index | 16.33% | 16.03% | ||||||||||||
| Bloomberg U.S. 1000 Index | 22.43% | 22.62% | ||||||||||||
The Fund’s past performance is not a good predictor of how the Fund will perform in the future. The graph and table do not reflect the deduction of taxes that a shareholder would pay on Fund distributions or redemption of Fund shares. | ||||||||||||||
Visit https://www.strivefunds.com/stxd for more recent performance information. | ||||||||||||||
KEY FUND STATISTICS (as of Period End) | ||||||||||||||||||||
Net Assets | $67,194,812 | Portfolio Turnover Rate* | 27% | |||||||||||||||||
| # of Portfolio Holdings | 179 | Fund Advisory Fees Paid | $201,700 | |||||||||||||||||
| *Portfolio turnover is not annualized and is calculated without regard to short-term securities having a maturity of less than one year. Excludes impact of in-kind transactions. | ||||||||||||||||||||
| SECTOR WEIGHTING (as a % of Net Assets) | |||||
| Information Technology | 28.8% | ||||
| Financials | 22.9% | ||||
| Industrials | 16.1% | ||||
| Health Care | 12.7% | ||||
| Consumer Discretionary | 7.7% | ||||
| Consumer Staples | 3.5% | ||||
| Materials | 2.9% | ||||
| Real Estate | 2.9% | ||||
| Utilities | 2.1% | ||||
| Energy | 0.2% | ||||
| Communication Services | 0.1% | ||||
| Cash and Cash Equivalents | 0.1% | ||||
| TOP 10 HOLDINGS (as a % of Net Assets) | |||||
| Eli Lilly & Co. | 5.9% | ||||
| Broadcom, Inc. | 5.2% | ||||
| JPMorgan Chase & Co. | 5.0% | ||||
| Microsoft Corp. | 4.4% | ||||
| Visa, Inc. - Class A | 3.8% | ||||
| Applied Materials, Inc. | 3.8% | ||||
| Lam Research Corp. | 3.6% | ||||
| Mastercard, Inc. - Class A | 2.8% | ||||
| Costco Wholesale Corp. | 2.7% | ||||
| KLA Corp. | 2.6% | ||||
This annual shareholder report contains important information about the Strive 1000 Growth ETF (the “Fund”) for the period of July 1, 2025 to June 30, 2026 (the “Period”). You can find additional information about the Fund at https://www.strivefunds.com/stxg. You can also request this information by contacting us at (215) 330-4476. For information regarding your Fund shares or account, including account balances, transactions, or distributions, please contact your financial intermediary. | |||||||||||
Availability of Additional Information
For additional information about the Fund, including its prospectus, financial information, holdings, and proxy information, visit https://www.strivefunds.com/stxg. You can also request information by calling (215) 330-4476.
Householding
Householding is an option available to certain investors of the Fund. Householding is a method of delivery, based on the preference of the individual investor, in which a single copy of certain shareholder documents can be delivered to investors who share the same address, even if their accounts are registered under different names. Householding for the Fund is available through certain broker-dealers. If you are interested in enrolling in householding and receiving a single copy of prospectuses and other shareholder documents or you are currently enrolled in householding and wish to change your householding status, please contact your broker-dealer.
| WHAT WERE THE FUND COSTS FOR THE PERIOD? (based on a hypothetical $10,000 investment) | |||||||||||
| COST OF $10,000 INVESTMENT | COST PAID AS A PERCENTAGE OF $10,000 INVESTMENT | ||||||||||
| $20 | 0.18% | ||||||||||
| WHAT FACTORS INFLUENCED PERFORMANCE FOR THE PERIOD? | |||||||||||
| HOW DID THE FUND PERFORM FOR THE PERIOD? | |||||||||||
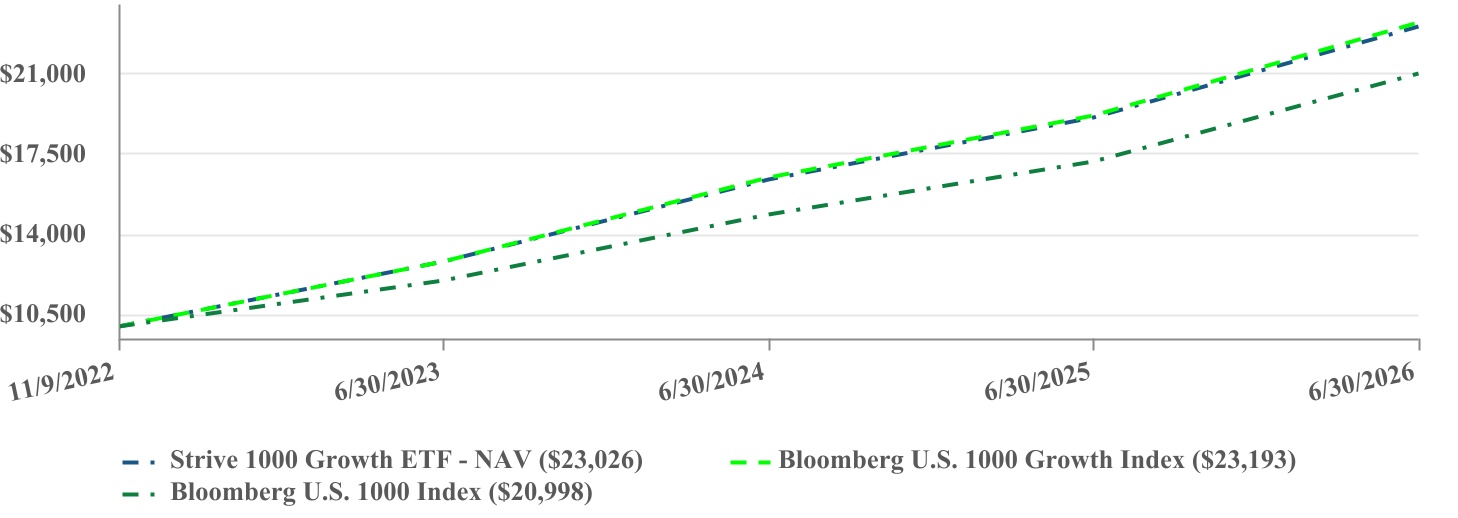
| PERFORMANCE | ||||||||||||||
| One Year | Since Inception (11/9/2022) | |||||||||||||
| Strive 1000 Growth ETF - NAV | 20.80% | 25.76% | ||||||||||||
| Bloomberg U.S. 1000 Growth Index | 21.04% | 26.01% | ||||||||||||
| Bloomberg U.S. 1000 Index | 22.43% | 22.62% | ||||||||||||
The Fund’s past performance is not a good predictor of how the Fund will perform in the future. The graph and table do not reflect the deduction of taxes that a shareholder would pay on Fund distributions or redemption of Fund shares. | ||||||||||||||
Visit https://www.strivefunds.com/stxg for more recent performance information. | ||||||||||||||
KEY FUND STATISTICS (as of Period End) | ||||||||||||||||||||
Net Assets | $149,139,052 | Portfolio Turnover Rate* | 10% | |||||||||||||||||
| # of Portfolio Holdings | 706 | Fund Advisory Fees Paid | $254,242 | |||||||||||||||||
*Portfolio turnover is not annualized and is calculated without regard to short-term securities having a maturity of less than one year. Excludes impact of in-kind transactions. | ||||||||||||||||||||
| SECTOR WEIGHTING (as a % of Net Assets) | |||||
| Information Technology | 44.8% | ||||
| Communication Services | 11.3% | ||||
| Consumer Discretionary | 11.2% | ||||
| Industrials | 10.7% | ||||
| Financials | 7.8% | ||||
| Health Care | 6.5% | ||||
| Consumer Staples | 3.3% | ||||
| Real Estate | 1.7% | ||||
| Materials | 1.5% | ||||
| Utilities | 0.7% | ||||
| Energy | 0.5% | ||||
| TOP 10 HOLDINGS (as a % of Net Assets) | |||||
| NVIDIA Corp. | 9.1% | ||||
| Apple, Inc. | 8.1% | ||||
| Microsoft Corp. | 5.4% | ||||
| Amazon.com, Inc. | 4.5% | ||||
| Alphabet, Inc. - Class A | 4.0% | ||||
| Broadcom, Inc. | 3.4% | ||||
| Alphabet, Inc. - Class C | 3.2% | ||||
| Tesla, Inc. | 2.7% | ||||
| Meta Platforms, Inc. - Class A | 2.4% | ||||
| Micron Technology, Inc. | 2.0% | ||||
This annual shareholder report contains important information about the Strive 1000 Value ETF (the “Fund”) for the period of July 1, 2025 to June 30, 2026 (the “Period”). You can find additional information about the Fund at https://www.strivefunds.com/stxv. You can also request this information by contacting us at (215) 330-4476. For information regarding your Fund shares or account, including account balances, transactions, or distributions, please contact your financial intermediary. | |||||||||||
Availability of Additional Information
For additional information about the Fund, including its prospectus, financial information, holdings, and proxy information, visit https://www.strivefunds.com/stxv. You can also request information by calling (215) 330-4476.
Householding
Householding is an option available to certain investors of the Fund. Householding is a method of delivery, based on the preference of the individual investor, in which a single copy of certain shareholder documents can be delivered to investors who share the same address, even if their accounts are registered under different names. Householding for the Fund is available through certain broker-dealers. If you are interested in enrolling in householding and receiving a single copy of prospectuses and other shareholder documents or you are currently enrolled in householding and wish to change your householding status, please contact your broker-dealer.
| WHAT WERE THE FUND COSTS FOR THE PERIOD? (based on a hypothetical $10,000 investment) | |||||||||||
| COST OF $10,000 INVESTMENT | COST PAID AS A PERCENTAGE OF $10,000 INVESTMENT | ||||||||||
| $20 | 0.18% | ||||||||||
| WHAT FACTORS INFLUENCED PERFORMANCE FOR THE PERIOD? | |||||||||||
| HOW DID THE FUND PERFORM FOR THE PERIOD? | |||||||||||
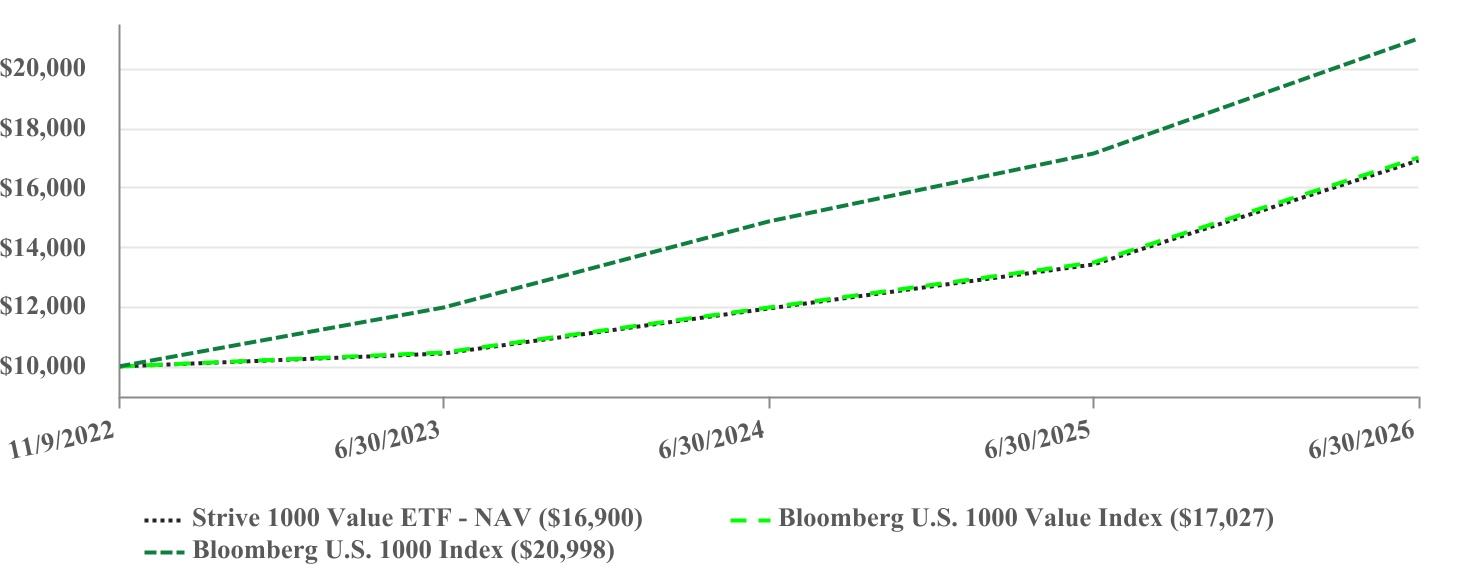
| PERFORMANCE | ||||||||||||||
| One Year | Since Inception (11/9/2022) | |||||||||||||
| Strive 1000 Value ETF - NAV | 25.88% | 15.51% | ||||||||||||
| Bloomberg U.S. 1000 Value Index | 26.20% | 15.75% | ||||||||||||
| Bloomberg U.S. 1000 Index | 22.43% | 22.62% | ||||||||||||
The Fund’s past performance is not a good predictor of how the Fund will perform in the future. The graph and table do not reflect the deduction of taxes that a shareholder would pay on Fund distributions or redemption of Fund shares. | ||||||||||||||
Visit https://www.strivefunds.com/stxv for more recent performance information. | ||||||||||||||
KEY FUND STATISTICS (as of Period End) | ||||||||||||||||||||
Net Assets | $80,003,382 | Portfolio Turnover Rate* | 23% | |||||||||||||||||
| # of Portfolio Holdings | 709 | Fund Advisory Fees Paid | $128,318 | |||||||||||||||||
| *Portfolio turnover is not annualized and is calculated without regard to short-term securities having a maturity of less than one year. Excludes impact of in-kind transactions. | ||||||||||||||||||||
| SECTOR WEIGHTING (as a % of Net Assets) | |||||
| Financials | 22.5% | ||||
| Health Care | 17.2% | ||||
| Information Technology | 11.6% | ||||
| Energy | 10.3% | ||||
| Industrials | 8.2% | ||||
| Consumer Staples | 7.7% | ||||
| Utilities | 6.4% | ||||
| Consumer Discretionary | 5.1% | ||||
| Communication Services | 4.2% | ||||
| Materials | 3.5% | ||||
| Real Estate | 3.2% | ||||
| Cash and Cash Equivalents | 0.1% | ||||
| TOP 10 HOLDINGS (as a % of Net Assets) | |||||
| Exxon Mobil Corp. | 3.0% | ||||
| Intel Corp. | 2.3% | ||||
| Bank of America Corp. | 2.1% | ||||
| UnitedHealth Group, Inc. | 2.1% | ||||
| Johnson & Johnson | 1.7% | ||||
| Chevron Corp. | 1.7% | ||||
| Micron Technology, Inc. | 1.6% | ||||
| AbbVie, Inc. | 1.5% | ||||
| Goldman Sachs Group, Inc. | 1.5% | ||||
| Berkshire Hathaway, Inc. - Class B | 1.4% | ||||
This annual shareholder report contains important information about the Strive 500 ETF (the “Fund”) for the period of July 1, 2025 to June 30, 2026 (the “Period”). You can find additional information about the Fund at https://www.strivefunds.com/stxf. You can also request this information by contacting us at (215) 330-4476. For information regarding your Fund shares or account, including account balances, transactions, or distributions, please contact your financial intermediary. | |||||||||||
Availability of Additional Information
For additional information about the Fund, including its prospectus, financial information, holdings, and proxy information, visit https://www.strivefunds.com/stxf. You can also request information by calling (215) 330-4476.
Householding
Householding is an option available to certain investors of the Fund. Householding is a method of delivery, based on the preference of the individual investor, in which a single copy of certain shareholder documents can be delivered to investors who share the same address, even if their accounts are registered under different names. Householding for the Fund is available through certain broker-dealers. If you are interested in enrolling in householding and receiving a single copy of prospectuses and other shareholder documents or you are currently enrolled in householding and wish to change your householding status, please contact your broker-dealer.
| WHAT WERE THE FUND COSTS FOR THE PERIOD? (based on a hypothetical $10,000 investment) | |||||||||||
| COST OF $10,000 INVESTMENT | COST PAID AS A PERCENTAGE OF $10,000 INVESTMENT | ||||||||||
| $6 | 0.05% | ||||||||||
| WHAT FACTORS INFLUENCED PERFORMANCE FOR THE PERIOD? | |||||||||||
| HOW DID THE FUND PERFORM FOR THE PERIOD? | |||||||||||
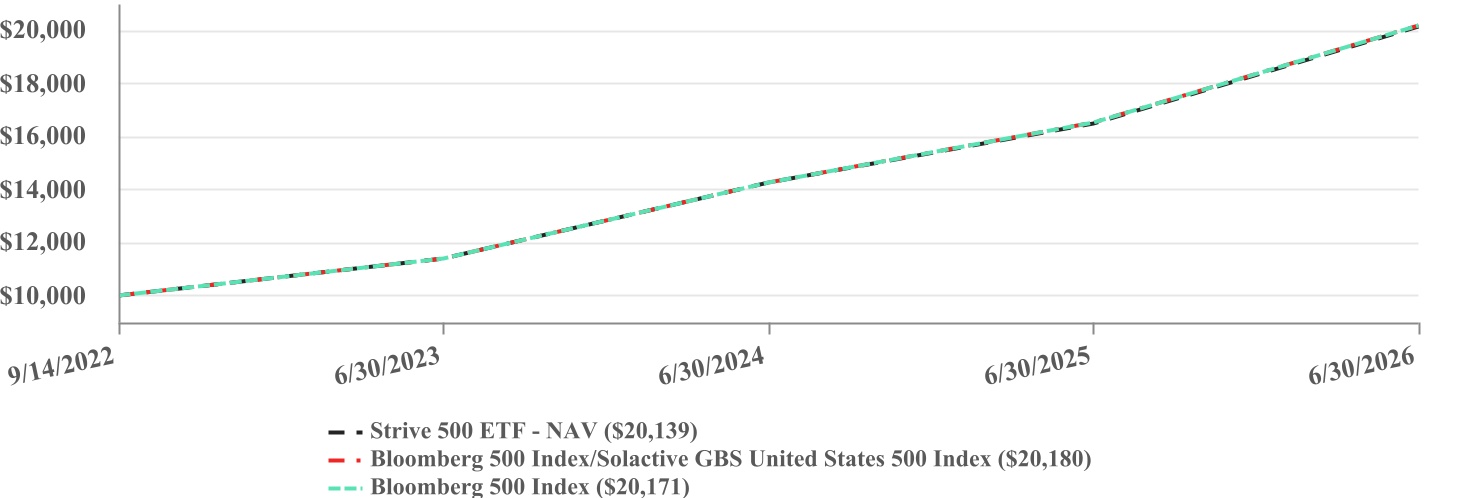
| PERFORMANCE | ||||||||||||||
| One Year | Since Inception (9/14/2022) | |||||||||||||
| Strive 500 ETF - NAV | 22.07% | 20.28% | ||||||||||||
| Bloomberg 500 Index/Solactive GBS United States 500 Index | 22.09% | 20.34% | ||||||||||||
| Bloomberg 500 Index | 22.09% | 20.33% | ||||||||||||
The Fund’s past performance is not a good predictor of how the Fund will perform in the future. The graph and table do not reflect the deduction of taxes that a shareholder would pay on Fund distributions or redemption of Fund shares. Effective January 26, 2024, the Fund’s investment strategy changed to track the investment results of the Bloomberg US Large Cap Index. Prior to January 26, 2024, the Fund’s investment strategy was to track the investment results of the Solactive GBS United States 500 Index. Performance shown for the Bloomberg 500 Index/Solactive GBS United States 500 Index for the period prior to January 26, 2024 is that of the Solactive GBS United States 500 Index and for the period beginning January 26, 2024 is that of the Bloomberg US Large Cap Index. | ||||||||||||||
Visit https://www.strivefunds.com/stxf for more recent performance information. | ||||||||||||||
| KEY FUND STATISTICS (as of Period End) | ||||||||||||||||||||
| Net Assets | $1,118,302,547 | Advisory Fees | $555,612 | |||||||||||||||||
| # of Portfolio Holdings | 509 | Fees Waived and/or Expenses Reimbursed | $(3,117) | |||||||||||||||||
| Portfolio Turnover Rate* | 3% | Net Fund Advisory Fees | $552,495 | |||||||||||||||||
| *Portfolio turnover is not annualized and is calculated without regard to short-term securities having a maturity of less than one year. Excludes impact of in-kind transactions. | ||||||||||||||||||||
| SECTOR WEIGHTING (as a % of Net Assets) | |||||
| Information Technology | 37.9% | ||||
| Financials | 11.4% | ||||
| Communication Services | 10.0% | ||||
| Consumer Discretionary | 9.6% | ||||
| Health Care | 9.0% | ||||
| Industrials | 9.0% | ||||
| Consumer Staples | 4.4% | ||||
| Energy | 3.0% | ||||
| Utilities | 2.1% | ||||
| Materials | 1.8% | ||||
| Real Estate | 1.7% | ||||
| Cash and Cash Equivalents | 0.1% | ||||
| TOP 10 HOLDINGS (as a % of Net Assets) | |||||
| NVIDIA Corp. | 7.3% | ||||
| Apple, Inc. | 6.5% | ||||
| Microsoft Corp. | 4.3% | ||||
| Amazon.com, Inc. | 3.6% | ||||
| Alphabet, Inc. - Class A | 3.2% | ||||
| Broadcom, Inc. | 2.7% | ||||
| Alphabet, Inc. - Class C | 2.6% | ||||
| Tesla, Inc. | 2.2% | ||||
| Micron Technology, Inc. | 2.0% | ||||
| Meta Platforms, Inc. - Class A | 1.9% | ||||
This annual shareholder report contains important information about the Strive Emerging Markets Ex-China ETF (the “Fund”) for the period of July 1, 2025 to June 30, 2026 (the “Period”). You can find additional information about the Fund at https://www.strivefunds.com/stxe. You can also request this information by contacting us at (215) 330-4476. For information regarding your Fund shares or account, including account balances, transactions, or distributions, please contact your financial intermediary. | |||||||||||
Availability of Additional Information
For additional information about the Fund, including its prospectus, financial information, holdings, and proxy information, visit https://www.strivefunds.com/stxe. You can also request information by calling (215) 330-4476.
Householding
Householding is an option available to certain investors of the Fund. Householding is a method of delivery, based on the preference of the individual investor, in which a single copy of certain shareholder documents can be delivered to investors who share the same address, even if their accounts are registered under different names. Householding for the Fund is available through certain broker-dealers. If you are interested in enrolling in householding and receiving a single copy of prospectuses and other shareholder documents or you are currently enrolled in householding and wish to change your householding status, please contact your broker-dealer.
| WHAT WERE THE FUND COSTS FOR THE PERIOD? (based on a hypothetical $10,000 investment) | |||||||||||
| COST OF $10,000 INVESTMENT | COST PAID AS A PERCENTAGE OF $10,000 INVESTMENT | ||||||||||
| $43 | 0.32% | ||||||||||
| WHAT FACTORS INFLUENCED PERFORMANCE FOR THE PERIOD? | |||||||||||
| HOW DID THE FUND PERFORM FOR THE PERIOD? | |||||||||||
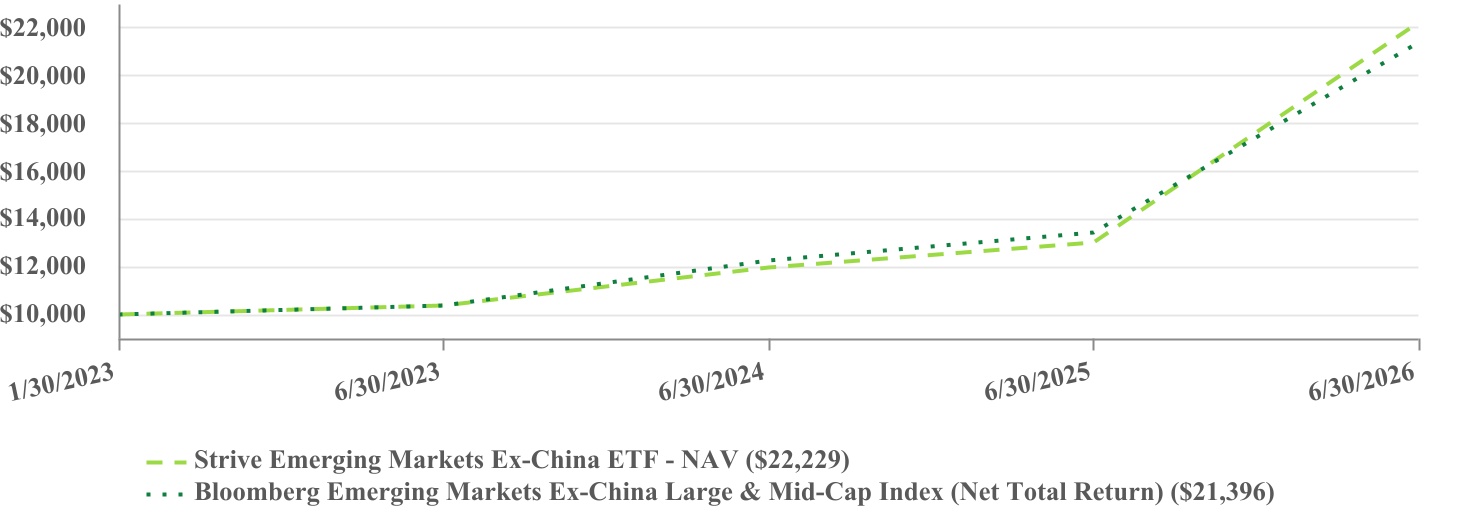
| PERFORMANCE | ||||||||||||||
| One Year | Since Inception (1/30/2023) | |||||||||||||
| Strive Emerging Markets Ex-China ETF - NAV | 70.83% | 26.36% | ||||||||||||
| Bloomberg Emerging Markets Ex-China Large & Mid-Cap Index (Net Total Return) | 59.56% | 24.96% | ||||||||||||
The Fund’s past performance is not a good predictor of how the Fund will perform in the future. The graph and table do not reflect the deduction of taxes that a shareholder would pay on Fund distributions or redemption of Fund shares. Net total return figures assume the reinvestment of dividends after deduction of withholding tax, applying the maximum rate to nonresident individual investors who do not benefit from double taxation treaties. | ||||||||||||||
Visit https://www.strivefunds.com/stxe for more recent performance information. | ||||||||||||||
KEY FUND STATISTICS (as of Period End) | ||||||||||||||||||||
Net Assets | $150,022,868 | Portfolio Turnover Rate* | 18% | |||||||||||||||||
| # of Portfolio Holdings | 196 | Fund Advisory Fees Paid | $370,926 | |||||||||||||||||
| *Portfolio turnover is not annualized and is calculated without regard to short-term securities having a maturity of less than one year. Excludes impact of in-kind transactions. | ||||||||||||||||||||
| SECTOR WEIGHTING (as a % of Net Assets) | |||||
| Information Technology | 56.0% | ||||
| Financials | 19.9% | ||||
| Materials | 5.8% | ||||
| Industrials | 5.0% | ||||
| Consumer Discretionary | 3.3% | ||||
| Energy | 3.0% | ||||
| Communication Services | 2.7% | ||||
| Utilities | 1.5% | ||||
| Consumer Staples | 1.4% | ||||
| Health Care | 0.9% | ||||
| Real Estate | 0.4% | ||||
| Cash and Cash Equivalents | 0.1% | ||||
| TOP 10 COUNTRY WEIGHTING (as a % of Net Assets) | |||||
| South Korea | 33.2% | ||||
| Taiwan | 32.4% | ||||
| India | 12.5% | ||||
| Brazil | 4.1% | ||||
| Saudi Arabia | 3.9% | ||||
| South Africa | 3.0% | ||||
| Mexico | 2.7% | ||||
| Thailand | 1.4% | ||||
| United Arab Emirates | 1.1% | ||||
| United States | 1.2% | ||||
This annual shareholder report contains important information about the Strive Enhanced Income Short Maturity ETF (the “Fund”) for the period of July 1, 2025 to June 30, 2026 (the “Period”). You can find additional information about the Fund at https://www.strivefunds.com/buxx. You can also request this information by contacting us at (215) 330-4476. For information regarding your Fund shares or account, including account balances, transactions, or distributions, please contact your financial intermediary. | |||||||||||
Availability of Additional Information
For additional information about the Fund, including its prospectus, financial information, holdings, and proxy information, visit https://www.strivefunds.com/buxx. You can also request information by calling (215) 330-4476.
Householding
Householding is an option available to certain investors of the Fund. Householding is a method of delivery, based on the preference of the individual investor, in which a single copy of certain shareholder documents can be delivered to investors who share the same address, even if their accounts are registered under different names. Householding for the Fund is available through certain broker-dealers. If you are interested in enrolling in householding and receiving a single copy of prospectuses and other shareholder documents or you are currently enrolled in householding and wish to change your householding status, please contact your broker-dealer.
| WHAT WERE THE FUND COSTS FOR THE PERIOD? (based on a hypothetical $10,000 investment) | |||||||||||
| COST OF $10,000 INVESTMENT | COST PAID AS A PERCENTAGE OF $10,000 INVESTMENT | ||||||||||
| $26 | 0.25% | ||||||||||
| WHAT FACTORS INFLUENCED PERFORMANCE FOR THE PERIOD? | |||||||||||
The Fund seeks to provide enhanced income through exposure to short-term investment grade assets, including structured credit and investment grade corporate securities. The Fund maintained a broad allocation across key securitized and corporate credit sectors, with each segment contributing positively to overall performance. The Fund’s return was positively impacted by declining short-term interest rates over the Period as well.
The Fund’s allocations to investment-grade corporate bonds, asset-backed securities (ABS), and agency commercial mortgage-backed securities were the most significant drivers of positive performance, while exposure to collateralized loan obligations (CLOs), non-agency residential mortgage-backed securities, and Treasuries were smaller positive contributions to overall performance.
Investment-grade corporate bonds were the most significant contributor to positive performance. The Fund found value in short-duration, investment-grade issuers offering higher short-term yields, strong balance sheets, and ample liquidity. The Fund’s allocations to Treasuries led to less relative outperformance versus other fixed income sectors like securitized credit that had higher total returns during the Period.
| HOW DID THE FUND PERFORM FOR THE PERIOD? | |||||||||||
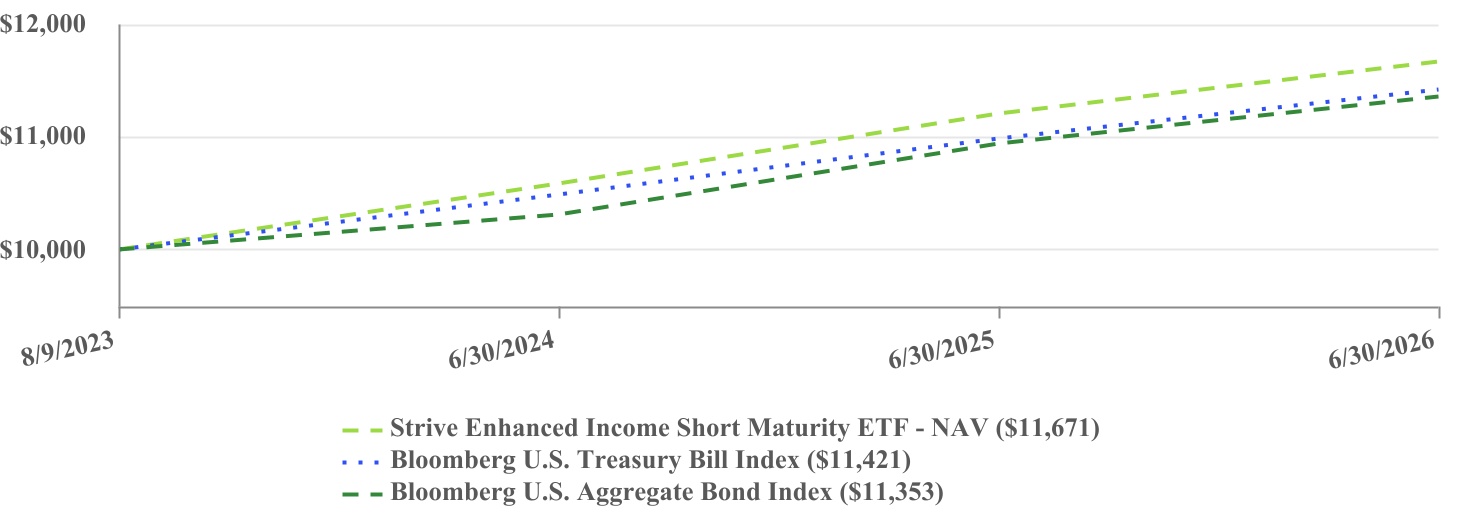
| PERFORMANCE | ||||||||||||||
| One Year | Since Inception (8/9/2023) | |||||||||||||
| Strive Enhanced Income Short Maturity ETF - NAV | 4.14% | 5.49% | ||||||||||||
| Bloomberg U.S. Treasury Bill Index | 3.95% | 4.70% | ||||||||||||
| Bloomberg U.S. Aggregate Bond Index | 3.79% | 4.48% | ||||||||||||
| The Bloomberg U.S. Treasury Bill Index is provided as a broad measure of market performance. The Bloomberg U.S. Aggregate Bond Index is provided as a measure of the Fund’s investment strategy and universe. | ||||||||||||||
The Fund’s past performance is not a good predictor of how the Fund will perform in the future. The graph and table do not reflect the deduction of taxes that a shareholder would pay on Fund distributions or redemption of Fund shares. | ||||||||||||||
Visit https://www.strivefunds.com/buxx for more recent performance information. | ||||||||||||||
KEY FUND STATISTICS (as of Period End) | ||||||||||||||||||||
Net Assets | $490,220,614 | Portfolio Turnover Rate* | 76% | |||||||||||||||||
| # of Portfolio Holdings | 324 | Fund Advisory Fees Paid | $931,073 | |||||||||||||||||
| *Portfolio turnover is not annualized and is calculated without regard to short-term securities having a maturity of less than one year. Excludes impact of in-kind transactions. | ||||||||||||||||||||
| INVESTMENT WEIGHTING (as a % of Net Assets) | |||||
| Asset-Backed Securities | 30.9% | ||||
| Corporate Bonds | 24.6% | ||||
| Collateralized Mortgage Obligations | 15.7% | ||||
| Collateralized Loan Obligations | 13.2% | ||||
| Mortgage-Backed Securities | 5.5% | ||||
| U.S. Treasury Bills | 4.9% | ||||
| Cash and Cash Equivalents | 5.2% | ||||
This annual shareholder report contains important information about the Strive Natural Resources and Security ETF (the “Fund”) for the period of July 1, 2025 to June 30, 2026 (the “Period”). You can find additional information about the Fund at https://www.strivefunds.com/ftwo. You can also request this information by contacting us at (215) 330-4476. For information regarding your Fund shares or account, including account balances, transactions, or distributions, please contact your financial intermediary. | |||||||||||
Availability of Additional Information
For additional information about the Fund, including its prospectus, financial information, holdings, and proxy information, visit https://www.strivefunds.com/ftwo. You can also request information by calling (215) 330-4476.
Householding
Householding is an option available to certain investors of the Fund. Householding is a method of delivery, based on the preference of the individual investor, in which a single copy of certain shareholder documents can be delivered to investors who share the same address, even if their accounts are registered under different names. Householding for the Fund is available through certain broker-dealers. If you are interested in enrolling in householding and receiving a single copy of prospectuses and other shareholder documents or you are currently enrolled in householding and wish to change your householding status, please contact your broker-dealer.
| WHAT WERE THE FUND COSTS FOR THE PERIOD? (based on a hypothetical $10,000 investment) | |||||||||||
| COST OF $10,000 INVESTMENT | COST PAID AS A PERCENTAGE OF $10,000 INVESTMENT | ||||||||||
| $55 | 0.49% | ||||||||||
| WHAT FACTORS INFLUENCED PERFORMANCE FOR THE PERIOD? | |||||||||||
| HOW DID THE FUND PERFORM FOR THE PERIOD? | |||||||||||
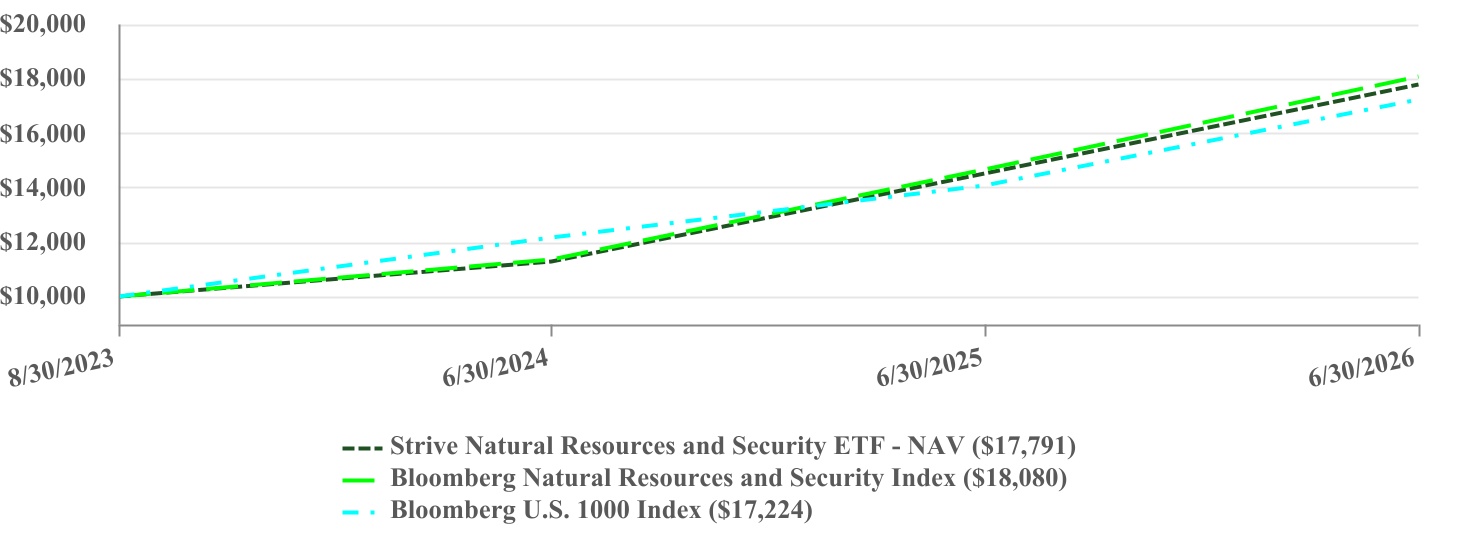
| PERFORMANCE | ||||||||||||||
| One Year | Since Inception (8/30/2023) | |||||||||||||
| Strive Natural Resources and Security ETF - NAV | 22.60% | 22.53% | ||||||||||||
| Bloomberg Natural Resources and Security Index | 23.36% | 23.23% | ||||||||||||
| Bloomberg U.S. 1000 Index | 22.43% | 21.14% | ||||||||||||
The Fund’s past performance is not a good predictor of how the Fund will perform in the future. The graph and table do not reflect the deduction of taxes that a shareholder would pay on fund distributions or redemption of fund shares. | ||||||||||||||
Visit https://www.strivefunds.com/ftwo for more recent performance information. | ||||||||||||||
| KEY FUND STATISTICS (as of Period End) | ||||||||||||||||||||
| Net Assets | $73,145,367 | Portfolio Turnover Rate* | 23% | |||||||||||||||||
| # of Portfolio Holdings | 52 | Fund Advisory Fees Paid | $299,498 | |||||||||||||||||
| *Portfolio turnover is not annualized and is calculated without regard to short-term securities having a maturity of less than one year. Excludes impact of in-kind transactions. | ||||||||||||||||||||
| SECTOR WEIGHTING (as a % of Net Assets) | |||||
| Industrials | 37.0% | ||||
| Materials | 26.4% | ||||
| Energy | 24.2% | ||||
| Utilities | 10.5% | ||||
| Consumer Staples | 1.1% | ||||
| Information Technology | 0.4% | ||||
| Cash and Cash Equivalents | 0.4% | ||||
| TOP 10 HOLDINGS (as a % of Net Assets) | |||||
| Deere & Co. | 11.2% | ||||
| Constellation Energy Corp. | 8.0% | ||||
| Exxon Mobil Corp. | 6.6% | ||||
| General Electric Co. | 6.1% | ||||
| Cameco Corp. | 4.6% | ||||
| RTX Corp. | 4.0% | ||||
| Corteva, Inc. | 4.0% | ||||
| Newmont Corp. | 3.6% | ||||
| Chevron Corp. | 3.5% | ||||
| Freeport-McMoRan, Inc. | 3.3% | ||||
This annual shareholder report contains important information about the Strive Small-Cap ETF (the “Fund”) for the period of July 1, 2025 to June 30, 2026 (the “Period”). You can find additional information about the Fund at https://www.strivefunds.com/stxk. You can also request this information by contacting us at (215) 330-4476. For information regarding your Fund shares or account, including account balances, transactions, or distributions, please contact your financial intermediary. | |||||||||||
Availability of Additional Information
For additional information about the Fund, including its prospectus, financial information, holdings, and proxy information, visit https://www.strivefunds.com/stxk. You can also request information by calling (215) 330-4476.
Householding
Householding is an option available to certain investors of the Fund. Householding is a method of delivery, based on the preference of the individual investor, in which a single copy of certain shareholder documents can be delivered to investors who share the same address, even if their accounts are registered under different names. Householding for the Fund is available through certain broker-dealers. If you are interested in enrolling in householding and receiving a single copy of prospectuses and other shareholder documents or you are currently enrolled in householding and wish to change your householding status, please contact your broker-dealer.
| WHAT WERE THE FUND COSTS FOR THE PERIOD? (based on a hypothetical $10,000 investment) | |||||||||||
| COST OF $10,000 INVESTMENT | COST PAID AS A PERCENTAGE OF $10,000 INVESTMENT | ||||||||||
| $21 | 0.18% | ||||||||||
| WHAT FACTORS INFLUENCED PERFORMANCE FOR THE PERIOD? | |||||||||||
| HOW DID THE FUND PERFORM FOR THE PERIOD? | |||||||||||
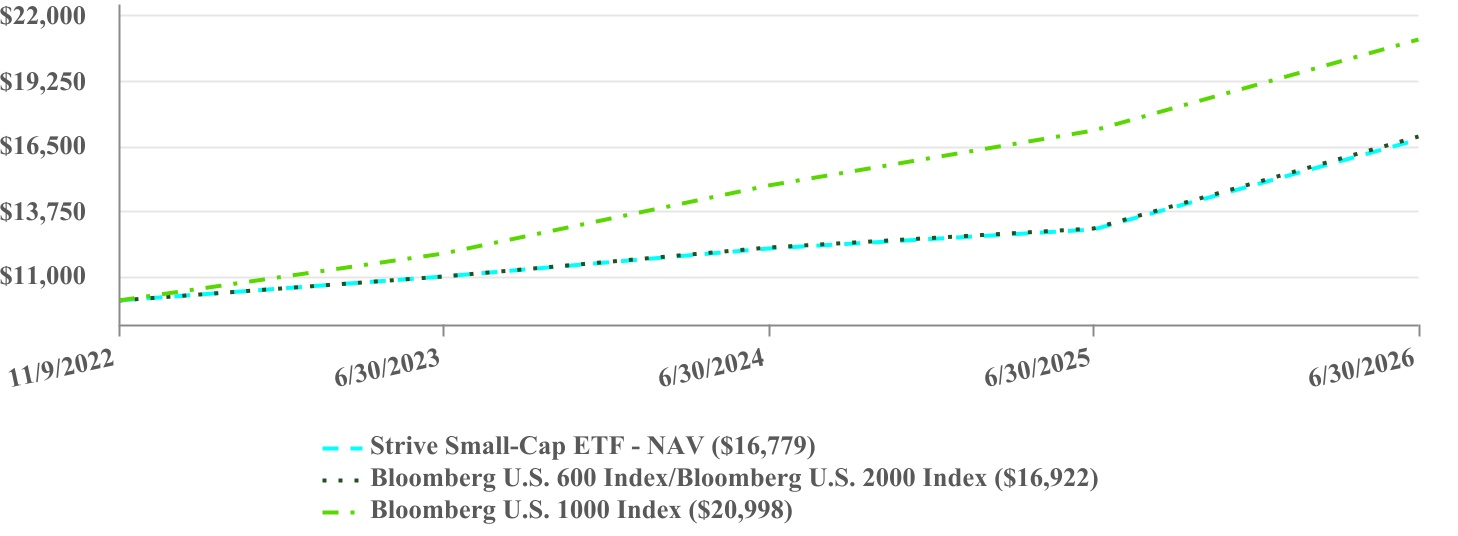
| PERFORMANCE | ||||||||||||||
| One Year | Since Inception (11/9/2022) | |||||||||||||
| Strive Small-Cap ETF - NAV | 29.36% | 15.29% | ||||||||||||
| Bloomberg U.S. 600 Index/Bloomberg U.S. 2000 Index | 29.86% | 15.55% | ||||||||||||
| Bloomberg U.S. 1000 Index | 22.43% | 22.62% | ||||||||||||
The Fund’s past performance is not a good predictor of how the Fund will perform in the future. The graph and table do not reflect the deduction of taxes that a shareholder would pay on Fund distributions or redemption of Fund shares. Effective January 25, 2023, the Fund’s investment objective changed to track the total return performance, before fees and expenses, of an index composed of U.S. small-capitalization companies, and the Fund’s investment strategy changed to track the investment results of the Bloomberg 600 Index. Prior to January 25, 2023, the Fund’s investment objective was to track the total return performance, before fees and expenses, of an index composed of U.S. small- and mid-capitalization companies, and the Fund’s investment strategy was to track the investment results of the Bloomberg U.S. 2000 Index. Performance shown for the Bloomberg U.S. 600 Index/Bloomberg U.S. 2000 Index for periods prior to January 25, 2023 is that of the Bloomberg U.S. 2000 Index and for periods beginning January 25, 2023 is that of the Bloomberg U.S. 600 Index. | ||||||||||||||
Visit https://www.strivefunds.com/stxk for more recent performance information. | ||||||||||||||
KEY FUND STATISTICS (as of Period End) | ||||||||||||||||||||
Net Assets | $84,132,034 | Portfolio Turnover Rate* | 45% | |||||||||||||||||
| # of Portfolio Holdings | 601 | Fund Advisory Fees Paid | $125,763 | |||||||||||||||||
| *Portfolio turnover is not annualized and is calculated without regard to short-term securities having a maturity of less than one year. Excludes impact of in-kind transactions. | ||||||||||||||||||||
| SECTOR WEIGHTING (as a % of Net Assets) | |||||
| Financials | 16.9% | ||||
| Industrials | 16.2% | ||||
| Information Technology | 15.9% | ||||
| Health Care | 13.5% | ||||
| Consumer Discretionary | 13.4% | ||||
| Real Estate | 6.5% | ||||
| Energy | 5.6% | ||||
| Materials | 4.6% | ||||
| Utilities | 2.9% | ||||
| Communication Services | 2.2% | ||||
| Consumer Staples | 2.1% | ||||
| Cash and Cash Equivalents | 0.2% | ||||
| TOP 10 HOLDINGS (as a % of Net Assets) | |||||
| FormFactor, Inc. | 0.5% | ||||
| DigitalOcean Holdings, Inc. | 0.5% | ||||
| Cognex Corp. | 0.5% | ||||
| Viasat, Inc. | 0.5% | ||||
| Applied Optoelectronics, Inc. | 0.5% | ||||
| Arrow Electronics, Inc. | 0.5% | ||||
| Viavi Solutions, Inc. | 0.5% | ||||
| Argan, Inc. | 0.5% | ||||
| Terawulf, Inc. | 0.4% | ||||
| Timken Co. | 0.4% | ||||
This annual shareholder report contains important information about the Strive Total Return Bond ETF (the “Fund”) for the period of July 1, 2025 to June 30, 2026 (the “Period”). You can find additional information about the Fund at https://www.strivefunds.com/stxt. You can also request this information by contacting us at (215) 330-4476. For information regarding your Fund shares or account, including account balances, transactions, or distributions, please contact your financial intermediary. | |||||||||||
Availability of Additional Information
For additional information about the Fund, including its prospectus, financial information, holdings, and proxy information, visit https://www.strivefunds.com/stxt. You can also request information by calling (215) 330-4476.
Householding
Householding is an option available to certain investors of the Fund. Householding is a method of delivery, based on the preference of the individual investor, in which a single copy of certain shareholder documents can be delivered to investors who share the same address, even if their accounts are registered under different names. Householding for the Fund is available through certain broker-dealers. If you are interested in enrolling in householding and receiving a single copy of prospectuses and other shareholder documents or you are currently enrolled in householding and wish to change your householding status, please contact your broker-dealer.
| WHAT WERE THE FUND COSTS FOR THE PERIOD? (based on a hypothetical $10,000 investment) | |||||||||||
| COST OF $10,000 INVESTMENT | COST PAID AS A PERCENTAGE OF $10,000 INVESTMENT | ||||||||||
| $49 | 0.49% | ||||||||||
| WHAT FACTORS INFLUENCED PERFORMANCE FOR THE PERIOD? | |||||||||||
The Fund provides actively managed core fixed income exposure with a tactical allocation to structured credit and high-yield corporate bonds. The Fund maintained a broad allocation across key securitized and corporate credit sectors, with most segments contributing positively to overall performance.
The Fund’s allocation to agency residential mortgage-backed securities (RMBS), asset-backed securities, non-agency RMBS, and CLOs was the most significant driver of positive performance. Agency RMBS was the most significant positive contributor to performance where spreads tightened while offering meaningful exposure to high-quality, liquid fixed-income assets.
The Fund’s tactical allocation to Bitcoin structured products was the largest detractor to performance given a decline in Bitcoin prices over the year.
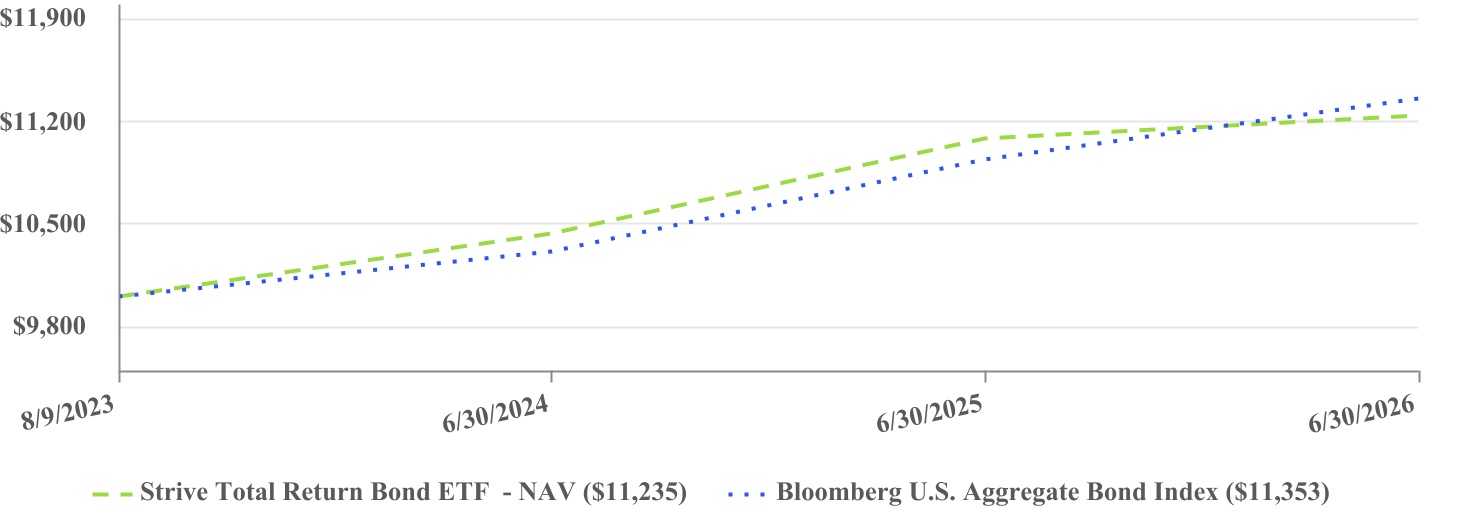
| HOW DID THE FUND PERFORM FOR THE PERIOD? | |||||||||||
| PERFORMANCE | ||||||||||||||
| One Year | Since Inception (8/9/2023) | |||||||||||||
Strive Total Return Bond ETF - NAV | 1.38% | 4.11% | ||||||||||||
| Bloomberg U.S. Aggregate Bond Index | 3.79% | 4.48% | ||||||||||||
The Fund’s past performance is not a good predictor of how the Fund will perform in the future. The graph and table do not reflect the deduction of taxes that a shareholder would pay on Fund distributions or redemption of Fund shares. | ||||||||||||||
Visit https://www.strivefunds.com/stxt for more recent performance information. | ||||||||||||||
KEY FUND STATISTICS (as of Period End) | ||||||||||||||||||||
Net Assets | $119,253,211 | Portfolio Turnover Rate* | 72% | |||||||||||||||||
| # of Portfolio Holdings | 209 | Fund Advisory Fees Paid | $606,430 | |||||||||||||||||
| *Portfolio turnover is not annualized and is calculated without regard to short-term securities having a maturity of less than one year. Excludes impact of in-kind transactions. | ||||||||||||||||||||
| SECTOR WEIGHTING (as a % of Net Assets) | |||||
| Mortgage-Backed Securities | 36.9% | ||||
| Asset-Backed Securities | 13.6% | ||||
| Collateralized Mortgage Obligations | 11.9% | ||||
| U.S. Treasury Securities | 11.0% | ||||
| Corporate Bonds | 8.3% | ||||
| Collateralized Loan Obligations | 5.6% | ||||
| Preferred Stocks | 3.7% | ||||
| Convertible Preferred Stocks | 3.7% | ||||
| Convertible Bonds | 1.4% | ||||
| U.S. Treasury Bills | 2.1% | ||||
| Cash and Cash Equivalents | 1.8% | ||||
This annual shareholder report contains important information about the Strive U.S. Energy ETF (the “Fund”) for the period of July 1, 2025 to June 30, 2026 (the “Period”). You can find additional information about the Fund at https://www.strivefunds.com/drll. You can also request this information by contacting us at (215) 330-4476. For information regarding your Fund shares or account, including account balances, transactions, or distributions, please contact your financial intermediary.
Availability of Additional Information
For additional information about the Fund, including its prospectus, financial information, holdings, and proxy information, visit https://www.strivefunds.com/drll. You can also request information by calling (215) 330-4476.
Householding
Householding is an option available to certain investors of the Fund. Householding is a method of delivery, based on the preference of the individual investor, in which a single copy of certain shareholder documents can be delivered to investors who share the same address, even if their accounts are registered under different names. Householding for the Fund is available through certain broker-dealers. If you are interested in enrolling in householding and receiving a single copy of prospectuses and other shareholder documents or you are currently enrolled in householding and wish to change your householding status, please contact your broker-dealer.
| WHAT WERE THE FUND COSTS FOR THE PERIOD? (based on a hypothetical $10,000 investment) | |||||||||||
| COST OF $10,000 INVESTMENT | COST PAID AS A PERCENTAGE OF $10,000 INVESTMENT | ||||||||||
| $47 | 0.41% | ||||||||||
| WHAT FACTORS INFLUENCED PERFORMANCE FOR THE PERIOD? | |||||||||||
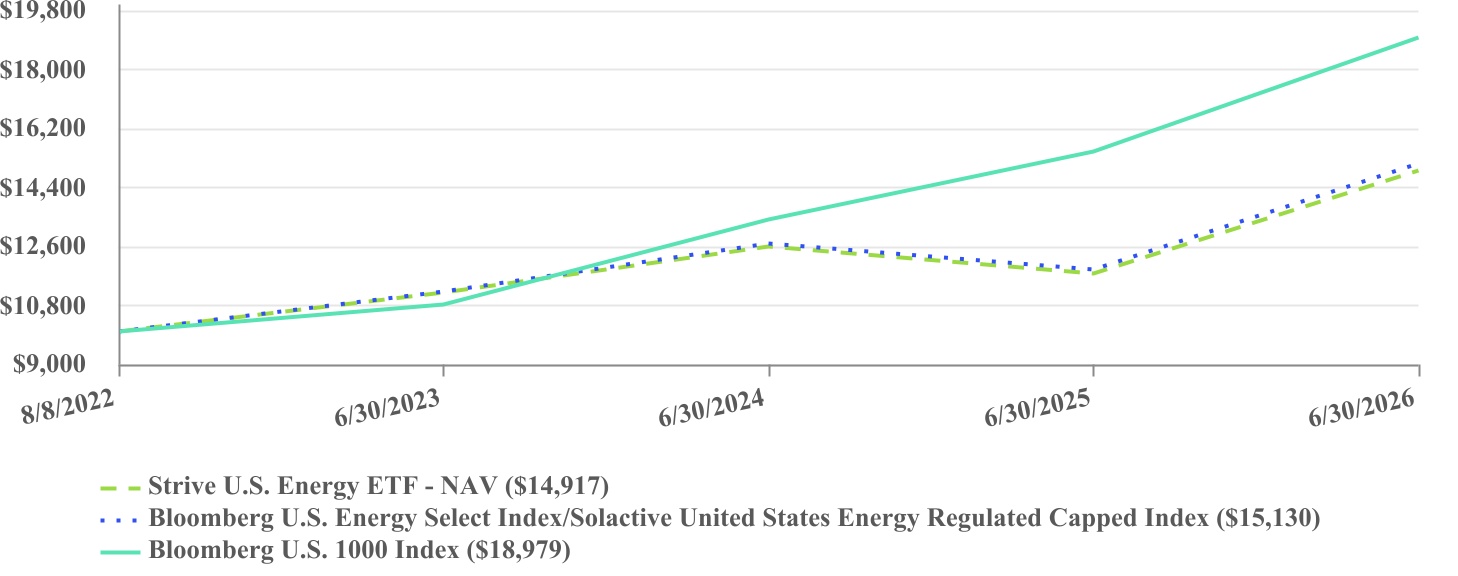
| HOW DID THE FUND PERFORM FOR THE PERIOD? | |||||||||||
| PERFORMANCE | ||||||||||||||
| One Year | Since Inception (8/8/2022) | |||||||||||||
| Strive U.S. Energy ETF - NAV | 26.83% | 10.82% | ||||||||||||
| Bloomberg U.S. Energy Select Index/ Solactive United States Energy Regulated Capped Index | 27.27% | 11.22% | ||||||||||||
| Bloomberg U.S. 1000 Index | 22.43% | 17.89% | ||||||||||||
The Fund’s past performance is not a good predictor of how the Fund will perform in the future. The graph and table do not reflect the deduction of taxes that a shareholder would pay on Fund distributions or redemption of Fund shares. Effective April 11, 2024, the Fund’s investment strategy changed to track the investment results of the Bloomberg U.S. Energy Select Index. Prior to April 11, 2024, the Fund’s investment strategy was to track the investment results of the Solactive United States Energy Regulated Capped Index. Performance shown for the Bloomberg U.S. Energy Select Index/Solactive United States Energy Regulated Capped Index for periods prior to April 11, 2024 is that of the Solactive United States Energy Regulated Capped Index and for periods beginning April 11, 2024 is that of the Bloomberg U.S. Energy Select Index. | ||||||||||||||
Visit https://www.strivefunds.com/drll for more recent performance information. | ||||||||||||||
KEY FUND STATISTICS (as of Period End) | ||||||||||||||||||||
Net Assets | $260,193,826 | Portfolio Turnover Rate* | 16% | |||||||||||||||||
| # of Portfolio Holdings | 34 | Fund Advisory Fees Paid | $1,100,364 | |||||||||||||||||
| *Portfolio turnover is not annualized and is calculated without regard to short-term securities having a maturity of less than one year. Excludes impact of in-kind transactions. | ||||||||||||||||||||
| INDUSTRY WEIGHTING (as a % of Net Assets) | |||||
| Integrated Oil & Gas | 47.3% | ||||
| Oil & Gas Exploration & Production | 35.2% | ||||
| Oil & Gas Refining & Marketing | 16.2% | ||||
| Consumer Discretionary | 0.9% | ||||
| Real Estate Operating Companies | 0.1% | ||||
| Cash & Cash Equivalents | 0.3% | ||||
TOP 10 HOLDINGS (as a % of Net Assets) | |||||
| Exxon Mobil Corp. | 22.0% | ||||
| Chevron Corp. | 21.8% | ||||
| Valero Energy Corp. | 5.2% | ||||
| Marathon Petroleum Corp. | 4.8% | ||||
| Phillips 66 | 4.7% | ||||
| EOG Resources, Inc. | 4.6% | ||||
| Devon Energy Corp. | 4.3% | ||||
| ConocoPhillips | 4.3% | ||||
| Occidental Petroleum Corp. | 3.5% | ||||
| Diamondback Energy, Inc. | 3.4% | ||||
This annual shareholder report contains important information about the Strive U.S. Semiconductor ETF (the “Fund”) for the period of July 1, 2025 to June 30, 2026 (the “Period”). You can find additional information about the Fund at https://www.strivefunds.com/shoc. You can also request this information by contacting us at (215) 330-4476. For information regarding your Fund shares or account, including account balances, transactions, or distributions, please contact your financial intermediary. | |||||||||||
Availability of Additional Information
For additional information about the Fund, including its prospectus, financial information, holdings, and proxy information, visit https://www.strivefunds.com/shoc. You can also request information by calling (215) 330-4476.
Householding
Householding is an option available to certain investors of the Fund. Householding is a method of delivery, based on the preference of the individual investor, in which a single copy of certain shareholder documents can be delivered to investors who share the same address, even if their accounts are registered under different names. Householding for the Fund is available through certain broker-dealers. If you are interested in enrolling in householding and receiving a single copy of prospectuses and other shareholder documents or you are currently enrolled in householding and wish to change your householding status, please contact your broker-dealer.
| WHAT WERE THE FUND COSTS FOR THE PERIOD? (based on a hypothetical $10,000 investment) | |||||||||||
| COST OF $10,000 INVESTMENT | COST PAID AS A PERCENTAGE OF $10,000 INVESTMENT | ||||||||||
| $66 | 0.40% | ||||||||||
| WHAT FACTORS INFLUENCED PERFORMANCE FOR THE PERIOD? | |||||||||||
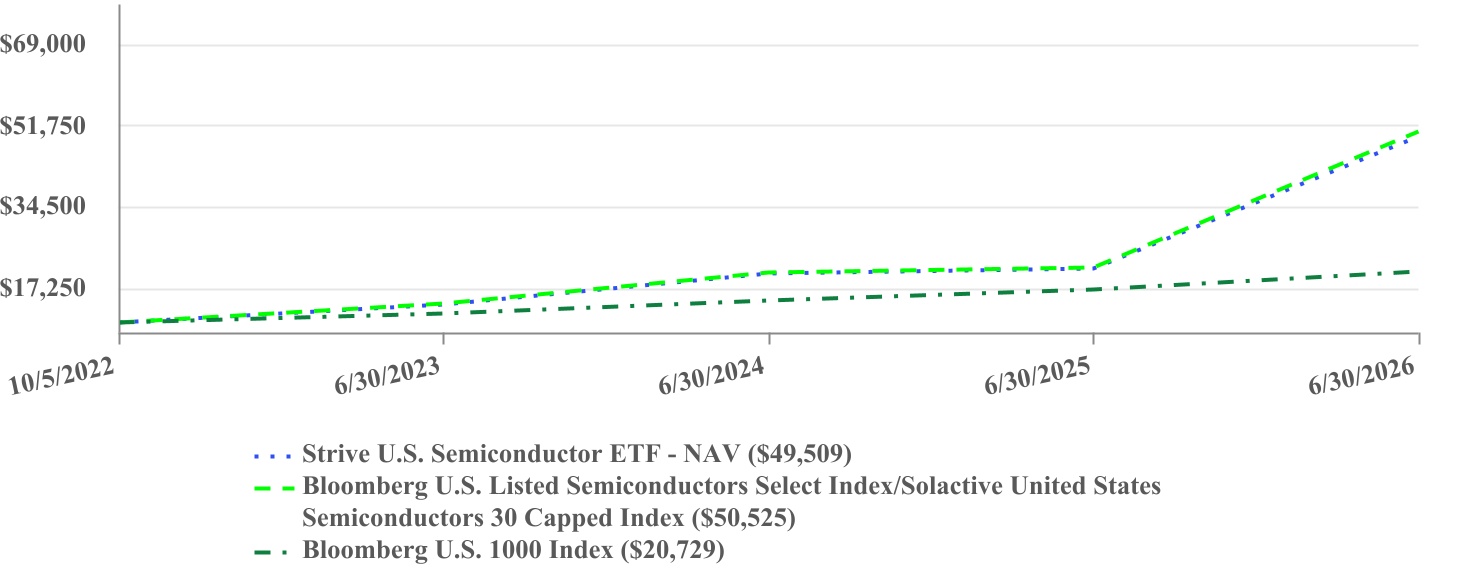
| HOW DID THE FUND PERFORM FOR THE PERIOD? | |||||||||||
| PERFORMANCE | ||||||||||||||
| One Year | Since Inception (10/5/2022) | |||||||||||||
| Strive U.S. Semiconductor ETF - NAV | 130.30% | 53.47% | ||||||||||||
| Bloomberg U.S. Listed Semiconductors Select Index / Solactive United States Semiconductors 30 Capped Index | 132.07% | 54.31% | ||||||||||||
| Bloomberg U.S. 1000 Index | 22.43% | 21.56% | ||||||||||||
The Fund’s past performance is not a good predictor of how the Fund will perform in the future. The graph and table do not reflect the deduction of taxes that a shareholder would pay on Fund distributions or redemption of Fund shares. Effective March 21, 2024, the Fund’s investment strategy changed to track the investment results of the Bloomberg U.S. Listed Semiconductors Select Index. Prior to March 21, 2024, the Fund’s investment strategy was to track the investment results of the Solactive United States Semiconductors 30 Capped Index. Performance shown for the Bloomberg U.S. Listed Semiconductors Select Index/Solactive United States Semiconductors 30 Capped Index for periods prior to March 21, 2024 is that of the Solactive United States Semiconductors 30 Capped Index and for periods beginning March 21, 2024 is that of the Bloomberg U..S Listed Semiconductors Select Index. | ||||||||||||||
Visit https://www.strivefunds.com/shoc for more recent performance information. | ||||||||||||||
KEY FUND STATISTICS (as of Period End) | ||||||||||||||||||||
Net Assets | $278,143,591 | Portfolio Turnover Rate* | 22% | |||||||||||||||||
| # of Portfolio Holdings | 31 | Advisory Fees Paid | $624,394 | |||||||||||||||||
| *Portfolio turnover is not annualized and is calculated without regard to short-term securities having a maturity of less than one year. Excludes impact of in-kind transactions. | ||||||||||||||||||||
| INDUSTRY WEIGHTING (as a % of Net Assets) | |||||
| Semiconductors | 69.3% | ||||
| Semiconductor Materials & Equipment | 24.0% | ||||
| Application Software | 2.9% | ||||
| Electronic Manufacturing Services | 0.9% | ||||
| Electronic Equipment & Instruments | 0.9% | ||||
| Cash & Cash Equivalents | 2.0% | ||||
| TOP 10 HOLDINGS (as a % of Net Assets) | |||||
| NVIDIA Corp. | 17.3% | ||||
| Micron Technology, Inc. | 13.8% | ||||
| Broadcom, Inc. | 9.5% | ||||
| Applied Materials, Inc. | 6.5% | ||||
| KLA Corp. | 5.1% | ||||
| Advanced Micro Devices, Inc. | 5.0% | ||||
| ASML Holding NV | 4.9% | ||||
| Lam Research Corp. | 4.9% | ||||
| Intel Corp. | 4.5% | ||||
| Marvell Technology, Inc. | 4.1% | ||||