Shareholder Report
Jun. 30, 2026
USD ($)
holding
Jun. 30, 2025
This annual shareholder report contains important information about the EA Bridgeway Blue Chip ETF (the “Fund”) for the period of July 1, 2025 to June 30, 2026 (the “Period”). You can find additional information about the Fund at https://bridgewayetfs.com/bblu/. You can also request this information by contacting us at (215) 330-4476. For information regarding your Fund shares or account, including account balances, transactions, or distributions, please contact your financial intermediary. | |||||||||||
Availability of Additional Information
For additional information about the Fund, including its prospectus, financial information, holdings, and proxy information, visit https://bridgewayetfs.com/bblu/. You can also request information by calling (215) 330-4476.
Householding
Householding is an option available to certain investors of the Fund. Householding is a method of delivery, based on the preference of the individual investor, in which a single copy of certain shareholder documents can be delivered to investors who share the same address, even if their accounts are registered under different names. Householding for the Fund is available through certain broker-dealers. If you are interested in enrolling in householding and receiving a single copy of prospectuses and other shareholder documents or you are currently enrolled in householding and wish to change your householding status, please contact your broker-dealer.
| WHAT WERE THE FUND COSTS FOR THE PERIOD? (based on a hypothetical $10,000 investment) | |||||||||||
| COST OF $10,000 INVESTMENT | COST PAID AS A PERCENTAGE OF $10,000 INVESTMENT | ||||||||||
| $17 | 0.15% | ||||||||||
| WHAT FACTORS INFLUENCED PERFORMANCE FOR THE PERIOD? | |||||||||||
The Fund returned 21.62% (NAV) for the Period vs 22.32% for the S&P 500 Index.
The Fund’s focus on mega-cap stocks contributed positively to returns, as the largest stocks in the benchmark generally outperformed its smaller constituents. The Fund’s underweighting in Information Technology and overweighting in Financials contributed negatively to relative returns to the S&P 500 index. The Fund’s holdings in the Health Care sector contributed positively to relative returns to the S&P 500 Index.
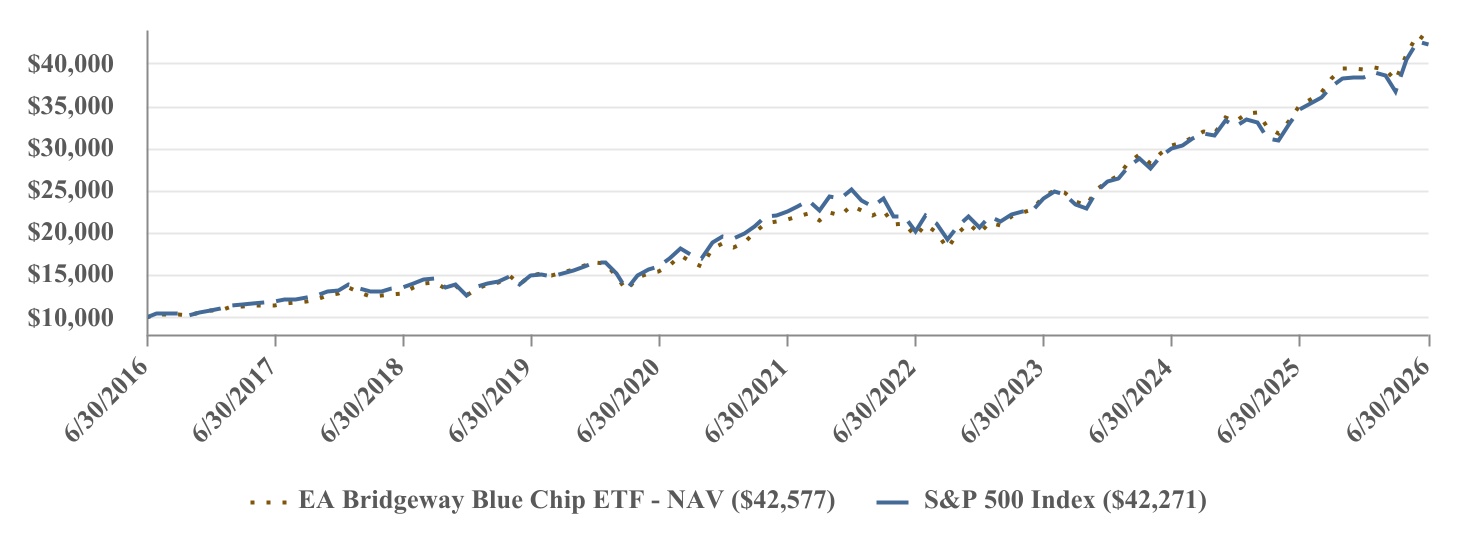
| PERFORMANCE | |||||||||||||||||
| One Year | Five Year | Ten Year | |||||||||||||||
| EA Bridgeway Blue Chip ETF - NAV | 21.62% | 14.62% | 15.59% | ||||||||||||||
| S&P 500 Index | 22.32% | 13.41% | 15.51% | ||||||||||||||
The Fund’s past performance is not a good predictor of how the Fund will perform in the future. The graph and table do not reflect the deduction of taxes that a shareholder would pay on Fund distributions or redemption of Fund shares. The Fund converted from a mutual fund to an ETF on October 14, 2022. The Fund has adopted the mutual fund’s prior performance for the periods before the conversion. Visit https://bridgewayetfs.com/bblu/ for more recent performance information. | |||||||||||||||||
| KEY FUND STATISTICS (as of Period End) | ||||||||||||||||||||
| Net Assets | $429,620,766 | Portfolio Turnover Rate* | 13% | |||||||||||||||||
| # of Portfolio Holdings | 38 | Fund Advisory Fees Paid | $530,749 | |||||||||||||||||
| *Portfolio turnover is not annualized and is calculated without regard to short-term securities having a maturity of less than one year. Excludes impact of in-kind transactions. | ||||||||||||||||||||
| SECTOR WEIGHTING (as a % of Net Assets) | |||||
| Information Technology | 28.4% | ||||
| Financials | 16.2% | ||||
| Health Care | 14.3% | ||||
| Communication Services | 13.8% | ||||
| Consumer Discretionary | 9.9% | ||||
| Consumer Staples | 9.9% | ||||
| Energy | 4.9% | ||||
| Industrials | 2.5% | ||||
| Cash and Cash Equivalents | 0.1% | ||||
| TOP 10 HOLDINGS (as a % of Net Assets) | |||||
| Advanced Micro Devices, Inc. | 4.0% | ||||
| Broadcom, Inc. | 4.0% | ||||
| NVIDIA Corp. | 3.8% | ||||
| Jpmorgan Chase & Co. | 3.7% | ||||
| UnitedHealth Group, Inc. | 3.6% | ||||
| Apple, Inc. | 3.4% | ||||
| Cisco Systems, Inc. | 3.3% | ||||
| Eli Lilly & Co. | 3.0% | ||||
| Johnson & Johnson | 2.8% | ||||
| Bank of America Corp. | 2.5% | ||||
This annual shareholder report contains important information about the EA Bridgeway Omni Small-Cap Value ETF (the “Fund”) for the period of July 1, 2025 to June 30, 2026 (the “Period”). You can find additional information about the Fund at https://bridgewayetfs.com/bsvo/. You can also request this information by contacting us at (215) 330-4476. For information regarding your Fund shares or account, including account balances, transactions, or distributions, please contact your financial intermediary. | |||||||||||
Availability of Additional Information
For additional information about the Fund, including its prospectus, financial information, holdings, and proxy information, visit https://bridgewayetfs.com/bsvo/. You can also request information by calling (215) 330-4476.
Householding
Householding is an option available to certain investors of the Fund. Householding is a method of delivery, based on the preference of the individual investor, in which a single copy of certain shareholder documents can be delivered to investors who share the same address, even if their accounts are registered under different names. Householding for the Fund is available through certain broker-dealers. If you are interested in enrolling in householding and receiving a single copy of prospectuses and other shareholder documents or you are currently enrolled in householding and wish to change your householding status, please contact your broker-dealer.
| WHAT WERE THE FUND COSTS FOR THE PERIOD? (based on a hypothetical $10,000 investment) | |||||||||||
| COST OF $10,000 INVESTMENT | COST PAID AS A PERCENTAGE OF $10,000 INVESTMENT | ||||||||||
| $55 | 0.45% | ||||||||||
| WHAT FACTORS INFLUENCED PERFORMANCE FOR THE PERIOD? | |||||||||||
The Fund returned 45.40% (NAV) for the Period vs 22.82% for the Russell 3000 Index and 43.01% for the Russell 2000 Value Index.
The Fund’s small-cap focus contributed positively to returns relative to the Russell 3000 Index. The Fund’s focus on smaller market capitalization stocks within the small-cap value universe contributed positively to returns relative to the Russell 2000 Value Index during the Period. By design, the Fund does not invest in REITs and Utilities, which also contributed positively as REITs and Utilities performed poorly. The Fund’s focus on deeper value stocks across multiple valuation metrics contributed negatively to returns relative to the Russell 2000 Value Index during the Period.
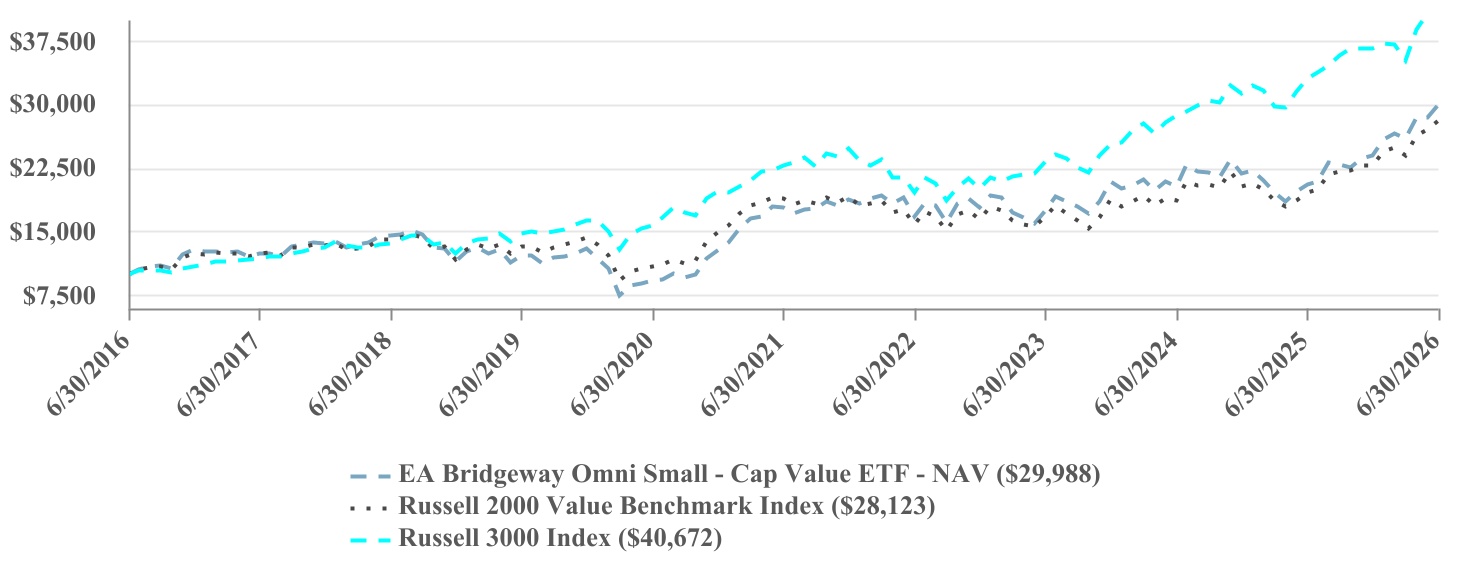
| PERFORMANCE | |||||||||||||||||
| One Year | Five Year | Ten Year | |||||||||||||||
| EA Bridgeway Omni Small-Cap Value ETF - NAV | 45.40% | 10.93% | 11.61% | ||||||||||||||
| Russell 3000 Index | 22.82% | 12.31% | 15.06% | ||||||||||||||
| Russell 2000 Value Index | 43.01% | 8.23% | 10.89% | ||||||||||||||
| The Russell 3000 Index is provided as a broad measure of market performance. The Russell 2000 Value Index is provided as a measure of the Fund’s investment strategy and universe. | |||||||||||||||||
The Fund’s past performance is not a good predictor of how the Fund will perform in the future. The graph and table do not reflect the deduction of taxes that a shareholder would pay on Fund distributions or sale of Fund shares. The Fund converted from a mutual fund to an ETF on March 10, 2023. The Fund has adopted the mutual fund’s prior performance for the periods before the conversion. Visit https://bridgewayetfs.com/bsvo/ for more recent performance information. | |||||||||||||||||
| KEY FUND STATISTICS (as of Period End) | ||||||||||||||||||||
| Net Assets | $2,387,541,005 | Portfolio Turnover Rate* | 19% | |||||||||||||||||
| # of Portfolio Holdings | 638 | Fund Advisory Fees Paid | $8,504,318 | |||||||||||||||||
| *Portfolio turnover is not annualized and is calculated without regard to short-term securities having a maturity of less than one year. Excludes impact of in-kind transactions. | ||||||||||||||||||||
| TOP 10 SECTORS (as a % of Net Assets) | |||||
| Financials | 35.3% | ||||
| Consumer Discretionary | 15.9% | ||||
| Energy | 13.6% | ||||
| Industrials | 12.7% | ||||
| Information Technology | 4.9% | ||||
| Communication Services | 4.7% | ||||
| Materials | 4.7% | ||||
| Consumer Staples | 4.1% | ||||
| Health Care | 3.7% | ||||
| Real Estate | 0.3% | ||||
| TOP 10 HOLDINGS (as a % of Net Assets) | |||||
| Viasat, Inc. | 1.1% | ||||
| Victoria's Secret & Co. | 1.0% | ||||
| Sphere Entertainment Co. | 0.8% | ||||
| Enova International, Inc. | 0.8% | ||||
| Bread Financial Holdings, Inc. | 0.8% | ||||
| Tutor Perini Corp. | 0.7% | ||||
| Benchmark Electronics, Inc. | 0.7% | ||||
| Callaway Golf Co. | 0.7% | ||||
| WesBanco, Inc. | 0.7% | ||||
| BankUnited, Inc. | 0.7% | ||||