Shareholder Report
Jun. 30, 2026
USD ($)
holding
Jun. 30, 2025
Jun. 30, 2026
USD ($)
holding
This annual shareholder report contains important information about the RACWI US ETF (the “Fund”) for the period of September 11, 2025 to June 30, 2026 (the “Period”). You can find additional information about the Fund at https://rafietfs.com/raus-etf/. You can also request this information by contacting us at (215) 330-4476. For information regarding your Fund shares or account, including account balances, transactions, or distributions, please contact your financial intermediary. | |||||||||||
Availability of Additional Information
For additional information about the Fund, including its prospectus, financial information, holdings, and proxy information, visit https://rafietfs.com/raus-etf/. You can also request information by calling (215) 330-4476.
Householding
Householding is an option available to certain investors of the Fund. Householding is a method of delivery, based on the preference of the individual investor, in which a single copy of certain shareholder documents can be delivered to investors who share the same address, even if their accounts are registered under different names. Householding for the Fund is available through certain broker-dealers. If you are interested in enrolling in householding and receiving a single copy of prospectuses and other shareholder documents or you are currently enrolled in householding and wish to change your householding status, please contact your broker-dealer.
| WHAT WERE THE FUND COSTS FOR THE PERIOD?* (based on a hypothetical $10,000 investment) | |||||||||||
| COST OF $10,000 INVESTMENT | COST PAID AS A PERCENTAGE OF $10,000 INVESTMENT | ||||||||||
| $0 | 0.00% | ||||||||||
| WHAT FACTORS INFLUENCED PERFORMANCE FOR THE PERIOD? | |||||||||||
For the reporting period ended June 30, 2026, the Fund generated a positive absolute return as markets appreciated, outperforming its benchmark, the Solactive GBS United States Large & Mid Cap Index. During the Period, U.S. equity market leadership broadened beyond a narrow group of large-cap growth stocks, particularly those trading at elevated valuations. The Fund benefited from this shift, as its fundamentals-driven constituent selection process resulted in lower exposure to many of these highly valued companies.
Outperformance was driven primarily by the Fund’s fundamentals-driven selection methodology, particularly within the Technology sector. Additional contributions came from several other sectors, including Communications, Consumer Cyclical, Healthcare, and Financials. As investors became more selective toward companies with elevated valuations, market performance broadened, benefiting companies with stronger underlying fundamentals and more reasonable valuations. The Fund's methodology was well positioned for this shift in market leadership. Modest underperformance arose from holdings within the Industrials, Consumer Non-Cyclical, and Utilities sectors.
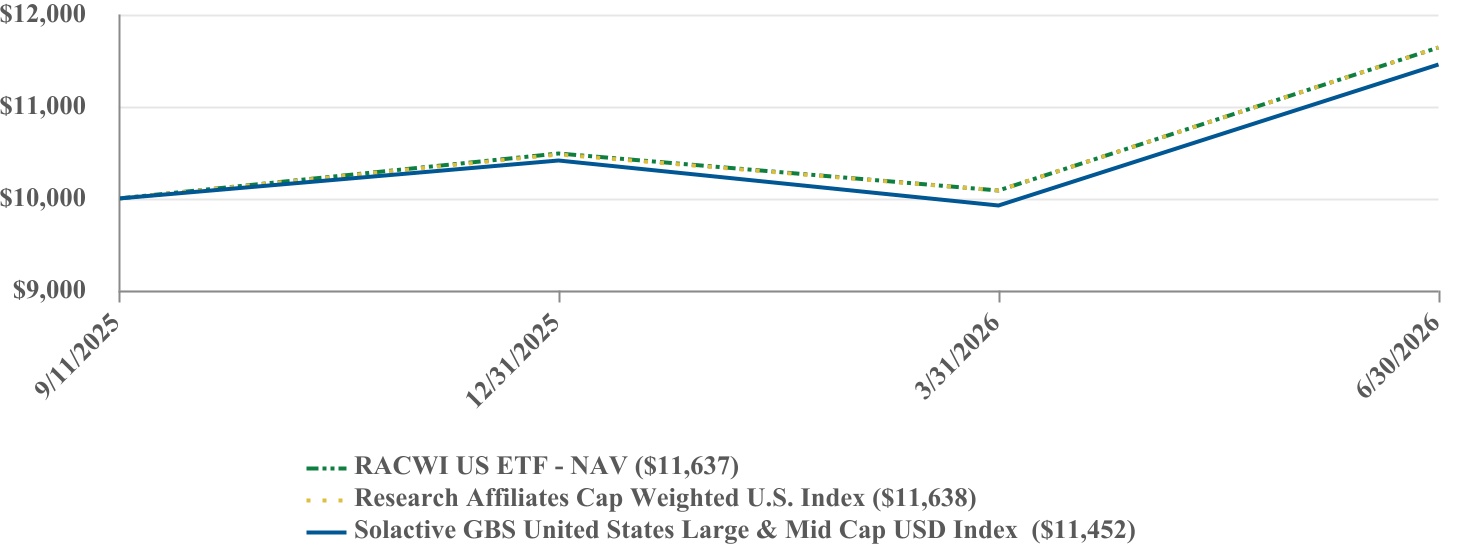
| PERFORMANCE | ||||||||
| Since Inception (9/11/2025) | ||||||||
| RACWI US ETF - NAV | 16.37% | |||||||
| Research Affiliates Cap Weighted U.S. Index | 16.38% | |||||||
| Solactive GBS United States Large & Mid Cap USD Index | 14.52% | |||||||
The Fund’s past performance is not a good predictor of how the Fund will perform in the future. The graph and table do not reflect the deduction of taxes that a shareholder would pay on fund distributions or redemption of fund shares. | ||||||||
Visit https://rafietfs.com/raus-etf/ for more recent performance information. | ||||||||
| KEY FUND STATISTICS (as of Period End) | ||||||||||||||||||||
| Net Assets | $55,105,085 | Fund Advisory Fees | $39,293 | |||||||||||||||||
| # of Portfolio Holdings | 518 | Fees Waived and/or Expenses Reimbursed | $(39,293) | |||||||||||||||||
| Portfolio Turnover Rate* | 2% | Net Fund Advisory Fees Paid | $0 | |||||||||||||||||
| *Portfolio turnover is not annualized and is calculated without regard to short-term securities having a maturity of less than one year. Excludes impact of in-kind transactions. | ||||||||||||||||||||
| SECTOR WEIGHTING (as a % of Net Assets) | |||||
| Information Technology | 37.0% | ||||
| Financials | 11.9% | ||||
| Communication Services | 9.8% | ||||
| Consumer Discretionary | 9.6% | ||||
| Health Care | 8.9% | ||||
| Industrials | 8.6% | ||||
| Consumer Staples | 4.7% | ||||
| Energy | 3.2% | ||||
| Utilities | 2.2% | ||||
| Materials | 2.0% | ||||
| Real Estate | 1.7% | ||||
| Cash and Cash Equivalents | 0.4% | ||||
| TOP 10 HOLDINGS (as a % of Net Assets) | |||||
| NVIDIA Corp. | 7.5% | ||||
| Apple, Inc. | 6.7% | ||||
| Alphabet, Inc. - Class A | 6.0% | ||||
| Microsoft Corp. | 4.4% | ||||
| Amazon.com, Inc. | 3.7% | ||||
| Broadcom, Inc. | 2.8% | ||||
| Tesla, Inc. | 2.2% | ||||
| Micron Technology, Inc. | 2.1% | ||||
| Meta Platforms, Inc. - Class A | 2.0% | ||||
| Eli Lilly & Co. | 1.6% | ||||
This annual shareholder report contains important information about the Research Affiliates Deletions ETF (the “Fund”) for the period of July 1, 2025 to June 30, 2026 (the “Period”). You can find additional information about the Fund at https://rafietfs.com/nixt-etf/. You can also request this information by contacting us at (215) 330-4476. For information regarding your Fund shares or account, including account balances, transactions, or distributions, please contact your financial intermediary. | |||||||||||
Availability of Additional Information
For additional information about the Fund, including its prospectus, financial information, holdings, and proxy information, visit https://rafietfs.com/nixt-etf/. You can also request information by calling (215) 330-4476.
Householding
Householding is an option available to certain investors of the Fund. Householding is a method of delivery, based on the preference of the individual investor, in which a single copy of certain shareholder documents can be delivered to investors who share the same address, even if their accounts are registered under different names. Householding for the Fund is available through certain broker-dealers. If you are interested in enrolling in householding and receiving a single copy of prospectuses and other shareholder documents or you are currently enrolled in householding and wish to change your householding status, please contact your broker-dealer.
| WHAT WERE THE FUND COSTS FOR THE PERIOD? (based on a hypothetical $10,000 investment) | |||||||||||
| COST OF $10,000 INVESTMENT | COST PAID AS A PERCENTAGE OF $10,000 INVESTMENT | ||||||||||
| $19 | 0.16% | ||||||||||
| WHAT FACTORS INFLUENCED PERFORMANCE FOR THE PERIOD? | |||||||||||
For the 12-month period ended June 30, 2026, the Fund generated a positive absolute return as markets appreciated, outperforming its benchmark, the Solactive GBS United States All Cap Index. During the reporting period, U.S. equity market leadership broadened beyond a narrow group of large-cap growth stocks, resulting in stronger performance from value-oriented and smaller-cap companies. This shift benefited the NIXT strategy, which systematically targets companies recently deleted from traditional large- and mid-cap indices. These deleted companies are typically smaller-cap value stocks, a segment that outperformed over the period.
The Fund's outperformance was driven primarily by its exposure to smaller-cap value stocks, which benefited as investors broadened their focus beyond the narrow group of mega-cap technology companies that had led the market in prior years. As investor interest expanded to a wider range of companies, many smaller-cap stocks, particularly those trading at attractive valuations following extended periods of underperformance, experienced strong gains. Relative detractors to performance arose from the Fund's holdings within the Industrials sector, as well as a collection of large technology names held within the benchmark and excluded from the Fund.
| PERFORMANCE OF A HYPOTHETICAL $10,000 INVESTMENT | |||||||||||
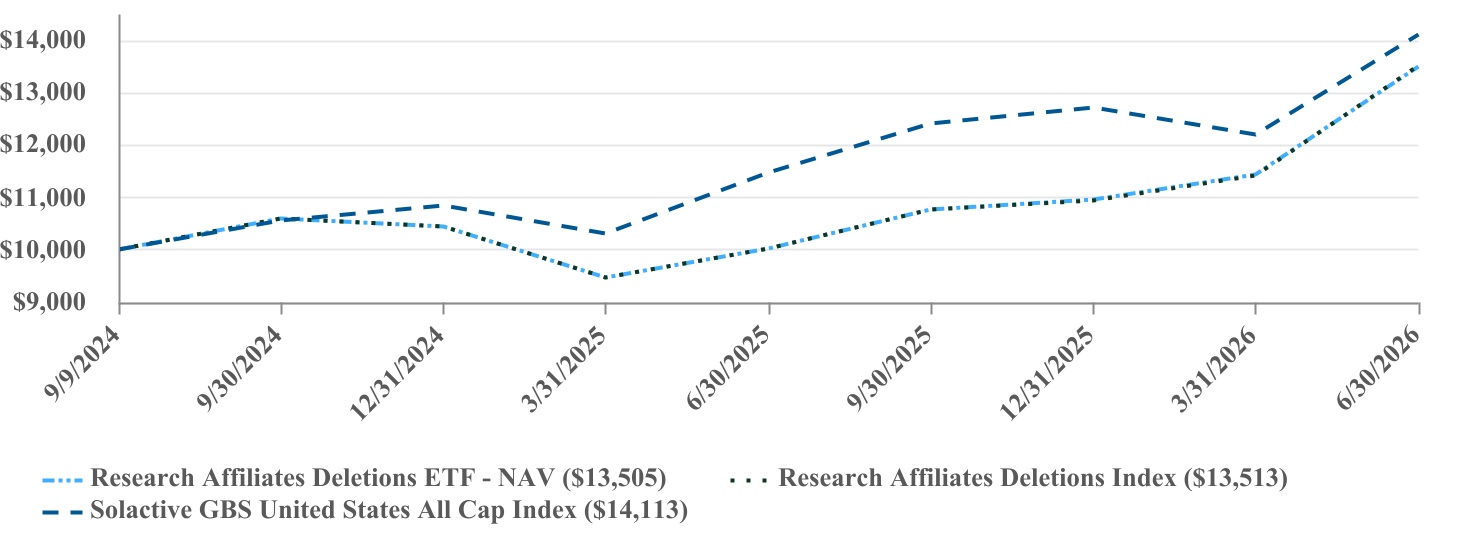
| PERFORMANCE | ||||||||||||||
| One Year | Since Inception (9/9/2024) | |||||||||||||
| Research Affiliates Deletions ETF - NAV | 34.81% | 18.11% | ||||||||||||
| Research Affiliates Deletions Index | 34.93% | 18.15% | ||||||||||||
| Solactive GBS United States All Cap Index | 23.05% | 21.02% | ||||||||||||
The Fund’s past performance is not a good predictor of how the Fund will perform in the future. The graph and table do not reflect the deduction of taxes that a shareholder would pay on fund distributions or redemption of fund shares. | ||||||||||||||
Visit https://rafietfs.com/nixt-etf/ for more recent performance information. | ||||||||||||||
| KEY FUND STATISTICS (as of Period End) | ||||||||||||||||||||
| Net Assets | $39,177,612 | Fund Advisory Fees | $137,412 | |||||||||||||||||
| # of Portfolio Holdings | 209 | Fees Waived and/or Expenses Reimbursed | $(82,192) | |||||||||||||||||
| Portfolio Turnover Rate* | 59% | Net Fund Advisory Fees Paid | $55,220 | |||||||||||||||||
| *Portfolio turnover is not annualized and is calculated without regard to short-term securities having a maturity of less than one year. Excludes impact of in-kind transactions. | ||||||||||||||||||||
| SECTOR WEIGHTING (as a % of Net Assets) | |||||
| Consumer Discretionary | 20.6% | ||||
| Information Technology | 19.1% | ||||
| Health Care | 18.4% | ||||
| Industrials | 9.4% | ||||
| Consumer Staples | 7.7% | ||||
| Communication Services | 6.8% | ||||
| Financials | 6.1% | ||||
| Real Estate | 5.3% | ||||
| Materials | 4.9% | ||||
| Energy | 1.2% | ||||
| Utilities | 0.4% | ||||
| Cash and Cash Equivalents | 0.1% | ||||
| TOP 10 HOLDINGS (as a % of Net Assets) | |||||
| Okta, Inc. | 0.9% | ||||
| Tenable Holdings, Inc. | 0.8% | ||||
| Maravai LifeSciences Holdings, Inc. - Class A | 0.8% | ||||
| Integra LifeSciences Holdings Corp. | 0.8% | ||||
| Insight Enterprises, Inc. | 0.8% | ||||
| Qualys, Inc. | 0.7% | ||||
| Moderna, Inc. | 0.7% | ||||
| Newell Brands, Inc. | 0.7% | ||||
| Enphase Energy, Inc. | 0.7% | ||||
| Iridium Communications, Inc. | 0.7% | ||||