http://fasb.org/us-gaap/2026#OtherComprehensiveIncomeLossCashFlowHedgeGainLossAfterReclassificationAndTaxParenthttp://fasb.org/us-gaap/2026#OtherComprehensiveIncomeLossCashFlowHedgeGainLossAfterReclassificationAndTaxParenthttp://fasb.org/us-gaap/2026#OtherComprehensiveIncomeLossCashFlowHedgeGainLossAfterReclassificationAndTaxParenthttp://fasb.org/us-gaap/2026#EmployeeRelatedLiabilitiesCurrenthttp://fasb.org/us-gaap/2026#EmployeeRelatedLiabilitiesCurrenthttp://fasb.org/us-gaap/2026#AccruedReclamationCostsCurrenthttp://fasb.org/us-gaap/2026#AccruedReclamationCostsCurrenthttp://fasb.org/us-gaap/2026#MineReclamationAndClosingLiabilityNoncurrenthttp://fasb.org/us-gaap/2026#MineReclamationAndClosingLiabilityNoncurrenthttp://fasb.org/us-gaap/2026#ComprehensiveIncomeNetOfTaxhttp://fasb.org/us-gaap/2026#ComprehensiveIncomeNetOfTaxhttp://fasb.org/us-gaap/2026#ComprehensiveIncomeNetOfTaxhttp://fasb.org/us-gaap/2026#LiabilitiesCurrenthttp://fasb.org/us-gaap/2026#LiabilitiesCurrenthttp://fasb.org/us-gaap/2026#Liabilitieshttp://fasb.org/us-gaap/2026#Liabilitieshttp://fasb.org/us-gaap/2026#PropertyPlantAndEquipmentNethttp://fasb.org/us-gaap/2026#PropertyPlantAndEquipmentNethttp://fasb.org/us-gaap/2026#LiabilitiesCurrenthttp://fasb.org/us-gaap/2026#LiabilitiesCurrenthttp://fasb.org/us-gaap/2026#OtherComprehensiveIncomeLossCashFlowHedgeGainLossAfterReclassificationAndTaxParenthttp://fasb.org/us-gaap/2026#OtherComprehensiveIncomeLossCashFlowHedgeGainLossAfterReclassificationAndTaxParenthttp://fasb.org/us-gaap/2026#OtherComprehensiveIncomeLossCashFlowHedgeGainLossAfterReclassificationAndTaxParenthttp://fasb.org/us-gaap/2026#Liabilitieshttp://fasb.org/us-gaap/2026#Liabilities
EXHIBIT 99.1
Item 1. Business
For information regarding the organization of our business segments and our significant customers, see Note 5 of Notes to Consolidated Financial Statements.
Information set forth in Items 1A and 2 below are incorporated by reference into this Item 1.
Introduction
Hecla Mining Company and its subsidiaries have provided precious and base metals to the U.S. and the world since 1891 (in this report, “we” or “our” or “us” refers to Hecla Mining Company and our affiliates and subsidiaries, unless the context requires otherwise). We discover, acquire, and develop mines and other mineral interests and produce and market (i) concentrates containing silver, gold, lead, zinc, and copper, and (ii) unrefined doré containing silver and gold. In doing so, we intend to manage our business activities in a safe, environmentally responsible and cost-effective manner.
The silver, zinc, precious metals concentrates, we produce are sold to custom smelters, metal traders, and third-party processors, and the unrefined doré we produce is sold to refiners or further refined before sale of the metals to traders. We are organized and managed in three segments that encompass our operating mines and significant assets being Greens Creek, Lucky Friday, and Keno Hill.
Our current business strategy is to focus our financial and human resources in the following areas:
•operating our properties safely, in an environmentally responsible and cost-effective manner;
•strengthening our balance sheet to preserve our financial position in varying metals price and operational environments, improve our capital allocation framework with a focus on Return On Invested Capital ("ROIC"), and generate free cash flow;
•improving and optimizing operations at all sites, which includes incurring costs for new technologies and equipment, and implementing standardized systems and processes;
•optimizing our asset portfolio and identification of growth opportunities;
•expanding our proven and probable reserves, mineral resources, and production capacity at our properties;
•advancing the development and ramp-up of the Keno Hill mine to commercial production and sustained profitability;
•seeking opportunities to acquire and invest in mining and exploration properties and companies;
•advancing permitting of the Libby Exploration project in Montana (50 miles from Lucky Friday);
•enhancing our ESG performance and risk management systems;
•building high-performing teams and strengthening our organizational capabilities; and
•maintaining and investing in exploration and pre-development projects in the vicinities of mining districts and projects we believe to be under-explored and under-invested: Greens Creek on Alaska's Admiralty Island located near Juneau; North Idaho's Silver Valley in the historic Coeur d'Alene Mining District; our projects located in two districts in Nevada; our projects in the Keno Hill mining district in the Yukon Territory, Canada; northwestern Montana; and the Republic Mining District in Washington state.
On March 25, 2026, we completed the sale of our Hecla Quebec Inc. ("Hecla Quebec") subsidiary which owned the Casa Berardi mine to Orezone Gold Corporation ("Orezone") for total consideration with a fair value of $385.7 million ($602.2 million on an undiscounted basis) comprised of the following:
•Cash of $170.0 million upon closing on March 25, 2026
•Accounts receivable related to working capital adjustments of $16.6 million
•65,757,265 Orezone common shares valued at $106.1 million on closing
•Deferred cash consideration ("Deferred Cash Consideration") with a fair value of $57.1 million for the cash payments of $30 million and $50 million to be received 18 months and 30 months after closing, respectively
•Contingent cash consideration ("Contingent Cash Consideration") with a fair value of $35.9 million for a total of up to $241 million of undiscounted payments consisting of:
oA fair value of $3.3 million for two annual gold-price related payments of $5 million each should the average gold price exceed $4,200/oz for the first and second years following closing
oA fair value of $9.9 million for two contingent payments of $10 million each due upon issuance of certain permits to open pit mine two additional identified orebodies
oA fair value of $22.7 million for certain future gold production-based royalty payments with an undiscounted value of up to $211 million ($80/ounce for the first 500,000 ounces, then $180/ounce thereafter from future open pit operations)
Orezone has a set-off right to reduce the unpaid balance of the Deferred Cash Consideration by 50% of the amount by which the financial assurance required by the Quebec government under the updated Casa Berardi closure plan exceeds $150 million, excluding increases caused by Orezone's post-closing actions. Our current estimate of that excess of $11.5 million has been included in determining the fair value of the Deferred Cash Consideration.
The sale of Hecla Quebec represents disciplined portfolio optimization and focuses capital allocation on our silver assets, which we believe to represent significant growth and value creation opportunities. We have increased our revenue exposure to silver and we are focused on operating in what we view to be the most favorable jurisdictions. We used the cash proceeds from the transaction for debt reduction and balance sheet strengthening, enhancing our financial flexibility and capacity to invest in strategic growth investments.
We determined that the sale of Hecla Quebec represents a strategic shift that has a major effect on our operations and financial results and therefore, the Casa Berardi operation is no longer a reportable segment and its financial results are reflected in the Company’s audited consolidated financial statements as a discontinued operation for all periods presented. Unless otherwise specified, the discussion of financial results within Item 7. Management’s Discussion and Analysis of Consolidated Financial Condition and Results of Operations ("MD&A"), as well as the Consolidated Financial Statements and Notes will focus on our continuing operations, in relation to the respective comparative periods which have been recast to reflect the continuing operations of our business.
Metals Prices
Our operating results are substantially dependent upon the prices of silver, gold, lead, and zinc, which can fluctuate widely. The volatility of such prices is illustrated in the following table, which sets forth our average realized prices and the high, low, and average daily closing market prices for silver, gold, lead, zinc, and copper over the last three years. The sources for the market prices are the London Market Fixing prices from the London Bullion Market Association for silver and gold and the Cash Official prices from the London Metals Exchange for lead, zinc, and copper.
|
|
|
|
|
|
|
|
|
|
|
|
|
|
|
2025 |
|
|
2024 |
|
|
2023 |
|
Silver (per oz.): |
|
|
|
|
|
|
|
|
|
Realized average |
|
$ |
45.25 |
|
|
$ |
28.58 |
|
|
$ |
23.33 |
|
Market average |
|
$ |
39.94 |
|
|
$ |
28.24 |
|
|
$ |
23.39 |
|
Market high |
|
$ |
74.84 |
|
|
$ |
34.51 |
|
|
$ |
26.03 |
|
Market low |
|
$ |
29.41 |
|
|
$ |
22.09 |
|
|
$ |
20.09 |
|
Gold (per oz.): |
|
|
|
|
|
|
|
|
|
Realized average |
|
$ |
3,541 |
|
|
$ |
2,417 |
|
|
$ |
1,936 |
|
Market average |
|
$ |
3,435 |
|
|
$ |
2,387 |
|
|
$ |
1,943 |
|
Market high |
|
$ |
4,449 |
|
|
$ |
2,778 |
|
|
$ |
2,049 |
|
Market low |
|
$ |
2,633 |
|
|
$ |
1,985 |
|
|
$ |
1,811 |
|
Lead (per lb.): |
|
|
|
|
|
|
|
|
|
Realized average |
|
$ |
0.94 |
|
|
$ |
0.97 |
|
|
$ |
1.03 |
|
Market average |
|
$ |
0.89 |
|
|
$ |
0.94 |
|
|
$ |
0.97 |
|
Market high |
|
$ |
0.94 |
|
|
$ |
1.04 |
|
|
$ |
1.06 |
|
Market low |
|
$ |
0.83 |
|
|
$ |
0.86 |
|
|
$ |
0.90 |
|
Zinc (per lb.): |
|
|
|
|
|
|
|
|
|
Realized average |
|
$ |
1.39 |
|
|
$ |
1.37 |
|
|
$ |
1.35 |
|
Market average |
|
$ |
1.30 |
|
|
$ |
1.26 |
|
|
$ |
1.20 |
|
Market high |
|
$ |
1.52 |
|
|
$ |
1.47 |
|
|
$ |
1.59 |
|
Market low |
|
$ |
1.14 |
|
|
$ |
1.04 |
|
|
$ |
1.01 |
|
Copper (per lb.): |
|
|
|
|
|
|
|
|
|
Realized average |
|
$ |
4.75 |
|
|
$ |
4.20 |
|
|
NA |
|
Market average |
|
$ |
4.51 |
|
|
$ |
4.15 |
|
|
NA |
|
Market high |
|
$ |
5.71 |
|
|
$ |
4.90 |
|
|
NA |
|
Market low |
|
$ |
3.89 |
|
|
$ |
3.66 |
|
|
NA |
|
The prices of the metals we produce are affected by numerous factors beyond our control. See Item 1A. Risk Factors – A substantial or extended decline in metals prices would have a material adverse effect on us for information on a number of the factors that can impact prices of the metals we produce. In both 2025 and 2024, our realized average prices for all metals we sold, except lead,
were higher compared to 2024 and 2023, respectively. We are unable to predict fluctuations in prices for metals and have limited control over the timing of our concentrate shipments which also impacts our realized prices. However, we utilize financially-settled forward contracts and financially-settled zero cost collars ("Collars") for the metals we produce with the objective of managing the exposure to changes in prices of those metals contained in our concentrate shipments between the time of sale and final settlement. In addition, at times we utilize financially-settled forward contracts to manage the exposure to changes in prices of zinc and lead contained in our forecasted future concentrate shipments, and Collars and put options to protect gross margin for silver and gold contained in forecasted concentrate or dore shipments. See Note 11 of Notes to Consolidated Financial Statements for more information on our base and precious metal forward contract programs.
A comprehensive discussion of our financial results for the years ended December 31, 2025, 2024, and 2023, individual operation performance and other significant items can be found in Item 7. Management’s Discussion and Analysis of Consolidated Financial Condition and Results of Operations, as well as the Consolidated Financial Statements and Notes thereto.
Products and Segments
Our segments are differentiated by geographic region located in North America. We produce silver, zinc, and precious metals flotation concentrates at Greens Creek and silver and zinc flotation concentrates at Lucky Friday, each of which we sell to custom smelters and metal traders. The flotation concentrates produced at Greens Creek and Lucky Friday contain payable silver, zinc, and lead, and at Greens Creek they also contain payable gold and at times copper. At Greens Creek, we also produce gravity concentrate containing payable silver, gold, and lead. Unrefined bullion (doré) is produced from the gravity concentrate by a third-party processor, and shipped to a refiner before sale of the metals to precious metal traders. Keno Hill is currently in ramp-up and producing silver and precious metal flotation concentrates, but has yet to meet our definition of commercial production. Payable metals are those included in our products which we are paid for by smelters, metal traders, and refiners. Our segments as of December 31, 2025 included:
•Greens Creek located on Admiralty Island, near Juneau, Alaska - 100% owned and has been in production since 1989.
•Lucky Friday located in northern Idaho - 100% owned and has been a producing mine for us since 1958.
•Keno Hill located in the Keno Hill Silver District in Canada's Yukon Territory - 100% owned and was acquired as part of our acquisition of Alexco in September 2022. Production ramp-up commenced in June 2023.
The Casa Berardi operations located in the Abitibi region of northwestern Quebec, Canada were also considered a segment prior to January 2026. The Casa Berardi operations were 100% owned by our former subsidiary Hecla Quebec and had been in production since late 2006. Following the disposal of Hecla Quebec on March 25, 2026, the results of Casa Berardi are reported as a discontinued operation for all periods presented.
The contributions to our total metals sales by our significant operations in 2025 were 57.6% from Greens Creek, 28.8% from Lucky Friday, and 13.6% from Keno Hill.
Governmental Regulation
The following is a summary of governmental regulation compliance areas which we believe are significant to our business and may have a material effect on our consolidated financial statements, earnings and/or competitive position.
Health and Safety
We are subject to the regulations of the Mine Safety and Health Administration (“MSHA”) in the United States, the Commission of Labor Standards, Pay Equity and Occupational Health and Safety in Quebec, Workers' Safety and Compensation Board in the Yukon and the Mexico Ministry of Economy and Mining, and work with these agencies to address issues outlined in any investigations and inspections and continue to evaluate our safety practices. We strive to achieve excellent mine safety and health performance, and attempt to implement reasonable best practices with respect to mine safety and emergency preparedness. Achieving and maintaining compliance with regulations is challenging and may increase our operating costs. See Human Capital - Health and Safety below and Item 1A. Risk Factors – We face substantial governmental regulation, including in the United States the Mine Safety and Health Act, various environmental laws and regulations and the 1872 Mining Law.
Environmental
Our operations are subject to various environmental laws and regulations at the federal and state/provincial/territorial level. Compliance with environmental regulations, and litigation based on environmental laws and regulations, involves significant costs and can threaten existing operations or constrain expansion opportunities. For example, since acquiring the Keno Hill mine in September 2022, the site has experienced permit exceedances involving the quality of water discharged into the environment. We are working to assess and improve the existing infrastructure and the environmental management system that was put in place by the previous owners. As part of this process, we have submitted plans to the Yukon Department of Energy, Mines and Resources to upgrade the water treatment plant at the Bermingham mine within our Keno Hill operations and in the interim have made other upgrades to water treatment at the site. See Note 17 of Notes to Consolidated Financial Statements.
Keno Hill is located in a region of the Yukon Territory where extensive historical mining activity occurred. The mining claims and rights that comprise our Keno Hill mine are owned by two of our indirect, wholly-owned subsidiaries, Alexco Keno Hill Mining Company and Elsa Reclamation & Development Company Ltd. (“ERDC”). ERDC and Alexco are parties to the Amended and Restated Subsidiary Agreement (“ARSA”) dated July 18, 2013, among them and Her Majesty the Queen in right of Canada (“Canada”) which addresses the pre-existing environmental condition and the environmental care and maintenance and reclamation of the historical Keno Hill site. Under the ARSA and related documents, ERDC, as a paid contractor for the Federal Government of Canada, is responsible for the development and eventual implementation of the district wide reclamation and closure plan (“Reclamation Plan”) which addresses the historic environmental liabilities of the district from past mining activities pre-dating Hecla’s (and Alexco's) acquisition of the Keno Hill project, as well as for carrying out care and maintenance at various locations within the historical Keno Hill site until the Reclamation Plan is implemented. Hecla’s predecessor, Alexco, previously deposited $10 million Canadian dollars ("CAD") in a trust which funds ERDC’s maximum contribution toward implementing the Reclamation Plan, and agreed to a 1.5% net smelter royalty capped at $4.0 million CAD, with the cap now reached as of December 31, 2025. ERDC receives agreed-to commercial contractor rates when retained by Canada to provide environmental services in the historical Keno Hill site outside the scope of care and maintenance and closure and reclamation planning under the ARSA (in the latter case, for which ERDC receives an annual fee of $900,000 CAD from Canada, adjustable for material changes in scope). The potential liabilities associated with the pre-existing environmental conditions at Keno Hill are indemnified by Canada under the terms and conditions of the ARSA, subject to the requirement for ERDC to develop, permit, and implement the Reclamation Plan, or if Hecla and Canada agree to transfer portions of the historical area to active mining operations within the Keno Hill unit, then such indemnification ceases to the extent of such transferred area. Completing the Reclamation Plan is expected to take approximately 4 more years and is currently estimated to cost approximately $294 million CAD over that time, for which we expect ERDC to be reimbursed for all material costs incurred. However, we are at risk for any variance in timing between expending funds by ERDC and reimbursement by Canada, as well as for any disputed or otherwise non-reimbursed costs (for example if ERDC were to act outside of the scope of the ARSA). In addition, ERDC is responsible for sharing with Canada (i) under certain circumstances, care and maintenance costs pending implementation of the Reclamation Plan, (ii) detailed design and engineering costs to support the Reclamation Plan and (iii) under certain circumstances, post active reclamation costs (i.e. in the event Hecla has brought a historical area with pre-existing environmental conditions into active operations at the Keno Hill unit), which, in each case and in the aggregate, we do not anticipate will have a material impact on our financial results as a whole.
Mine closure and reclamation regulations impose substantial costs on our operations and include requirements that we provide financial assurance supporting those obligations. We currently have $206.3 million of financial assurances, primarily in the form of surety bonds, for anticipated company-wide reclamation. We anticipate approximately $13.4 million in expenditures in 2026 for environmental permit compliance and idle property management. The projected remaining cost for reclamation at the site is included in our accrued reclamation and closure costs liability. See Item 1A. Risk Factors – We face substantial governmental regulation, including in the United States the Mine Safety and Health Act, various environmental laws and regulations and the 1872 Mining Law; Our operations are subject to complex, evolving and increasingly stringent environmental laws and regulations; Compliance with environmental regulations, and litigation based on such regulations, involves significant costs and can threaten existing operations or constrain expansion opportunities; Mine closure and reclamation regulations impose substantial costs on our operations and include requirements that we provide financial assurance supporting those obligations. These costs could significantly increase and we might not be able to provide financial assurance; Our environmental and asset retirement obligations may exceed the provisions we have made; and New federal and state laws, regulations and initiatives could impact our operations.
Licenses, Permits and Claims/Concessions
We are required to obtain various licenses and permits to operate our mines and conduct exploration and reclamation activities. We can only engage in exploration and mining operations in accordance with applicable permits. See Item 1A. Risk Factors – We are required to obtain governmental permits and other approvals in order to conduct mining operations and Legal challenges could prevent exploration projects from being developed or existing mines from future expansion.
In addition, our operations and exploration activities in Canada are conducted pursuant to claims granted by the host government, and are subject to claims renewal and minimum work commitment requirements, which are subject to certain political risks associated with foreign operations. See Item 1A. Risk Factors – Our foreign activities are subject to additional inherent risks, Our operations and
properties in Canada expose us to additional political risks and Certain of our mines and exploration properties are located on land that is or may become subject competing title claims and/or claims of cultural significance.
Taxes and Royalties
We are subject to various taxes and government royalties in the jurisdictions where we operate, including those specific to mining activities. These include: federal income taxes; state/provincial income taxes; county/city and bureau property taxes and sales and use tax in the U.S.; goods and services tax in Canada; mining-specific taxes in Alaska, Idaho, Nevada, and the Yukon; and mining royalties in Alaska, Nevada and Canada. Accrual and payment of taxes and accounting for deferred taxes can involve significant estimates and assumptions and can have a material impact on our consolidated financial statements. Tax rates and the calculations of taxes can change significantly and are influenced by changes in political administrations and other factors. See Item 1A. Risk Factors – Our accounting and other estimates may be imprecise; Our ability to recognize the benefits of deferred tax assets related to net operating loss carryforwards and other items is dependent, among other things, on generating taxable income; Our foreign activities are subject to additional inherent risks; and We face substantial governmental regulation, including in the United States the Mine Safety and Health Act, various environmental laws and regulations and the 1872 Mining Law. Also, see Note 8 of Notes to Consolidated Financial Statements for more information on income and mining taxes.
Physical Assets
Our business is capital intensive and requires ongoing capital investment for the replacement, modernization and expansion of equipment and facilities and to develop new mineral reserves. At December 31, 2025, the book value of our properties, plants, equipment and mine development, net of accumulated depreciation, was approximately $2.1 billion. For more information see Item 7. Management's Discussion and Analysis of Financial Condition and Results of Operations. We maintain insurance policies against property loss and business interruption. However, such insurance contains exclusions and limitations on coverage, and there can be no assurance that claims would be paid under such insurance policies in connection with a particular event. When we do experience insurable losses – such as with the fire at the Lucky Friday in August and September of 2023 – it can take a long period of time before we receive any or all insurance proceeds. See Item 1A. Risk Factors – Our operations may be adversely affected by risks and hazards associated with the mining industry that may not be fully covered by insurance.
Human Capital
As of December 31, 2025, we had approximately 1,378 employees, of which approximately 1,096 were employed in the United States and 282 in Canada. The vast majority of our employees are full-time. Approximately 325 of our employees at Lucky Friday were covered by a collective bargaining agreement.
The attraction, development and retention of people is critical to delivering our business strategy. Key areas of focus for us include:
Health and Safety
The safety and health of our employees is of paramount importance. Our goal is to achieve world-class safety and health performance by promoting a deeply rooted value-based culture of safety and utilizing technology and innovation to continually improve the safety at our operations. We know that employees' and contractors' safety awareness is fundamental to making our workplace as safe as possible. Therefore, we invest in training and workforce development programs that focus on safety first. All employees and contractors receive training that complies with or exceeds the applicable safety and health regulations as set by the governing body in the jurisdiction in which each operation is located. As part of our commitment to safety, we track a variety of safety performance indicators, including injuries, near misses, observations, and equipment damages. Our goal is to reduce safety incidents. Our Total Recordable Injury Frequency Rate (“TRIFR”) is calculated as the number of recordable injuries in the period multiplied by 200,000 hours and divided by the number of hours worked in the period. Company-wide, our TRIFR was 1.69 for 2025, a 13% reduction from 2024.
Compensation and Benefits
We are among the largest private-sector employers in the communities in which we operate providing a compensation and benefits package that attracts, motivates, and retains employees. In addition to competitive base wages, and incentive compensation, we offer retirement benefits, health insurance plans and paid time off.
Retention and Employee Development
We are committed to hiring talented people, developing effective leaders, providing an inclusive workplace and retaining a large portion of the workforce for long periods of time. The mining workforce of the future, like most industries, will see a continual change
in the jobs and skill sets required as we adopt new technologies and make our workplace safer and more efficient. We are also committed to helping employees update their skills. For example, we have long supported the Pathways to Mining Careers program, a career training partnership with the University of Alaska Southeast in Juneau. We also offer a reimbursement program to assist with educational expenses for employees who are interested in furthering their education. Advanced education can improve job performance and increase advancement opportunities for the employee, while providing flexibility to our company by increasing the employee’s knowledge base and skill set.
Typically, annual employee surveys are conducted to gauge employee concerns and morale. The results of the surveys, and any responsive measures, are shared with our Board of Directors. Strategic talent reviews and succession planning reviews are conducted periodically across all business areas, and our training programs are adapted accordingly. The Chief Executive Officer (“CEO”), senior level company leadership and the Board of Directors periodically review our top talent. Creating more opportunities for women and indigenous people are among our priorities for employee development. We also strive to maintain an inclusive workplace and provide periodic training to employees to help meet that goal. Our employees are required to abide by our Code of Conduct, which is provided to employees upon being hired and thereafter annually, and is available on our website, to promote the conduct of our business in a consistently legal and ethical manner. Among other provisions, the Code of Conduct reflects our policy and practice not to discriminate against any employee because of race, color, religion, national origin, sex, sexual orientation, gender identity or expression, age, or physical or other disability. We expect our leaders to set the example by being positive role models and good mentors for our employees.
Our head of Human Resources is responsible for developing and executing our human capital strategy. The position is an executive-level position to reflect the priority we place on utilizing our human capital resources to meet our business strategy.
Available Information
Hecla Mining Company is a Delaware corporation. Our current holding company structure dates from the incorporation of Hecla Mining Company in 2006 and the renaming of our subsidiary (previously Hecla Mining Company) as Hecla Limited. Our principal executive offices are located at 6500 N. Mineral Drive, Suite 200, Coeur d’Alene, Idaho 83815-9408. Our telephone number is (208) 769-4100. Our web site address is www.hecla.com. Information on our web site is not incorporated into this Annual Report on Form 10-K. We file our annual, quarterly and current reports and any amendments to these reports with the SEC, copies of which are available on our website or from the SEC free of charge (www.sec.gov). Our restated certificate of incorporation, bylaws, charters of our audit, compensation, and governance and social responsibility committees, as well as our Code of Ethics for the Chief Executive Officer and Senior Financial Officers and our Code of Conduct, are also available on our website. In addition, any amendments to our Code of Ethics or waivers granted to our directors and executive officers will be posted on our website. Each of these documents may be periodically revised, so you are encouraged to visit our website for any updated terms. We will provide copies of these materials to stockholders upon request using the above-listed contact information, directed to the attention of Investor Relations, or via e-mail request sent to hmc-info@hecla.com.
We routinely post important information for investors on our web site, www.hecla.com, in the “Investors” section. We also may use our web site as a means of disclosing material, non-public information and for complying with our disclosure obligations under Regulation FD. Accordingly, investors should monitor the Investors section of our web site, in addition to following our press releases, SEC filings, public conference calls, presentations and webcasts. The information contained on, or that may be accessed through, our web site is not incorporated by reference into, and is not a part of, this document.
Item 2. Properties
Note on SEC Mining Disclosure Rules
Information concerning our mining properties in this Annual Report on Form 10-K has been prepared in accordance with the requirements of subpart 1300 of SEC Regulation S-K. Subpart 1300 requires us to disclose our mineral resources, in addition to our mineral reserves, as of the end of our most recently completed fiscal year both in the aggregate and for each of our individually material mining properties.
You are cautioned that mineral resources do not have demonstrated economic value. Mineral resources are subject to further exploration and development, are subject to additional risks, and no assurance can be given that they will eventually convert to future reserves. Inferred Resources, in particular, have a great amount of uncertainty as to their existence and their economic and legal feasibility. Investors are cautioned not to assume that any part or all of the Inferred Resource exists or is economically or legally mineable. See Item 1A. Risk Factors.
Summary
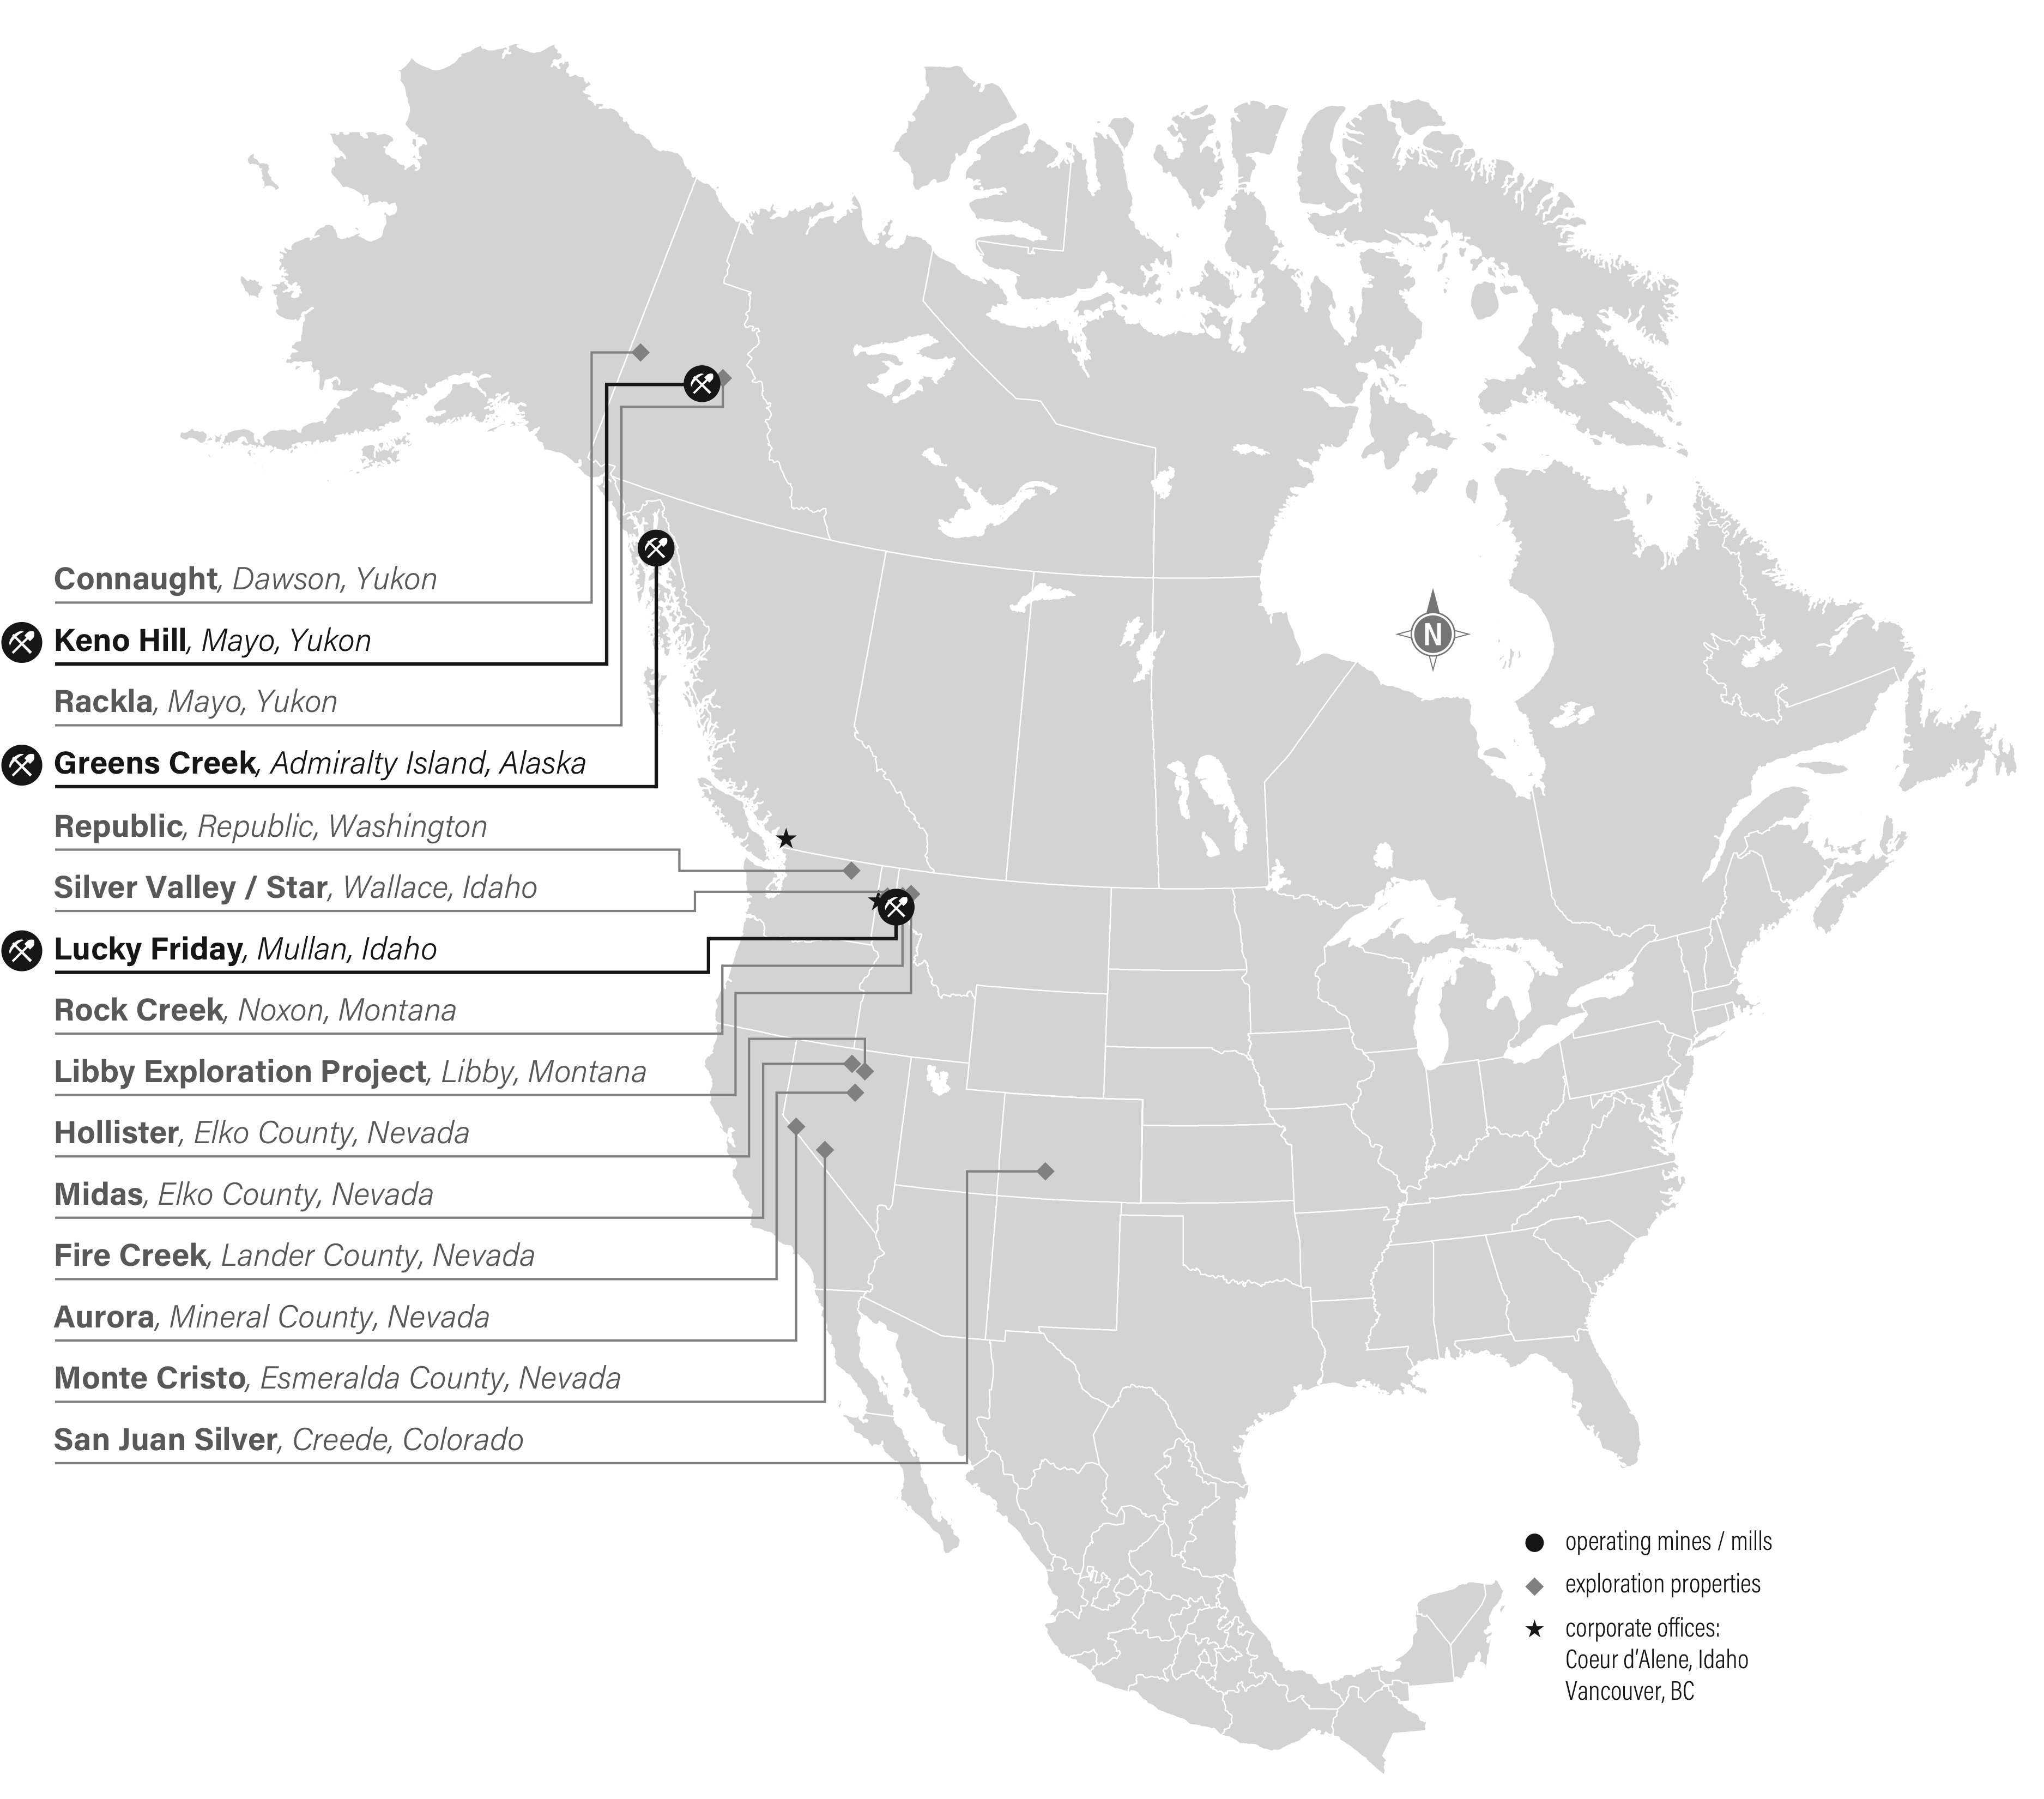
The map below shows the locations of our operations and our exploration projects, as well as our corporate offices located in Coeur d’Alene, Idaho; Vancouver, British Columbia; Juneau, Alaska; Mullan, Idaho; and Whitehorse, Yukon.
The following table summarizes our aggregate metal quantities produced and sold for the last three years:
|
|
|
|
|
|
|
|
|
|
|
|
|
|
|
|
|
|
|
Year Ended December 31, |
|
|
|
|
|
2025 |
|
|
2024 |
|
|
2023 |
|
Silver - |
|
Ounces produced |
|
|
17,004,172 |
|
|
|
16,145,699 |
|
|
|
14,320,448 |
|
|
|
Payable ounces sold |
|
|
15,213,921 |
|
|
|
14,461,604 |
|
|
|
12,932,440 |
|
Gold - |
|
Ounces produced |
|
|
59,349 |
|
|
|
55,275 |
|
|
|
60,896 |
|
|
|
Payable ounces sold |
|
|
46,873 |
|
|
|
45,201 |
|
|
|
50,334 |
|
Lead - |
|
Tons produced |
|
|
56,130 |
|
|
|
52,515 |
|
|
|
40,347 |
|
|
|
Payable tons sold |
|
|
48,727 |
|
|
|
44,795 |
|
|
|
35,429 |
|
Zinc - |
|
Tons produced |
|
|
68,558 |
|
|
|
66,308 |
|
|
|
60,579 |
|
|
|
Payable tons sold |
|
|
47,553 |
|
|
|
47,593 |
|
|
|
43,050 |
|
Copper - |
|
Tons produced |
|
|
1,804 |
|
|
|
1,874 |
|
|
|
1,823 |
|
|
|
Payable tons sold |
|
|
337 |
|
|
|
50 |
|
|
|
— |
|
Hecla is the operator at all mines and exploration properties. Mineral processing plants and related facilities are part of the infrastructure at each operating mine.
|
|
|
|
|
|
|
|
|
|
|
|
|
|
|
|
|
|
|
|
|
A summary overview of our mining operations and exploration and pre-development projects is shown in the following table: |
|
|
Location |
|
|
|
|
|
|
|
|
|
|
|
|
|
|
|
Property |
|
Country |
|
State/Province |
|
Ownership |
|
|
Claims |
|
Permit Conditions |
|
Stage |
|
Mine Type |
|
Commodity |
|
Mineralization Style |
Greens Creek |
|
United States |
|
Alaska |
|
|
100.0 |
% |
|
440 unpatented lode claims, 58 unpatented millsite claims (8,072 acres), 21 patented lode claims and one patented millsite claim (328 acres); Land Exchange Properties (7,301 acres) |
|
Private or USFS administered land, all required permits for production in place |
|
Production |
|
Underground |
|
Ag, Au, Pb, Zn |
|
Massive Sulfide |
Lucky Friday |
|
United States |
|
Idaho |
|
|
100.0 |
% |
|
43 patented lode and millsite claims (710 acres); 53 unpatented lode claims (535 acres) |
|
Private or USFS administered land, all required permits for production in place |
|
Production |
|
Underground |
|
Ag, Pb, Zn |
|
Vein |
Keno Hill |
|
Canada |
|
Yukon |
|
|
100.0 |
% |
|
703 quartz mining leases, 867 quartz mining claims, 2 Crown Grants; (238.12 km2 / 23,812 ha) |
|
All required permits for production in place or in process |
|
Development |
|
Underground |
|
Ag, Au, Pb, Zn |
|
Vein/Fault Zone |
Fire Creek |
|
United States |
|
Nevada |
|
|
100.0 |
% |
|
831 unpatented lode claims (17,175 acres); leases (409 acres); private land (3,208 acres) |
|
BLM administered land, Plan of Operations and other required State permits in place |
|
Exploration |
|
Underground |
|
Au, Ag |
|
Vein |
Hollister |
|
United States |
|
Nevada |
|
|
100.0 |
% |
|
853 unpatented lode claims, 152 leased unpatented lode claims, 11 unpatented mill site claims; 17,960 acres total |
|
BLM administered land, Plan of Operations and other required State permits in place |
|
Exploration |
|
Underground |
|
Au, Ag |
|
Vein |
Midas |
|
United States |
|
Nevada |
|
|
100.0 |
% |
|
1,456 unpatented lode claims, 33 leased unpatented lode claims, (total 27,583 acres unpatented claims); 44 patented lode claims, private land (2,417 acres) |
|
BLM administered land, Plan of Operations and other required State permits in place |
|
Exploration |
|
Underground |
|
Au, Ag |
|
Vein |
San Juan Silver |
|
United States |
|
Colorado |
|
|
100.0 |
% |
|
129 patented lode and millsite claims, fee lands, 704 unpatented lode claims; 13,645 total acres |
|
7 Notice-of-Intent areas for Exploration, Mining Plan of Operations (USFS); 112-d2 mining permit (CO DRMS) |
|
Exploration |
|
Underground |
|
Ag, Pb, Zn |
|
Vein |
Star |
|
United States |
|
Idaho |
|
|
100.0 |
% |
|
174 patented lode and millsite claims; 2,376 total acres |
|
Private land, required permits in place for exploration |
|
Exploration |
|
Underground |
|
Ag, Zn, Pb |
|
Vein |
Monte Cristo |
|
United States |
|
Nevada |
|
|
100.0 |
% |
|
334 unpatented lode claims, 10 leased unpatented lode claims (6,880 acres) |
|
BLM administered land, Notice of Intent required |
|
Exploration |
|
Underground/Open Pit |
|
Au, Ag |
|
Vein |
Rock Creek |
|
United States |
|
Montana |
|
|
100.0 |
% |
|
99 patented lode claims (1,859 acres), 370 unpatented lode claims (6,829 acres), 115 unpatented millsite claims, 5 unpatented tunnel sites; other private land: 754 acres |
|
Private or USFS administered land. Some State permits in-place; no Federal permits. |
|
Exploration |
|
Underground |
|
Ag, Cu |
|
Sediment Hosted - Stratabound |
|
|
|
|
|
|
|
|
|
|
|
|
|
|
|
|
|
|
|
|
|
Libby Exploration |
|
United States |
|
Montana |
|
|
100.0 |
% |
|
2 patented lode claims, 36.84 acres (22.33 in wilderness, 14.51 outside wilderness); 26 unpatented lode claims (537 acres), 854 unpatented mill site claims, 11 unpatented tunnel site claims |
|
Private or USFS administered land. Some State permits in-place; no Federal permits. |
|
Exploration |
|
Underground |
|
Ag, Cu |
|
Sediment Hosted - Stratabound |
Republic |
|
United States |
|
Washington |
|
|
100.0 |
% |
|
114 patented claims and private land; 22 unpatented lode claims, 3 state leases, 2,096 acres surface rights, 3,536 acres of mineral rights |
|
Private, BLM and WA DNR administered lands |
|
Exploration |
|
Underground/Open Pit |
|
Au, Ag |
|
Vein |
Silver Valley |
|
United States |
|
Idaho |
|
|
100.0 |
% |
|
Various exploration properties and claim holdings |
|
Private or USFS administered land |
|
Exploration |
|
Underground |
|
Ag, Zn, Pb |
|
Vein |
Aurora |
|
United States |
|
Nevada |
|
|
100.0 |
% |
|
452 unpatented lode claims, 92 patented lode claims, 25 private parcels; 9,928 total acres |
|
Private or USFS administered land, permit work in progress for USFS lands |
|
Exploration |
|
Underground/Open Pit |
|
Au, Ag |
|
Vein |
Rackla - Tiger |
|
Canada |
|
Yukon |
|
|
100.0 |
% |
|
3,315 quartz mineral claims; 164,547 acres (66,590 ha) |
|
Class 3 Quartz Mining Land Use Approval LQ00531; approved by Yukon Environmental and Socio-economic Assessment Board |
|
Exploration |
|
Open Pit/Underground |
|
Au |
|
Carbonate hosted/replacement - reduced intrusion related |
Rackla - Osiris |
|
Canada |
|
Yukon |
|
100.0% |
|
|
1,478 quartz mineral claims; 74,576 acres (30,180 ha) |
|
Class 4 Quartz Mining Land Use Approval LQ00444; approved by Yukon Environmental and Socio-economic Assessment Board |
|
Exploration |
|
Open Pit/Underground |
|
Au |
|
Carbonate hosted, disseminated (Carlin-style) |
The following table summarizes the in-situ mineral reserves for all properties as of December 31, 2025:
|
|
|
|
|
|
|
|
|
|
|
|
|
|
|
|
|
|
|
Asset |
|
Tons (000) |
|
Silver (oz/ton) |
|
Gold (oz/ton) |
|
Lead % |
|
Zinc % |
|
Silver (000 oz) |
|
Gold (000 oz) |
|
Lead Tons |
|
Zinc Tons |
Proven Reserves: (1) |
|
|
|
|
|
|
|
|
|
|
|
|
|
|
|
|
|
|
Greens Creek (2,3) |
|
13 |
|
23.9 |
|
0.120 |
|
3.0 |
|
7.8 |
|
309 |
|
1 |
|
390 |
|
1,000 |
Lucky Friday (2,4) |
|
4,747 |
|
11.8 |
|
— |
|
7.5 |
|
3.8 |
|
56,096 |
|
— |
|
355,370 |
|
181,180 |
Keno Hill(2,5) |
|
9 |
|
23.5 |
|
— |
|
2.4 |
|
6.2 |
|
235 |
|
— |
|
220 |
|
600 |
Total Proven |
|
4,769 |
|
|
|
|
|
|
|
|
|
56,640 |
|
1 |
|
355,980 |
|
182,780 |
Probable Reserves: (6) |
|
|
|
|
|
|
|
|
|
|
|
|
|
|
|
|
|
|
Greens Creek (2,3) |
|
10,166 |
|
10.4 |
|
0.083 |
|
2.3 |
|
6.3 |
|
105,788 |
|
841 |
|
237,730 |
|
637,130 |
Lucky Friday (2,4) |
|
1,636 |
|
9.5 |
|
— |
|
6.0 |
|
3.7 |
|
15,493 |
|
— |
|
97,590 |
|
60,710 |
Keno Hill(2,5) |
|
2,104 |
|
25.3 |
|
0.007 |
|
2.9 |
|
2.9 |
|
53,172 |
|
16 |
|
61,600 |
|
61,230 |
Total Probable |
|
13,906 |
|
|
|
|
|
|
|
|
|
174,453 |
|
857 |
|
396,920 |
|
759,070 |
Proven and Probable Reserves: (1,6) |
|
|
|
|
|
|
|
|
|
|
|
|
|
|
|
|
|
|
Greens Creek (2,3) |
|
10,179 |
|
10.4 |
|
0.083 |
|
2.3 |
|
6.3 |
|
106,097 |
|
842 |
|
238,120 |
|
638,130 |
Lucky Friday (2,4) |
|
6,383 |
|
11.2 |
|
— |
|
7.1 |
|
3.8 |
|
71,589 |
|
— |
|
452,960 |
|
241,890 |
Keno Hill(2,5) |
|
2,113 |
|
25.3 |
|
0.007 |
|
2.9 |
|
2.9 |
|
53,407 |
|
16 |
|
61,820 |
|
61,830 |
Total Proven and Probable |
|
18,675 |
|
|
|
|
|
|
|
|
|
231,093 |
|
858 |
|
752,900 |
|
941,850 |
(1)The term “reserve” means an estimate of tonnage and grade or quality of indicated and measured mineral resources that, in the opinion of the qualified person, can be the basis of an economically viable project. More specifically, it is the economically mineable part of a measured or indicated mineral resource, which includes diluting materials and allowances for losses that may occur when the material is mined or extracted. The term “proven reserves” means the economically mineable part of a measured mineral resource and can only result from conversion of a measured mineral resource. See footnotes 8 and 9 below.
(2)Mineral reserves are based on $25.00/oz silver, $2,100/oz gold, $0.90/lb lead, $1.15/lb zinc, unless otherwise stated. All Mineral Reserves are reported in-situ with estimates of mining dilution and mining loss.
(3)The reserve NSR cut-off values for Greens Creek are $275/ton for all zones; metallurgical recoveries (actual 2025): 79.3% for silver, 74% for gold, 82.6% for lead, and 88.8% for zinc.
(4)The reserve NSR cut-off values for Lucky Friday are $280/ton for all veins; metallurgical recoveries (actual 2025): 94.5% for silver, 94.3% for lead, and 85.1% for zinc.
(5)The reserve NSR cut-off value at Keno Hill is $336/ton (CAN$500/tonne), Metallurgical recovery (actual 2025): 96.2% for silver, 94% for lead, 81% for zinc; US$/CAN$ exchange rate: 1:1.35.
(6)The term “probable reserves” means the economically mineable part of an indicated and, in some cases, a measured mineral resource. See footnotes 9 and 10 below.
The following table summarizes the in-situ mineral resources (8) for all properties, exclusive of mineral reserves, as of December 31, 2025:
|
|
|
|
|
|
|
|
|
|
|
|
|
|
|
|
|
|
|
|
|
|
|
|
|
|
|
|
|
|
|
|
|
|
|
Asset |
|
Tons (000) |
|
Silver (oz/ton) |
|
Gold (oz/ton) |
|
Lead % |
|
Zinc % |
|
Copper % |
|
Silver (000 oz) |
|
Gold (000 oz) |
|
Lead Tons |
|
Zinc Tons |
|
Copper Tons |
|
Measured Resources: (8) |
|
|
|
|
|
|
|
|
|
|
|
|
|
|
|
|
|
|
|
|
|
|
|
Greens Creek (11,12) |
|
|
— |
|
|
— |
|
|
— |
|
|
— |
|
|
— |
|
|
— |
|
|
— |
|
|
— |
|
|
— |
|
|
— |
|
|
— |
|
Lucky Friday (11,13) |
|
|
1,806 |
|
|
11.8 |
|
|
— |
|
|
7.4 |
|
|
2.1 |
|
|
— |
|
|
21,328 |
|
|
— |
|
|
134,280 |
|
|
37,610 |
|
|
— |
|
Keno Hill (11,14) |
|
|
— |
|
|
— |
|
|
— |
|
|
— |
|
|
— |
|
|
— |
|
|
— |
|
|
— |
|
|
— |
|
|
— |
|
|
— |
|
Fire Creek (15,16) |
|
|
— |
|
|
— |
|
|
— |
|
|
— |
|
|
— |
|
|
— |
|
|
— |
|
|
— |
|
|
— |
|
|
— |
|
|
— |
|
Hollister (15,17) |
|
|
— |
|
|
— |
|
|
— |
|
|
— |
|
|
— |
|
|
— |
|
|
— |
|
|
— |
|
|
— |
|
|
— |
|
|
— |
|
Midas (15,18) |
|
|
— |
|
|
— |
|
|
— |
|
|
— |
|
|
— |
|
|
— |
|
|
— |
|
|
— |
|
|
— |
|
|
— |
|
|
— |
|
Star (11,20) |
|
|
— |
|
|
— |
|
|
— |
|
|
— |
|
|
— |
|
|
— |
|
|
— |
|
|
— |
|
|
— |
|
|
— |
|
|
— |
|
Rackla - Tiger Underground (25) |
|
|
32 |
|
|
— |
|
|
0.060 |
|
|
— |
|
|
— |
|
|
— |
|
|
— |
|
|
2 |
|
|
— |
|
|
— |
|
|
— |
|
Rackla - Tiger Open Pit (25) |
|
|
881 |
|
|
— |
|
|
0.085 |
|
|
— |
|
|
— |
|
|
— |
|
|
— |
|
|
75 |
|
|
— |
|
|
— |
|
|
— |
|
Rackla - Osiris Underground (26) |
|
|
— |
|
|
— |
|
|
— |
|
|
— |
|
|
— |
|
|
— |
|
|
— |
|
|
— |
|
|
— |
|
|
— |
|
|
— |
|
Rackla - Osiris Open Pit (26) |
|
|
— |
|
|
— |
|
|
— |
|
|
— |
|
|
— |
|
|
— |
|
|
— |
|
|
— |
|
|
— |
|
|
— |
|
|
— |
|
Total Measured |
|
|
2,719 |
|
|
|
|
|
|
|
|
|
|
|
|
21,328 |
|
|
77 |
|
|
134,280 |
|
|
37,610 |
|
|
— |
|
|
|
|
|
|
|
|
|
|
|
|
|
|
|
|
|
|
|
|
|
|
|
|
|
|
|
Tons (000) |
|
Silver (oz/ton) |
|
Gold (oz/ton) |
|
Lead% |
|
Zinc% |
|
Copper% |
|
Silver (000 oz) |
|
Gold (000 oz) |
|
Lead Tons |
|
Zinc Tons |
|
Copper Tons |
|
Indicated Resources: (9) |
|
|
|
|
|
|
|
|
|
|
|
|
|
|
|
|
|
|
|
|
|
|
|
Greens Creek (11,12) |
|
|
5,844 |
|
|
15.2 |
|
|
0.112 |
|
|
3.4 |
|
|
8.9 |
|
|
— |
|
|
88,655 |
|
|
653 |
|
|
200,430 |
|
|
522,550 |
|
|
— |
|
Lucky Friday (11,13) |
|
|
1,619 |
|
|
11.9 |
|
|
— |
|
|
6.2 |
|
|
1.5 |
|
|
— |
|
|
19,213 |
|
|
— |
|
|
100,200 |
|
|
24,850 |
|
|
— |
|
Keno Hill (11,14) |
|
|
583 |
|
|
24.1 |
|
|
0.009 |
|
|
2.5 |
|
|
6.3 |
|
|
— |
|
|
14,039 |
|
|
5 |
|
|
14,460 |
|
|
36,710 |
|
|
— |
|
Fire Creek (15,16) |
|
|
186 |
|
|
0.9 |
|
|
0.380 |
|
|
— |
|
|
— |
|
|
— |
|
|
158 |
|
|
71 |
|
|
— |
|
|
— |
|
|
— |
|
Hollister (15,17) |
|
|
95 |
|
|
2.4 |
|
|
0.547 |
|
|
— |
|
|
— |
|
|
— |
|
|
227 |
|
|
52 |
|
|
— |
|
|
— |
|
|
— |
|
Midas (15,18) |
|
|
100 |
|
|
5.3 |
|
|
0.394 |
|
|
— |
|
|
— |
|
|
— |
|
|
536 |
|
|
40 |
|
|
— |
|
|
— |
|
|
— |
|
Star (11,19) |
|
|
375 |
|
|
4.7 |
|
|
— |
|
|
9.9 |
|
|
10.5 |
|
|
— |
|
|
1,744 |
|
|
— |
|
|
37,110 |
|
|
39,330 |
|
|
— |
|
Rackla - Tiger Underground (25) |
|
|
960 |
|
|
— |
|
|
0.079 |
|
|
— |
|
|
— |
|
|
— |
|
|
— |
|
|
76 |
|
|
— |
|
|
— |
|
|
— |
|
Rackla - Tiger Open Pit (25) |
|
|
3,116 |
|
|
— |
|
|
0.100 |
|
|
— |
|
|
— |
|
|
— |
|
|
— |
|
|
311 |
|
|
— |
|
|
— |
|
|
— |
|
Rackla - Osiris Underground (26) |
|
|
927 |
|
|
— |
|
|
0.133 |
|
|
— |
|
|
— |
|
|
— |
|
|
— |
|
|
123 |
|
|
— |
|
|
— |
|
|
— |
|
Rackla - Osiris Open Pit (26) |
|
|
4,843 |
|
|
— |
|
|
0.119 |
|
|
— |
|
|
— |
|
|
— |
|
|
— |
|
|
577 |
|
|
— |
|
|
— |
|
|
— |
|
Total Indicated |
|
|
18,648 |
|
|
|
|
|
|
|
|
|
|
|
|
124,572 |
|
|
1,908 |
|
|
352,200 |
|
|
623,440 |
|
|
— |
|
|
|
|
|
|
|
|
|
|
|
|
|
|
|
|
|
|
|
|
|
|
|
|
|
|
|
Tons (000) |
|
Silver (oz/ton) |
|
Gold (oz/ton) |
|
Lead % |
|
Zinc % |
|
Copper % |
|
Silver (000 oz) |
|
Gold (000 oz) |
|
Lead Tons |
|
Zinc Tons |
|
Copper Tons |
|
Measured and Indicated Resources: |
|
|
|
|
|
|
|
|
|
|
|
|
|
|
|
|
|
|
|
|
|
|
|
Greens Creek (11,12) |
|
|
5,844 |
|
|
15.2 |
|
|
0.11 |
|
|
3.4 |
|
|
8.9 |
|
|
— |
|
|
88,655 |
|
|
653 |
|
|
200,430 |
|
|
522,550 |
|
|
— |
|
Lucky Friday (11,13) |
|
|
3,425 |
|
|
11.8 |
|
|
— |
|
|
6.8 |
|
|
1.8 |
|
|
— |
|
|
40,541 |
|
|
— |
|
|
234,480 |
|
|
62,460 |
|
|
— |
|
Keno Hill (11,14) |
|
|
583 |
|
|
24.1 |
|
|
0.009 |
|
|
2.5 |
|
|
6.3 |
|
|
— |
|
|
14,039 |
|
|
5 |
|
|
14,460 |
|
|
36,710 |
|
|
— |
|
Fire Creek (15,16) |
|
|
186 |
|
|
0.9 |
|
|
0.380 |
|
|
— |
|
|
— |
|
|
— |
|
|
158 |
|
|
71 |
|
|
— |
|
|
— |
|
|
— |
|
Hollister (15,17) |
|
|
95 |
|
|
2.4 |
|
|
0.547 |
|
|
— |
|
|
— |
|
|
— |
|
|
227 |
|
|
52 |
|
|
— |
|
|
— |
|
|
— |
|
Midas (15,18) |
|
|
100 |
|
|
5.3 |
|
|
0.394 |
|
|
— |
|
|
— |
|
|
— |
|
|
536 |
|
|
40 |
|
|
— |
|
|
— |
|
|
— |
|
Star (11,19) |
|
|
375 |
|
|
4.7 |
|
|
— |
|
|
9.9 |
|
|
10.5 |
|
|
— |
|
|
1,744 |
|
|
— |
|
|
37,110 |
|
|
39,330 |
|
|
— |
|
Rackla - Tiger Underground (25) |
|
|
992 |
|
|
— |
|
|
0.079 |
|
|
— |
|
|
— |
|
|
— |
|
|
— |
|
|
78 |
|
|
— |
|
|
— |
|
|
— |
|
Rackla - Tiger Open Pit (25) |
|
|
3,997 |
|
|
— |
|
|
0.097 |
|
|
— |
|
|
— |
|
|
— |
|
|
— |
|
|
386 |
|
|
— |
|
|
— |
|
|
— |
|
Rackla - Osiris Underground (26) |
|
|
927 |
|
|
— |
|
|
0.133 |
|
|
— |
|
|
— |
|
|
— |
|
|
— |
|
|
123 |
|
|
— |
|
|
— |
|
|
— |
|
Rackla - Osiris Open Pit (26) |
|
|
4,843 |
|
|
— |
|
|
0.119 |
|
|
— |
|
|
— |
|
|
— |
|
|
— |
|
|
577 |
|
|
— |
|
|
— |
|
|
— |
|
Total Measured and Indicated |
|
|
21,367 |
|
|
|
|
|
|
|
|
|
|
|
|
145,900 |
|
|
1,985 |
|
|
486,480 |
|
|
661,050 |
|
|
— |
|
|
|
|
|
|
|
|
|
|
|
|
|
|
|
|
|
|
|
|
|
|
|
|
|
|
|
Tons (000) |
|
Silver (oz/ton) |
|
Gold (oz/ton) |
|
Lead % |
|
Zinc % |
|
Copper % |
|
Silver (000 oz) |
|
Gold (000 oz) |
|
Lead Tons |
|
Zinc Tons |
|
Copper Tons |
|
Inferred Resources: (10) |
|
|
|
|
|
|
|
|
|
|
|
|
|
|
|
|
|
|
|
|
|
|
|
Greens Creek (11,12) |
|
|
1,431 |
|
|
16.3 |
|
|
0.107 |
|
|
3.2 |
|
|
8.0 |
|
|
— |
|
|
23,314 |
|
|
153 |
|
|
45,720 |
|
|
113,910 |
|
|
— |
|
Lucky Friday (11,13) |
|
|
2,238 |
|
|
11.6 |
|
|
— |
|
|
8.6 |
|
|
2.9 |
|
|
— |
|
|
26,033 |
|
|
— |
|
|
192,010 |
|
|
65,770 |
|
|
— |
|
Keno Hill (11,14) |
|
|
662 |
|
|
16.7 |
|
|
0.005 |
|
|
1.9 |
|
|
3.8 |
|
|
— |
|
|
11,044 |
|
|
4 |
|
|
12,450 |
|
|
25,350 |
|
|
— |
|
|
|
|
|
|
|
|
|
|
|
|
|
|
|
|
|
|
|
|
|
|
|
|
|
|
|
|
|
|
|
|
|
|
|
|
Fire Creek (15,16) |
|
|
1,108 |
|
|
0.5 |
|
|
0.433 |
|
|
— |
|
|
— |
|
|
— |
|
|
501 |
|
|
479 |
|
|
— |
|
|
— |
|
|
— |
|
Fire Creek - Open Pit (20) |
|
|
74,584 |
|
|
0.1 |
|
|
0.029 |
|
|
— |
|
|
— |
|
|
— |
|
|
5,232 |
|
|
2,178 |
|
|
— |
|
|
— |
|
|
— |
|
Hollister (15,17) |
|
|
821 |
|
|
2.6 |
|
|
0.376 |
|
|
— |
|
|
— |
|
|
— |
|
|
2,145 |
|
|
309 |
|
|
— |
|
|
— |
|
|
— |
|
Midas (15,18) |
|
|
1,665 |
|
|
5.1 |
|
|
0.413 |
|
|
— |
|
|
— |
|
|
— |
|
|
8,466 |
|
|
687 |
|
|
— |
|
|
— |
|
|
— |
|
Star (11,19) |
|
|
667 |
|
|
4.9 |
|
|
— |
|
|
9.4 |
|
|
9.2 |
|
|
— |
|
|
3,245 |
|
|
— |
|
|
62,810 |
|
|
61,440 |
|
|
— |
|
San Juan Silver (11,21) |
|
|
2,310 |
|
|
15.9 |
|
|
0.011 |
|
|
1.4 |
|
|
1.1 |
|
|
— |
|
|
36,760 |
|
|
26 |
|
|
49,270 |
|
|
40,310 |
|
|
— |
|
Monte Cristo (22) |
|
|
576 |
|
|
0.2 |
|
|
0.183 |
|
|
— |
|
|
— |
|
|
— |
|
|
135 |
|
|
106 |
|
|
— |
|
|
— |
|
|
— |
|
Rock Creek (11,23) |
|
|
99,258 |
|
|
1.5 |
|
|
— |
|
|
— |
|
|
— |
|
|
0.7 |
|
|
148,291 |
|
|
— |
|
|
— |
|
|
— |
|
|
656,060 |
|
Libby Exploration (11,24) |
|
|
112,185 |
|
|
1.6 |
|
|
— |
|
|
— |
|
|
— |
|
|
0.7 |
|
|
183,346 |
|
|
— |
|
|
— |
|
|
— |
|
|
759,420 |
|
Rackla - Tiger Underground (25) |
|
|
153 |
|
|
— |
|
|
0.069 |
|
|
— |
|
|
— |
|
|
— |
|
|
— |
|
|
11 |
|
|
— |
|
|
— |
|
|
— |
|
Rackla - Tiger Open Pit (25) |
|
|
30 |
|
|
— |
|
|
0.051 |
|
|
— |
|
|
— |
|
|
— |
|
|
— |
|
|
2 |
|
|
— |
|
|
— |
|
|
— |
|
Rackla - Osiris Underground (26) |
|
|
4,398 |
|
|
— |
|
|
0.117 |
|
|
— |
|
|
— |
|
|
— |
|
|
— |
|
|
515 |
|
|
— |
|
|
— |
|
|
— |
|
Rackla - Osiris Open Pit (26) |
|
|
5,919 |
|
|
— |
|
|
0.089 |
|
|
— |
|
|
— |
|
|
— |
|
|
— |
|
|
529 |
|
|
— |
|
|
— |
|
|
— |
|
Total Inferred |
|
|
308,005 |
|
|
|
|
|
|
|
|
|
|
|
|
448,512 |
|
|
4,999 |
|
|
362,260 |
|
|
306,780 |
|
|
1,415,480 |
|
(7)The term "mineral resources" means a concentration or occurrence of material of economic interest in or on the Earth's crust in such form, grade or quality, and quantity that there are reasonable prospects for economic extraction.. A mineral resource is a reasonable estimate of mineralization, taking into account relevant factors such as cut-off grade, likely mining dimensions, location or continuity, that, with the assumed and justifiable technical and economic conditions, is likely to, in whole or in part, become economically extractable. It is not merely an inventory of all mineralization drilled or sampled.
(8)The term "measured resources" means that part of a mineral resource for which quantity and grade or quality are estimated on the basis of conclusive geological evidence and sampling. The level of geological certainty associated with a measured mineral resource is sufficient to allow a qualified person to apply modifying factors in sufficient detail to support detailed mine planning and final evaluation of the economic viability of the deposit. Because a measured mineral resource has a higher level of confidence than the level of confidence of either an indicated mineral resource or an inferred mineral resource, a measured mineral resource may be converted to a proven mineral reserve or to a probable mineral reserve.
(9)The term "indicated resources" means that part of a mineral resource for which quantity and grade or quality are estimated on the basis of adequate geological evidence and sampling. The level of geological certainty associated with an indicated mineral resource is sufficient to allow a qualified person to apply modifying factors in sufficient detail to support mine planning and evaluation of the economic viability of the deposit. Because an indicated mineral resource has a lower confidence level than a measured mineral resource, an indicated mineral resource may only be converted to a probable mineral reserve.
(10)The term "inferred resources" means that part of a mineral resource for which quantity and grade or quality are estimated on the basis of limited geological evidence and sampling. The level of geological uncertainty associated with an inferred mineral resource is too high to apply relevant technical and economic factors likely to influence the prospects of economic extraction in a manner useful for evaluation of economic viability. Because an inferred mineral resource has the lowest level of geological confidence of all mineral resources, which prevents the application of the modifying factors in a manner useful for evaluation of economic viability, an inferred mineral resource may not be considered when assessing the economic viability of a mining project and may not be converted to a mineral reserve.
(11)Mineral resources are based on $2,250/oz gold, $26.00/oz silver, $0.90/lb lead, $1.20/lb zinc and $4.00/lb copper, unless otherwise stated.
(12)The resource NSR cut-off values for Greens Creek is $275/ton for all zones; metallurgical recoveries (actual 2025): 79.3% for silver, 74% for gold, 82.6% for lead, and 88.8% for zinc.
(13)The resource NSR cut-off value for Lucky Friday is $280/ton; metallurgical recoveries (actual 2025): 94.5% for silver, 94.3% for lead, and 85.1% for zinc.
(14)The resource NSR cut-off value at Keno Hill is $336/ton (CAD$500/tonne); using minimum width of 4.5 feet (1.5m); metallurgical recovery (actual 2025): 96.2% for silver, 94% for lead, 81% for zinc; US$/CAD$ exchange rate: 1:1.35.
(15)Mineral resources for Fire Creek, Hollister and Midas are reported using a minimum mining width of four feet or the vein true thickness plus two feet, whichever is greater.
(16)Fire Creek underground mineral resources are reported at a gold equivalent cut-off grade of 0.228 oz/ton. Metallurgical recoveries: 90% for gold and 70% for silver.
(17)Hollister mineral resources, including the Hatter Graben are reported at a gold equivalent cut-off grade of 0.191 oz/ton. Metallurgical recoveries: 88% for gold and 66% for silver.
(18)Midas mineral resources are reported at a gold equivalent cut-off grade of 0.183 oz/ton. Metallurgical recoveries: 90% for gold and 70% for silver. Inferred resources for the Sinter Zone are reported undiluted.
(19)Indicated and Inferred resources at the Star property are reported using a minimum mining width of 4.3 feet and an NSR cut-off value of $280/ton; Metallurgical recovery: 93% for silver, 93% for lead, and 87% for zinc.
(20)Inferred open-pit resources for Fire Creek calculated November 30, 2017, using gold and silver recoveries of 65% and 30% for oxide material and 60% and 25% for mixed oxide-sulfide material. Indicated Resources reclassified as Inferred in 2019. Open pit resources are calculated at $1,400 gold and $19.83 silver and cut-off grade of 0.01 Au Equivalent oz/ton and is inclusive of 10% mining dilution and 5% ore loss. Open pit mineral resources exclusive of underground mineral resources. NI43-101 Technical Report for the Fire Creek Project, Lander County, Nevada; Effective Date March 31, 2018; prepared by Practical Mining LLC, Mark Odell, P.E. for Hecla Mining Company, June 28, 2018.
(21)Inferred resources reported at a minimum mining width of 6.0 feet for Bulldog and an NSR cut-off value of $206/ton and 5.0 feet for Equity and North Amethyst veins at an NSR cut-off value of $206/ton; Metallurgical recoveries based on grade dependent recovery curves; metal recoveries at the mean resource grade average 89% silver, 74% lead, and 81% zinc for the Bulldog and a constant 85% gold and 85% silver for North Amethyst and Equity.
(22)Inferred resource at Monte Cristo reported at a minimum mining width of 5.0 feet and a 0.094 oz/ton gold cut-off grade. Metallurgical recovery: 85% for gold and 85% for silver.
(23)Inferred resource at Rock Creek reported at a minimum thickness of 15 feet and an NSR cut-off value of $35.10/ton; Metallurgical recoveries: 88% for silver and 92% for copper. Resources adjusted based on mining restrictions as defined by U.S. Forest Service, Kootenai National Forest in the June 2003 'Record of Decision, Rock Creek Project'.
(24)Inferred resource at Libby reported at a minimum thickness of 15 feet and an NSR cut-off value of $35.10/ton NSR; Metallurgical recoveries: 88% for silver and 92% copper. Resources adjusted based on mining restrictions as defined by U.S. Forest Service, Kootenai National Forest, Montana DEQ in December 2015 'Joint Final EIS, Montanore Project' and the February 2016 U.S Forest Service - Kootenai National Forest 'Record of Decision, Montanore Project'.
(25)Mineral resources at the Rackla-Tiger Project are based on a gold price of $1,650/oz, metallurgical recovery of 95% for gold, and cut-off grades of 0.02 oz/ton gold for the open pit portion of the resources and 0.04 oz/ton gold for the underground portions of the resources; US$/CAD$ exchange rate: 1:1.3.
(26)Mineral resources at the Rackla-Osiris Project are based on a gold price of $1,850/oz, metallurgical recovery of 83% for gold, and cut-off grades of 0.03 oz/ton gold for the open pit portion of the resources and 0.06 oz/ton gold for the underground portions of the resources; US$/CAD$ exchange rate: 1:1.3.
Individual Properties
MATERIAL OPERATING PROPERTIES
Greens Creek
We own 100% of the Greens Creek mine, located on Admiralty Island near Juneau in southeast Alaska at 58° 4’57.00”N Latitude, 134°37’57.40”W Longitude (WGS84). Admiralty Island is accessed by boat, float plane, or helicopter. On the island, the mine site and various surface facilities are accessed by 13 miles of all-weather gravel roads. The Greens Creek mine has been in production since 1989, with a temporary care and maintenance period from April 1993 through July 1996. We report Greens Creek as a separate segment in our consolidated financial statements. See Note 5 of Notes to Consolidated Financial Statements and Item 7. Management’s Discussion and Analysis of Financial Condition and Results of Operations - Results of Operations - Greens Creek for information on its financial performance.
Greens Creek is within the Admiralty Island National Monument, an environmentally sensitive area. The Greens Creek property includes 440 unpatented lode mining claims, 58 unpatented millsite claims, 21 patented lode claims and one patented millsite. In addition, the Greens Creek site includes properties under lease from the U.S. Forest Service ("USFS") for a road right-of-way, mine waste area and tailings storage facility. The USFS leases have varying expiration terms. Greens Creek also has title to mineral rights on 7,301 acres of federal land acquired through a land exchange with the USFS. We are currently exploring, but not mining, on such federal land. The claims and leases above comprise a total area of approximately 24 square miles.
The Greens Creek deposit is a volcanogenic massive sulfide deposit with a relatively high precious metal content compared to other deposits of its type. The host rock consists predominantly of marine sedimentary and mafic to ultramafic volcanic and plutonic rocks, which have been subjected to multiple periods of deformation. These deformational episodes imposed intense tectonic fabrics and folds within the rock. The deposits occur at the contact between Mississippian-age mafic meta-volcanic footwall and a hanging wall of Triassic-age argillite and basalt. Extensive hydrothermal alteration occurred within the meta-volcanic footwall prior to and during ore deposition, converting the basalts to sericite-rich, phyllitic schist. At ore deposition, thick and extensive lenses of base and precious metals, with pyrite and barite, formed at the footwall-hanging wall contact. Major sulfide minerals include pyrite, sphalerite, galena, and tetrahedrite/tennantite.
Greens Creek consists of the mine, an ore concentrating mill, a tailings storage area, a ship-loading facility, camp facilities, a ferry dock, and other related infrastructure. The map below illustrates the location and access to Greens Creek:
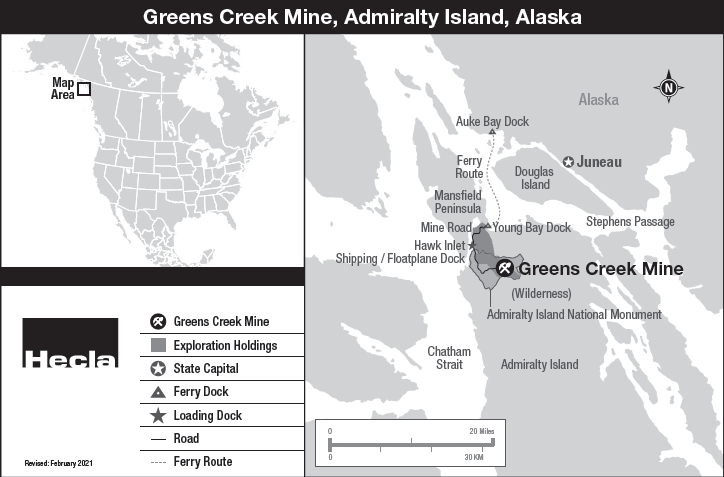
Greens Creek is an underground mine accessed by a ramp from surface which produces approximately 2,300 to 2,600 tons of ore per day. The primary mining methods are cut and fill and longhole stoping. The Greens Creek ore processing facility includes a SAG/ball mill grinding circuit to grind the run of mine ore to liberate the minerals and produce a slurry suitable for differential flotation of mineral concentrates. A gravity circuit recovers free gold that exists as electrum, a gold/silver alloy in the ore. Gravity concentrates are produced from this circuit prior to flotation. Three flotation concentrates are produced: a silver concentrate which contains most of the silver recovered; a zinc concentrate which is low in precious metals content; and a zinc-rich precious metals concentrate that contains gold, silver, zinc, and lead. Doré is produced from the gravity concentrate by a third-party processor and further refined and sold to precious metal traders. The concentrate products are sold to a number of smelters and traders worldwide. See Note 5 of Notes to Consolidated Financial Statements for information on the significant customers for Greens Creek’s products. Concentrates are shipped from the Hawk Inlet marine terminal about nine miles from the mill.
For more information, see Exhibit 96.1, the Technical Report Summary on the Greens Creek Mine, Alaska, U.S.A., prepared for the Company by the Qualified Person under Section 1300 of SEC Regulation S-K ("QP"), SLR International Corporation ("SLR") with an effective date of December 31, 2021.
The employees at Greens Creek are employees of Hecla Greens Creek Mining Company, our wholly-owned subsidiary, and are not represented by a bargaining agent. There were 546 employees at Greens Creek at December 31, 2025.
As of December 31, 2025, we have recorded a $51.6 million asset retirement obligation for reclamation and closure costs. We maintained a $92.2 million reclamation and long-term water treatment bond for Greens Creek as of December 31, 2025. The net book value of the Greens Creek property and its associated plant, equipment and mineral interests was approximately $517.5 million as of December 31, 2025. The vintage of the facilities at Greens Creek ranges from the 1980s to 2025.
The current mine plan at Greens Creek utilizes estimates of reserves and resources for approximately 11 years of production, through 2036.
Information with respect to Greens Creek's production, costs applicable to sales, average Cash Cost, After By-product Credits, Per Silver Ounce, All-In Sustaining Costs (“AISC”), After By-product Credits, Per Silver Ounce, and proven and probable mineral reserves for the past three years is set forth in the following table.
|
|
|
|
|
|
|
|
|
|
|
|
|
|
|
Years Ended December 31, |
|
Production |
|
2025 |
|
|
2024 |
|
|
2023 |
|
Ore milled (tons) |
|
|
871,659 |
|
|
|
895,318 |
|
|
|
914,796 |
|
Silver (ounces) |
|
|
8,724,996 |
|
|
|
8,480,877 |
|
|
|
9,731,752 |
|
Gold (ounces) |
|
|
59,349 |
|
|
|
55,275 |
|
|
|
60,896 |
|
Lead (tons) |
|
|
18,213 |
|
|
|
18,320 |
|
|
|
19,578 |
|
Zinc (tons) |
|
|
51,387 |
|
|
|
51,288 |
|
|
|
51,496 |
|
Copper (tons) |
|
|
1,804 |
|
|
|
1,874 |
|
|
|
1,823 |
|
|
|
|
|
|
|
|
|
|
|
Costs applicable to sales (1) |
|
$ |
234,221 |
|
|
$ |
214,677 |
|
|
$ |
205,900 |
|
Cash Cost, After By-product Credits, Per Silver Ounce (2) |
|
$ |
(8.02 |
) |
|
$ |
(0.05 |
) |
|
$ |
2.53 |
|
AISC, After By-Product Credits, per Silver Ounce (2) |
|
$ |
(2.36 |
) |
|
$ |
5.65 |
|
|
$ |
7.14 |
|
|
|
|
|
|
|
|
|
|
|
Proven Mineral Reserves(2,3,4,5) |
|
|
|
|
|
|
|
|
|
Total tons |
|
|
12,900 |
|
|
|
9,200 |
|
|
|
8,800 |
|
Silver (ounces per ton) |
|
|
23.9 |
|
|
|
7.6 |
|
|
|
11.3 |
|
Gold (ounces per ton) |
|
|
0.12 |
|
|
|
0.07 |
|
|
|
0.08 |
|
Zinc (percent) |
|
|
7.8 |
|
|
|
6.5 |
|
|
|
8.4 |
|
Lead (percent) |
|
|
3.0 |
|
|
|
2.4 |
|
|
|
3.5 |
|
Contained silver (ounces) |
|
|
308,900 |
|
|
|
69,800 |
|
|
|
99,500 |
|
Contained gold (ounces) |
|
|
1,500 |
|
|
|
700 |
|
|
|
700 |
|
Contained lead (tons) |
|
|
390 |
|
|
|
220 |
|
|
|
310 |
|
Contained zinc (tons) |
|
|
1,000 |
|
|
|
600 |
|
|
|
740 |
|
|
|
|
|
|
|
|
|
|
|
Probable Mineral Reserves(3,4,5,6) |
|
|
|
|
|
|
|
|
|
Total tons |
|
|
10,165,500 |
|
|
|
10,437,800 |
|
|
|
10,008,900 |
|
Silver (ounces per ton) |
|
|
10.4 |
|
|
|
9.9 |
|
|
|
10.5 |
|
Gold (ounces per ton) |
|
|
0.08 |
|
|
|
0.08 |
|
|
|
0.09 |
|
Zinc (percent) |
|
|
6.3 |
|
|
|
6.2 |
|
|
|
6.6 |
|
Lead (percent) |
|
|
2.3 |
|
|
|
2.3 |
|
|
|
2.5 |
|
Contained silver (ounces) |
|
|
105,788,100 |
|
|
|
103,640,900 |
|
|
|
105,121,700 |
|
Contained gold (ounces) |
|
|
840,800 |
|
|
|
864,300 |
|
|
|
879,700 |
|
Contained lead (tons) |
|
|
237,730 |
|
|
|
240,450 |
|
|
|
250,270 |
|
Contained zinc (tons) |
|
|
637,130 |
|
|
|
645,410 |
|
|
|
657,990 |
|
|
|
|
|
|
|
|
|
|
|
Total Proven and Probable Mineral Reserves(3,4,5,6) |
|
|
|
|
|
|
|
|
|
Total tons |
|
|
10,178,400 |
|
|
|
10,447,000 |
|
|
|
10,017,700 |
|
Silver (ounces per ton) |
|
|
10.4 |
|
|
|
9.9 |
|
|
|
10.5 |
|
Gold (ounces per ton) |
|
|
0.08 |
|
|
|
0.08 |
|
|
|
0.09 |
|
Zinc (percent) |
|
|
6.3 |
|
|
|
6.2 |
|
|
|
6.6 |
|
Lead (percent) |
|
|
2.3 |
|
|
|
2.3 |
|
|
|
2.5 |
|
Contained silver (ounces) |
|
|
106,097,000 |
|
|
|
103,710,700 |
|
|
|
105,221,200 |
|
Contained gold (ounces) |
|
|
842,300 |
|
|
|
865,000 |
|
|
|
880,400 |
|
Contained lead (tons) |
|
|
238,120 |
|
|
|
240,670 |
|
|
|
250,580 |
|
Contained zinc (tons) |
|
|
638,130 |
|
|
|
646,010 |
|
|
|
658,730 |
|
(1)Excludes depreciation, depletion and amortization
(2)Includes by-product credits from gold, lead, zinc and copper production. Cash Cost, After By-product Credits, Per Silver Ounce and AISC, After By-product Credits, Per Silver Ounce represent non-GAAP measurements that management uses to monitor and evaluate the performance of our mining operations. We believe these measurements provide indicators of economic performance and efficiency at each location and on a consolidated basis, as well as providing a meaningful basis to compare our results to those of other mining companies and other operating mining properties. A reconciliation of costs applicable to sales, the most comparable GAAP measure, to these non-GAAP measures can be found in Item 7. Management's Discussion and Analysis of Financial Condition and Results of Operations, under Reconciliation of Costs Applicable to Sales (GAAP) to Cash Cost, Before By-product Credits and Cash Cost, After By-product Credits (non-GAAP) and All-In Sustaining Cost, Before By-product Credits and All-In Sustaining Cost, After By-product Credits (non-GAAP).
(3)Proven and probable mineral reserves are calculated and reviewed in-house and are subject to periodic audit by others, although audits are not performed on an annual basis. Cutoff grade assumptions vary by ore body and are developed based on reserve metals price assumptions, anticipated mill recoveries and smelter payables, and cash operating costs. Due to multiple ore metals, and complex combinations of ore types, metal ratios and metallurgical performances at Greens Creek, the cutoff grade is expressed in terms of NSR, rather than metal grade. The cut-off grade at Greens Creek is $275 per ton NSR for all zones. The cut-off grade calculations include costs associated with mining, processing, surface operations, environmental, general administrative, sustaining capital, and royalty charges, if any. Our estimates of proven and probable reserves are based on the following metals prices:
|
|
|
|
|
|
|
|
|
|
|
|
|
|
|
December 31, |
|
|
|
2025 |
|
|
2024 |
|
|
2023 |
|
Silver (per ounce) |
|
$ |
25.00 |
|
|
$ |
22.00 |
|
|
$ |
17.00 |
|
Gold (per ounce) |
|
$ |
2,100 |
|
|
$ |
1,900 |
|
|
$ |
1,600 |
|
Lead (per pound) |
|
$ |
0.90 |
|
|
$ |
0.90 |
|
|
$ |
0.90 |
|
Zinc (per pound) |
|
$ |
1.15 |
|
|
$ |
1.15 |
|
|
$ |
1.15 |
|
(4)Reserves are in-situ materials that incorporate estimates of the amount of waste that must be mined along with the ore and expected mining recovery. The 2025 reserve model assumes average total mill recoveries of 79.3% for silver, 74% for gold, 88.8% for zinc and 82.6% for lead.
(5)The change in reserves in 2025 versus 2024 was due to an improved stope design process and updating models to realized higher grades in mining.
(6)Probable reserves at Greens Creek are based on average drill spacing of 50 to 100 feet. Proven reserves typically require that mine production samples for the basis of the ore grade estimates, while probable reserve grade estimates can be based entirely on drilling results. The proven reserves reported for Greens Creek for 2025 is exclusively stockpiled ore.
Information on in-situ mineral resources for Greens Creek excluding reserves for the past three years is set forth in the following table.
|
|
|
|
|
|
|
|
|
|
|
|
|
|
|
Years Ended December 31, |
|
|
|
2025 |
|
|
2024 |
|
|
2023 |
|
Measured Resources (1,2,3) |
|
|
|
|
|
|
|
|
|
Total tons |
|
|
— |
|
|
|
— |
|
|
|
— |
|
Silver (ounces per ton) |
|
|
— |
|
|
|
— |
|
|
|
— |
|
Gold (ounces per ton) |
|
|
— |
|
|
|
— |
|
|
|
— |
|
Zinc (percent) |
|
|
— |
|
|
|
— |
|
|
|
— |
|
Lead (percent) |
|
|
— |
|
|
|
— |
|
|
|
— |
|
Silver (ounces) |
|
|
— |
|
|
|
— |
|
|
|
— |
|
Gold (ounces) |
|
|
— |
|
|
|
— |
|
|
|
— |
|
Lead (tons) |
|
|
— |
|
|
|
— |
|
|
|
— |
|
Zinc (tons) |
|
|
— |
|
|
|
— |
|
|
|
— |
|
|
|
|
|
|
|
|
|
|
|
Indicated Resources (1,2,3) |
|
|
|
|
|
|
|
|
|
Total tons |
|
|
5,844,200 |
|
|
|
7,618,700 |
|
|
|
8,039,900 |
|
Silver (ounces per ton) |
|
|
15.2 |
|
|
|
14.1 |
|
|
|
13.9 |
|
Gold (ounces per ton) |
|
|
0.11 |
|
|
|
0.10 |
|
|
|
0.10 |
|
Zinc (percent) |
|
|
8.9 |
|
|
|
8.0 |
|
|
|
8.0 |
|
Lead (percent) |
|
|
3.4 |
|
|
|
3.0 |
|
|
|
3.0 |
|
Silver (ounces) |
|
|
88,654,700 |
|
|
|
107,226,000 |
|
|
|
111,526,000 |
|
Gold (ounces) |
|
|
653,000 |
|
|
|
760,000 |
|
|
|
800,000 |
|
Lead (tons) |
|
|
200,430 |
|
|
|
227,360 |
|
|
|
239,250 |
|
Zinc (tons) |
|
|
522,550 |
|
|
|
607,600 |
|
|
|
643,950 |
|
|
|
|
|
|
|
|
|
|
|
Measured and Indicated Resources (1,2,3) |
|
|
|
|
|
|
|
|
|
Total tons |
|
|
5,844,200 |
|
|
|
7,618,700 |
|
|
|
8,039,900 |
|
Silver (ounces per ton) |
|
|
15.2 |
|
|
|
14.1 |
|
|
|
13.9 |
|
Gold (ounces per ton) |
|
|
0.11 |
|
|
|
0.10 |
|
|
|
0.10 |
|
Zinc (percent) |
|
|
8.9 |
|
|
|
8.0 |
|
|
|
8.0 |
|
Lead (percent) |
|
|
3.4 |
|
|
|
3.0 |
|
|
|
3.0 |
|
Silver (ounces) |
|
|
88,654,700 |
|
|
|
107,226,000 |
|
|
|
111,526,000 |
|
Gold (ounces) |
|
|
653,000 |
|
|
|
760,000 |
|
|
|
800,000 |
|
Lead (tons) |
|
|
200,430 |
|
|
|
227,360 |
|
|
|
239,250 |
|
Zinc (tons) |
|
|
522,550 |
|
|
|
607,600 |
|
|
|
643,950 |
|
|
|
|
|
|
|
|
|
|
|
Inferred Resources (1,2,3) |
|
|
|
|
|
|
|
|
|
Total tons |
|
|
1,431,300 |
|
|
|
1,877,700 |
|
|
|
1,929,600 |
|
Silver (ounces per ton) |
|
|
16.3 |
|
|
|
13.4 |
|
|
|
13.4 |
|
Gold (ounces per ton) |
|
|
0.11 |
|
|
|
0.08 |
|
|
|
0.08 |
|
Zinc (percent) |
|
|
8.0 |
|
|
|
6.9 |
|
|
|
2.9 |
|
Lead (percent) |
|
|
3.2 |
|
|
|
2.9 |
|
|
|
6.9 |
|
Silver (ounces) |
|
|
23,314,000 |
|
|
|
25,106,100 |
|
|
|
25,891,000 |
|
Gold (ounces) |
|
|
153,400 |
|
|
|
151,400 |
|
|
|
154,000 |
|
Lead (tons) |
|
|
45,720 |
|
|
|
54,010 |
|
|
|
55,890 |
|
Zinc (tons) |
|
|
113,910 |
|
|
|
130,120 |
|
|
|
133,260 |
|
(1)Mineral resources are based on $2,250/oz for gold, $26.00/oz for silver, $0.90/lb for lead, $1.20/lb for zinc and are reported in-situ and exclusive of mineral reserves.
(2)The resource NSR cut-off value for Greens Creek is $275/ton for all zones; metallurgical recoveries (actual 2025): 79.3% for silver, 74% for gold, 82.6% for lead and 88.8% for zinc.
(3)Measured resources were not defined for year-end 2025; indicated resources for silver decreased 17% from 2024 given mining conversion to reserve material and higher cut-off; inferred resources for silver decreased 7% from 2024 given conversion to indicated resources or reserves due to drilling and higher cut-off.
Lucky Friday
We have owned and operated the Lucky Friday mine since 1958, and have wholly owned it since 1964. Lucky Friday is a deep underground silver, lead and zinc mine located in the Coeur d’Alene Mining District in northern Idaho at 47°28'15.70”N Latitude, 115°47'0.44”W Longitude (WGS84). Lucky Friday is one-quarter mile east of Mullan, Idaho, and is adjacent to U.S. Interstate 90. We report Lucky Friday as a separate segment in our consolidated financial statements. See Note 5 of Notes to Consolidated Financial Statements and Item 7. Management’s Discussion and Analysis of Financial Condition and Results of Operations - Results of Operations - Lucky Friday for information on its financial performance.
The Lucky Friday mine is comprised of 710 acres consisting of 43 patented mining claims and fee lands and 535 acres consisting of 53 unpatented mining claims. We also own or control approximately 26 square miles of mineral interests, which include patented mining and millsite claims, fee lands, and unpatented mining claims, that are adjacent to the Lucky Friday mine property. Below is a map illustrating the location and access to Lucky Friday:
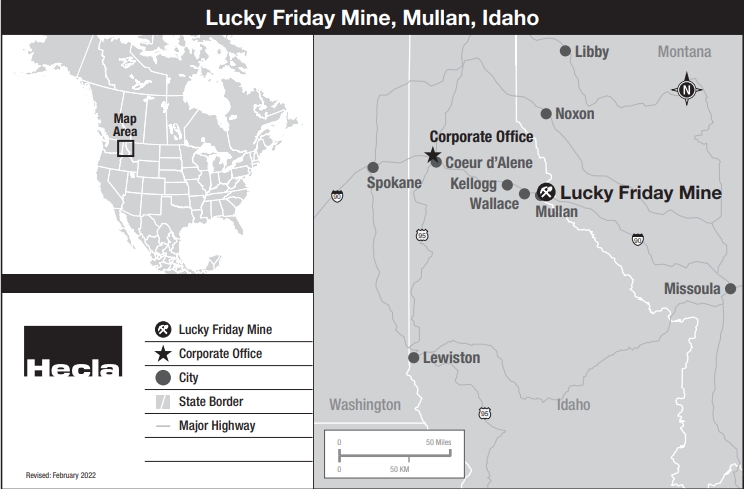
The principal mineral-bearing structure at the Lucky Friday Mine through 1997 was the Lucky Friday Vein, a fissure vein typical of many in the Coeur d’Alene Mining District. The Revett Formation (quartzite) of late Precambrian age hosts the productive portion of the vein. The Lucky Friday Vein strikes northeast and dips nearly vertical with an average width of six to seven feet. Its principal ore minerals are galena and tetrahedrite with minor amounts of sphalerite and chalcopyrite. The ore occurs as a single, continuous ore zone in, and along the Lucky Friday Vein. In 1991, Hecla discovered several mineralized veins containing some high-grade silver ores in the Gold Hunter property, located about 5,000 feet northwest of the Lucky Friday Vein workings. Hecla finished a feasibility study in 1997 and achieved full production in 1998. The Gold Hunter veins are hosted in a 200-foot-thick siliceous lens within the Wallace Formation (quartzite, limestone, and argillite) that transitions to the St Regis Formation (quartzite and argillite) below the 5900-level. The veins are sub-parallel, and perhaps ‘en-echelon’ along strike and dip. The strike of the vein system is west-northwest with a dip of 85 degrees to the south. While the veins share many characteristics with the Lucky Friday Vein, there are some mineralogical and rock mechanics differences that currently make mining at Gold Hunter more attractive.
Access to the mining horizons from the surface is by shaft access. Once underground, trackless drifts and ramps are utilized to reach the mining areas. An internal, hoisting shaft was completed in 2017 to extend access at depth in the Gold Hunter area. The principal mining methods in use at Lucky Friday consist of underhand systems with integral paste fill and varying degrees of mechanization. In 2020, we tested and implemented the underhand closed bench ("UCB") mining method. The UCB method is a new and patented productive mining method developed by Hecla for proactive control of fault-slip seismicity in deep, high-stress, narrow-vein mining. The method uses bench drilling and blasting methods to fragment significant vertical and lateral extents of the vein beneath a top cut taken along the strike of the vein and under engineered backfill. The method is accomplished without the use of drop raises or lower mucking drives which may result in local stress concentrations and increased exposure to seismic events. Large blasts using up to 45,000 lbs. of pumped emulsion and programmable electronic detonators fragment up to 500 feet of strike length to a depth of approximately 24 feet. These large blasts proactively induce fault-slip seismicity at the time of the blast and shortly after it. This blasted corridor is then mined underhand for two cuts. As these cuts are mined, little to no blasting is done to advance them. Dilution is controlled by supporting the hanging wall and footwall as the mining progresses through the blasted ore. The entire cycle repeats and stoping advances
downdip, under fill, and in a destressed zone. The method allows for greater control of fault-slip seismic events significantly improving safety. In conjunction, a notable productivity increase has been achieved by reducing seismic delays and utilizing bulk mining activities. In 2025, 2024 and 2023, 88%, 86% and 87%, respectively of the tons mined were produced through the UCB method. The underhand cut and fill method was also utilized in 2025, 2024 and 2023. Under this method, once a cut is taken along the strike of the vein, it is backfilled with cemented tailings and the next cut is accessed below from the ramp system. Both methods utilize rubber-tired equipment to access the veins through ramps developed outside of the ore body.
Ore at Lucky Friday is processed using a conventional lead/zinc flotation flowsheet, and the plant capacity currently is estimated at 1,165 tons per day. During August 2023, the production at the mine was suspended due to a fire that occurred while repairing an unused station in the #2 ventilation shaft, which is also the secondary egress (required by MSHA regulations). By early September, the fire had been extinguished, normal ventilation was reestablished and the workforce recalled. Following evaluation of alternatives, it was determined that in order to safely bring the mine back into production in the most rapid and cost-effective way, a new secondary egress needed to be developed to bypass the damaged portion of the #2 shaft. The new egress involved extending an existing ramp 1,600 feet, installing a 290-foot-long manway raise, and developing an 850-foot ventilation raise. This work resulted in operations being suspended for the remainder of 2023, with the mine restarting production in January 2024, and ramping up to full production during the first quarter.
For more information, see Exhibit 96.2, the Technical Report Summary on the Lucky Friday Mine, Idaho, U.S.A., prepared for the Company by the QP, SLR, with an effective date of December 31, 2021.
At December 31, 2025, there were 444 employees at Lucky Friday. The United Steel, Paper and Forestry, Rubber, Manufacturing, Energy, Allied Industrial, and Service Workers International Union is the bargaining agent for Lucky Friday’s 325 hourly employees as of December 31, 2025. During January 2023, the bargaining agent ratified a six-year labor agreement that expires in May 2029. Following a strike that started in March 2017 and ended in January 2020, re-staffing of the mine and ramp-up activities were completed during 2020, with a return to full production starting in the fourth quarter of 2020.
As of December 31, 2025, we have recorded a $14.9 million asset retirement obligation for reclamation and closure costs. The net book value of the Lucky Friday property and its associated plant, equipment and mineral interests was approximately $585.8 million as of December 31, 2025. The vintage of the facilities at Lucky Friday ranges from the 1950s to 2025.
The current mine plan at Lucky Friday utilizes estimates of reserves and resources for approximately 17 years of production, through 2044.
Information with respect to the Lucky Friday’s production, cost applicable to sales, costs applicable to sales - temporarily suspended operations, average Cash Cost, After By-product Credits, Per Silver Ounce, AISC, After By-product Credits, Per Silver Ounce, and proven and probable in -situ mineral reserves for the past three years is set forth in the table below.
|
|
|
|
|
|
|
|
|
|
|
|
|
|
|
Years Ended December 31, |
|
Production |
|
2025 |
|
|
2024 |
|
|
2023 |
|
Ore milled (tons) |
|
|
427,048 |
|
|
|
406,541 |
|
|
|
231,129 |
|
Silver (ounces) |
|
|
5,260,686 |
|
|
|
4,890,949 |
|
|
|
3,086,119 |
|
Lead (tons) |
|
|
34,284 |
|
|
|
31,265 |
|
|
|
19,543 |
|
Zinc (tons) |
|
|
14,924 |
|
|
|
13,513 |
|
|
|
7,944 |
|
|
|
|
|
|
|
|
|
|
|
Costs Applicable to Sales (1) |
|
$ |
122,635 |
|
|
$ |
103,436 |
|
|
$ |
59,859 |
|
Costs Applicable to Sales - Temporarily suspended operations(1) |
|
$ |
— |
|
|
$ |
1,583 |
|
|
$ |
20,489 |
|
Cash Cost, After By-product Credits, Per Silver Ounce (2) |
|
$ |
8.66 |
|
|
$ |
7.80 |
|
|
$ |
5.51 |
|
AISC, After By-product Credits, Per Silver Ounce (2) |
|
$ |
21.98 |
|
|
$ |
16.50 |
|
|
$ |
12.21 |
|
|
|
|
|
|
|
|
|
|
|
Proven Mineral Reserves(3,4,5) |
|
|
|
|
|
|
|
|
|
Total tons |
|
|
4,746,900 |
|
|
|
5,285,400 |
|
|
|
5,298,600 |
|
Silver (ounces per ton) |
|
|
11.9 |
|
|
|
11.9 |
|
|
|
12.8 |
|
Lead (percent) |
|
|
7.5 |
|
|
|
7.6 |
|
|
|
8.0 |
|
Zinc (percent) |
|
|
3.8 |
|
|
|
3.6 |
|
|
|
3.8 |
|
Contained silver (ounces) |
|
|
56,096,400 |
|
|
|
62,824,900 |
|
|
|
67,594,600 |
|
Contained lead (tons) |
|
|
355,370 |
|
|
|
400,400 |
|
|
|
424,080 |
|
Contained zinc (tons) |
|
|
181,180 |
|
|
|
189,860 |
|
|
|
201,280 |
|
|
|
|
|
|
|
|
|
|
|
Probable Mineral Reserves(3,4,5) |
|
|
|
|
|
|
|
|
|
Total tons |
|
|
1,635,500 |
|
|
|
789,900 |
|
|
|
965,500 |
|
Silver (ounces per ton) |
|
|
9.5 |
|
|
|
11.4 |
|
|
|
10.8 |
|
Lead (percent) |
|
|
6.0 |
|
|
|
7.6 |
|
|
|
7.1 |
|
Zinc (percent) |
|
|
3.7 |
|
|
|
3.1 |
|
|
|
2.9 |
|
Contained silver (ounces) |
|
|
15,492,800 |
|
|
|
9,011,300 |
|
|
|
10,410,500 |
|
Contained lead (tons) |
|
|
97,590 |
|
|
|
60,210 |
|
|
|
68,320 |
|
Contained zinc (tons) |
|
|
60,710 |
|
|
|
24,620 |
|
|
|
28,100 |
|
|
|
|
|
|
|
|
|
|
|
Total Proven and Probable Mineral Reserves(3,4,5) |
|
|
|
|
|
|
|
|
|
Total tons |
|
|
6,382,400 |
|
|
|
6,075,300 |
|
|
|
6,264,100 |
|
Silver (ounces per ton) |
|
|
11.2 |
|
|
|
11.8 |
|
|
|
12.5 |
|
Lead (percent) |
|
|
7.1 |
|
|
|
7.6 |
|
|
|
7.9 |
|
Zinc (percent) |
|
|
3.8 |
|
|
|
3.5 |
|
|
|
3.7 |
|
Contained silver (ounces) |
|
|
71,589,200 |
|
|
|
71,836,200 |
|
|
|
78,005,100 |
|
Contained lead (tons) |
|
|
452,960 |
|
|
|
460,610 |
|
|
|
492,400 |
|
Contained zinc (tons) |
|
|
241,890 |
|
|
|
214,480 |
|
|
|
229,380 |
|
(1)Excludes depreciation, depletion and amortization.
(2)Includes by-product credits from lead and zinc production. Cash Cost, After By-product Credits, Per Silver Ounce and AISC, After By-product Credits, Per Silver Ounce, represent non-GAAP measurements that management uses to monitor and evaluate the performance of our mining operations. We believe these measurements provide indicators of economic performance and efficiency at each location and on a consolidated basis, as well as providing a meaningful basis to compare our results to those of other mining companies and other operating mining properties. Costs Applicable to Sales is presented for the full year of 2025, 2024 and 2023. Costs Applicable to Sales - temporarily suspended operations relate to those costs incurred during the period when the Lucky Friday operations were suspended in August 2023 following the underground fire in the #2 shaft secondary egress and resumed on January 9, 2024, the portion of cash costs, sustaining costs, by-product credits, and silver production incurred during the suspension period are excluded from the calculation of Cash Cost, Before By-product Credits, Cash Cost, After By-product Credits, AISC, Before By-product Credits, and AISC, After By-product Credits. A reconciliation of costs applicable to sales, the most comparable GAAP measure, to these non-GAAP measures can be found in Item 7. Management’s Discussion and Analysis of Financial Condition and Results of Operations, under Reconciliation of Costs Applicable to Sales (GAAP) to Cash Cost, Before By-product Credits and Cash Cost, After By-product Credits (non-GAAP) and All-In Sustaining Cost, Before By-product Credits and All-In Sustaining Cost, After By-product Credits (non-GAAP).
(3)Proven and probable mineral reserves are calculated and reviewed in-house and are subject to periodic audit by others, although audits are not performed on an annual basis. Cutoff grade assumptions vary by ore body and are developed based on reserve metals price assumptions, anticipated mill recoveries and smelter payables, and cash operating costs. Due to multiple ore metals, and complex combinations of ore types, metal ratios and metallurgical performances at Lucky Friday, the cutoff grade is expressed in terms of NSR, rather than metal grade. The reserve NSR cut-off values for Lucky Friday are $280/ton for all veins. The cut-off grade calculations include costs associated with mining, processing, surface operations, environmental, general administrative, and sustaining capital. Our estimates of proven and probable reserves are based on the following metals prices:
|
|
|
|
|
|
|
|
|
|
|
|
|
|
|
December 31, |
|
|
|
2025 |
|
|
2024 |
|
|
2023 |
|
Silver (per ounce) |
|
$ |
25.00 |
|
|
$ |
22.00 |
|
|
$ |
17.00 |
|
Lead (per pound) |
|
$ |
0.90 |
|
|
$ |
0.90 |
|
|
$ |
0.90 |
|
Zinc (per pound) |
|
$ |
1.15 |
|
|
$ |
1.15 |
|
|
$ |
1.15 |
|
(4)Reserves are in-situ materials that incorporate estimates of the amount of waste that must be mined along with the ore and expected mining recovery. The 2025 reserve model was based on the Net Smelter Return values incorporating smelter terms and metal recoveries to the various concentrates. The 2025 reserve model assumes average total mill recoveries of 93.3% for silver, 92.8% for lead and 87.3% for zinc. The average total mill recoveries for 2025 were 94.5% for silver, 94.3% for lead and 85.1% for zinc.
(5)The change in reserves in 2025 from 2024 was due to mining depletion and cut-off grade increases offset by modeling updates, positive drilling results and engineering changes.
Information on in-situ mineral resources excluding mineral reserves for Lucky Friday for the past three years is set forth in the following table.
|
|
|
|
|
|
|
|
|
|
|
|
|
|
|
Years Ended December 31, |
|
|
|
2025 |
|
|
2024 |
|
|
2023 |
|
Measured Resources (1,2,3) |
|
|
|
|
|
|
|
|
|
Total tons |
|
|
1,805,600 |
|
|
|
3,781,400 |
|
|
|
5,325,500 |
|
Silver (ounces per ton) |
|
|
11.8 |
|
|
|
8.7 |
|
|
|
8.6 |
|
Lead (percent) |
|
|
7.4 |
|
|
|
5.8 |
|
|
|
5.6 |
|
Zinc (percent) |
|
|
2.1 |
|
|
|
2.6 |
|
|
|
2.8 |
|
Silver (ounces) |
|
|
21,327,700 |
|
|
|
32,794,700 |
|
|
|
45,784,900 |
|
Lead (tons) |
|
|
134,280 |
|
|
|
217,490 |
|
|
|
299,360 |
|
Zinc (tons) |
|
|
37,610 |
|
|
|
99,840 |
|
|
|
146,420 |
|
|
|
|
|
|
|
|
|
|
|
Indicated Resources (1,2,3) |
|
|
|
|
|
|
|
|
|
Total tons |
|
|
1,618,900 |
|
|
|
845,200 |
|
|
|
1,011,000 |
|
Silver (ounces per ton) |
|
|
11.9 |
|
|
|
8.7 |
|
|
|
8.1 |
|
Lead (percent) |
|
|
6.2 |
|
|
|
6.6 |
|
|
|
6.0 |
|
Zinc (percent) |
|
|
1.5 |
|
|
|
2.3 |
|
|
|
2.7 |
|
Silver (ounces) |
|
|
19,213,200 |
|
|
|
7,350,000 |
|
|
|
8,135,700 |
|
Lead (tons) |
|
|
100,200 |
|
|
|
55,890 |
|
|
|
60,200 |
|
Zinc (tons) |
|
|
24,850 |
|
|
|
19,700 |
|
|
|
26,910 |
|
|
|
|
|
|
|
|
|
|
|
Measured and Indicated Resources (1,2,3) |
|
|
|
|
|
|
|
|
|
Total tons |
|
|
3,424,500 |
|
|
|
4,626,600 |
|
|
|
6,336,500 |
|
Silver (ounces per ton) |
|
|
11.8 |
|
|
|
8.7 |
|
|
|
8.5 |
|
Lead (percent) |
|
|
6.8 |
|
|
|
6.2 |
|
|
|
5.7 |
|
Zinc (percent) |
|
|
1.8 |
|
|
|
2.5 |
|
|
|
2.7 |
|
Silver (ounces) |
|
|
40,540,900 |
|
|
|
40,144,700 |
|
|
|
53,920,600 |
|
Lead (tons) |
|
|
234,480 |
|
|
|
273,380 |
|
|
|
359,560 |
|
Zinc (tons) |
|
|
62,460 |
|
|
|
119,540 |
|
|
|
173,330 |
|
|
|
|
|
|
|
|
|
|
|
Inferred Resources (1,2,3) |
|
|
|
|
|
|
|
|
|
Total tons |
|
|
2,237,700 |
|
|
|
3,811,400 |
|
|
|
3,600,000 |
|
Silver (ounces per ton) |
|
|
11.6 |
|
|
|
10.3 |
|
|
|
7.8 |
|
Lead (percent) |
|
|
8.6 |
|
|
|
7.7 |
|
|
|
5.9 |
|
Zinc (percent) |
|
|
2.9 |
|
|
|
3.2 |
|
|
|
2.8 |
|
Silver (ounces) |
|
|
26,033,300 |
|
|
|
39,183,200 |
|
|
|
27,933,900 |
|
Lead (tons) |
|
|
192,010 |
|
|
|
293,010 |
|
|
|
211,340 |
|
Zinc (tons) |
|
|
65,770 |
|
|
|
121,710 |
|
|
|
100,630 |
|
(1)Mineral resources are based on $26.00/oz for silver, $0.90/lb for lead, $1.20/lb for zinc and are reported in-situ and exclusive of mineral reserves.
(2)The resource NSR cut-off value for Lucky Friday is $280.00/ton; metallurgical recoveries (actual 2025): 94.5% for silver, 94.3% for lead and 85.1% for zinc. The cut-off grade calculations include costs associated with mining, processing, surface operations, environmental, general administrative, and sustaining capital.
(3)Measured and Indicated resources for silver increased 1% from 2024 given modeling of thinner vein intercepts; Inferred silver resources decreased 34% from 2024 given higher cut-off.
Keno Hill
The Keno Hill unit is located in the central Yukon Territory, Canada, and covers an area of approximately 15,000 hectares (37,000 acres) in central Yukon (63° 54' 32" N, 135° 19’ 18” W; NTS 105M/14 and 105M/13). The operations are located in the traditional territory of the First Nation of Na-Cho Nyäk Dun (FNNND). We report Keno as a separate segment in our consolidated financial statements. See Note 5 of Notes to Consolidated Financial Statements and Item 7. Management’s Discussion and Analysis of Financial Condition and Results of Operations - Results of Operations - Keno Hill for information on its financial performance.
The total Hecla Keno Hill mineral claims as of December 31, 2025, covers an area of 238.12 square kilometers (92 square miles) and comprises 717 quartz mining leases, 867 quartz mining claims and two Crown Grants. Below is a map illustrating the location and access to Keno Hill:
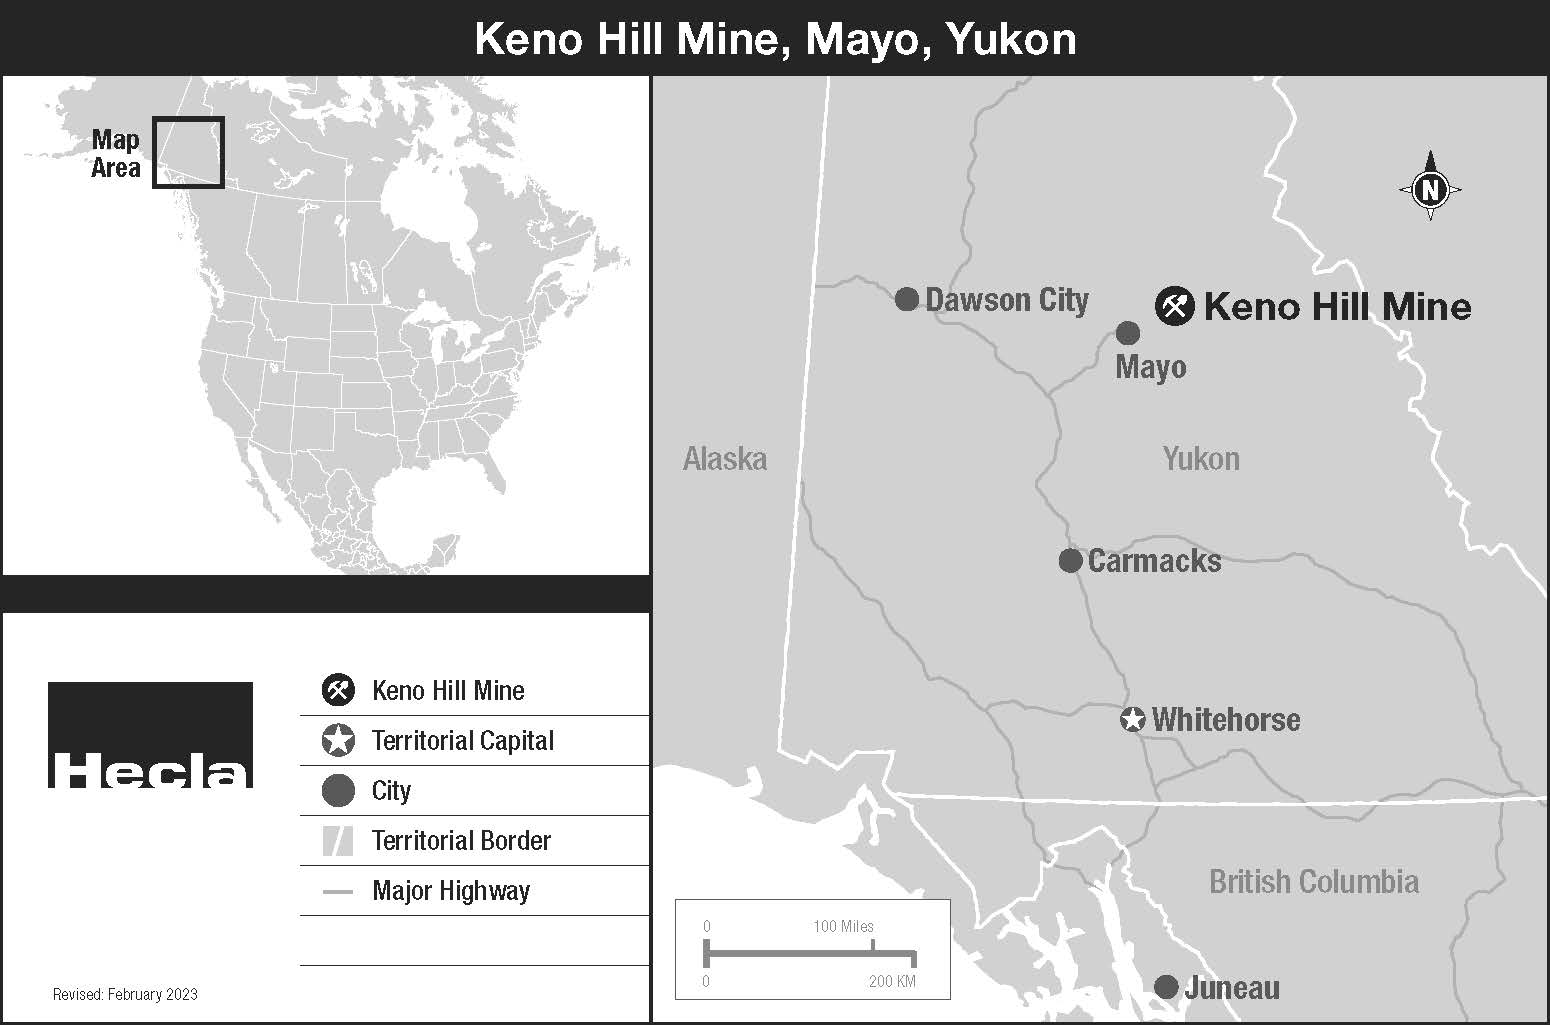
The Keno Hill property is a polymetallic silver-lead-zinc vein district with characteristics similar to other well-known mining districts in the world. Examples of this type of mineralization include the Kokanee Range (Slocan), British Columbia; Coeur d’Alene, Idaho; Freiberg and the Harz Mountains, Germany; and Príbram, Czech Republic.
The local geology is dominated by the Mississippian Keno Hill Quartzite comprising the Basal Quartzite Member and conformably overlying Sourdough Hill Member. Silver predominantly occurs in argentiferous galena and argentiferous tetrahedrite (freibergite). In some assemblages, silver is also found as native silver, in polybasite, stephanite, and pyrargyrite. Lead occurs in galena and zinc in sphalerite. Other sulfides include pyrite, pyrrhotite, arsenopyrite, and chalcopyrite. In general, common gangue minerals include siderite and, to a lesser extent, quartz, and calcite.
Keno Hill ore is mined with a mechanized cut and fill method ("MCF"). Where the ore width is wider than can be safely extracted in one cut, the ore will be mined in adjacent drifts. Lenses are predominantly mined in a bottom-up sequence and filled with cemented rock fill ("CRF") with a 3%-8% binder content. CRF is used to introduce temporary sill levels or to fill initial drifts when multiple adjacent drifts are required. Temporary sill levels form a sequence interrupting pillar which allows for multiple mining fronts to be active on one lens at a time. The remainder of the lifts will be backfilled with unconsolidated rock fill. This mining method was chosen due to the narrow steeply dipping nature of the mineral bodies and to maximize safety and productivity. The various deposits require the use of mining methods that can adequately support the vein and that are flexible and selective while minimizing the direct mining costs. In the MCF method, an attack ramp is developed from the main ramp at a gradient of -15%. Upon reaching the orebody, an intersection is developed, and a lift is developed in both directions along strike, following the geological contact of the orebody. At the end of the lens, the void is backfilled using a Load Haul Dump ("LHD") machine. The LHD utilizes a bulldozer-like plate to push waste tight to the back of the drift. Once the level has been completely backfilled, the next lift above the previously mined lift is accessed by slashing down the back of the attack ramp and working off the muck pile/horizon. MCF drift sizes are on average 3.5 meters high x 3.5 meters wide. For areas wider than development equipment, a second parallel drift will be mined beside the backfilled drift to fully extract the material prior to accessing the lift above. In this situation, the first drift will be completely backfilled with cemented rock fill to ensure a stable wall to allow adjacent mining activity. The lifts are generally sequenced from the bottom-up within each panel.
The Keno Hill mill is based on a conventional sequential flotation process producing silver and precious metal concentrates. The silver concentrates are high in lead which typically accounts for approximately 90% to 95% of the mill feed silver values since given that is strongly associated with lead minerals. Overall, silver represents 70% to 80% of the value of the ores in the district.
For more information, see Exhibit 96.4, the Technical Report Summary on the Keno Hill Operations, Yukon, Canada, prepared for the Company by Mining Plus Canada Ltd., with an effective date of December 31, 2023.
At December 31, 2025, there were 261 employees at Keno Hill.
As of December 31, 2025, we have recorded a $3.7 million asset retirement obligation for reclamation and closure costs. The net book value of the Keno Hill property and its associated plant, equipment and mineral interests was approximately $408.0 million as of December 31, 2025. The active infrastructure in place at Keno Hill ranges from the 1980s to 2025.
The current mine plan at Keno Hill utilizes estimates of reserves and resources for approximately 16 years of production, through 2040.
Information with respect to the Keno Hill’s production and proven and probable in -situ mineral reserves and costs applicable to sales for the past three years is set forth in the table below . Information with respect to Keno Hill’s average Cash Cost, After By-Product Credits, Per Silver Ounce, AISC, After By-product Credits, Per Silver Ounce were not reported as the mine has not reached commercial production. At the time the mine reaches commercial production, these metrics will be reported.
|
|
|
|
|
|
|
|
|
|
|
|
|
|
|
Years Ended December 31, |
|
Production |
|
2025 |
|
|
2024 |
|
|
2023 |
|
Ore milled (tons) |
|
|
108,339 |
|
|
|
109,292 |
|
|
|
56,331 |
|
Silver (ounces) |
|
|
3,018,490 |
|
|
|
2,773,873 |
|
|
|
1,502,577 |
|
Lead (tons) |
|
|
3,633 |
|
|
|
2,930 |
|
|
|
1,225 |
|
Zinc (tons) |
|
|
2,247 |
|
|
|
1,507 |
|
|
|
1,139 |
|
|
|
|
|
|
|
|
|
|
|
Costs applicable to sales(1) |
|
$ |
71,883 |
|
|
$ |
81,336 |
|
|
$ |
59,083 |
|
Proven Mineral Reserves(2,3,4) |
|
|
|
|
|
|
|
|
|
Total tons |
|
|
9,100 |
|
|
|
12,900 |
|
|
|
— |
|
Silver (ounces per ton) |
|
|
23.5 |
|
|
|
28.1 |
|
|
|
— |
|
Gold (ounces per ton) |
|
|
— |
|
|
|
— |
|
|
|
— |
|
Lead (percent) |
|
|
2.4 |
|
|
|
3.0 |
|
|
|
— |
|
Zinc (percent) |
|
|
6.2 |
|
|
|
1.6 |
|
|
|
— |
|
Contained silver (ounces) |
|
|
235,100 |
|
|
|
364,200 |
|
|
|
— |
|
Contained gold (ounces) |
|
|
— |
|
|
|
— |
|
|
|
— |
|
Contained lead (tons) |
|
|
220 |
|
|
|
380 |
|
|
|
— |
|
Contained zinc (tons) |
|
|
600 |
|
|
|
200 |
|
|
|
— |
|
|
|
|
|
|
|
|
|
|
|
Probable Mineral Reserves(2,3,4) |
|
|
|
|
|
|
|
|
|
Total tons |
|
|
2,103,500 |
|
|
|
2,629,700 |
|
|
|
2,069,400 |
|
Silver (ounces per ton) |
|
|
25.3 |
|
|
|
24.3 |
|
|
|
26.6 |
|
Gold (ounces per ton) |
|
|
0.01 |
|
|
|
0.01 |
|
|
|
0.01 |
|
Lead (percent) |
|
|
2.9 |
|
|
|
2.4 |
|
|
|
2.8 |
|
Zinc (percent) |
|
|
2.9 |
|
|
|
2.4 |
|
|
|
2.5 |
|
Contained silver (ounces) |
|
|
53,171,700 |
|
|
|
63,913,700 |
|
|
|
55,068,000 |
|
Contained gold (ounces) |
|
|
15,600 |
|
|
|
17,000 |
|
|
|
13,400 |
|
Contained lead (tons) |
|
|
61,600 |
|
|
|
63,440 |
|
|
|
58,170 |
|
Contained zinc (tons) |
|
|
61,230 |
|
|
|
62,790 |
|
|
|
52,380 |
|
|
|
|
|
|
|
|
|
|
|
Total Proven and Probable Mineral Reserves(2,3,4) |
|
|
|
|
|
|
|
|
|
Total tons |
|
|
2,112,600 |
|
|
|
2,642,600 |
|
|
|
2,069,400 |
|
Silver (ounces per ton) |
|
|
25.3 |
|
|
|
24.3 |
|
|
|
26.6 |
|
Gold (ounces per ton) |
|
|
0.01 |
|
|
|
0.01 |
|
|
|
0.01 |
|
Lead (percent) |
|
|
2.9 |
|
|
|
2.4 |
|
|
|
2.8 |
|
Zinc (percent) |
|
|
2.9 |
|
|
|
2.4 |
|
|
|
2.5 |
|
Contained silver (ounces) |
|
|
53,406,800 |
|
|
|
64,277,900 |
|
|
|
55,068,000 |
|
Contained gold (ounces) |
|
|
15,600 |
|
|
|
17,000 |
|
|
|
13,400 |
|
Contained lead (tons) |
|
|
61,820 |
|
|
|
63,820 |
|
|
|
58,170 |
|
Contained zinc (tons) |
|
|
61,830 |
|
|
|
62,990 |
|
|
|
52,380 |
|
(1)Excludes depreciation, depletion and amortization.
(2)Proven and probable mineral reserves are calculated and reviewed in-house and are subject to periodic audit by others, although audits are not performed on an annual basis. Cutoff grade assumptions vary by ore body and are developed based on reserve metals price assumptions, anticipated mill recoveries and smelter payables, and cash operating costs. Due to multiple ore metals, and complex combinations of ore types, metal ratios and metallurgical performances at Keno Hill, the cutoff grade is expressed in terms of NSR, rather than metal grade. The reserve NSR cut-off value for Keno Hill is $336/ton. The cut-off grade calculations include costs associated with mining, processing, surface operations,
environmental, general administrative, and sustaining capital. Our estimates of proven and probable reserves are based on the following metals prices:
|
|
|
|
|
|
|
|
|
|
|
|
|
|
|
December 31, |
|
|
|
2025 |
|
|
2024 |
|
|
2023 |
|
Silver (per ounce) |
|
$ |
25.00 |
|
|
$ |
22.00 |
|
|
$ |
17.00 |
|
Lead (per pound) |
|
$ |
0.90 |
|
|
$ |
0.90 |
|
|
$ |
0.90 |
|
Zinc (per pound) |
|
$ |
1.15 |
|
|
$ |
1.15 |
|
|
$ |
1.15 |
|
(3)Reserves are in-situ materials that incorporate estimates of the amount of waste that must be mined along with the ore and expected mining recovery. The proven reserves reported for Keno Hill for 2025 is exclusively stockpiled ore. The 2025 reserve model assumes average total mill recoveries of 96.2% for silver, 94% for lead and 81% for zinc.
(4)The change in silver reserves in 2025 from 2024 was due to modeling changes due to increased geologic understanding, mining depletion, minor sterilization and pre-production drilling results.
Information on in-situ mineral resources excluding mineral reserves for Keno Hill for the past three years is set forth in the following table.
|
|
|
|
|
|
|
|
|
|
|
|
|
|
|
Years Ended December 31, |
|
|
|
2025 |
|
|
2024 |
|
|
2023 |
|
Measured Resources (1,2,3) |
|
|
|
|
|
|
|
|
|
Total tons |
|
|
— |
|
|
|
— |
|
|
|
— |
|
Silver (ounces per ton) |
|
|
— |
|
|
|
— |
|
|
|
— |
|
Gold (ounces per ton) |
|
|
— |
|
|
|
— |
|
|
|
— |
|
Lead (percent) |
|
|
— |
|
|
|
— |
|
|
|
— |
|
Zinc (percent) |
|
|
— |
|
|
|
— |
|
|
|
— |
|
Silver (ounces) |
|
|
— |
|
|
|
— |
|
|
|
— |
|
Gold (ounces) |
|
|
— |
|
|
|
— |
|
|
|
— |
|
Lead (tons) |
|
|
— |
|
|
|
— |
|
|
|
— |
|
Zinc (tons) |
|
|
— |
|
|
|
— |
|
|
|
— |
|
|
|
|
|
|
|
|
|
|
|
Indicated Resources (1,2,3) |
|
|
|
|
|
|
|
|
|
Total tons |
|
|
582,800 |
|
|
|
1,050,300 |
|
|
|
4,504,200 |
|
Silver (ounces per ton) |
|
|
24.1 |
|
|
|
13.7 |
|
|
|
7.5 |
|
Gold (ounces per ton) |
|
|
0.01 |
|
|
|
0.01 |
|
|
|
0.01 |
|
Lead (percent) |
|
|
2.5 |
|
|
|
1.1 |
|
|
|
0.9 |
|
Zinc (percent) |
|
|
6.3 |
|
|
|
2.1 |
|
|
|
3.5 |
|
Silver (ounces) |
|
|
14,039,200 |
|
|
|
14,430,700 |
|
|
|
33,926,400 |
|
Gold (ounces) |
|
|
5,200 |
|
|
|
12,200 |
|
|
|
26,200 |
|
Lead (tons) |
|
|
14,460 |
|
|
|
11,610 |
|
|
|
41,120 |
|
Zinc (tons) |
|
|
36,710 |
|
|
|
22,460 |
|
|
|
157,350 |
|
|
|
|
|
|
|
|
|
|
|
Measured and Indicated Resources (1,2,3) |
|
|
|
|
|
|
|
|
|
Total tons |
|
|
582,800 |
|
|
|
1,050,300 |
|
|
|
4,504,200 |
|
Silver (ounces per ton) |
|
|
24.1 |
|
|
|
13.7 |
|
|
|
7.5 |
|
Gold (ounces per ton) |
|
|
0.01 |
|
|
|
0.01 |
|
|
|
0.01 |
|
Lead (percent) |
|
|
2.5 |
|
|
|
1.1 |
|
|
|
0.9 |
|
Zinc (percent) |
|
|
6.3 |
|
|
|
2.1 |
|
|
|
3.5 |
|
Silver (ounces) |
|
|
14,039,200 |
|
|
|
14,430,700 |
|
|
|
33,926,400 |
|
Gold (ounces) |
|
|
5,200 |
|
|
|
12,200 |
|
|
|
26,200 |
|
Lead (tons) |
|
|
14,460 |
|
|
|
11,610 |
|
|
|
41,120 |
|
Zinc (tons) |
|
|
36,710 |
|
|
|
22,460 |
|
|
|
157,350 |
|
|
|
|
|
|
|
|
|
|
|
Inferred Resources (1,2,3) |
|
|
|
|
|
|
|
|
|
Total tons |
|
|
661,800 |
|
|
|
1,299,600 |
|
|
|
2,835,900 |
|
Silver (ounces per ton) |
|
|
16.7 |
|
|
|
14.8 |
|
|
|
11.2 |
|
Gold (ounces per ton) |
|
|
0.01 |
|
|
|
0.00 |
|
|
|
0.00 |
|
Lead (percent) |
|
|
1.9 |
|
|
|
1.3 |
|
|
|
1.1 |
|
Zinc (percent) |
|
|
3.8 |
|
|
|
2.7 |
|
|
|
1.8 |
|
Silver (ounces) |
|
|
11,043,600 |
|
|
|
19,269,800 |
|
|
|
31,790,500 |
|
Gold (ounces) |
|
|
3,500 |
|
|
|
6,100 |
|
|
|
8,600 |
|
Lead (tons) |
|
|
12,450 |
|
|
|
16,450 |
|
|
|
32,040 |
|
Zinc (tons) |
|
|
25,350 |
|
|
|
34,940 |
|
|
|
51,870 |
|
(1)Mineral resources are based on $26.00/oz for silver, $2,250/oz for gold, $0.90/lb for lead, $1.20/lb for zinc and are reported in-situ and exclusive of mineral reserves.
(2)The resource NSR cut-off value for Keno Hill is $336/ton ; metallurgical recoveries (actual 2025): 96.2% for silver, 94% for lead and 81% for zinc. The cut-off grade calculations include costs associated with mining and processing.
(3)Measured and indicated resources for silver decreased 3% and inferred silver resources decreased 43% from 2024 given higher cut-off, conversion to reserves, additional drilling and modeling changes.
Internal Controls on Exploration and Development Drilling Programs
Exploration and development drilling programs are performed using Industry Standard quality control methods for drilling, sampling, and analytical procedures. Standard operating procedure manuals for geology logging, sampling, and assaying are kept at the operations and updated as required. A secure sample chain-of-custody is established to promote the security of samples during transport from the projects to the analytical facilities. All primary analytical laboratories are ISO 9001 certified and sample preparation and analytical procedures are Industry Standard methods for the metals of interest.
Sample batches sent for analysis are controlled by a system of reference samples of known grade inserted into the sample stream and other control samples. Coarse and fine ‘blank,’ sterile, sample materials are used to monitor contamination at the sample preparation and analytical stages; Standard Reference Materials (“SRM”) of known grades are used to measure accuracy of the analytical results; and pulp duplicate samples and coarse reject duplicate samples are used to monitor precision of the analytical results. Blanks and SRM are inserted according to the analytical batch size and overall number of samples but normally result in a 1:10 to 1:20 insertion rate. Duplicate samples are inserted or requested using a similar 1:10 to 1:20 inclusion rate. As a final measure of assay quality, 5% to 10% of the original samples are sent to a second analytical laboratory for check analysis. Periodically, the Company retains experts to perform audits of the commercial laboratories used in the United States, Mexico and Canada.
The main operating properties store data in SQL-based relational database utilities with built-in logic checks that are implemented as new data is imported. Accurate data entry into the database is confirmed by verification upon data entry/import and again before use in final geology interpretation and resource modeling with checks of new data collected during yearly drilling programs.
Geology and mineral control interpretations, grade estimation parameters, grade and density models, reserve estimation parameters, and modifying factors are peer reviewed within the company. Resource grade models are validated using Industry Standard methods and appropriate documentation and reporting are completed to summarize methods and results. All resource and reserve tabulations at the operations are approved by the local management, with their own sets of controls, and then are compiled by the corporate office which also performs its own set of checks on the final numbers.
All personnel responsible for the management of mineral resource and mineral reserve modeling and approval and reporting of mineral resource and mineral reserve statements are QPs with relevant experience in the type of mineralization and deposit under consideration and in the specific type of activity undertaken for the company. All are eligible members or licensees in good standing of a recognized professional organization based on their academic qualifications and experience and comply with professional standards of competence and ethics. We encourage continuing professional development and training for current QPs as well as others in the Company to develop other QPs within the various departments.
As projects advance toward development and production, data density and the geological understanding of the mineral deposit increases. The Company’s internal controls limit some risk in the resource estimation process, but there is inherent risk in resource modeling due to mineral deposit heterogeneity, sample size and distribution, mining style and mining factor assumptions, and mineral processing issues. Independent audits of reserve models from an outside specialist are arranged on a periodic basis for an operating property. The senior technical staff can also determine when changes in mineral resource and reserve models or negative mine reconciliations are material and recommend internal or external auditing of the models and modifying factors.
PART II
Item 7. Management’s Discussion and Analysis of Financial Condition and Results of Operations
The following Management’s Discussion and Analysis (“MD&A”) provides information that management believes is relevant to an assessment and understanding of the consolidated financial condition and results of operations of Hecla Mining Company and its subsidiaries (collectively the “Company,” “our,” or “we”). We use certain non-GAAP financial performance measures in our MD&A. For a detailed description of these measures, please see “Non-GAAP Financial Performance Measures” at the end of this item. This item should be read in conjunction with our Consolidated Financial Statements and the notes thereto included in this annual report.
Overview
Hecla Mining Company stands as the premier silver producer, with a rich heritage dating back to 1891. Our operations at Greens Creek, Lucky Friday and Keno Hill combined to produce 37% of 2024 silver production in the U.S. and Canada, complemented by meaningful gold production from Greens Creek. We began ramp-up of the Keno Hill mill during the second quarter of 2023. Our strategic positioning in the stable jurisdictions of U.S. and Canada provides us with distinct operational advantages and reduced political risk compared to our global peers. Our operational and strategic framework centers on four core pillars:
1.Achieving operational excellence through standardized systems and continuous improvement
2.Optimizing our portfolio through strategic reviews and targeting highest risk-adjusted return projects
3.Intensifying our focus on financial discipline with a rigorous capital allocation framework
4.Leveraging our position as North America's largest silver producer to meet growing demand from green technology markets
Recent Developments
On March 25, 2026, we completed the sale of our Hecla Quebec Inc. ("Hecla Quebec") subsidiary which owns the Casa Berardi mine to Orezone Gold Corporation ("Orezone") for total consideration with a fair value of $385.7 million ($602.2 million on an undiscounted basis) comprised of the following:
•Cash of $170.0 million upon closing on March 25, 2026
•Accounts receivable related to working capital adjustments of $16.6 million
•65,757,265 Orezone common shares valued at $106.1 million on closing
•Deferred cash consideration ("Deferred Cash Consideration") with a fair value of $57.1 million for the cash payments of $30 million and $50 million to be received 18 months and 30 months after closing, respectively
•Contingent cash consideration ("Contingent Cash Consideration") with a fair value of $35.9 million for a total of up to $241 million of undiscounted payments consisting of:
oA fair value of $3.3 million for two annual gold-price related payments of $5 million each should the average gold price exceed $4,200/oz for the first and second years following closing
oA fair value of $9.9 million for two contingent payments of $10 million each due upon issuance of certain permits to open pit mine two additional identified orebodies
oA fair value of $22.7 million for certain future gold production-based royalty payments with an undiscounted value of up to $211 million ($80/ounce for the first 500,000 ounces, then $180/ounce thereafter from future open pit operations)
Orezone has a set-off right to reduce the unpaid balance of the Deferred Cash Consideration payments by 50% of the amount by which the financial assurance required by the Quebec government under the updated Casa Berardi closure plan exceeds $150 million, excluding increases caused by Orezone's post-closing actions. Our current estimate of that excess, being $11.5 million has been included in determining the fair values of the Deferred Cash Consideration.
The sale of Hecla Quebec represents disciplined portfolio optimization and focuses capital allocation on our silver assets, which we believe to represent significant growth and value creation opportunities. We have solidified our revenue exposure to silver and we are focused on operating in what we view to be the most favorable jurisdictions. We used the cash proceeds from the transaction for debt reduction and balance sheet strengthening, enhancing our financial flexibility and capacity to invest in strategic growth investments.
We determined that the sale of Hecla Quebec represents a strategic shift that has a major effect on our operations and financial results and therefore, the Casa Berardi operation is no longer a reportable segment and its financial results are reflected in the Company’s audited consolidated financial statements as a discontinued operation for all periods presented. Unless otherwise specified, the discussion of financial results within this Item 7 (MD&A) will focus on our continuing operations, in relation to the respective comparative periods which have been recast to reflect the continuing operations of our business.
2025 Highlights
Operational Achievements:
•Strong Production - Delivered 17.0 million ounces of silver and 59,349 ounces of gold. Gold production benefited from higher grades and recoveries at Greens Creek. See Consolidated Results of Operations below for information on costs applicable to sales and costs applicable to sales - temporarily suspended operations, as well as cash costs and AISC, each after by-product credits, per silver and gold ounce for 2025, 2024 and 2023.
•Lucky Friday Production - Achieved record production of 5.3 million ounces, while continuing to advance infrastructure projects such as the surface cooling plant and beginning work on a new tailings impoundment.
•Keno Hill Consistent Production - Produced 3.0 million ounces of silver, meeting production guidance of 2.9 - 3.1 million ounces, which represents a 9% increase from the prior year, while continuing to improve the developed state of the mine and invest in infrastructure needed to advance toward commercial production.
•Nevada Properties Advancement - Advanced exploration and permitting across the Company's Nevada portfolio. At the Midas Project, a 2025 drilling program confirmed mineralized structures in five of six targets tested, including a gold discovery at the previously untested Pogo trend that returned 0.95 ounces per ton gold over 2.2 feet with visible gold, and at the Sinter Offset target, 0.46 ounces per ton gold over 6.1 feet, extending the Sinter Vein approximately 750 feet across a post-mineral fault from its 2021 discovery location. The Midas district historically produced approximately 2.2 million ounces of gold and 27 million ounces of silver during modern-era operations (1998–2014) and includes existing permitted infrastructure, including a mill with approximately 1,200 tons per day capacity, that has been in care and maintenance for approximately five years. At the 100% owned Aurora project, the Company received a Finding of No Significant Impact and Record of Decision for the Polaris exploration project, a permitting milestone enabling the advancement of exploration drilling activities at this historically high-grade gold-silver property. Both Nevada projects are supported by existing infrastructure that the Company plans to evaluate for refurbishment in connection with a potential restart of operations, which is expected to require significantly lower capital expenditure than construction of new facilities, subject to the results of ongoing technical and economic assessments.
•Safety - Reduced company wide TRIFR to 1.69, an improvement of 13% over the prior year.
Financial Performance:
•Revenue Generation - Achieved record sales of more than $1.1 billion.
•Shareholder Returns - Generated net income applicable to common stockholders of $321.2 million and returned $10.4 million to our common stockholders through dividend payments.
•Investment in Operations - Made capital investments of approximately $190.9 million, including $54.6 million at Greens Creek, $72.9 million at Lucky Friday and $58.2 million at Keno Hill.
•Deleveraged and Strengthened Balance Sheet - Redeemed $212 million of our Senior Notes using proceeds from the sale of stock under our ATM program. In addition, cash flow from operating activities of $562.6 million allowed for full repayment of IQ notes in July and full repayment of the revolving credit facility in September.
Our average realized prices for silver, gold and zinc increased in both 2025 and 2024 compared to 2024 and 2023 respectively. See the Consolidated Results of Operations section below for information on our average realized metals prices for 2025, 2024 and 2023. Lead and zinc represent important by-products at all our silver operations, and gold is also a significant by-product at Greens Creek. Copper is a minor by-product credit at Greens Creek.
See the Consolidated Results of Operations section below for a discussion of the factors impacting income applicable to common stockholders for the three years ended December 31, 2025, 2024 and 2023.
Key Issues Impacting our Business
Our current business strategy is to focus our financial and human resources in the following areas:
•operating our properties safely, in an environmentally responsible and cost-effective manner;
•strengthen our balance sheet to preserve our financial position in varying metals price and operational environments, improve capital allocation framework with a focus on ROIC and increasing free cash flow;
•improving and optimizing operations at all sites, which includes incurring costs for new technologies and equipment, and implementing standardized systems and processes;
•optimize asset portfolio and identify growth opportunities;
•expanding our proven and probable reserves, mineral resources and production capacity at our properties;
•advancing the development and ramp-up of the Keno Hill mine to sustained profitability;
•seeking opportunities to acquire and invest in mining and exploration properties and companies;
•advancing permitting of the Libby Exploration project in Montana;
•enhance ESG performance and risk management systems;
•build high-performing teams and strengthen organizational capabilities; and
•maintaining and investing in exploration and pre-development projects in the vicinities of mining districts and projects we believe to be under-explored and under-invested: Greens Creek on Alaska's Admiralty Island located near Juneau; North Idaho's Silver Valley in the historic Coeur d'Alene Mining District; our projects located in two districts in Nevada; our projects in the Keno Hill mining district in the Yukon Territory, Canada; northwestern Montana; and the Republic Mining District in Washington state.
We strive to achieve excellent safety and health performance everywhere we work. We seek to implement this goal by: training employees in safe work practices; establishing, following and improving safety standards; investigating accidents, incidents and losses to avoid recurrence; involving employees in the establishment of safety standards; and participating in the National Mining Association’s CORESafety program. We strive for continuous improvement in mine safety and emergency preparedness by staying current with industry best practices, while implementing measures that are appropriate for our operations and the risks we face. We respond to issues outlined in investigations and inspections by MSHA, the Commission of Labor Standards, Pay Equity and Occupational Health and Safety in Quebec, the Workers' Safety and Compensation Board in the Yukon and the Mexico Ministry of Economy and Mining and continue to evaluate our safety practices. There can be no assurance that our practices will mitigate or eliminate all safety risks. Achieving and maintaining compliance with regulations will be challenging and may increase our operating costs. See Item 1A. Risk Factors - We face substantial governmental regulation, including in the United States the Mine Safety and Health Act, various environmental laws and regulations and the 1872 Mining Law.
A number of key factors may impact the execution of our strategy, including regulatory issues, metals prices and inflationary pressures on input costs. Metals prices can be very volatile and are influenced by a number of factors beyond our control (except on a limited basis through the use of derivative contracts). See Item 7. Critical Accounting Estimates and Note 11 of Notes to Consolidated Financial Statements. While we believe longer-term global economic and industrial trends could result in continued demand for the metals we produce, prices have been volatile and there can be no assurance that current prices will continue.
Volatility in global financial markets and other factors can pose a significant challenge to our ability to access credit and equity markets, should we need to do so. We utilize forward contracts and options to manage exposure to declines in the prices of (i) silver, gold, zinc and lead contained in our concentrates that have been shipped but have not yet settled, and (ii) from time to time silver, zinc and lead that we forecast for future concentrate shipments. In addition, we have in place a $225.0 million revolving credit agreement. As of December 31, 2025, no amount was drawn on the facility, with $6.7 million being used for letters of credit, no amount was drawn on the facility, leaving approximately $218.3 million available for borrowing.
Another challenge for us is the risk associated with environmental litigation and ongoing reclamation activities. As described in Item 1A. Risk Factors and in Note 17 of Notes to Consolidated Financial Statements, it is possible that our estimate of these liabilities may change in the future, affecting our strategic plans. We are involved in various environmental legal matters and the estimate of our environmental liabilities and liquidity needs, as well as our strategic plans, may be significantly impacted as a result of these matters or new matters that may arise. We strive to ensure that our activities are conducted in compliance with applicable laws and regulations and attempt to resolve environmental litigation on terms as favorable to us as possible.
Reserve and resource estimation is a major risk inherent in mining. Our reserve and resource estimates, which underlie (i) our mining and investment plans, (ii) the valuation of a significant portion of our long-term assets and (iii) depreciation, depletion and amortization expense, may change based on economic factors and actual production experience. Until ore is mined and processed, the volumes and grades of our reserves and resources must be considered as estimates. Our reserves are depleted as we mine. Reserves and resources can also change as a result of changes in economic and operating assumptions. See Item 1A. Risk Factors - Our mineral reserve and resource estimates may be imprecise.
Consolidated Results of Operations
Total metal sales for the years ended December 31, 2025, 2024 and 2023, and the approximate variances attributed to differences in metals prices, sales volumes and smelter terms, were as follows:
|
|
|
|
|
|
|
|
|
|
|
|
|
|
|
|
|
|
|
|
|
(in thousands) |
|
Silver |
|
|
Gold |
|
|
Base metals |
|
|
Less: smelter and refining charges |
|
|
Total sales of products |
|
2023 |
|
$ |
301,768 |
|
|
$ |
97,449 |
|
|
$ |
188,958 |
|
|
$ |
(50,909 |
) |
|
$ |
537,266 |
|
Variances - 2024 versus 2023: |
|
|
|
|
|
|
|
|
|
|
|
|
|
|
|
Price |
|
|
75,889 |
|
|
|
21,646 |
|
|
|
(2,873 |
) |
|
|
10,743 |
|
|
|
105,405 |
|
Volume |
|
|
35,655 |
|
|
|
(9,850 |
) |
|
|
32,321 |
|
|
|
(2,485 |
) |
|
|
55,641 |
|
Smelter terms |
|
|
— |
|
|
|
— |
|
|
|
— |
|
|
|
1,378 |
|
|
|
1,378 |
|
2024 |
|
$ |
413,312 |
|
|
$ |
109,245 |
|
|
$ |
218,406 |
|
|
$ |
(41,273 |
) |
|
$ |
699,690 |
|
Variances - 2025 versus 2024: |
|
|
|
|
|
|
|
|
|
|
|
|
|
|
|
Price |
|
|
253,523 |
|
|
|
52,723 |
|
|
|
(5,131 |
) |
|
|
17,822 |
|
|
|
318,937 |
|
Volume |
|
|
21,548 |
|
|
|
4,028 |
|
|
|
13,145 |
|
|
|
208 |
|
|
|
38,929 |
|
Smelter terms |
|
|
— |
|
|
|
— |
|
|
|
— |
|
|
|
7,228 |
|
|
|
7,228 |
|
2025 |
|
$ |
688,383 |
|
|
$ |
165,996 |
|
|
$ |
226,420 |
|
|
$ |
(16,015 |
) |
|
$ |
1,064,784 |
|
Average market and realized metals prices for 2025, 2024 and 2023 were as follows:
|
|
|
|
|
|
|
|
|
|
|
|
|
|
|
|
|
|
|
Average price for the year ended December 31, |
|
|
|
|
|
2025 |
|
|
2024 |
|
|
2023 |
|
Silver |
|
Realized price per ounce |
|
$ |
45.25 |
|
|
$ |
28.58 |
|
|
$ |
23.33 |
|
|
|
London PM Fix ($/ounce) |
|
|
39.94 |
|
|
|
28.24 |
|
|
|
23.39 |
|
Gold |
|
Realized price per ounce |
|
|
3,541 |
|
|
|
2,417 |
|
|
|
1,936 |
|
|
|
London PM Fix ($/ounce) |
|
|
3,435 |
|
|
|
2,387 |
|
|
|
1,943 |
|
Lead |
|
Realized price per pound |
|
|
0.94 |
|
|
|
0.97 |
|
|
|
1.03 |
|
|
|
LME Final Cash Buyer ($/pound) |
|
|
0.89 |
|
|
|
0.94 |
|
|
|
0.97 |
|
Zinc |
|
Realized price per pound |
|
|
1.39 |
|
|
|
1.37 |
|
|
|
1.35 |
|
|
|
LME Final Cash Buyer ($/pound) |
|
|
1.30 |
|
|
|
1.26 |
|
|
|
1.20 |
|
Copper |
|
Realized price per pound |
|
|
4.75 |
|
|
|
4.20 |
|
|
|
— |
|
|
|
LME Final Cash Buyer ($/pound) |
|
|
4.51 |
|
|
|
4.15 |
|
|
NA |
|
Average realized prices differ from average market prices primarily because concentrate sales are generally recorded as revenues at the time of shipment at forward prices for the estimated month of settlement, which differ from average market prices. Due to the time elapsed between shipment of concentrates and final settlement with customers, we must estimate the prices at which sales of our metals will be settled. Previously recorded sales are adjusted to estimated settlement metals prices each period through final settlement. For 2025, 2024, and 2023, we recorded net positive price adjustments to provisional settlements of $51.0 million, $22.9 million, and $18.2 million, respectively. The price adjustments related to silver, gold, zinc, and lead contained in our concentrate sales were partially offset by gains and losses on derivative instruments for those metals for each year (see Note 11 of Notes to Consolidated Financial Statements for more information). The gains and losses on these contracts are included in revenues and impact the realized prices for silver, gold, lead and zinc. Realized prices are calculated by dividing gross revenues for each metal (which include the price adjustments and gains and losses on the forward contracts discussed above) by the payable quantities of each metal included in products sold during the period.
Total metals production and sales volumes for each period are shown in the following table:
|
|
|
|
|
|
|
|
|
|
|
|
|
|
|
|
|
|
|
Year Ended December 31, |
|
|
|
|
|
2025 |
|
|
2024 |
|
|
2023 |
|
Silver - |
|
Ounces produced |
|
|
17,004,172 |
|
|
|
16,145,699 |
|
|
|
14,320,448 |
|
|
|
Payable ounces sold |
|
|
15,213,921 |
|
|
|
14,461,604 |
|
|
|
12,932,440 |
|
Gold - |
|
Ounces produced |
|
|
59,349 |
|
|
|
55,275 |
|
|
|
60,896 |
|
|
|
Payable ounces sold |
|
|
46,873 |
|
|
|
45,201 |
|
|
|
50,334 |
|
Lead - |
|
Tons produced |
|
|
56,130 |
|
|
|
52,515 |
|
|
|
40,347 |
|
|
|
Payable tons sold |
|
|
48,727 |
|
|
|
44,795 |
|
|
|
35,429 |
|
Zinc - |
|
Tons produced |
|
|
68,558 |
|
|
|
66,308 |
|
|
|
60,579 |
|
|
|
Payable tons sold |
|
|
47,553 |
|
|
|
47,593 |
|
|
|
43,050 |
|
Copper - |
|
Tons produced |
|
|
1,804 |
|
|
|
1,874 |
|
|
|
1,823 |
|
|
|
Payable tons sold |
|
|
337 |
|
|
|
50 |
|
|
|
— |
|
The difference between what we report as “ounces/tons produced” and “payable ounces/tons sold” is attributable to the difference between the quantities of metals contained in our products versus the portion of those metals actually paid for by our customers pursuant to of our sales contract terms. Differences can also arise from inventory changes incidental to shipping schedules, or variances in ore grades which impact the amount of metals contained in concentrates produced and sold.
Sales, costs applicable to sales, costs applicable to sales - temporarily suspended operations, depreciation, depletion and amortization, gross profit (loss), Cash Cost, After By-product Credits, per Ounce (“Cash Cost”) (non-GAAP) and AISC (non-GAAP) at our operating units for 2025, 2024 and 2023 were as follows (in thousands, except for Cash Cost and AISC):
|
|
|
|
|
|
|
|
|
|
|
|
|
|
|
|
|
|
|
|
|
|
|
|
|
|
|
Silver |
|
|
|
|
|
|
Greens Creek |
|
|
Lucky Friday |
|
|
Keno Hill |
|
|
Total Silver (3) |
|
|
Other (4) |
|
|
Total |
|
2025: |
|
|
|
|
|
|
|
|
|
|
|
|
|
|
|
|
|
|
Sales |
|
$ |
612,827 |
|
|
$ |
306,640 |
|
|
$ |
145,317 |
|
|
$ |
1,064,784 |
|
|
$ |
39,118 |
|
|
$ |
1,103,902 |
|
Costs applicable to sales (1) |
|
|
(234,221 |
) |
|
|
(122,635 |
) |
|
|
(71,883 |
) |
|
|
(428,739 |
) |
|
|
(38,574 |
) |
|
|
(467,313 |
) |
Depreciation, depletion and amortization |
|
|
(55,960 |
) |
|
|
(51,055 |
) |
|
|
(19,769 |
) |
|
|
(126,784 |
) |
|
|
— |
|
|
|
(126,784 |
) |
Gross profit |
|
$ |
322,646 |
|
|
$ |
132,950 |
|
|
$ |
53,665 |
|
|
$ |
509,261 |
|
|
$ |
544 |
|
|
$ |
509,805 |
|
Cash Cost, After By-product Credits, per Silver or Gold Ounce (2) |
|
$ |
(8.02 |
) |
|
$ |
8.66 |
|
|
|
|
|
$ |
(1.75 |
) |
|
|
|
|
|
|
AISC, After By-product Credits, per Silver or Gold Ounce (2) |
|
$ |
(2.36 |
) |
|
$ |
21.98 |
|
|
|
|
|
$ |
11.28 |
|
|
|
|
|
|
|
2024: |
|
|
|
|
|
|
|
|
|
|
|
|
|
|
|
|
|
|
Sales |
|
$ |
421,574 |
|
|
$ |
203,154 |
|
|
$ |
74,962 |
|
|
$ |
699,690 |
|
|
$ |
20,556 |
|
|
$ |
720,246 |
|
Costs applicable to sales (1) |
|
|
(214,677 |
) |
|
|
(103,436 |
) |
|
|
(81,336 |
) |
|
|
(399,449 |
) |
|
|
(20,527 |
) |
|
|
(419,976 |
) |
Costs applicable to sales - temporarily suspended operations (1) |
|
|
— |
|
|
|
(1,583 |
) |
|
|
— |
|
|
|
(1,583 |
) |
|
|
— |
|
|
|
(1,583 |
) |
Depreciation, depletion and amortization |
|
|
(53,450 |
) |
|
|
(41,673 |
) |
|
|
(20,380 |
) |
|
|
(115,503 |
) |
|
|
— |
|
|
|
(115,503 |
) |
Gross profit (loss) |
|
$ |
153,447 |
|
|
$ |
56,462 |
|
|
$ |
(26,754 |
) |
|
$ |
183,155 |
|
|
$ |
29 |
|
|
$ |
183,184 |
|
Cash Cost, After By-product Credits, per Silver or Gold Ounce (2) |
|
$ |
(0.05 |
) |
|
$ |
7.80 |
|
|
|
|
|
$ |
2.72 |
|
|
|
|
|
|
|
AISC, After By-product Credits, per Silver or Gold Ounce (2) |
|
$ |
5.65 |
|
|
$ |
16.50 |
|
|
|
|
|
$ |
13.06 |
|
|
|
|
|
|
|
2023: |
|
|
|
|
|
|
|
|
|
|
|
|
|
|
|
|
|
|
Sales |
|
$ |
384,504 |
|
|
$ |
116,284 |
|
|
$ |
35,518 |
|
|
$ |
536,306 |
|
|
$ |
6,243 |
|
|
$ |
542,549 |
|
Costs applicable to sales (1) |
|
|
(205,900 |
) |
|
|
(59,859 |
) |
|
|
(59,083 |
) |
|
|
(324,842 |
) |
|
|
(6,200 |
) |
|
|
(331,042 |
) |
Costs applicable to sales - temporarily suspended operations (1) |
|
|
— |
|
|
|
(20,489 |
) |
|
|
— |
|
|
|
(20,489 |
) |
|
|
— |
|
|
|
(20,489 |
) |
Depreciation, depletion and amortization |
|
|
(53,995 |
) |
|
|
(29,384 |
) |
|
|
(6,228 |
) |
|
|
(89,607 |
) |
|
|
(140 |
) |
|
|
(89,747 |
) |
Gross profit (loss) |
|
$ |
124,609 |
|
|
$ |
6,552 |
|
|
$ |
(29,793 |
) |
|
$ |
101,368 |
|
|
$ |
(97 |
) |
|
$ |
101,271 |
|
Cash Cost, After By-product Credits, per Silver or Gold Ounce (2) |
|
$ |
2.53 |
|
|
$ |
5.51 |
|
|
|
|
|
$ |
3.23 |
|
|
|
|
|
|
|
AISC, After By-product Credits, per Silver or Gold Ounce (2) |
|
$ |
7.14 |
|
|
$ |
12.21 |
|
|
|
|
|
$ |
11.76 |
|
|
|
|
|
|
|
(1)Excludes depreciation, depletion and amortization
(2)A reconciliation of these non-GAAP measures to costs applicable to sales, the most comparable GAAP measure, can be found below in Reconciliation of Costs Applicable to Sales (GAAP) to Cash Cost, Before By-product Credits and Cash Cost, After By-product Credits (non-GAAP) and All-In Sustaining Cost, Before By-product Credits and All-In Sustaining Cost, After By-product Credits (non-GAAP).
(3)The calculation of AISC for our consolidated silver properties includes corporate costs for general and administrative expense, sustaining capital and production, and related costs and sustaining capital expenditures for Lucky Friday excluding costs incurred during suspension of production from August 2023 until the resumption of operations on January 9, 2024.
(4)Other includes $39.1 million, $20.6 million and $6.2 million of sales for 2025, 2024, and 2023, respectively, and $38.6 million, $20.5 million, and $6.3 million for, 2025, 2024, and 2023, respectively, related to ERDC, the Company's environmental services business.
While revenue from zinc, lead, and gold by-products is significant, we believe that identification of silver as the primary product of Greens Creek, Lucky Friday, and Keno Hill is appropriate because:
•silver has historically accounted for a higher proportion of revenue than any other metal and is expected to do so in the future;
•we have historically presented the Greens Creek and Lucky Friday units as primary silver producers, based on the original analysis that justified putting the project into production, and the same analysis applies to the Keno Hill unit, and further we believe that consistency in disclosure is important to our investors regardless of the relationships of metals prices and production from year to year;
•metallurgical treatment maximizes silver recovery;
•the Greens Creek, Lucky Friday, and Keno Hill deposits are massive sulfide deposits containing an unusually high proportion of silver; and
•in most of their working areas, Greens Creek, Lucky Friday, and Keno Hill utilize selective mining methods in which silver is the metal targeted for highest recovery.
Accordingly, we believe the identification of gold, lead, zinc, and copper as by-product credits at Greens Creek, Lucky Friday, and Keno Hill is appropriate because of their lower economic value compared to silver and due to the fact that silver is the primary product we intend to produce at those locations. In addition, we have not consistently received sufficient revenue from any single by-product metal to warrant classification of such as a co-product.
We periodically review our revenues to ensure that reporting of primary products and by-products is appropriate. Because for Greens Creek, Lucky Friday, and Keno Hill we consider zinc, lead, gold, and copper to be by-products of our silver production, the values of these metals from Greens Creek and Lucky Friday only offset operating costs within our calculations of Cash Cost, After By-product Credits, per Silver Ounce and AISC, After By-product Credits, per Silver Ounce. We currently do not report Cash Cost, After By-product Credits, per Silver Ounce and AISC, After By-product Credits, per Silver Ounce for our Keno Hill operation as it is in the production ramp-up phase and has not met our definition of commercial production. We define an operation as being in commercial production upon achievement of the following criteria:
•Completion of operational commissioning of each major mine and mill component;
•Demonstrated ability to mine and mill consistently and without significant interruption, defined as 75% of historical production levels or mill design capacity over a period of 90 days;
•Silver recoveries are at or near expected steady-state production levels;
•All major capital expenditures have been completed; and
•A significant portion of available funding is directed towards operating activities.
Currently we meet only one of the above criteria - silver recoveries are at expected steady-state production levels. Determination of when these criteria have been met requires the use of judgment, and our definition of commercial production may differ from that of other mining companies.
As Keno Hill has not yet been determined to be in commercial production, it's costs and by-product credits are excluded from our consolidated Cash Cost, After By-product Credits, per Silver Ounce and AISC, After By-product Credits, per Silver Ounce because (i) by definition it has not reached the sustaining stage and (ii) including its costs and by-product credits we believe would distort consolidated Cash Cost, After By-product Credits, per Silver Ounce and AISC, After By-product Credits, per Silver Ounce of our operating silver mines that are in commercial production and operating as designed, and not facilitate a meaningful comparison of our performance versus that of our peers.
For the year ended December 31, 2025 and 2024, we reported income from continuing operations of $258.1 million and $50.2 million, respectively, and a loss from continuing operations of $40.2 million in 2023. The following factors contributed to those differences:
•Variances in gross profit (loss) at our operations as illustrated in the table above. See the Greens Creek, Lucky Friday and Keno Hill sections below.
•General and administrative costs were $57.6 million, $45.4 million, and $40.6 million in 2025, 2024, and 2023 respectively. The increase in 2025 of $12.2 million reflects strategic headcount increases, higher stock-based and incentive compensation expense and non-recurring compensation costs related to former employees retirements. The increase in 2024 of $4.8 million primarily reflects non-recurring costs associated with the former CEO's retirement and higher incentive compensation.
•Exploration and pre-development expense was $27.4 million, $25.5 million, and $26.8 million in 2025, 2024, and 2023, respectively. In all periods, exploration activities were focused primarily at Greens Creek and Keno Hill, with additional pre-development work at the Libby Exploration project.
•Care and maintenance costs were $14.0 million, $14.3 million, and $18.7 million in 2025, 2024, and 2023 and are holding costs incurred at our former San Sebastian and Nevada operations, as all operations at these sites were suspended during these periods.
•Other operating expense was $6.5 million in 2025, compared to other operating income of $47.2 million and $4.5 million in 2024 and 2023, respectively. The income in 2024 is primarily related to the Lucky Friday business interruption insurance proceeds of $50 million related to the aforementioned fire.
•In 2024 we recognized $14.6 million in write down of property, plant and equipment. Of this amount, $13.9 million related to the Lucky Friday remote vein miner machine for which (i) we no longer had a use following the success of the UCB mining method at Lucky Friday, (ii) we had been unsuccessful in locating a buyer, and (iii) the vendor advised us during the period that it would discontinue support for the program.
•Fair value adjustments, net resulted in gains of $8.3 million, $3.5 million, and $1.7 million in 2025, 2024, and 2023, respectively. The components for each period are summarized in the following table (in thousands):
|
|
|
|
|
|
|
|
|
|
|
|
|
|
|
Year Ended December 31, |
|
|
|
2025 |
|
|
2024 |
|
|
2023 |
|
(Loss) gain on derivative contracts |
|
$ |
(43,568 |
) |
|
$ |
(162 |
) |
|
$ |
1,978 |
|
Unrealized gain (loss) on investments in equity securities |
|
|
40,914 |
|
|
|
3,703 |
|
|
|
(243 |
) |
Gain on disposition or exchange of investments |
|
|
10,986 |
|
|
|
— |
|
|
|
— |
|
Total fair value adjustments, net |
|
$ |
8,332 |
|
|
$ |
3,541 |
|
|
$ |
1,735 |
|
•Net foreign exchange loss of $6.0 million in 2025, compared to a gain of $8.1 million in 2024, and a loss of $4.1 million in 2023, on translation of our non-US monetary assets and liabilities at Keno Hill and San Sebastian.
•Interest expense of $41.0 million, $49.3 million, and $43.1 million in 2025, 2024, and 2023, respectively. In 2025, interest expense decreased due to lower debt balances following early redemption of $212 million of Senior Notes, full repayment of our IQ Notes, and a lower drawn balance on our revolving credit facility. In connection with the early redemption of the $212 million of Senior Notes, we incurred a loss on extinguishment of $4.9 million, of which $3.8 million related to the call premium and $1.1 million related to the pro-rata expensing of deferred debt issuance costs. In 2024, interest expense also included interest of $9.3 million on amounts drawn on our revolving credit facility.
•Income and mining tax provision of $98.7 million, $40.0 million, and $12.2 million in 2025, 2024, and 2023, respectively. Income and mining tax provision increased in 2025 and 2024 due to higher taxable income generated by our US operations.
Greens Creek
|
|
|
|
|
|
|
|
|
|
|
|
|
Dollars are in thousands (except per ounce and per ton amounts) |
|
Years Ended December 31, |
|
|
|
2025 |
|
|
2024 |
|
|
2023 |
|
Sales |
|
$ |
612,827 |
|
|
$ |
421,574 |
|
|
$ |
384,504 |
|
Costs applicable to sales (1) |
|
|
(234,221 |
) |
|
|
(214,677 |
) |
|
|
(205,900 |
) |
Depreciation, depletion and amortization |
|
|
(55,960 |
) |
|
|
(53,450 |
) |
|
|
(53,995 |
) |
Gross profit |
|
$ |
322,646 |
|
|
$ |
153,447 |
|
|
$ |
124,609 |
|
|
|
|
|
|
|
|
|
|
|
Tons of ore milled |
|
|
871,659 |
|
|
|
895,318 |
|
|
|
914,796 |
|
Production: |
|
|
|
|
|
|
|
|
|
Silver (ounces) |
|
|
8,724,996 |
|
|
|
8,480,877 |
|
|
|
9,731,752 |
|
Gold (ounces) |
|
|
59,349 |
|
|
|
55,275 |
|
|
|
60,896 |
|
Lead (tons) |
|
|
18,213 |
|
|
|
18,320 |
|
|
|
19,578 |
|
Zinc (tons) |
|
|
51,387 |
|
|
|
51,288 |
|
|
|
51,496 |
|
Copper (tons) |
|
|
1,804 |
|
|
|
1,874 |
|
|
|
1,823 |
|
Payable metal quantities sold: |
|
|
|
|
|
|
|
|
|
Silver (ounces) |
|
|
7,375,295 |
|
|
|
7,331,502 |
|
|
|
8,493,040 |
|
Gold (ounces) |
|
|
46,873 |
|
|
|
45,201 |
|
|
|
49,790 |
|
Lead (tons) |
|
|
13,585 |
|
|
|
13,706 |
|
|
|
15,247 |
|
Zinc (tons) |
|
|
35,957 |
|
|
|
36,725 |
|
|
|
36,042 |
|
Copper (tons) |
|
|
337 |
|
|
|
50 |
|
|
|
— |
|
Ore grades: |
|
|
|
|
|
|
|
|
|
Silver ounces per ton |
|
|
12.6 |
|
|
|
12.0 |
|
|
|
13.3 |
|
Gold ounces per ton |
|
|
0.092 |
|
|
|
0.086 |
|
|
|
0.089 |
|
Lead percent |
|
|
2.5 |
|
|
|
2.5 |
|
|
|
2.6 |
|
Zinc percent |
|
|
6.6 |
|
|
|
6.4 |
|
|
|
6.4 |
|
Copper percent |
|
|
0.3 |
|
|
|
0.3 |
|
|
|
0.3 |
|
Total production cost per ton |
|
$ |
249.77 |
|
|
$ |
216.15 |
|
|
$ |
204.20 |
|
Cash Cost, After By-product Credits, per Silver Ounce (2) |
|
$ |
(8.02 |
) |
|
$ |
(0.05 |
) |
|
$ |
2.53 |
|
AISC, After By-Product Credits, per Silver Ounce (2) |
|
$ |
(2.36 |
) |
|
$ |
5.65 |
|
|
$ |
7.14 |
|
Capital additions |
|
$ |
54,617 |
|
|
$ |
47,795 |
|
|
$ |
43,542 |
|
(1)Excludes depreciation, depletion and amortization
(2)A reconciliation of these non-GAAP measures to costs applicable to sales, the most comparable GAAP measure, can be found below in Reconciliation of Costs Applicable to Sales (GAAP) to Cash Cost, Before By-product Credits and Cash Cost, After By-product Credits (non-GAAP) and All-In Sustaining Cost, Before By-product Credits and All-In Sustaining Cost, After By-product Credits (non-GAAP). At Greens Creek, gold, zinc, lead and copper are considered to be by-products of our silver production, and the values of those metals therefore offset operating costs within our calculations of Cash Cost and AISC, After By-product Credits, per Silver Ounce.
Gross profit increased by $169.2 million to $322.6 million in 2025 from $153.4 million in 2024, due to higher realized prices for all metals sold (other than lead) and higher sales volumes, except for lead and zinc which drove record annual revenues, partially offset by higher production costs which were primarily attributable to higher labor, contractor costs and materials and consumables. See Item 1A. Risk Factors - Our profitability could be affected by inflation, including the prices of other commodities for a discussion of certain risks related to our operations profitability.
Gross profit increased by $28.8 million to $153.4 million in 2024 from $124.6 million in 2023, due to higher realized prices for all metals sold other than lead, partly offset by lower sales volumes for all metals, except zinc, and higher production costs which primarily consist of higher labor and contractor costs and higher equipment maintenance. See Item 1A. Risk Factors - Our profitability could be affected by inflation, including the prices of other commodities for a discussion of certain risks related to our operations profitability.
Capital additions increased by $6.8 million in 2025 to $54.6 million compared to 2024. Significant components of the 2025 capital additions were $17.9 million on mine and primary ore access development, $14.0 million on mine equipment, $7.7 million on surface equipment and infrastructure, $5.8 million on mill improvements and $4.0 million of definition drilling.
The chart below illustrates the factors contributing to the variances in Cash Cost, After By-product Credits, Per Silver Ounce for 2025 compared to 2024 and 2023:
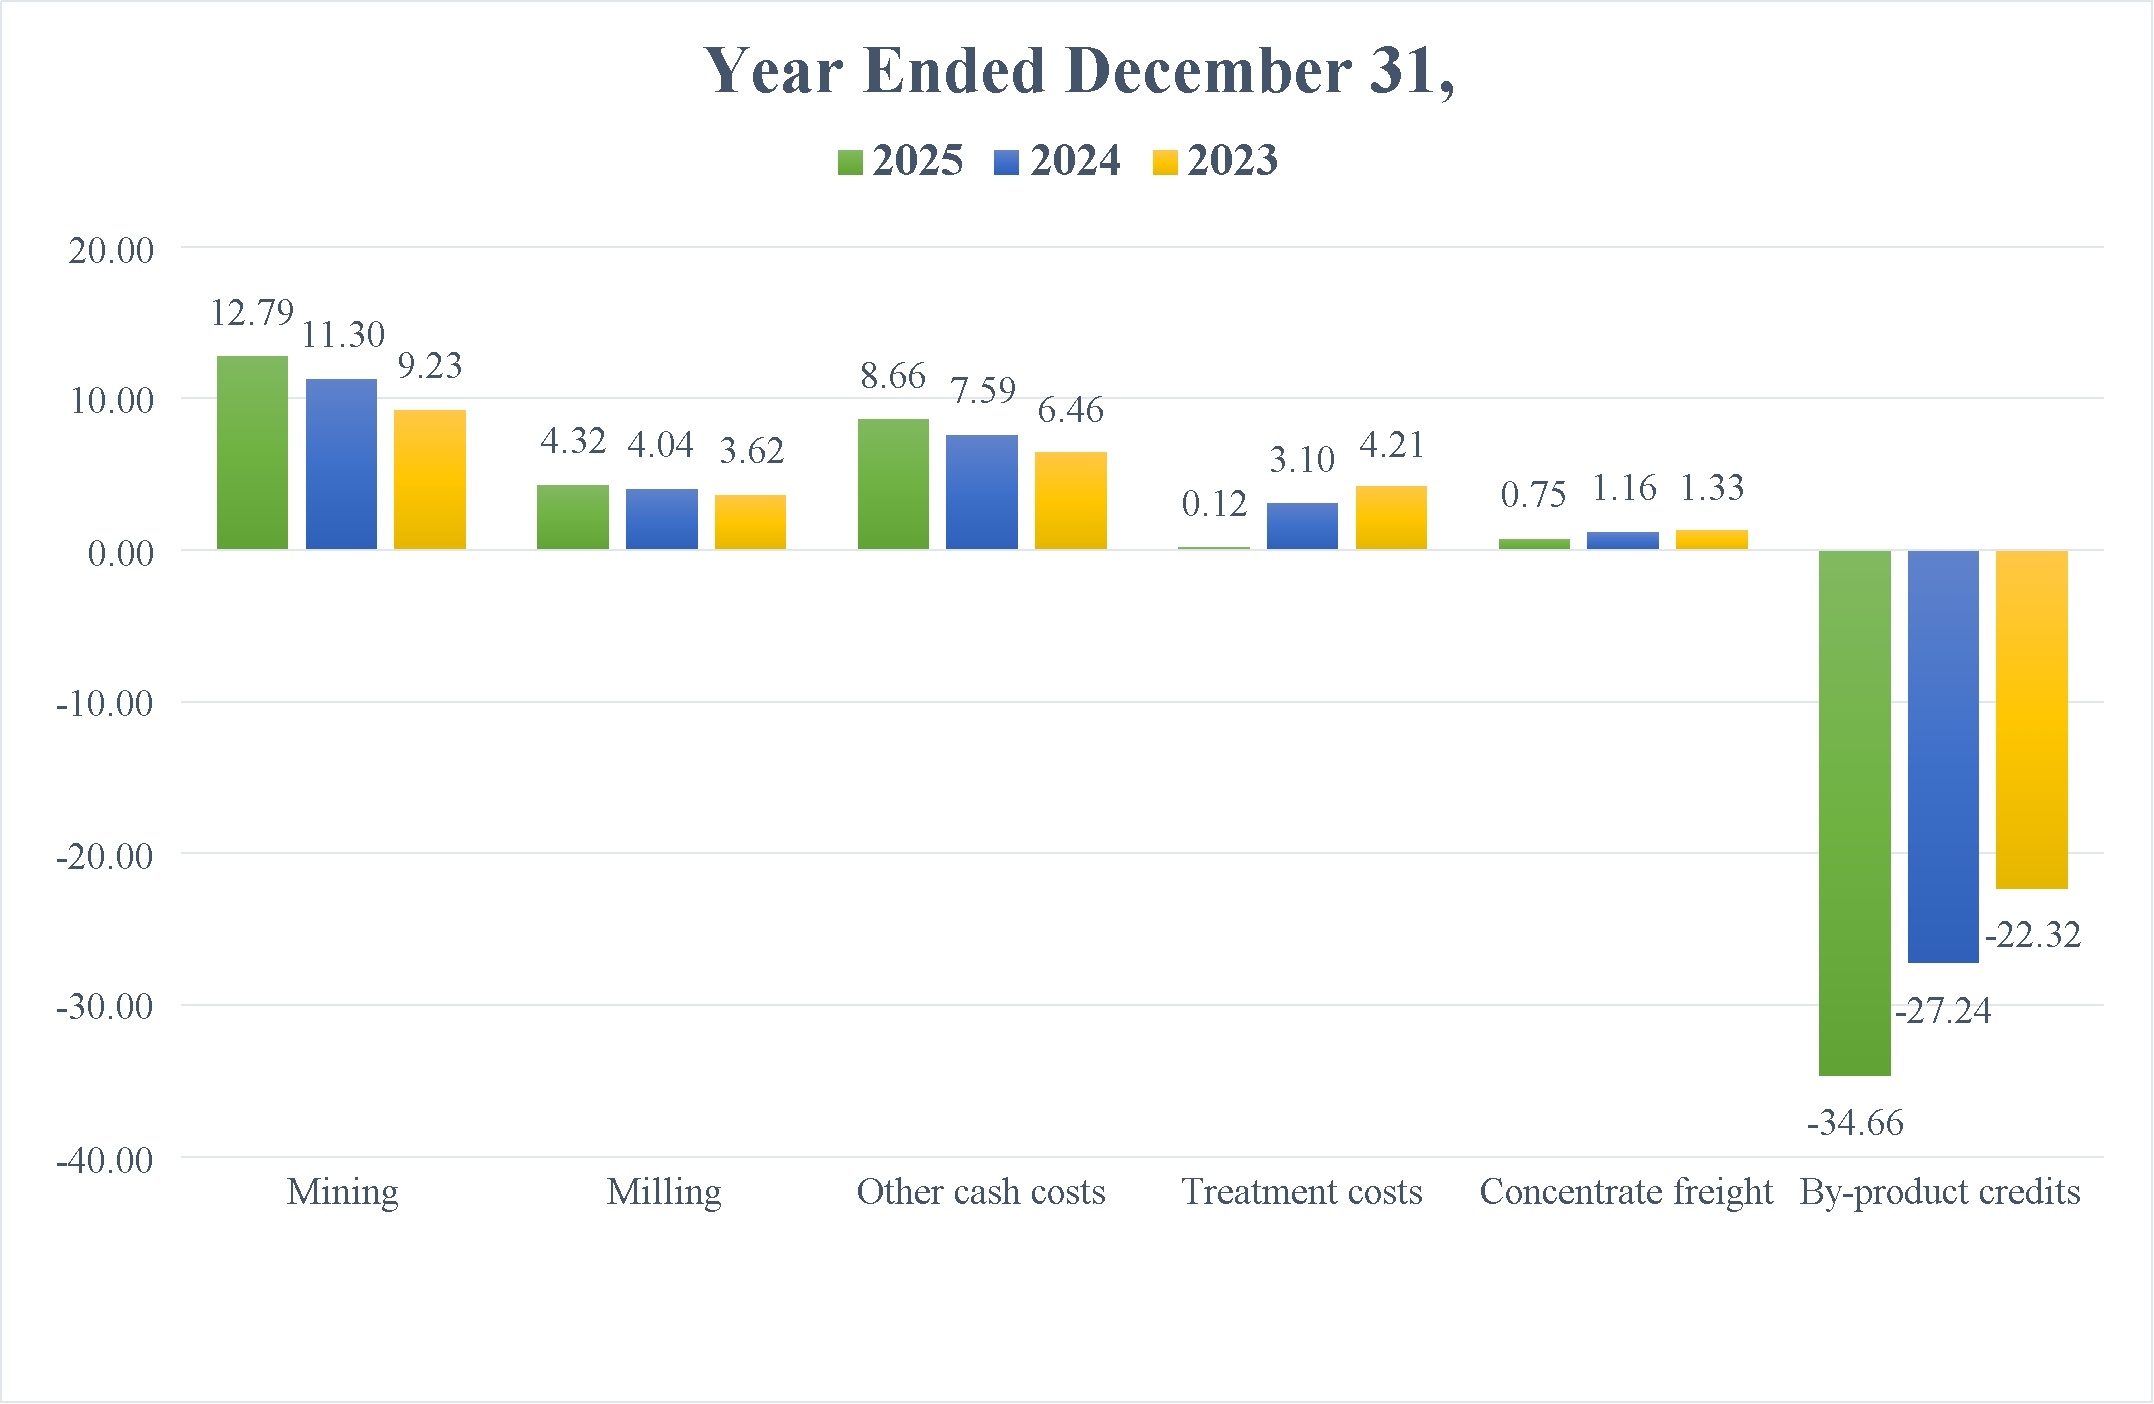
The following table summarizes the components of Cash Cost, After By-product Credits, per Silver Ounce:
|
|
|
|
|
|
|
|
|
|
|
|
|
|
|
Years Ended December 31, |
|
|
|
2025 |
|
|
2024 |
|
|
2023 |
|
Cash Cost, Before By-product Credits, per Silver Ounce |
|
$ |
26.64 |
|
|
$ |
27.19 |
|
|
$ |
24.85 |
|
By-product credits per silver ounce |
|
|
(34.66 |
) |
|
|
(27.24 |
) |
|
|
(22.32 |
) |
Cash Cost, After By-product Credits, per Silver Ounce |
|
$ |
(8.02 |
) |
|
$ |
(0.05 |
) |
|
$ |
2.53 |
|
The following table summarizes the components of AISC, After By-product Credits, per Silver Ounce:
|
|
|
|
|
|
|
|
|
|
|
|
|
|
|
Years Ended December 31, |
|
|
|
2025 |
|
|
2024 |
|
|
2023 |
|
AISC, Before By-product Credits, per Silver Ounce |
|
$ |
32.30 |
|
|
$ |
32.89 |
|
|
$ |
29.46 |
|
By-product credits per silver ounce |
|
|
(34.66 |
) |
|
|
(27.24 |
) |
|
|
(22.32 |
) |
AISC, After By-product Credits, per Silver Ounce |
|
$ |
(2.36 |
) |
|
$ |
5.65 |
|
|
$ |
7.14 |
|
The decrease in Cash Cost, After By-product Credits and AISC, After By-product Credits per Silver Ounce in 2025 compared to 2024 was primarily due to higher by-product credits, primarily due to higher realized gold prices and higher silver production. The decrease in Cash Cost, After By-product Credits, per Silver Ounce in 2024 compared to 2023 was primarily due to higher by-product credits, primarily due to higher realized gold prices, partly offset by lower silver production due to 7 days of unplanned maintenance on the Semi-Autogenous Grinding ("SAG") mill variable frequency drive and lower grade material mined and higher production costs primarily related to higher labor and contractor costs driven by inflation and higher equipment maintenance costs. AISC, After By-product Credits, decreased due to lower cash costs per ounce, partly offset by higher sustaining capital expenditures in 2024 compared to 2023.
Lucky Friday
|
|
|
|
|
|
|
|
|
|
|
|
|
Dollars are in thousands (except per ounce and per ton amounts) |
|
Years Ended December 31, |
|
|
|
2025 |
|
|
2024 |
|
|
2023 |
|
Sales |
|
$ |
306,640 |
|
|
$ |
203,154 |
|
|
$ |
116,284 |
|
Costs applicable to sales (1) |
|
|
(122,635 |
) |
|
|
(103,436 |
) |
|
|
(59,859 |
) |
Costs applicable to sales - temporarily suspended operations (1)(2) |
|
|
— |
|
|
|
(1,583 |
) |
|
|
(20,489 |
) |
Depreciation, depletion and amortization (2) |
|
|
(51,055 |
) |
|
|
(41,673 |
) |
|
|
(29,384 |
) |
Gross profit |
|
$ |
132,950 |
|
|
$ |
56,462 |
|
|
$ |
6,552 |
|
|
|
|
|
|
|
|
|
|
|
Tons of ore milled |
|
|
427,048 |
|
|
|
406,541 |
|
|
|
231,129 |
|
Production: |
|
|
|
|
|
|
|
|
|
Silver (ounces) |
|
|
5,260,686 |
|
|
|
4,890,949 |
|
|
|
3,086,119 |
|
Lead (tons) |
|
|
34,284 |
|
|
|
31,265 |
|
|
|
19,543 |
|
Zinc (tons) |
|
|
14,924 |
|
|
|
13,513 |
|
|
|
7,944 |
|
Payable metal quantities sold: |
|
|
|
|
|
|
|
|
|
Silver (ounces) |
|
|
4,925,162 |
|
|
|
4,506,632 |
|
|
|
3,020,116 |
|
Lead (tons) |
|
|
31,828 |
|
|
|
28,577 |
|
|
|
19,079 |
|
Zinc (tons) |
|
|
11,596 |
|
|
|
9,735 |
|
|
|
6,160 |
|
Ore grades: |
|
|
|
|
|
|
|
|
|
Silver ounces per ton |
|
|
13.0 |
|
|
|
12.7 |
|
|
|
14.0 |
|
Lead percent |
|
|
8.5 |
|
|
|
8.2 |
|
|
|
8.9 |
|
Zinc percent |
|
|
4.1 |
|
|
|
3.9 |
|
|
|
4.1 |
|
Total production cost per ton |
|
$ |
272.09 |
|
|
$ |
245.19 |
|
|
$ |
218.45 |
|
Cash Cost, After By-product Credits, per Silver Ounce (3) |
|
$ |
8.66 |
|
|
$ |
7.80 |
|
|
$ |
5.51 |
|
AISC, After By-product Credits, per Silver Ounce (3) |
|
$ |
21.98 |
|
|
$ |
16.50 |
|
|
$ |
12.21 |
|
Capital additions |
|
$ |
72,933 |
|
|
$ |
49,592 |
|
|
$ |
65,337 |
|
(1)Excludes depreciation, depletion and amortization.
(2)Previously reported transfers to ramp-up and suspension costs of $2,207 and $25,548 for 2024 and 2023 respectively, have been included in costs applicable to sales - temporarily suspended operations and depreciation, depletion and amortization.
(3)A reconciliation of these non-GAAP measures to costs applicable to sales, the most comparable GAAP measure, can be found below in Reconciliation of Costs Applicable to Sales (GAAP) to Cash Cost, Before By-product Credits and Cash Cost, After By-product Credits (non-GAAP) and All-In Sustaining Cost, Before By-product Credits and All-In Sustaining Cost, After By-product Credits (non-GAAP). At Lucky Friday, lead and zinc are considered to be by-products of our silver production, and the values of those metals therefore offset operating costs within our calculations of Cash Cost and AISC, each After By-product Credits, per Silver Ounce.
Gross profit in 2025 of $133.0 million, was $76.5 million higher than 2024, primarily due to higher realized prices for silver, and higher sales volumes for all metals produced driven by record production and the suspension of mining operations mentioned above. However, the benefit of higher production and prices has been partly offset by higher costs, reflected in higher production costs per ton which have increased by 11%. For the year, the higher costs relate to: (i) hourly employee profit sharing costs due to higher silver prices and production; (ii) property and liability insurance resulting from higher asset values and coverage limits; (iii) higher employee medical costs related to headcount growth and inflation in medical care costs; (iv) consumables and repairs to support increased production; (v) an increase in mine hourly headcount to reduce reliance on more expensive contractors and support higher production; (vi) higher equipment maintenance costs related to parts as the mine continued to execute our equipment maintenance standards while supporting increased tonnage; and (vii) higher waste rock removal haulage costs.
While certain cost elements will persist as the mine maintains steady and consistent production, we have identified potential cost mitigation plans. These plans include further reduction of contractors, mining method optimization to improve production efficiency and reduction of consumables usage, mine and mill infrastructure upgrades to increase production and reduce maintenance, and consolidation of sourcing of some high-volume consumables to improve pricing. However, there can be no assurance these efforts will be successful in reducing costs or offsetting the potential future impacts of inflation or other factors impacting profitability.
During August 2023, the production at the mine was suspended due to a fire that occurred while repairing an unused station in the #2 ventilation shaft. It was determined that a secondary egress needed to be developed and as a result, the mine did not restart production until January 9, 2024, and ramped up to full production during the first quarter. The Company had property and business interruption insurance coverage with an underground sub-limit of $50.0 million, and received the full coverage amount of $50.0 million
in 2024. The discussion of Lucky Friday's results below for the years ended December 31, 2024 and 2023 has been impacted by this prior suspension of operations.
Gross profit in 2024 of $56.5 million, was $49.9 million higher than 2023, primarily due to higher realized prices for silver, and higher sales volumes for all metals produced due to the suspension of mining operations mentioned above. For the year ended December 31, 2024, $1.6 million of site specific suspension costs were included within costs applicable to sales - temporarily suspended operations on our consolidated statements of operations and comprehensive income (loss), compared to $20.5 million in 2023.
Total capital additions increased by $23.3 million in 2025 to $72.9 million compared to 2024 due to significant projects including $24.5 million for development, $12.1 million for surface cooling project, $11.7 million for pond 5 construction, $6.8 million for definition drilling, $4.4 million for shaft renovation, $2.1 million for bolters, $1.9 million for ramp work and $1.5 million for jumbo replacements.
The chart below illustrates the factors contributing to the variances in Cash Cost, After By-product Credits, Per Silver Ounce for 2025, 2024 and 2023.
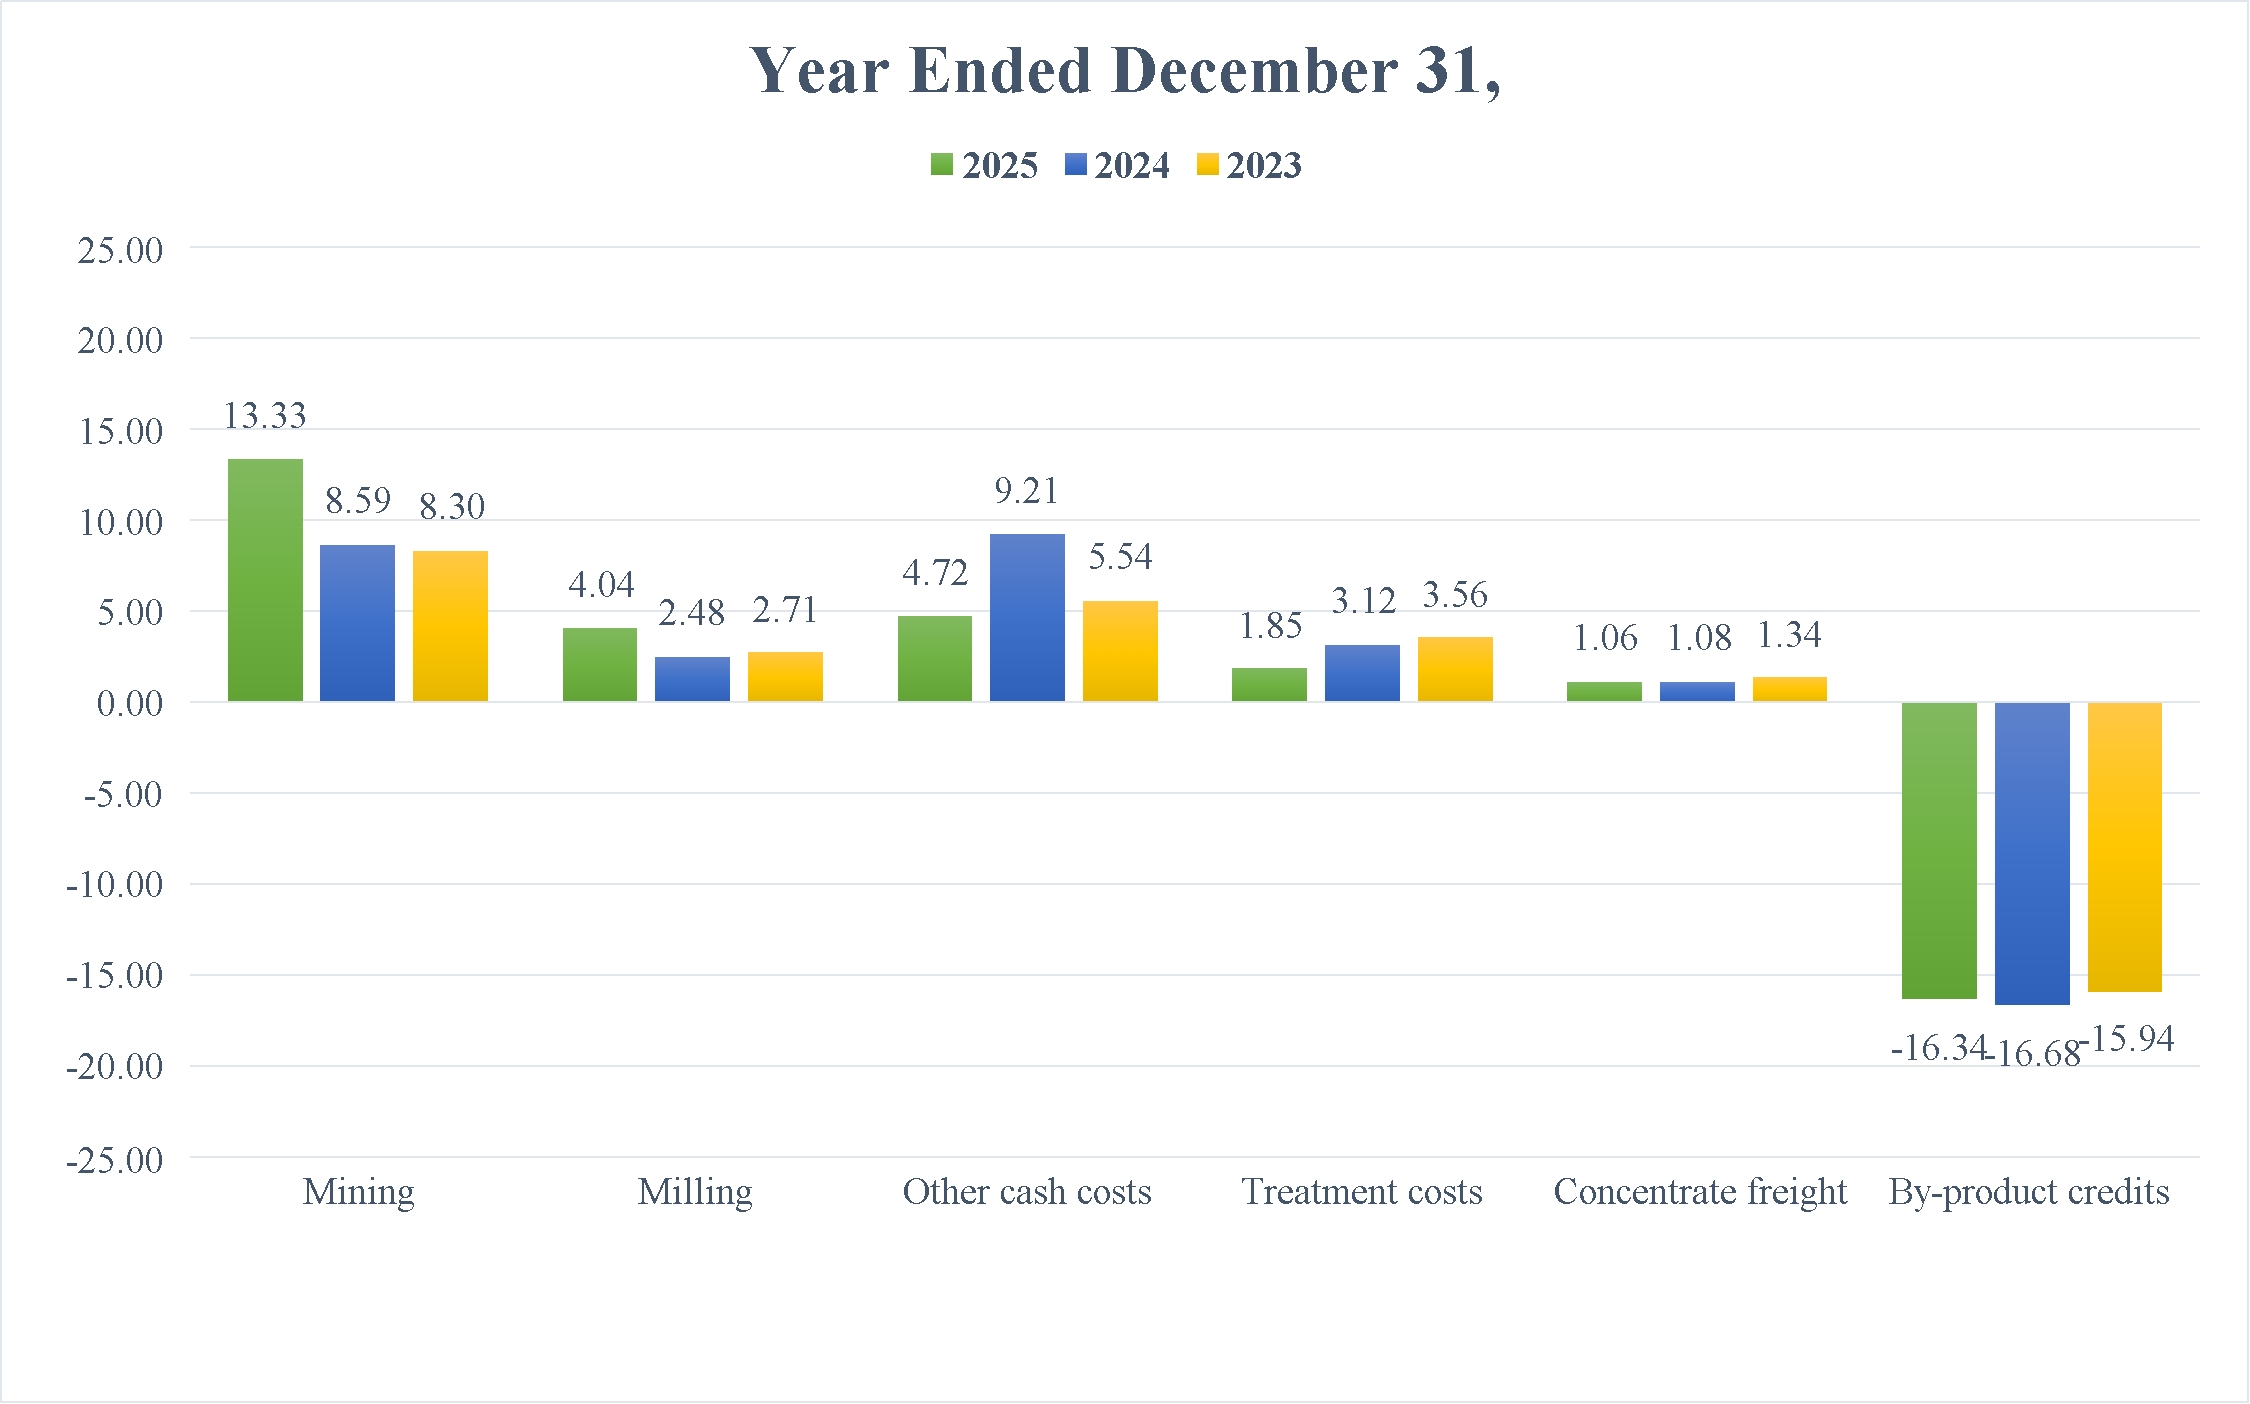
The following table summarizes the components of Cash Cost, After By-product Credits, per Silver Ounce:
|
|
|
|
|
|
|
|
|
|
|
|
|
|
|
Years Ended December 31, |
|
|
|
2025 |
|
|
2024 |
|
|
2023 |
|
Cash Cost, Before By-product Credits, per Silver Ounce |
|
$ |
25.00 |
|
|
$ |
24.48 |
|
|
|
21.45 |
|
By-product credits per silver ounce |
|
|
(16.34 |
) |
|
|
(16.68 |
) |
|
|
(15.94 |
) |
Cash Cost, After By-product Credits, per Silver Ounce |
|
$ |
8.66 |
|
|
$ |
7.80 |
|
|
$ |
5.51 |
|
The following table summarizes the components of AISC, After By-product Credits, per Silver Ounce:
|
|
|
|
|
|
|
|
|
|
|
|
|
|
|
Years Ended December 31, |
|
|
|
2025 |
|
|
2024 |
|
|
2023 |
|
AISC, Before By-product Credits, per Silver Ounce |
|
$ |
38.32 |
|
|
$ |
33.18 |
|
|
$ |
28.15 |
|
By-product credits per silver ounce |
|
|
(16.34 |
) |
|
|
(16.68 |
) |
|
|
(15.94 |
) |
AISC, After By-product Credits, per Silver Ounce |
|
$ |
21.98 |
|
|
$ |
16.50 |
|
|
$ |
12.21 |
|
The increase in Cash Cost and AISC, each After By-product Credits, per Silver Ounce in 2025 compared to 2024 was due to higher production costs, and higher sustaining capital for AISC, partly offset by higher silver production.
The increase in Cash Cost and AISC, each After By-product Credits, per Silver Ounce in 2024 compared to 2023 was due to higher production costs, and higher sustaining capital for AISC, partly offset by higher silver production and higher by-product credits.
Keno Hill
|
|
|
|
|
|
|
|
|
|
|
|
|
Dollars are in thousands (except per ounce and per ton amounts) |
|
Year Ended
December 31, |
|
|
|
2025 |
|
|
2024 |
|
|
2023 |
|
Sales |
|
$ |
145,317 |
|
|
$ |
74,962 |
|
|
$ |
35,518 |
|
Costs applicable to sales (1)(2) |
|
|
(71,883 |
) |
|
|
(81,336 |
) |
|
|
(59,083 |
) |
Depreciation, depletion and amortization (2) |
|
|
(19,769 |
) |
|
|
(20,380 |
) |
|
|
(6,228 |
) |
Gross profit (loss) |
|
$ |
53,665 |
|
|
$ |
(26,754 |
) |
|
$ |
(29,793 |
) |
Tons of ore milled |
|
|
108,339 |
|
|
|
109,292 |
|
|
|
56,331 |
|
Production: |
|
|
|
|
|
|
|
|
|
Silver (ounces) |
|
|
3,018,490 |
|
|
|
2,773,873 |
|
|
|
1,502,577 |
|
Lead (tons) |
|
|
3,633 |
|
|
|
2,930 |
|
|
|
1,225 |
|
Zinc (tons) |
|
|
2,247 |
|
|
|
1,507 |
|
|
|
1,139 |
|
Payable metal quantities sold: |
|
|
|
|
|
|
|
|
|
Silver (ounces) |
|
|
2,925,368 |
|
|
|
2,623,469 |
|
|
|
1,419,173 |
|
Lead (tons) |
|
|
3,314 |
|
|
|
2,513 |
|
|
|
848 |
|
Zinc (tons) |
|
|
1,696 |
|
|
|
1,132 |
|
|
|
1,102 |
|
Ore grades: |
|
|
|
|
|
|
|
|
|
Silver ounces per ton |
|
|
29.0 |
|
|
|
26.2 |
|
|
|
27.7 |
|
Lead percent |
|
|
3.6 |
% |
|
|
2.8 |
% |
|
|
2.3 |
% |
Zinc percent |
|
|
2.6 |
% |
|
|
1.6 |
% |
|
|
2.5 |
% |
Capital additions |
|
$ |
58,192 |
|
|
$ |
54,869 |
|
|
$ |
44,672 |
|
(1)Excludes depreciation, depletion and amortization.
(2)Previously reported transfers to ramp-up and suspension costs of $26,754 and $29,793 for 2024 and 2023, respectively, have been included in costs applicable to sales and depreciation, depletion and amortization.
We have not disclosed cost per ounce statistics for the Keno Hill operation as it is in the production ramp-up phase and has not met our definition of commercial production. See above "Consolidated Results of Operations" for our definition of commercial production. Determination of when those criteria have been met requires the use of judgment, and our definition of commercial production may differ from that of other mining companies.
We acquired our Keno Hill operations as part of the Alexco acquisition in September 2022 and have focused on development activities and began ramp-up of the mill during the second quarter of 2023. The average throughput during the year ended December 31, 2025, was 297 tons per day (the mine is currently permitted to a maximum of an average of 440 tons per day), with silver grades milled of 29.0 ounces per ton. In 2025, the mill relied on existing ore stockpiles as the mine continues to focus on development and ramp-up to higher tonnage rates with mining rates of 297 tons per day, with material sourced from both the Bermingham and Flame and Moth deposits. Mill throughput, while currently steady, has been negatively impacted by last year's events as described below.
During the twelve months ended December 31, 2025 and 2024, Keno Hill recorded sales of $145.3 million and $75.0 million, respectively, with the increase due primarily to higher metals sales volumes and realized prices. As a result of higher revenues, Keno Hill generated gross profit of $53.7 million during the twelve months ended December 31, 2025, compared to a gross loss of $26.8 million during the twelve months ended December 31, 2024. During 2025, Keno Hill recorded capital additions of $58.2 million, of which $32.8 million related to mine development, $6.7 million for a backfill plant, $5.2 million related to the dry stack tailings facility ("DSTF"), $4.6 million for surface and general plant additions and $1.4 million for definition drilling. During 2024, Capital additions were $54.9 million, of which $28.1 million related to mine development, $8.8 million related to the DSTF, $5.9 million related to mine mobile equipment, $3.2 million for camp upgrades and $2.9 million for the surface backfill plant.
During 2023, Keno Hill recorded sales and a gross loss of $29.8 million related to the concentrate produced and sold during ramp-up which commenced during the second quarter of 2023. $4.7 million of site specific exploration costs were included within Exploration and pre-development as reported on our consolidated statements of operations and comprehensive (loss) income. Capital additions were $44.7 million, of which $29.6 million related to mine development and $11.3 million to mobile equipment purchases, crusher modifications and camp upgrades.
From commencement of production until late August, 2024, ore production and mill throughput generally increased as planned, leading to increased levels of production (though still not reaching the permitted capacity at the mill). However, starting in mid-2024 and continuing today, Keno Hill has been impacted by external events which have affected permitting, projects and production, and delayed our ability to reach sustained, profitable production. In late June 2024, an unrelated, third party, Victoria Gold, experienced a heap leach failure at its Eagle Mine which is located near Keno Hill. This incident had several immediate and ongoing impacts on our operations. The primary impact was that we were forced to suspend milling operations at Keno Hill between August 27 and October 26, 2024 due to delays in receiving authorizations and permits because the focus of the Yukon Government and the First Nation of Na-Cho Nyäk Dun (“FNNND”) on the Eagle Mine incident response and not on routine permitting matters. Mill operations and design and construction projects resumed during the fourth quarter of 2024. Our original planned schedule for permitting and projects has been extended, but we are taking steps, including working with regulators, to establish a viable schedule for our operational plans.
An ongoing impact of the Eagle Mine incident is the FNNND's public position on mining, which has evolved from a call to halt all mining activity to support of environmentally responsible mining practices. We continue to strengthen our partnership with the FNNND - which is important because Keno Hill is within their Traditional Territory - through enhanced environmental stewardship and community engagement initiatives, building on their support for responsible mining practices.
Then, starting in late October 2024, Keno Hill began experiencing power curtailments when the utility, Yukon Energy, experienced a turbine failure at its Aishihik hydroelectric plant in Whitehorse. That failure and Yukon Energy's resulting focus on line maintenance, combined with cold temperatures in the Yukon (and the resulting increase in demand for power), caused Yukon Energy to reduce power to Keno Hill, resulting in the operation's inability to fully power the mine and mill on several occasions in late 2024 and for 8 days in the first quarter of 2025. These power constraints impacted approximately 130,000 ounces of silver production and labor costs for idled employees of approximately $0.5 million in 2025. During December 2025, due to extreme cold weather, Yukon Energy again curtailed power supply to us for 16 days, which continued through December 30, 2025.
Permitting is one of the most important factors in our ability to reach sustainable, profitable production at Keno Hill. Increased production means a need for increased tailings storage, waste storage, water treatment and discharge, camp space and reliable power, all of which are typical requirements for mines in the expansion phase. These projects require new or modified permits, as well as the capital to implement them. Although we continue to make progress on these ordinary-course permitting matters, we have yet to make up for the delays described above. In addition, as we develop new zones for ore production at Keno Hill (and our other mines), we are frequently confronted with challenging conditions such as rock quality and ground water volumes. Currently, we are developing new headings at Keno Hill to supplement existing, or replace mined out headings. At some of these new headings, we are encountering more groundwater than expected. The mine's water license has limits on the amount of water that can be discharged from the mine. Although we currently are within permitted water discharge limits, if production from these new zones would cause water discharges greater than the license allows we will need to make alternative arrangements, which likely includes seeking an amendment to our current water license. There can be no assurances that the Yukon Water Board will grant such an amendment. If we confirm that continued mining in these new zones would lead to discharges in excess of license limits and are unable to amend our license in a timely manner, our options would then include developing a different operating plan to reduce discharges and/or curtailing production to remain within existing permitted discharge limits. Although we consider it unlikely, if none of these potential solutions is achieved, it is possible we would consider pausing production and other mining activities at the impacted areas and reassess our permitting strategy and other future operational aspects of the mine. See the Item 1A. Risk Factors - "We are required to obtain governmental permits and other approvals in order to conduct mining operations."
We also continue to face operational challenges such as work force availability, dilution, execution of projects, limited camp space, and the ramp-up of ERDC environmental remediation activities (which adds incremental demand on Keno Hill's infrastructure and resources, most notably camp space). As a result, we project 2026 silver production to be comparable to 2025 levels. The projected flat production levels at Keno Hill for 2026 should allow us to focus on (i) permitting, (ii) stakeholder outreach and ensuring we have local support, (iii) projects such as tailings storage expansion and the construction of a cemented tails batch plant, (iv) mine development and (v) meeting the above-mentioned operational challenges.
As stated above, Keno Hill has generated profits at current throughput rates and prices. Our immediate focus is to advance permits and successfully execute infrastructure projects, with the goal of putting the mine on a path toward achieving its current permitted capacity of 440 tons per day which, at current prices, we project would generate sustained, positive free cash flow, while preserving expansion optionality beyond 440 tons per day. However, currently, Keno Hill is not configured to sustainably produce 440 tons per day (although the mill has achieved that rate for multiple weeks on end during test run periods). To reach 440 tons per day throughput, we would need to continue to mine ore from both the Bermingham deposit and the lower grade Flame & Moth deposit. Achieving 440 or higher tons per day would require targeted infrastructure investments, obtaining permits, executing projects, mine development and maintaining social license to operate. If any one of these were not to occur, or if prices were to decrease from our current budgeted prices, Keno Hill as currently configured would not be profitable, and placing the operation on care and maintenance would be an option. See Item 1A. Risk Factor - We may not realize all of the anticipated benefits from our acquisitions, including our 2022 acquisition of Alexco.
Corporate Matters
Employee Benefit Plans
Our defined benefit pension plans, while providing a significant benefit to our employees, have historically represented a significant liability to us. At December 31, 2025, our plans are in an underfunded status of $0.1 million. We do not expect to be required to contribute to our defined benefit plans in 2026, but we may choose to do so. See Note 7 of Notes to Consolidated Financial Statements for more information. We periodically examine the defined benefit pension plans and supplemental excess retirement plan for affordability and competitiveness.
Income and Mining Taxes
Our deferred tax assets and liabilities are measured at the currently enacted tax rates that are expected to apply in years in which they are expected to be paid for or realized. Each reporting period we assess the realizability of our tax assets. In assessing the need for a valuation allowance, we evaluate all significant available positive and negative evidence, including historical operating results, estimates of future sources of taxable income, carry-forward periods available, the existence of prudent and feasible tax planning strategies and other relevant factors.
Our organizational structure requires us to have two U.S. tax groups that do not consolidate. One of those U.S. tax groups is Hecla Mining Company and subsidiaries (“Hecla U.S. Group”) which has a net deferred tax liability of $117.2 million at December 31, 2025 compared to a net deferred tax liability of $21.7 million at December 31, 2024. The increase of $95.5 million is primarily related to taxable income and the utilization of net operating losses carried forward from prior periods as well as the election of bonus depreciation and other accelerated tax deductions.
Klondex Mines Ltd (“Klondex”) is the other separate U.S. tax group (“Nevada U.S. Group”) that has a net deferred tax liability of $30.6 million and $30.8 million at December 31, 2025 and 2024, respectively.
Our net Canadian deferred tax liability at December 31, 2025 was $9.8 million, an increase of $2.1 million from the $7.7 million net deferred tax liability at December 31, 2024. The increase was due to higher Canadian taxable income.
Our Mexican net deferred tax asset at December 31, 2025 remains at zero with no change from December 31, 2024. The valuation allowance increased to $13.7 million.
As a result of the Tax Cuts and Jobs Act (“TCJA”) enacted in December 2017, under Internal Revenue Code Section 174, a requirement to capitalize and amortize research and experimental expenditures for tax years beginning after December 31, 2021 is now effective. This modification has not had a material impact.
As discussed in Note 8 of Notes to Consolidated Financial Statements, our effective tax rate for 2025 was 28%, reflecting a tax expense of $98.7 million on pre-tax income of $356.8 million, compared to 44% for 2024, reflecting a tax expense of $40.0 million on pre-tax income of $90.2 million. We are subject to income taxes in the United States and other foreign jurisdictions. The overall effective tax rate will continue to be dependent upon the geographic distribution of our earnings in different jurisdictions, the U.S. deduction for percentage depletion, fluctuation in foreign currency exchange rates and deferred tax asset valuation allowance changes. As a result, the 2025 effective tax rate varies significantly from that of 2024. The other relevant provisions of the TCJA that became effective in 2018 consist of global intangible low-taxed income tax ("GILTI"), base erosion and anti-abuse tax ("BEAT") and foreign-derived intangible income ("FDII"). Hecla U.S. Group recorded a current expense for GILTI in 2025 due to earnings in foreign jurisdictions. The BEAT and FDII provisions have not had a material impact.
Reconciliation of Costs Applicable to Sales to Cash Cost, Before By-product Credits and Cash Cost, After By-product Credits (non-GAAP) and All-In Sustaining Cost, Before By-product Credits and All-In Sustaining Cost, After By-product Credits (non-GAAP)
The tables below present reconciliations between the most comparable GAAP measure of costs applicable to sales to the non-GAAP measures of (i) Cash Cost, Before By-product Credits, (ii) Cash Cost, After By-product Credits, (iii) AISC, Before By-product Credits and (iv) AISC, After By-product Credits for our operations and for the Company for the years ended December 31, 2025, 2024, and 2023.
Cash Cost, After By-product Credits, per Ounce and AISC, After By-product Credits, per Ounce are measures developed by precious metals companies (including the Silver Institute and the World Gold Council) in an effort to provide a uniform standard for comparison purposes. There can be no assurance, however, that these non-GAAP measures as we report them are the same as those reported by other mining companies.
Cash Cost, After By-product Credits, per Ounce is an important operating statistic that we utilize to measure each mine's operating performance. We use AISC, After By-product Credits, per Ounce as a measure of our mines' net cash flow after costs for reclamation and sustaining capital. This is similar to the Cash Cost, After By-product Credits, per Ounce non-GAAP measure we report, but also includes reclamation and sustaining capital costs. Current GAAP measures used in the mining industry, such as cost of goods sold, do not capture all the expenditures incurred to discover, develop and sustain silver and gold production. Cash Cost, After By-product Credits, per Ounce and AISC, After By-product Credits, per Ounce also allow us to benchmark the performance of each of our mines versus those of our competitors. As a silver and gold mining company, we also use these statistics on an aggregate basis - aggregating the Greens Creek and Lucky Friday mines to compare our performance with that of other silver mining companies. Similarly, these statistics are useful in identifying acquisition and investment opportunities as they provide a common tool for measuring the financial performance of other mines with varying geologic, metallurgical and operating characteristics.
We have not disclosed cost per ounce statistics for the Keno Hill operation as it is in the production ramp-up phase and has not met our definition of commercial production. See above "Consolidated Results of Operations" for our definition of commercial production. Determination of when those criteria have been met requires the use of judgment, and our definition of commercial production may differ from that of other mining companies.
Cash Cost, Before By-product Credits and AISC, Before By-product Credits include all direct and indirect operating cash costs related directly to the physical activities of producing metals, including mining, processing and other plant costs, third-party refining expense, on-site general and administrative costs, royalties and mining production taxes. AISC, Before By-product Credits for each mine also includes reclamation and sustaining capital costs. AISC, Before By-product Credits for our consolidated silver properties also includes corporate costs for general and administrative expense and sustaining capital costs. By-product credits include revenues earned from all metals other than the primary metal produced at each unit. As depicted in the tables below, by-product credits comprise an essential element of our silver unit cost structure, distinguishing our silver operations due to the polymetallic nature of their orebodies.
In addition to the uses described above, Cash Cost, After By-product Credits, per Ounce and AISC, After By-product Credits, per Ounce provide management and investors an indication of operating cash flow, after consideration of the average price received from production. We also use these measurements for the comparative monitoring of performance of our mining operations period-to-period from a cash flow perspective.
|
|
|
|
|
|
|
|
|
|
|
|
|
|
|
|
|
|
|
|
|
In thousands (except per ounce amounts) |
|
Year Ended December 31, 2025 |
|
|
|
Greens Creek |
|
|
Lucky Friday |
|
|
Keno Hill |
|
|
Corporate(2) |
|
|
Total Silver |
|
Costs applicable to sales (3) |
|
$ |
234,221 |
|
|
$ |
122,635 |
|
|
$ |
71,883 |
|
|
$ |
— |
|
|
$ |
428,739 |
|
Treatment costs |
|
|
948 |
|
|
|
9,734 |
|
|
|
— |
|
|
|
— |
|
|
|
10,682 |
|
Change in product inventory |
|
|
(1,258 |
) |
|
|
(6 |
) |
|
|
— |
|
|
|
— |
|
|
|
(1,264 |
) |
Reclamation and other costs |
|
|
(1,502 |
) |
|
|
(857 |
) |
|
|
— |
|
|
|
— |
|
|
|
(2,359 |
) |
Exclusion of Keno Hill cash costs (5) |
|
|
— |
|
|
|
— |
|
|
|
(71,883 |
) |
|
|
— |
|
|
|
(71,883 |
) |
Cash Cost, Before By-product Credits (1) |
|
|
232,409 |
|
|
|
131,506 |
|
|
|
— |
|
|
|
— |
|
|
|
363,915 |
|
Reclamation |
|
|
3,029 |
|
|
|
780 |
|
|
|
— |
|
|
|
— |
|
|
|
3,809 |
|
Sustaining capital |
|
|
46,362 |
|
|
|
69,316 |
|
|
|
— |
|
|
|
5,165 |
|
|
|
120,843 |
|
General and administrative |
|
|
— |
|
|
|
— |
|
|
|
— |
|
|
|
57,626 |
|
|
|
57,626 |
|
AISC, Before By-product Credits (1) |
|
|
281,800 |
|
|
|
201,602 |
|
|
|
— |
|
|
|
62,791 |
|
|
|
546,193 |
|
By-product credits: |
|
|
|
|
|
|
|
|
|
|
|
|
|
|
|
Zinc |
|
|
(93,495 |
) |
|
|
(28,939 |
) |
|
|
— |
|
|
|
— |
|
|
|
(122,434 |
) |
Gold |
|
|
(180,497 |
) |
|
|
— |
|
|
|
— |
|
|
|
— |
|
|
|
(180,497 |
) |
Lead |
|
|
(24,963 |
) |
|
|
(57,036 |
) |
|
|
— |
|
|
|
— |
|
|
|
(81,999 |
) |
Copper |
|
|
(3,465 |
) |
|
|
— |
|
|
|
— |
|
|
|
— |
|
|
|
(3,465 |
) |
Total By-product credits |
|
|
(302,420 |
) |
|
|
(85,975 |
) |
|
|
— |
|
|
|
— |
|
|
|
(388,395 |
) |
Cash Cost, After By-product Credits |
|
$ |
(70,011 |
) |
|
$ |
45,531 |
|
|
$ |
— |
|
|
$ |
— |
|
|
$ |
(24,480 |
) |
AISC, After By-product Credits |
|
$ |
(20,620 |
) |
|
$ |
115,627 |
|
|
$ |
— |
|
|
$ |
62,791 |
|
|
$ |
157,798 |
|
Divided by silver ounces produced |
|
|
8,725 |
|
|
|
5,261 |
|
|
|
|
|
|
|
|
|
13,986 |
|
Cash Cost, Before By-product Credits, per Silver Ounce |
|
$ |
26.64 |
|
|
$ |
25.00 |
|
|
|
|
|
|
|
|
$ |
26.02 |
|
By-product credits per ounce |
|
|
(34.66 |
) |
|
|
(16.34 |
) |
|
|
|
|
|
|
|
|
(27.77 |
) |
Cash Cost, After By-product Credits, per Silver Ounce |
|
$ |
(8.02 |
) |
|
$ |
8.66 |
|
|
|
|
|
|
|
|
$ |
(1.75 |
) |
AISC, Before By-product Credits, per Silver Ounce |
|
$ |
32.30 |
|
|
$ |
38.32 |
|
|
|
|
|
|
|
|
$ |
39.05 |
|
By-product credits per ounce |
|
|
(34.66 |
) |
|
|
(16.34 |
) |
|
|
|
|
|
|
|
|
(27.77 |
) |
AISC, After By-product Credits, per Silver Ounce |
|
$ |
(2.36 |
) |
|
$ |
21.98 |
|
|
|
|
|
|
|
|
$ |
11.28 |
|
|
|
|
|
|
|
|
|
|
|
|
|
|
In thousands (except per ounce amounts) |
|
Year Ended December 31, 2025 |
|
|
|
Total Silver |
|
|
Other(4) |
|
|
Total |
|
Costs applicable to sales (3) |
|
$ |
428,739 |
|
|
$ |
38,574 |
|
|
$ |
467,313 |
|
Treatment costs |
|
|
10,682 |
|
|
|
— |
|
|
|
10,682 |
|
Change in product inventory |
|
|
(1,264 |
) |
|
|
— |
|
|
|
(1,264 |
) |
Reclamation and other costs |
|
|
(2,359 |
) |
|
|
— |
|
|
|
(2,359 |
) |
Exclusion of Keno Hill cash costs (5) |
|
|
(71,883 |
) |
|
|
— |
|
|
|
(71,883 |
) |
Exclusion of Other costs |
|
|
— |
|
|
|
(38,574 |
) |
|
|
(38,574 |
) |
Cash Cost, Before By-product Credits (1) |
|
|
363,915 |
|
|
|
— |
|
|
|
363,915 |
|
Reclamation and other costs |
|
|
3,809 |
|
|
|
— |
|
|
|
3,809 |
|
Sustaining capital |
|
|
120,843 |
|
|
|
— |
|
|
|
120,843 |
|
General and administrative |
|
|
57,626 |
|
|
|
— |
|
|
|
57,626 |
|
AISC, Before By-product Credits (1) |
|
|
546,193 |
|
|
|
— |
|
|
|
546,193 |
|
By-product credits: |
|
|
|
|
|
|
|
|
|
Zinc |
|
|
(122,434 |
) |
|
|
— |
|
|
|
(122,434 |
) |
Gold |
|
|
(180,497 |
) |
|
|
— |
|
|
|
(180,497 |
) |
Lead |
|
|
(81,999 |
) |
|
|
— |
|
|
|
(81,999 |
) |
Copper |
|
|
(3,465 |
) |
|
|
— |
|
|
|
(3,465 |
) |
Total By-product credits |
|
|
(388,395 |
) |
|
|
— |
|
|
|
(388,395 |
) |
Cash Cost, After By-product Credits |
|
$ |
(24,480 |
) |
|
$ |
— |
|
|
$ |
(24,480 |
) |
AISC, After By-product Credits |
|
$ |
157,798 |
|
|
$ |
— |
|
|
$ |
157,798 |
|
Divided by ounces produced |
|
|
13,986 |
|
|
|
|
|
|
|
Cash Cost, Before By-product Credits, per Ounce |
|
$ |
26.02 |
|
|
|
|
|
|
|
By-product credits per ounce |
|
|
(27.77 |
) |
|
|
|
|
|
|
Cash Cost, After By-product Credits, per Ounce |
|
$ |
(1.75 |
) |
|
|
|
|
|
|
AISC, Before By-product Credits, per Ounce |
|
$ |
39.05 |
|
|
|
|
|
|
|
By-product credits per ounce |
|
|
(27.77 |
) |
|
|
|
|
|
|
AISC, After By-product Credits, per Ounce |
|
$ |
11.28 |
|
|
|
|
|
|
|
|
|
|
|
|
|
|
|
|
|
|
|
|
|
|
|
|
|
|
|
|
In thousands (except per ounce amounts) |
|
Year Ended December 31, 2024 |
|
|
|
Greens Creek |
|
|
Lucky Friday |
|
|
Keno Hill |
|
|
Corporate(2) |
|
|
Total Silver |
|
Costs applicable to sales (3) |
|
$ |
214,677 |
|
|
$ |
103,436 |
|
|
$ |
81,336 |
|
|
$ |
— |
|
|
$ |
399,449 |
|
Costs applicable to sales - temporarily suspended operations(3) |
|
|
— |
|
|
$ |
1,583 |
|
|
|
— |
|
|
|
— |
|
|
$ |
1,583 |
|
Treatment costs |
|
|
26,266 |
|
|
|
14,456 |
|
|
|
— |
|
|
|
— |
|
|
|
40,722 |
|
Change in product inventory |
|
|
(5,858 |
) |
|
|
2,090 |
|
|
|
— |
|
|
|
— |
|
|
|
(3,768 |
) |
Reclamation and other costs |
|
|
(4,481 |
) |
|
|
(2,806 |
) |
|
|
— |
|
|
|
— |
|
|
|
(7,287 |
) |
Exclusion of Lucky Friday cash costs (6) |
|
|
— |
|
|
|
(5,217 |
) |
|
|
— |
|
|
|
— |
|
|
|
(5,217 |
) |
Exclusion of Keno Hill cash costs (5) |
|
|
— |
|
|
|
— |
|
|
|
(81,336 |
) |
|
|
— |
|
|
|
(81,336 |
) |
Cash Cost, Before By-product Credits (1) |
|
|
230,604 |
|
|
|
113,542 |
|
|
|
— |
|
|
|
— |
|
|
|
344,146 |
|
Reclamation |
|
|
3,141 |
|
|
|
891 |
|
|
|
— |
|
|
|
— |
|
|
|
4,032 |
|
Sustaining capital |
|
|
45,214 |
|
|
|
44,864 |
|
|
|
— |
|
|
|
1,532 |
|
|
|
91,610 |
|
Exclusion of Lucky Friday sustaining costs (6) |
|
|
— |
|
|
|
(5,396 |
) |
|
|
— |
|
|
|
— |
|
|
|
(5,396 |
) |
General and administrative |
|
|
— |
|
|
|
— |
|
|
|
— |
|
|
|
45,405 |
|
|
|
45,405 |
|
AISC, Before By-product Credits (1) |
|
|
278,959 |
|
|
|
153,901 |
|
|
|
— |
|
|
|
46,937 |
|
|
|
479,797 |
|
By-product credits: |
|
|
|
|
|
|
|
|
|
|
|
|
|
|
|
Zinc |
|
|
(89,088 |
) |
|
|
(26,244 |
) |
|
|
— |
|
|
|
— |
|
|
|
(115,332 |
) |
Gold |
|
|
(115,189 |
) |
|
|
— |
|
|
|
— |
|
|
|
— |
|
|
|
(115,189 |
) |
Lead |
|
|
(26,374 |
) |
|
|
(55,042 |
) |
|
|
— |
|
|
|
— |
|
|
|
(81,416 |
) |
Copper |
|
|
(409 |
) |
|
|
— |
|
|
|
— |
|
|
|
— |
|
|
|
(409 |
) |
Exclusion of Lucky Friday by-product credits (6) |
|
|
— |
|
|
|
3,943 |
|
|
|
— |
|
|
|
— |
|
|
|
3,943 |
|
Total By-product credits |
|
|
(231,060 |
) |
|
|
(77,343 |
) |
|
|
— |
|
|
|
— |
|
|
|
(308,403 |
) |
Cash Cost, After By-product Credits |
|
$ |
(456 |
) |
|
$ |
36,199 |
|
|
$ |
— |
|
|
$ |
— |
|
|
$ |
35,743 |
|
AISC, After By-product Credits |
|
$ |
47,899 |
|
|
$ |
76,558 |
|
|
$ |
— |
|
|
$ |
46,937 |
|
|
$ |
171,394 |
|
Ounces produced |
|
|
8,481 |
|
|
|
4,891 |
|
|
|
|
|
|
|
|
|
13,372 |
|
Exclusion of Lucky Friday ounces produced (6) |
|
|
— |
|
|
|
(253 |
) |
|
|
|
|
|
|
|
|
(253 |
) |
Divided by silver ounces produced |
|
|
8,481 |
|
|
|
4,638 |
|
|
|
|
|
|
|
|
|
13,119 |
|
Cash Cost, Before By-product Credits, per Silver Ounce |
|
$ |
27.19 |
|
|
$ |
24.48 |
|
|
|
|
|
|
|
|
$ |
26.23 |
|
By-product credits per ounce |
|
|
(27.24 |
) |
|
|
(16.68 |
) |
|
|
|
|
|
|
|
|
(23.51 |
) |
Cash Cost, After By-product Credits, per Silver Ounce |
|
$ |
(0.05 |
) |
|
$ |
7.80 |
|
|
|
|
|
|
|
|
$ |
2.72 |
|
AISC, Before By-product Credits, per Silver Ounce |
|
$ |
32.89 |
|
|
$ |
33.18 |
|
|
|
|
|
|
|
|
$ |
36.57 |
|
By-product credits per ounce |
|
|
(27.24 |
) |
|
|
(16.68 |
) |
|
|
|
|
|
|
|
|
(23.51 |
) |
AISC, After By-product Credits, per Silver Ounce |
|
$ |
5.65 |
|
|
$ |
16.50 |
|
|
|
|
|
|
|
|
$ |
13.06 |
|
|
|
|
|
|
|
|
|
|
|
|
|
|
In thousands (except per ounce amounts) |
|
Year Ended December 31, 2024 |
|
|
|
Total Silver |
|
|
Other(4) |
|
|
Total |
|
Costs applicable to sales (3) |
|
$ |
399,449 |
|
|
$ |
20,527 |
|
|
$ |
419,976 |
|
Costs applicable to sales - temporarily suspended operations (3) |
|
|
1,583 |
|
|
|
— |
|
|
|
1,583 |
|
Treatment costs |
|
|
40,722 |
|
|
|
— |
|
|
|
40,722 |
|
Change in product inventory |
|
|
(3,768 |
) |
|
|
— |
|
|
|
(3,768 |
) |
Reclamation and other costs |
|
|
(7,287 |
) |
|
|
— |
|
|
|
(7,287 |
) |
Exclusion of Lucky Friday cash costs (6) |
|
|
(5,217 |
) |
|
|
— |
|
|
|
(5,217 |
) |
Exclusion of Keno Hill cash costs (5) |
|
|
(81,336 |
) |
|
|
(20,527 |
) |
|
|
(101,863 |
) |
Cash Cost, Before By-product Credits (1) |
|
|
344,146 |
|
|
|
— |
|
|
|
344,146 |
|
Reclamation |
|
|
4,032 |
|
|
|
— |
|
|
|
4,032 |
|
Sustaining capital |
|
|
91,610 |
|
|
|
— |
|
|
|
91,610 |
|
Exclusion of Lucky Friday sustaining costs (6) |
|
|
(5,396 |
) |
|
|
— |
|
|
|
(5,396 |
) |
General and administrative |
|
|
45,405 |
|
|
|
— |
|
|
|
45,405 |
|
AISC, Before By-product Credits (1) |
|
|
479,797 |
|
|
|
— |
|
|
|
479,797 |
|
By-product credits: |
|
|
|
|
|
|
|
|
|
Zinc |
|
|
(115,332 |
) |
|
|
— |
|
|
|
(115,332 |
) |
Gold |
|
|
(115,189 |
) |
|
|
— |
|
|
|
(115,189 |
) |
Lead |
|
|
(81,416 |
) |
|
|
— |
|
|
|
(81,416 |
) |
Copper |
|
|
(409 |
) |
|
|
— |
|
|
|
(409 |
) |
Exclusion of Lucky Friday by-product credits (6) |
|
|
3,943 |
|
|
|
|
|
|
3,943 |
|
Total By-product credits |
|
|
(308,403 |
) |
|
|
— |
|
|
|
(308,403 |
) |
Cash Cost, After By-product Credits |
|
$ |
35,743 |
|
|
|
— |
|
|
$ |
35,743 |
|
AISC, After By-product Credits |
|
$ |
171,394 |
|
|
|
— |
|
|
$ |
171,394 |
|
Divided by ounces produced |
|
|
13,372 |
|
|
|
|
|
|
|
Exclusion of Lucky Friday ounces produced (6) |
|
|
(253 |
) |
|
|
|
|
|
|
Divided by silver ounces produced |
|
|
13,119 |
|
|
|
|
|
|
|
Cash Cost, Before By-product Credits, per Ounce |
|
$ |
26.23 |
|
|
|
|
|
|
|
By-product credits per ounce |
|
|
(23.51 |
) |
|
|
|
|
|
|
Cash Cost, After By-product Credits, per Ounce |
|
$ |
2.72 |
|
|
|
|
|
|
|
AISC, Before By-product Credits, per Ounce |
|
$ |
36.57 |
|
|
|
|
|
|
|
By-product credits per ounce |
|
|
(23.51 |
) |
|
|
|
|
|
|
AISC, After By-product Credits, per Ounce |
|
$ |
13.06 |
|
|
|
|
|
|
|
|
|
|
|
|
|
|
|
|
|
|
|
|
|
|
|
|
|
|
|
|
In thousands (except per ounce amounts) |
|
Year Ended December 31, 2023 |
|
|
|
Greens Creek |
|
|
Lucky Friday |
|
|
Keno Hill |
|
|
Corporate(2) |
|
|
Total Silver |
|
Costs applicable to sales (3) |
|
$ |
205,900 |
|
|
$ |
59,859 |
|
|
$ |
59,083 |
|
|
$ |
— |
|
|
$ |
324,842 |
|
Costs applicable to sales - temporarily suspended operations (3) |
|
|
— |
|
|
|
20,489 |
|
|
|
— |
|
|
|
— |
|
|
|
20,489 |
|
Treatment costs |
|
|
40,987 |
|
|
|
10,981 |
|
|
|
1,070 |
|
|
|
— |
|
|
|
53,038 |
|
Change in product inventory |
|
|
(4,266 |
) |
|
|
(5,164 |
) |
|
|
— |
|
|
|
— |
|
|
|
(9,430 |
) |
Reclamation and other costs |
|
|
(748 |
) |
|
|
(826 |
) |
|
|
— |
|
|
|
— |
|
|
|
(1,574 |
) |
Exclusion of Lucky Friday cash costs (6) |
|
|
— |
|
|
|
(21,340 |
) |
|
|
— |
|
|
|
— |
|
|
|
(21,340 |
) |
Exclusion of Keno Hill cash costs (5) |
|
|
— |
|
|
|
— |
|
|
|
(60,153 |
) |
|
|
— |
|
|
|
(60,153 |
) |
Cash Cost, Before By-product Credits (1) |
|
|
241,873 |
|
|
|
63,999 |
|
|
|
— |
|
|
|
— |
|
|
|
305,872 |
|
Reclamation and other costs |
|
|
2,889 |
|
|
|
671 |
|
|
|
— |
|
|
|
— |
|
|
|
3,560 |
|
Sustaining capital |
|
|
41,935 |
|
|
|
39,019 |
|
|
|
— |
|
|
|
928 |
|
|
|
81,882 |
|
Exclusion of Lucky Friday sustaining costs (6) |
|
|
— |
|
|
|
(19,702 |
) |
|
|
— |
|
|
|
— |
|
|
|
(19,702 |
) |
General and administrative |
|
|
— |
|
|
|
— |
|
|
|
— |
|
|
|
42,722 |
|
|
|
42,722 |
|
AISC, Before By-product Credits (1) |
|
|
286,697 |
|
|
|
83,987 |
|
|
|
— |
|
|
|
43,650 |
|
|
|
414,334 |
|
By-product credits: |
|
|
|
|
|
|
|
|
|
|
|
|
|
|
|
Zinc |
|
|
(83,454 |
) |
|
|
(14,507 |
) |
|
|
— |
|
|
|
— |
|
|
|
(97,961 |
) |
Gold |
|
|
(104,507 |
) |
|
|
— |
|
|
|
— |
|
|
|
— |
|
|
|
(104,507 |
) |
Lead |
|
|
(29,284 |
) |
|
|
(34,620 |
) |
|
|
— |
|
|
|
— |
|
|
|
(63,904 |
) |
Exclusion of Lucky Friday by-product credits (6) |
|
|
— |
|
|
|
1,566 |
|
|
|
— |
|
|
|
— |
|
|
|
1,566 |
|
Total By-product credits |
|
|
(217,245 |
) |
|
|
(47,561 |
) |
|
|
— |
|
|
|
— |
|
|
|
(264,806 |
) |
Cash Cost, After By-product Credits |
|
$ |
24,628 |
|
|
$ |
16,438 |
|
|
$ |
— |
|
|
$ |
— |
|
|
$ |
41,066 |
|
AISC, After By-product Credits |
|
$ |
69,452 |
|
|
$ |
36,426 |
|
|
$ |
— |
|
|
$ |
43,650 |
|
|
$ |
149,528 |
|
Ounces produced |
|
|
9,732 |
|
|
|
3,086 |
|
|
|
|
|
|
|
|
|
12,818 |
|
Exclusion of Lucky Friday ounces produced (6) |
|
|
— |
|
|
|
(103 |
) |
|
|
|
|
|
|
|
|
(103 |
) |
Divided by silver ounces produced |
|
|
9,732 |
|
|
|
2,983 |
|
|
|
|
|
|
|
|
|
12,715 |
|
Cash Cost, Before By-product Credits, per Silver Ounce |
|
$ |
24.85 |
|
|
$ |
21.45 |
|
|
|
|
|
|
|
|
$ |
24.06 |
|
By-product credits per ounce |
|
|
(22.32 |
) |
|
|
(15.94 |
) |
|
|
|
|
|
|
|
|
(20.83 |
) |
Cash Cost, After By-product Credits, per Silver Ounce |
|
$ |
2.53 |
|
|
$ |
5.51 |
|
|
|
|
|
|
|
|
$ |
3.23 |
|
AISC, Before By-product Credits, per Silver Ounce |
|
$ |
29.46 |
|
|
$ |
28.15 |
|
|
|
|
|
|
|
|
$ |
32.59 |
|
By-product credits per ounce |
|
|
(22.32 |
) |
|
|
(15.94 |
) |
|
|
|
|
|
|
|
|
(20.83 |
) |
AISC, After By-product Credits, per Silver Ounce |
|
$ |
7.14 |
|
|
$ |
12.21 |
|
|
|
|
|
|
|
|
$ |
11.76 |
|
|
|
|
|
|
|
|
|
|
|
|
|
|
In thousands (except per ounce amounts) |
|
Year Ended December 31, 2023 |
|
|
|
Total Silver |
|
|
Other(4) |
|
|
Total |
|
Costs applicable to sales (3) |
|
$ |
324,842 |
|
|
$ |
6,199 |
|
|
$ |
331,041 |
|
Costs applicable to sales - temporarily suspended operations(3) |
|
|
20,489 |
|
|
|
— |
|
|
|
20,489 |
|
Treatment costs |
|
|
53,038 |
|
|
|
— |
|
|
|
53,038 |
|
Change in product inventory |
|
|
(9,430 |
) |
|
|
— |
|
|
|
(9,430 |
) |
Reclamation and other costs |
|
|
(1,574 |
) |
|
|
— |
|
|
|
(1,574 |
) |
Exclusion of Other costs |
|
|
— |
|
|
|
(6,199 |
) |
|
|
(6,199 |
) |
Exclusion of Lucky Friday cash costs (6) |
|
|
(21,340 |
) |
|
|
— |
|
|
|
(21,340 |
) |
Exclusion of Keno Hill cash costs (5) |
|
|
(60,153 |
) |
|
|
— |
|
|
|
(60,153 |
) |
Cash Cost, Before By-product Credits (1) |
|
|
305,872 |
|
|
|
— |
|
|
|
305,872 |
|
Reclamation and other costs |
|
|
3,560 |
|
|
|
— |
|
|
|
3,560 |
|
Sustaining capital |
|
|
81,882 |
|
|
|
— |
|
|
|
81,882 |
|
Exclusion of Lucky Friday sustaining costs (6) |
|
|
(19,702 |
) |
|
|
— |
|
|
|
(19,702 |
) |
General and administrative |
|
|
42,722 |
|
|
|
— |
|
|
|
42,722 |
|
AISC, Before By-product Credits (1) |
|
|
414,334 |
|
|
|
— |
|
|
|
414,334 |
|
By-product credits: |
|
|
|
|
|
|
|
|
|
Zinc |
|
|
(97,961 |
) |
|
|
— |
|
|
|
(97,961 |
) |
Gold |
|
|
(104,507 |
) |
|
|
— |
|
|
|
(104,507 |
) |
Lead |
|
|
(63,904 |
) |
|
|
— |
|
|
|
(63,904 |
) |
Exclusion of Lucky Friday by-product credits (6) |
|
|
1,566 |
|
|
|
— |
|
|
|
1,566 |
|
Total By-product credits |
|
|
(264,806 |
) |
|
|
— |
|
|
|
(264,806 |
) |
Cash Cost, After By-product Credits |
|
$ |
41,066 |
|
|
$ |
— |
|
|
$ |
41,066 |
|
AISC, After By-product Credits |
|
$ |
149,528 |
|
|
$ |
— |
|
|
$ |
149,528 |
|
Divided by ounces produced |
|
|
12,818 |
|
|
|
|
|
|
|
Exclusion of Lucky Friday ounces produced (6) |
|
|
(103 |
) |
|
|
|
|
|
|
Divided by silver ounces produced |
|
|
12,715 |
|
|
|
|
|
|
|
Cash Cost, Before By-product Credits, per Ounce |
|
$ |
24.06 |
|
|
|
|
|
|
|
By-product credits per ounce |
|
|
(20.83 |
) |
|
|
|
|
|
|
Cash Cost, After By-product Credits, per Ounce |
|
$ |
3.23 |
|
|
|
|
|
|
|
AISC, Before By-product Credits, per Ounce |
|
$ |
32.59 |
|
|
|
|
|
|
|
By-product credits per ounce |
|
|
(20.83 |
) |
|
|
|
|
|
|
AISC, After By-product Credits, per Ounce |
|
$ |
11.76 |
|
|
|
|
|
|
|
(1)Includes all direct and indirect operating costs related to the physical activities of producing metals, including mining, processing and other plant costs, third-party refining and marketing expense, on-site general and administrative costs and royalties, before by-product revenues earned from all metals other than the primary metal produced at each operation. AISC, Before By-product Credits also includes reclamation and sustaining capital costs.
(2)AISC, Before By-product Credits for our consolidated silver properties includes corporate costs for general and administrative expense and sustaining capital.
(3)Excludes depreciation, depletion and amortization.
(4)Other includes $38.6 million, $20.5 million and $6.2 million of costs applicable to sales for the years ended December 31, 2025, 2024, and 2023, respectively related to ERDC, the Company's environmental services business.
(5)Keno Hill is in the ramp-up phase of production and is excluded from the calculation of Cash Cost, Before By-product Credits, Cash Cost, After By-product Credits, AISC, Before By-product Credits, and AISC, After By-product Credits.
(6)Lucky Friday operations were suspended in August 2023 following the underground fire in the #2 shaft secondary egress and resumed on January 9, 2024. The portion of cash costs, sustaining costs, by-product credits, and silver production incurred during the suspension period are reported as costs applicable to sales - temporarily suspended operations and excluded from the calculation of Cash Cost, Before By-product Credits, Cash Cost, After By-product Credits, and AISC, Before By-product Credits, and AISC, After By-product Credits.
Financial Liquidity and Capital Resources
Liquidity overview
We have a disciplined cash management strategy of maintaining financial flexibility to execute our capital priorities and provide long-term value to our stockholders. Consistent with that strategy, we aim to maintain an acceptable level of net debt and sufficient liquidity to fund debt service costs, operations, capital expenditures, potential strategic investments, exploration and pre-development projects, while returning cash to stockholders through dividends and potential share repurchases.
At December 31, 2025, we had $241.6 million in cash and cash equivalents, of which $26.5 million was held in foreign subsidiaries' local currency that we anticipate utilizing for near-term operating, exploration or capital costs by those foreign subsidiaries. At December 31, 2025, we had no amounts drawn on our credit facility with $6.7 million utilized for letters of credit. We also have USD cash and cash equivalent balances held by our foreign subsidiaries that, if repatriated, may be subject to withholding taxes. We expect that there would be no additional tax burden upon repatriation after considering the cash cost associated with the withholding taxes. We believe that our liquidity and capital resources from our U.S. operations are adequate to fund our U.S. operations and corporate activities.
Pursuant to our common stock dividend policy described in Note 13 of Notes to Consolidated Financial Statements, our Board of Directors declared and paid dividends on common stock totaling $10.4 million in 2025, $24.9 million in 2024 and $15.2 million in 2023. Until February 2025, our dividend policy had a silver-linked component which tied the amount of declared common stock dividends to our realized silver price for the preceding quarter (our dividend policy was recently revised, see discussion below). Another component of our common stock dividend policy, which remains in place, anticipates paying an annual minimum dividend. In 2024, we made the following dividend payments in relation to our minimum and silver-linked components.
|
|
|
|
|
|
|
|
|
|
|
|
|
|
Three months ended |
Declaration Date |
Realized Silver Price |
|
Minimum Component |
|
Silver-Linked Component |
|
Total Dividend |
|
March 31, 2024 |
May 8, 2024 |
$ |
24.77 |
|
$ |
0.00375 |
|
$ |
0.0025 |
|
$ |
0.00625 |
|
June 30, 2024 |
August 6, 2024 |
|
29.77 |
|
|
0.00375 |
|
|
0.0025 |
|
|
0.00625 |
|
September 30, 2024 |
November 6, 2024 |
|
29.43 |
|
|
0.00375 |
|
|
0.01 |
|
|
0.01375 |
|
December 31, 2024 |
February 7, 2025 |
|
30.19 |
|
|
0.00375 |
|
|
0.01 |
|
|
0.01375 |
|
In early February 2025, we revised our common stock dividend policy to eliminate the silver-linked component, while maintaining the annual common stock dividend. However the declaration and payment of dividends remain in the sole discretion of our Board of Directors, and there can be no assurance it will declare any future dividend.
As discussed in Note 13 of Notes to Consolidated Financial Statements, pursuant to an equity distribution agreement dated February 18, 2021, we may offer and sell up to 60 million shares of our common stock from time to time to or through sales agents in “at-the-market” (ATM) offerings. Sales of the shares, if any, will be made by means of ordinary brokers transactions or as otherwise agreed between the Company and the agents as principals. Whether or not we engage in sales from time to time may depend on a variety of factors, including share price, our cash resources, customary black-out restrictions, and whether we have any material inside information. The agreement can be terminated by us at any time. Any sales of shares under the equity distribution agreement are registered under the Securities Act of 1933, as amended, pursuant to a shelf registration statement on Form S-3. During the year ended December 31, 2025, we sold 35,959,328 shares under the agreement for proceeds of $216.2 million, net of commissions and fees of approximately $3.3 million, which were used to redeem $212 million of our Senior Notes. As of December 31, 2025, we have sold a total of 59,802,012 shares under the agreement for proceeds of $348.5 million, net of commissions and fees of $5.4 million.
As a result of our current cash balances, the performance of our current and expected operations, current metals prices, proceeds from potential at-the-market sales of common stock, and availability under our Credit Agreement (refer to Note 10 of Notes to Consolidated Financial Statements), we believe we will be able to meet our obligations and other potential cash requirements during the next 12 months from the date of this report. Our obligations and other uses of cash may include, but are not limited to: debt service obligations related to the Senior Notes; principal and interest payments under our Credit Agreement; deferral of revenues, care and maintenance costs at certain of our operations; capital expenditures at our operations; potential acquisitions of other mining companies or properties; regulatory matters; litigation; potential repurchases of our common stock under the program described above; and payment of dividends on common stock, if declared by our Board of Directors. We currently estimate a range of approximately $255 to $279 million will be spent in 2026 on capital expenditures, primarily for equipment, infrastructure, and development at our mines, before any lease financing. We also estimate exploration and pre-development expenditures will total approximately $55 million in 2026. Our expenditures for these items and our related plans for 2026 may change based upon our financial position, metals prices, and other considerations. Our ability to fund the activities described above will depend on our operating performance, metals prices, our ability to estimate revenues and costs, sources of liquidity available to us, including the revolving credit facility, and other factors. A sustained downturn in metals prices, significant increase in operational or capital costs or other uses of cash, our inability to access the credit facility or the sources of liquidity discussed above, or other factors beyond our control could impact our plans. See Item 1A. Risk Factors
- An extended decline in metals prices, an increase in operating or capital costs, or treatment charges, mine accidents or closures, increasing regulatory obligations, or our inability to convert resources or exploration targets to reserves may cause us to record write-downs, which could negatively impact our results of operations.
We may defer some capital expenditures and/or exploration and pre-development activities, engage in asset sales or secure additional capital if necessary to maintain liquidity. We also may pursue additional acquisition opportunities, which could require additional equity issuances or other forms of financing. We cannot assure you that such financing will be available to us.
Our liquid assets excluding restricted cash and cash equivalents include (in millions):
|
|
|
|
|
|
|
|
|
|
|
|
|
|
|
December 31,
2025 |
|
|
December 31,
2024 |
|
|
December 31,
2023 |
|
Cash and cash equivalents held in U.S. dollars |
|
$ |
215.1 |
|
|
$ |
24.5 |
|
|
$ |
98.8 |
|
Cash and cash equivalents held in foreign currency |
|
|
26.5 |
|
|
|
2.4 |
|
|
|
7.6 |
|
Total cash and cash equivalents |
|
|
241.6 |
|
|
|
26.9 |
|
|
|
106.4 |
|
Marketable equity securities |
|
|
107.5 |
|
|
|
33.2 |
|
|
|
32.3 |
|
Total cash, cash equivalents and investments |
|
$ |
349.1 |
|
|
$ |
60.1 |
|
|
$ |
138.7 |
|
Cash and cash equivalents increased by $214.7 million in 2025, for the reasons discussed below. Cash and cash equivalents held in foreign currencies primarily represents balances in CAD, and increased by $24.1 million in 2025. The value of marketable equity securities at the end of 2025 increased by $74.3 million due to an overall fair value increase.
|
|
|
|
|
|
|
|
|
|
|
|
|
|
|
Year Ended December 31, |
|
|
|
2025 |
|
|
2024 |
|
|
2023 |
|
Cash provided by operating activities of continuing operations (in millions) |
|
$ |
403.4 |
|
|
$ |
167.3 |
|
|
$ |
75.4 |
|
Cash provided by operating activities of continuing operations increased by $236.1 million in 2025 compared to 2024. The increase was due to higher income, adjusted for non-cash items, which increased by $288.3 million, partly offset by the negative impact of working capital and other operating asset and liability changes that increased by $52.2 million. Income, adjusted for non-cash items, was higher primarily due to higher revenues. Negative working capital adjustments, primarily related to an increase in accounts receivables reflecting the higher price environment and a concentrate shipment close to year end at Greens Creek contributed to the increased working capital in 2025 compared to 2024.
Cash provided by operating activities of continuing operations increased by $91.9 million in 2024 compared to 2023. The increase was due to higher income, adjusted for non-cash items, which increased by $134.2 million, partly offset by the negative impact of working capital and other operating asset and liability changes. Income, adjusted for non-cash items, was higher due to higher realized prices for all metals, except lead, and higher volumes sold, except for gold. Higher volumes sold resulted from the current year containing a full year of production from Keno Hill and Lucky Friday (which had suspended operations for 5 months of the year due to the 2023 fire). Negative working capital and other operating asset and liability changes contributed to a decrease of working capital of $42.2 million in 2024 compared to 2023. Significant variances in working capital changes between 2024 and 2023 resulted from negative movements in accounts receivables as Lucky Friday operations were suspended at December 31, 2023.
|
|
|
|
|
|
|
|
|
|
|
|
|
|
|
Year Ended December 31, |
|
|
|
2025 |
|
|
2024 |
|
|
2023 |
|
Cash used in investing activities of continuing operations (in millions) |
|
$ |
(209.0 |
) |
|
$ |
(152.2 |
) |
|
$ |
(161.2 |
) |
Capital expenditures were $190.9 million in 2025, which was $37.1 million higher than 2024, primarily due to pond 5 construction and development at Lucky Friday, and higher development at Keno Hill. We also purchased silver put options for $25.0 million to protect gross margins for a significant part of our 2026 production. In addition, we collected $28.1 million from investment sales and purchased investments for $21.9 million.
Capital expenditures, in 2024 were consistent with 2023. Higher cash used in investing activities in 2023 was due to short-term investments purchases of $9.0 million.
|
|
|
|
|
|
|
|
|
|
|
|
|
|
|
Year Ended December 31, |
|
|
|
2025 |
|
|
2024 |
|
|
2023 |
|
Cash (used in) provided by financing activities of continuing operations (in millions) |
|
$ |
(76.0 |
) |
|
$ |
(82.3 |
) |
|
$ |
157.1 |
|
During 2025, we fully repaid our IQ Notes and we had net repayments of $23.0 million on our revolving credit facility resulting in no amount drawn as of December 31, 2025. We drew down a cumulative $279 million and repaid a cumulative $384 million, and drew down a cumulative $239 million and repaid a cumulative $111 million on our Credit Agreement during 2024 and 2023, respectively. In 2025, 2024 and 2023, we paid total cash dividends on our common and preferred stock of $10.4 million, $25.3 million, and $15.7 million, respectively. We made payments on our finance leases of $6.7 million, $9.2 million, and $9.9 million in 2025, 2024, and 2023, respectively. We issued stock under our ATM program described above for net proceeds of $216.2 million (utilized to redeem $212 million of Senior Notes), $58.4 million, and $56.7 million in 2025, 2024, and 2023, respectively. During 2025, 2024 and 2023, we also purchased shares of our common stock for $0.9 million, $1.2 million, and $2.0 million, respectively, as a result of our employees' election to utilize net share settlement to satisfy their tax withholding obligations related to incentive compensation paid in stock and vesting of restricted stock units. See Note 13 of Notes to Consolidated Financial Statements for more information.
Exchange rate fluctuations between the U.S. dollar and the Canadian dollar and Mexican peso resulted in an increase in our cash balance of $0.5 million, a decrease of $1.1 million, and an increase of $1.1 million, during 2025, 2024 and 2023, respectively.
Contractual Obligations and Contingent Liabilities and Commitments
The table below presents our fixed, non-cancelable contractual obligations and commitments primarily related to our Senior Notes, revolving credit facility, outstanding purchase orders and certain service contract commitments, and lease arrangements as of December 31, 2025 (in thousands):
|
|
|
|
|
|
|
|
|
|
|
|
|
|
|
|
|
|
|
|
|
|
|
Payments Due By Period |
|
|
|
Less than
1 year |
|
|
2-3 years |
|
|
4-5 years |
|
|
After
5 years |
|
|
Total |
|
Purchase and contractual obligations (1) |
|
$ |
29,686 |
|
|
$ |
— |
|
|
$ |
— |
|
|
$ |
— |
|
|
$ |
29,686 |
|
Credit Agreement (2) |
|
|
1,604 |
|
|
|
2,543 |
|
|
|
— |
|
|
|
— |
|
|
$ |
4,147 |
|
Finance lease commitments (3) |
|
|
4,469 |
|
|
|
1,247 |
|
|
|
— |
|
|
|
— |
|
|
$ |
5,716 |
|
Operating lease commitments (4) |
|
|
1,501 |
|
|
|
2,974 |
|
|
|
2,621 |
|
|
|
5,060 |
|
|
$ |
12,156 |
|
Senior Notes (5) |
|
|
19,068 |
|
|
|
19,068 |
|
|
|
265,403 |
|
|
|
— |
|
|
$ |
303,539 |
|
Total contractual cash obligations |
|
$ |
56,328 |
|
|
$ |
25,832 |
|
|
$ |
268,024 |
|
|
$ |
5,060 |
|
|
$ |
355,244 |
|
(1)Consists of open purchase orders and commitments of approximately $6.8 million, $7.1 million, $6.8 million, and $0.6 million for various capital and non-capital items at Greens Creek, Lucky Friday, Keno Hill, and Other Operations, respectively.
(2)The Credit Agreement provides for a $225 million revolving credit facility, plus a $75 million accordion option. We had no amount drawn and $6.7 million in letters of credit outstanding as of December 31, 2025. The amounts in the table above assumes no additional amounts will be drawn in future periods, and includes only the standby fee on the current undrawn balance and accrued interest. For more information on our Credit Agreement, see Note 10 of Notes to Consolidated Financial Statements.
(3)Includes scheduled finance lease payments of $0.8 million, $2.4 million, and $2.5 million for equipment at Greens Creek, Lucky Friday, and Keno Hill, respectively. For more information, see Note 10 of Notes to Consolidated Financial Statements.
(4)We enter into operating leases in the normal course of business. Substantially all lease agreements have fixed payment terms based on the passage of time. Some lease agreements provide us with the option to renew the lease. Our future operating lease obligations would change if we exercised these renewal options and if we entered into additional operating lease arrangements. For more information, see Note 10 of Notes to Consolidated Financial Statements.
(5)On February 19, 2020, we completed an offering of $475 million in aggregate principal amount of our Senior Notes. The Senior Notes bear interest at a rate of 7.25% per year, with interest payable on February 15 and August 15 of each year, commencing August 15, 2020, which were partially redeemed on August 18, 2025 for a redemption premium of $3.8 million. For more information, see Note 10 of Notes to Consolidated Financial Statements.
We record liabilities for estimated costs associated with mine closure, reclamation of land and other environmental matters. At December 31, 2025, our liabilities for these matters totaled $126.3 million. Future expenditures related to closure, reclamation and environmental expenditures at our other sites are difficult to estimate, although we anticipate we will incur expenditures relating to these obligations over the next 30 years. For additional information relating to our environmental obligations, see Note 6 of Notes to Consolidated Financial Statements and Item 1A. Risk Factors – Our environmental obligations may exceed the provisions we have made. As discussed in Note 17 of Notes to Consolidated Financial Statements, we are involved in various other legal proceedings which may result in obligations in excess of provisions we have made.
Critical Accounting Estimates
Our significant accounting policies are described in Note 2 of Notes to Consolidated Financial Statements. As described in such Note 2, we are required to make estimates and assumptions that affect the reported amounts and related disclosures of assets, liabilities, revenue, and expenses. Our estimates are based on our experience and our interpretation of economic, political, regulatory, and other factors that affect our business prospects. Actual results may differ significantly from our estimates.
We believe that our most critical accounting estimates are related to future metals prices; obligations for environmental, reclamation, and closure matters; mineral reserves and resources; valuation of deferred tax assets and assumptions used in accounting for our pension plans, as they require us to make assumptions that are highly uncertain at the time the accounting estimates are made and changes in them are reasonably likely to occur from period to period. Management has discussed the development and selection of these critical accounting estimates with the Audit Committee of our Board of Directors, and the Audit Committee has reviewed the disclosures presented below. In addition, there are other items within our financial statements that require estimation, but are not deemed to be critical. However, changes in estimates used in these and other items could have a material impact on our financial statements.
Future Metals Prices
Metals prices are key components in estimates that determine the valuation of some of our significant assets and liabilities, including properties, plants, equipment and mine development, deferred tax assets, and certain accounts receivable. Metals prices are also an important component in the estimation of reserves and resources. As shown above in Item 1. – Business, metals prices have historically been volatile. Silver demand arises from investment demand, particularly in exchange-traded funds, industrial demand, and consumer demand. Gold demand arises primarily from investment and consumer demand. Investment demand for silver and gold can be influenced by several factors, including: the value of the U.S. dollar and other currencies, changing U.S. budget deficits, widening availability of exchange-traded funds, interest rate levels, the health of credit markets, and inflationary expectations. Uncertainty related to (i) the political environment in the U.S., (ii) U.S. and global trading policies (including tariffs), (iii) a global economic recovery, and (iv) recent uncertainty in China, could result in continued investment demand for precious metals. Industrial demand for silver is closely linked to world Gross Domestic Product growth and industrial fabrication levels, as it is difficult to substitute for silver in industrial fabrication. Consumer demand is driven significantly by demand for jewelry and other retail products. We believe that long-term industrial and economic trends, including demand for metals to decarbonize the economy and urbanization and growth of the middle class in countries such as China and India, will result in continued consumer demand for silver and gold and industrial demand for silver. There can be no assurance whether these trends will continue or how they will impact prices of the metals we produce. In the past, we have recorded impairments to our asset carrying values because of low prices, and we can offer no assurance that prices will either remain at their current levels or increase.
Processes supporting valuation of our assets and liabilities that are most significantly affected by metals prices include analysis of asset carrying values, depreciation, reserves and resources, and deferred income taxes. On at least an annual basis - and more frequently if circumstances warrant - we examine our depreciation rates, reserve estimates, and the valuation allowances on our deferred tax assets. We examine the carrying values of our assets as changes in facts and circumstances warrant. In our evaluation of carrying values and deferred taxes, we apply several pricing views to our forecasting model, including current prices, analyst price estimates, forward-curve prices, and historical prices (see Mineral Reserves and Resources, below, regarding prices used for reserve and resource estimates). Using applicable accounting guidance and our view of metals markets, we use the probability-weighted average of the various methods to determine whether the values of our assets are fairly stated, and to determine the level of valuation allowances, if any, on our deferred tax assets. In addition, estimates of future metals prices are used in the valuation of certain assets in the determination of the purchase price allocations for our acquisitions.
Sales of concentrates sold directly to customers are recorded as revenues upon completion of the performance obligations and transfer of control of the product to the customer (generally at the time of shipment) using estimated forward metals prices for the estimated month of settlement. Due to the time elapsed between shipment of concentrates to the customer and final settlement with the customer, we must estimate the prices at which sales of our metals will be settled. Previously recorded sales and trade accounts receivable are adjusted to estimated settlement prices until final settlement by the customer. Changes in metals prices between shipment and final settlement result in changes to revenues and accounts receivable previously recorded upon shipment. As a result, our trade accounts receivable balances related to concentrate sales are subject to changes in metals prices until final settlement occurs. For more information, see Note 5 of Notes to Consolidated Financial Statements.
We utilize financially-settled forward contracts, commodity price collars and put options to manage our exposure to changes in prices for silver, gold, zinc and lead. See Item 7A. – Quantitative and Qualitative Disclosures About Market Risk - Commodity-Price Risk Management below for more information on our contract programs. Changes in silver, gold, zinc and lead prices between the dates that the contracts are entered into and their settlements will result in changes to the fair value asset or liability associated with the contracts, with a corresponding gain or loss for silver and gold contracts recognized in earnings and gain or loss for lead and zinc contracts deferred to accumulated other comprehensive income (loss).
Obligations for Environmental, Reclamation and Closure Matters
Accrued reclamation and closure costs can represent a significant and variable liability on our balance sheet. We have estimated our liabilities under appropriate accounting guidance; however, the ranges of liability could exceed the liabilities recognized. If substantial damages were awarded, claims were settled, or remediation costs incurred in excess of our accruals, our financial results or condition could be materially adversely affected.
Mineral Reserves and Resources
Critical estimates are inherent in the process of determining our reserves and resources. Our reserves and resources are affected largely by our assessment of future metals prices, as well as by engineering and geological estimates of ore grade, accessibility, future recoveries, capital expenditures and production costs. See Item 2. – Properties above for the metals price assumptions used in our estimates of reserves and resources as of December 31, 2025, 2024, and 2023. Our assessment of reserves and resources occurs at least annually. Periodically we utilize external specialists to perform independent audits of our operating properties reserves and resources.
Reserves and resources are a key component in the valuation of our properties, plants and equipment. Reserve estimates are used in determining appropriate rates of units-of-production depreciation, with net book value of many assets depreciated over remaining estimated reserves. Reserves and resources are also a key component in forecasts, with which we compare future cash flows to current asset values in an effort to ensure that carrying values are reported appropriately. Our forecasts are also used in determining the level of valuation allowances on our deferred tax assets. Reserves and resources also play a key role in the valuation of certain assets in the determination of the purchase price allocations for acquisitions. Annual reserve and resource estimates are also used to determine conversions of resources and exploration targets beyond the known reserve resulting from business combinations to depreciable reserves, in periods subsequent to the business combinations. Reserves and resources are a culmination of many estimates and are not guarantees that we will recover the indicated quantities of metals or that we will do so at a profitable level.
Valuation of Deferred Tax Assets
Our deferred income tax assets include certain future tax benefits. We record a valuation allowance against any portion of those deferred income tax assets when we believe, based on the weight of available evidence, it is more likely than not that some portion or all of the deferred income tax asset will not be realized. We review the likelihood that we will realize the benefit of our deferred tax assets and therefore the need for valuation allowances on a quarterly basis, or more frequently if events indicate that a review is required. In determining the requirement for a valuation allowance, the historical and projected financial results of the legal entity or consolidated group recording the net deferred tax asset is considered, along with all other available positive and negative evidence.
Certain categories of evidence carry more weight in the analysis than others based upon the extent to which the evidence may be objectively verified. We look to the nature and severity of cumulative pretax losses (if any) in the current three-year period ending on the evaluation date or the expectation of future pretax losses and the existence and frequency of prior cumulative pretax losses.
We utilize a rolling twelve quarters of pre-tax income or loss as a measure of our cumulative results in recent years. Concluding that a valuation allowance is not required is difficult when there is significant negative evidence which is objective and verifiable, such as cumulative losses in recent years. However, a cumulative three year loss is not solely determinative of the need for a valuation allowance. We also consider all other available positive and negative evidence in our analysis.
Other factors considered in the determination of the probability of the realization of the deferred tax assets include, but are not limited to:
•Projected future financial and taxable income based upon existing reserves and long-term estimates of commodity prices;
•The duration of statutory carry forward periods;
•Prudent and feasible tax planning strategies readily available that may alter the timing of reversal of the temporary difference;
•Nature of temporary differences and predictability of reversal patterns of existing temporary differences; and
•The sensitivity of future forecasted results to commodity prices and other factors.
The Company assesses available positive and negative evidence to estimate if sufficient future taxable income will be generated to utilize the existing deferred tax assets. A significant piece of objective negative evidence is recent pretax losses and/or expectations of future pretax losses. Such objective evidence limits the ability to consider other subjective evidence including projections for future
growth. The amount of the deferred tax asset considered realizable, however, could be adjusted if estimates of future taxable income during the carryforward period are increased or if objective negative evidence in the form of cumulative losses is no longer present and additional weight may be given to subjective evidence such as our projections for growth.
See Note 8 of Notes to Consolidated Financial Statements for additional detail on the valuation allowance.
Pension Plan Accounting Assumptions
We are required to make a number of assumptions in estimating the future benefit obligations for, and fair value of assets included in, our pension plans, which impact the amount of liability and net periodic pension cost recognized related to our plans. These include assumptions for applicable discount rates, the expected rate of return on plan assets and the rate of future employee compensation increases. See Note 7 of Notes to Consolidated Financial Statements for more information on the accounting for our pension plans and the related assumptions.
New Accounting Pronouncements
Accounting Standard Updates that Became Effective in the Current Period
In December 2023, the FASB issued ASU 2023-09, Income Taxes (Topic 740): Improvement to Income Tax Disclosures, amending income tax disclosure requirements for the effective tax rate reconciliation and income taxes paid. The amendments in ASU 2023-09 are effective for fiscal years beginning after December 15, 2024 and are applied prospectively. Early adoption and retrospective application of the amendments are permitted. As the amendments apply to income tax disclosures only, the Company does not expect adoption to have a material impact on our consolidated financial statements and disclosures. We retrospectively adopted the amended tax disclosures in our financial statements for the year ended December 31, 2025.
Accounting Standard Updates to Become Effective in Future Periods
In November 2024, the FASB issued ASU 2024-03, Income Statement - Reporting Comprehensive Income (Topic 220): Expense Disaggregation Disclosures, which includes amendments to require the disclosure of certain specific costs and expenses that are included in a relevant expense caption on the face of the income statement. Specific costs and expenses that would be required to be disclosed include: (i) purchases of inventory; (ii) employee compensation; (iii) depreciation; (iv) depreciation, depletion and amortization; and (v) intangible asset amortization. Additionally, a qualitative description of other items is required, equal to the difference between the relevant expense caption and the separately disclosed specific costs. The amendments in ASU 2024-03 are effective for fiscal years beginning after December 15, 2026, and for interim periods beginning after December 15, 2027, and are applied retrospectively. The Company is evaluating the impact of the amendments on our consolidated financial statements and disclosures.
Guarantor Subsidiaries
Presented below are Hecla’s condensed consolidating financial statements as required by Rule 3-10 of Regulation S-X of the Securities Exchange Act of 1934, as amended, resulting from the guarantees by certain of Hecla's subsidiaries of the Senior Notes and IQ Notes (see Note 10 of Notes to Consolidated Financial Statements for more information). As of December 31, 2025, the Guarantors consist of the following Hecla 100%-owned subsidiaries: Hecla Limited; Silver Hunter Mining Company; Rio Grande Silver, Inc.; Hecla MC Subsidiary, LLC; Hecla Silver Valley, Inc.; Burke Trading, Inc.; Hecla Montana, Inc.; Revett Silver Company; RC Resources, Inc.; Troy Mine Inc.; Revett Exploration, Inc.; Revett Holdings, Inc.; Mines Management, Inc.; Newhi, Inc.; Montanore Minerals Corp.; Hecla Alaska LLC; Hecla Greens Creek Mining Company; Hecla Admiralty Company; Hecla Juneau Mining Company; Klondex Holdings Inc.; Klondex Gold & Silver Mining Co.; Klondex Midas Holdings Limited; Klondex Aurora Mine Inc.; Klondex Hollister Mine Inc.; Hecla Quebec, Inc.; and Alexco Resource Corp. We completed the offering of the Senior Notes on February 19, 2020 under our shelf registration statement previously filed with the SEC.
The condensed consolidating financial statements below have been prepared from our financial information on the same basis of accounting as the consolidated financial statements set forth elsewhere in this report. Investments in the subsidiaries are accounted for under the equity method. Accordingly, the entries necessary to consolidate Hecla, the Guarantors, and our non-guarantor subsidiaries are reflected in the eliminations column. In the course of preparing consolidated financial statements, we eliminate the effects of various transactions conducted between Hecla and its subsidiaries and among the subsidiaries. While valid at an individual subsidiary level, such activities are eliminated in consolidation because, when taken as a whole, they do not represent business activity with third-party customers, vendors, and other parties. Examples of such eliminations include the following:
•Investments in subsidiaries. The acquisition of a company results in an investment in debt or equity capital on the records of the parent company and a contribution to debt or equity capital on the records of the subsidiary. Such investments and capital contributions are eliminated in consolidation.
•Capital contributions. Certain of Hecla's subsidiaries do not generate cash flow, either at all or that is sufficient to meet their capital needs, and their cash requirements are routinely met with inter-company advances from their parent companies. Generally on an annual basis, when not otherwise intended as debt, the boards of directors of such parent companies declare contributions of capital to their subsidiary companies, which increase the parents' investment and the subsidiaries' additional paid-in capital. In consolidation, investments in subsidiaries and related additional paid-in capital are eliminated.
•Debt. At times, inter-company debt agreements have been established between certain of Hecla's subsidiaries and their parents. The related debt liability and receivable balances, accrued interest expense (if any) and income activity (if any), and payments of principal and accrued interest amounts (if any) by the subsidiary companies to their parents are eliminated in consolidation.
•Dividends. Certain of Hecla's subsidiaries which generate cash flow routinely provide cash to their parent companies through inter-company transfers. On at least an annual basis, the boards of directors of such subsidiary companies declare dividends to their parent companies, which reduces the subsidiaries' retained earnings and increases the parents' dividend income. In consolidation, such activity is eliminated.
•Deferred taxes. Our ability to realize deferred tax assets and liabilities is considered for two consolidated tax groups of subsidiaries within the United States: The Nevada U.S. Group and the Hecla U.S. Group. Within each tax group, all subsidiaries' estimated future taxable income contributes to the ability of their tax group to realize all such assets and liabilities. However, when Hecla's subsidiaries are viewed independently, we use the separate return method to assess the realizability of each subsidiary's deferred tax assets and whether a valuation allowance is required against such deferred tax assets. In some instances, a parent company or subsidiary may possess deferred tax assets whose realization depends on the future taxable income of other subsidiaries on a consolidated-return basis, but would not be considered realizable if such parent or subsidiary filed on a separate stand-alone basis. In such a situation, a valuation allowance is assessed on that subsidiary's deferred tax assets, with the resulting adjustment reported in the eliminations column of the guarantor and parent's financial statements, as is the case in the financial statements set forth below. The separate return method can result in significant eliminations of deferred tax assets and liabilities and related income tax provisions and benefits. Non-current deferred tax asset balances are included in other non-current assets on the consolidating balance sheets and make up a large portion of that item, particularly for the guarantor balances.
Separate financial statements of the Guarantors are not presented because the guarantees by the Guarantors are joint and several and full and unconditional, except for certain customary release provisions, including: (1) the sale or disposal of all or substantially all of the assets of the Guarantor; (2) the sale or other disposition of the capital stock of the Guarantor; (3) the Guarantor is designated as an unrestricted entity in accordance with the applicable provisions of the indenture; (4) Hecla ceases to be a borrower as defined in the indenture; and (5) upon legal or covenant defeasance or satisfaction and discharge of the indenture.
Condensed Consolidating Balance Sheets
|
|
|
|
|
|
|
|
|
|
|
|
|
As of December 31, 2025 |
|
|
Parent |
|
Guarantors |
|
Non-Guarantors |
|
Eliminations |
|
Consolidated |
|
|
(in thousands) |
Assets |
|
|
|
|
|
|
|
|
|
|
Cash and cash equivalents |
|
$210,465 |
|
$18,559 |
|
$12,534 |
|
$— |
|
$241,558 |
Other current assets |
|
56,469 |
|
336,575 |
|
46,258 |
|
(92,301) |
|
347,001 |
Property, plants, equipment and mine development, net |
|
296 |
|
2,122,194 |
|
8,091 |
|
— |
|
2,130,581 |
Intercompany receivable (payable) |
|
(685,894) |
|
(367,211) |
|
667,695 |
|
385,410 |
|
— |
Investments in subsidiaries |
|
2,842,226 |
|
(52) |
|
— |
|
(2,842,174) |
|
— |
Other non-current assets |
|
672,380 |
|
15,646 |
|
200,970 |
|
(799,220) |
|
89,776 |
Assets of discontinued operations |
|
— |
|
751,729 |
|
— |
|
— |
|
751,729 |
Total assets |
|
$3,095,942 |
|
$2,877,440 |
|
$935,548 |
|
$(3,348,285) |
|
$3,560,645 |
Liabilities and Stockholders' Equity |
|
|
|
|
|
|
|
|
|
|
Current liabilities |
|
$86,837 |
|
$166,108 |
|
$46,907 |
|
$(108,646) |
|
$191,206 |
Long-term debt |
|
261,947 |
|
1,224 |
|
— |
|
— |
|
263,171 |
Non-current portion of accrued reclamation |
|
— |
|
111,027 |
|
1,464 |
|
— |
|
112,491 |
Non-current deferred tax liability |
|
131,136 |
|
27,039 |
|
(590) |
|
— |
|
157,585 |
Other non-current liabilities |
|
24,376 |
|
207,966 |
|
198,983 |
|
(397,413) |
|
33,912 |
Liabilities of discontinued operations |
|
— |
|
210,634 |
|
— |
|
— |
|
210,634 |
Stockholders' equity |
|
2,591,646 |
|
2,153,442 |
|
688,784 |
|
(2,842,226) |
|
2,591,646 |
Total liabilities and stockholders' equity |
|
$3,095,942 |
|
$2,877,440 |
|
$935,548 |
|
$(3,348,285) |
|
$3,560,645 |
Condensed Consolidating Statements of Operations and Comprehensive Income (Loss)
|
|
|
|
|
|
|
|
|
|
|
|
|
|
|
|
|
|
|
|
|
|
|
Year Ended December 31, 2025 |
|
|
|
Parent |
|
|
Guarantors |
|
|
Non-Guarantors |
|
|
Eliminations |
|
|
Consolidated |
|
|
|
(in thousands) |
|
Revenues |
|
$ |
(29,620 |
) |
|
$ |
1,139,645 |
|
|
$ |
— |
|
|
$ |
(6,123 |
) |
|
$ |
1,103,902 |
|
Costs applicable to sales (1) |
|
|
— |
|
|
|
(471,056 |
) |
|
|
— |
|
|
|
3,743 |
|
|
|
(467,313 |
) |
Depreciation, depletion, and amortization |
|
|
— |
|
|
|
(126,784 |
) |
|
|
— |
|
|
|
— |
|
|
|
(126,784 |
) |
General and administrative |
|
|
(21,749 |
) |
|
|
(33,101 |
) |
|
|
(2,776 |
) |
|
|
— |
|
|
|
(57,626 |
) |
Exploration and pre-development |
|
|
(568 |
) |
|
|
(25,062 |
) |
|
|
(1,722 |
) |
|
|
— |
|
|
|
(27,352 |
) |
Equity in earnings of subsidiaries |
|
|
325,751 |
|
|
|
— |
|
|
|
— |
|
|
|
(325,751 |
) |
|
|
— |
|
Other income (expense) |
|
|
(5,038 |
) |
|
|
(82,509 |
) |
|
|
17,142 |
|
|
|
2,379 |
|
|
|
(68,026 |
) |
Income (loss) before income and mining taxes |
|
|
268,776 |
|
|
|
401,133 |
|
|
|
12,644 |
|
|
|
(325,752 |
) |
|
|
356,801 |
|
Income and mining tax provision |
|
|
(10,717 |
) |
|
|
(88,702 |
) |
|
|
677 |
|
|
|
— |
|
|
|
(98,742 |
) |
Income (loss) from continuing operations |
|
|
258,059 |
|
|
|
312,431 |
|
|
|
13,321 |
|
|
|
(325,752 |
) |
|
|
258,059 |
|
Income from discontinued operations, net of taxes |
|
|
63,653 |
|
|
|
63,653 |
|
|
|
— |
|
|
|
(63,653 |
) |
|
|
63,653 |
|
Net income (loss) |
|
|
321,712 |
|
|
|
376,084 |
|
|
|
13,321 |
|
|
|
(389,405 |
) |
|
|
321,712 |
|
Preferred stock dividends |
|
|
(552 |
) |
|
|
— |
|
|
|
— |
|
|
|
— |
|
|
|
(552 |
) |
Net income (loss) applicable to common stockholders |
|
|
321,160 |
|
|
|
376,084 |
|
|
|
13,321 |
|
|
|
(389,405 |
) |
|
|
321,160 |
|
Income (loss) from continuing operations |
|
|
258,059 |
|
|
|
312,431 |
|
|
|
13,321 |
|
|
|
(325,752 |
) |
|
|
258,059 |
|
Other comprehensive loss |
|
|
6,932 |
|
|
|
— |
|
|
|
— |
|
|
|
— |
|
|
|
6,932 |
|
Comprehensive income from continuing operations |
|
|
264,991 |
|
|
|
312,431 |
|
|
|
13,321 |
|
|
|
(325,752 |
) |
|
|
264,991 |
|
Comprehensive income from discontinued operations |
|
|
63,653 |
|
|
|
63,653 |
|
|
|
— |
|
|
|
(63,653 |
) |
|
|
63,653 |
|
Comprehensive income |
|
$ |
328,644 |
|
|
$ |
376,084 |
|
|
$ |
13,321 |
|
|
$ |
(389,405 |
) |
|
$ |
328,644 |
|
(1) Excludes depreciation, depletion and amortization.
Forward-Looking Statements
The foregoing discussion and analysis, as well as certain information contained elsewhere in this report, contain forward-looking statements within the meaning of Section 27A of the Securities Act of 1933, as amended, and Section 21E of the Exchange Act, and are intended to be covered by the safe harbor created thereby. See the discussion in Special Note on Forward-Looking Statements included prior to Item 1.
Item 7A. Quantitative and Qualitative Disclosures about Market Risk
The following discussion about our exposure to market risks and risk-management activities includes forward-looking statements that involve risk and uncertainties, as well as summarizes the financial instruments held by us at December 31, 2025 which are sensitive to changes in commodity prices, foreign exchange rates and interest rates and are not held for trading purposes. Actual results could differ materially from those projected in the forward-looking statements. In the normal course of business, we also face risks that are either non-financial or non-quantifiable (see Item 1A. Risk Factors above).
Metals Prices
Changes in the market prices of silver, gold, lead, and zinc can significantly affect our profitability and cash flow. As discussed in Item 7. Management's Discussion and Analysis of Financial Condition and Results of Operations - Critical Accounting Estimates, metals prices can fluctuate due to numerous factors beyond our control. As discussed below, we utilize financially-settled forward and put option contracts to manage our exposure to changes in prices for silver, gold, zinc, and lead.
Provisional Sales
Sales of all metals products sold directly to customers, including by-product metals, are recorded as revenues when all performance obligations have been completed and the transaction price can be determined or reasonably estimated. For concentrate sales, revenues are generally recorded at the time of shipment at forward prices for the estimated month of settlement. Due to the time elapsed between shipment to the customer and the final settlement with the customer we must estimate the prices at which sales of our metals will be settled. Previously recorded sales are adjusted to estimated settlement metals prices until final settlement by the customer. Changes in metals prices between shipment and final settlement will result in changes to revenues previously recorded upon shipment. Metals prices can and often do fluctuate widely and are affected by numerous factors beyond our control (see Item 1A. Risk Factors – A substantial or extended decline in metals prices would have a material adverse effect on us). At December 31, 2025, metals contained in concentrate sales and exposed to future price changes totaled approximately 3.5 million ounces of silver, 2,272 ounces of gold, 14,028
tons of zinc, and 8,322 tons of lead. If the price for each metal were to change by 10%, the change in the total value of the concentrates sold would be approximately $18.3 million. However, as discussed in Commodity-Price Risk Management below, at times, subject to management's discretion, we utilize a program designed and intended to mitigate the risk of price adjustments with limited mark-to-market financially-settled forward contracts for our silver, gold, zinc and lead sales. Therefore, the impact of changes in prices on the value of concentrates sold would be substantially offset by a gain or loss on forward contracts to the extent such contracts are utilized.
Commodity-Price Risk Management
We may at times use commodity forward sales commitments, commodity swap contracts and commodity put and call option contracts to manage our exposure to fluctuation in the prices of certain metals we produce. Contract positions are designed to ensure that we will receive a defined minimum price for certain quantities of our production, thereby partially offsetting our exposure to fluctuations in market prices. Our risk management policy allows for up to 75% of our planned metals price exposure for five years into the future, with certain other limitations, to be covered under such programs that would establish a ceiling for prices to be realized on future sales. These instruments do, however, expose us to (i) credit risk in the event of non-performance by counterparties for contracts in which the contract price exceeds the spot price of a commodity and (ii) price risk to the extent that the spot price exceeds the contract price for quantities of our production covered under contract positions.
We are currently using financially-settled forward contracts to manage the exposure to changes in prices of silver, gold, zinc and lead contained in our concentrate shipments between the time of shipment and final settlement. In addition, we are using financially-settled forward contracts to manage the exposure to changes in prices of zinc and lead (but not silver and gold) contained in our forecasted future concentrate shipments. The following tables summarize the quantities of metals committed under forward sales contracts at December 31, 2025 and 2024:
|
|
|
|
|
|
|
|
|
|
|
|
|
|
|
|
|
December 31, 2025 |
|
Pounds under contract (in 000's) |
|
|
Average price per pound |
|
|
|
Zinc |
|
|
Lead |
|
|
Zinc |
|
|
Lead |
|
|
|
(pounds) |
|
|
(pounds) |
|
|
(pounds) |
|
|
(pounds) |
|
Contracts on provisional sales |
|
|
|
|
|
|
|
|
|
|
|
|
2026 settlements |
|
|
18,850 |
|
|
|
13,117 |
|
|
$ |
1.37 |
|
|
$ |
1.05 |
|
Contracts on forecasted sales |
|
|
|
|
|
|
|
|
|
|
|
|
2026 settlements |
|
|
53,407 |
|
|
|
42,108 |
|
|
$ |
1.33 |
|
|
$ |
1.02 |
|
2027 settlements |
|
|
23,810 |
|
|
|
— |
|
|
$ |
1.36 |
|
|
N/A |
|
|
|
|
|
|
|
|
|
|
|
|
|
|
|
|
|
|
|
|
|
|
|
|
|
|
|
|
|
|
|
|
|
|
December 31, 2024 |
|
Ounces/pounds under contract (in 000's) |
|
|
Average price per ounce/pound |
|
|
|
Silver |
|
|
Gold |
|
|
Zinc |
|
|
Lead |
|
|
Silver |
|
|
Gold |
|
|
Zinc |
|
|
Lead |
|
|
|
(ounces) |
|
|
(ounces) |
|
|
(pounds) |
|
|
(pounds) |
|
|
(ounces) |
|
|
(ounces) |
|
|
(pounds) |
|
|
(pounds) |
|
Contracts on provisional sales |
|
|
|
|
|
|
|
|
|
|
|
|
|
|
|
|
|
|
|
|
|
|
|
|
2025 settlements |
|
|
1,535 |
|
|
|
2 |
|
|
|
20,834 |
|
|
|
14,661 |
|
|
$ |
31.46 |
|
|
$ |
2,673 |
|
|
$ |
1.40 |
|
|
$ |
0.97 |
|
Contracts on forecasted sales |
|
|
|
|
|
|
|
|
|
|
|
|
|
|
|
|
|
|
|
|
|
|
|
|
2025 settlements |
|
|
— |
|
|
|
— |
|
|
|
59,194 |
|
|
|
47,840 |
|
|
N/A |
|
|
N/A |
|
|
$ |
1.39 |
|
|
$ |
0.99 |
|
2026 settlements |
|
|
— |
|
|
|
— |
|
|
|
6,283 |
|
|
|
52,911 |
|
|
N/A |
|
|
N/A |
|
|
$ |
1.41 |
|
|
$ |
1.03 |
|
We designate the contracts for lead and zinc contained in our forecasted future shipments as hedges for accounting purposes, with gains and losses deferred to accumulated other comprehensive loss until the hedged product ships. The forward contracts for silver and gold contained in our concentrate shipments have not been designated as hedges and are marked-to-market through earnings each period.
Since the first quarter of 2025, we have and continue to utilize Collars to manage our exposure to changes in the price of precious metals in both our provisional concentrate sales and forecasted Keno Hill future concentrate shipments. These Collars provide us a contractual right to receive at least the minimum price if market prices fall below the minimum price level specified in the contracts, while limiting our potential gains to the maximum price level specified in the contracts, even if market prices rise higher. This strategy helps protect us from significant price drops while still allowing for some upside potential within the minimum and maximum price range. For the year ending December 31, 2025, these collars had net losses of $51.5 million, of which $15.2 million was realized. For accounting purposes, they are not designated as hedges. The following tables summarize the quantities of metals hedged under Collars at December 31, 2025:
|
|
|
|
|
|
|
|
|
|
|
|
|
|
|
|
|
|
|
|
|
|
|
|
|
Settlement Period |
|
Production Protected |
|
|
Average strike price per silver ounce |
|
|
Average strike price per gold ounce |
|
|
|
Silver (ounces) |
|
|
Gold (ounces) |
|
|
Minimum ($) |
|
|
Maximum ($) |
|
|
Minimum ($) |
|
|
Maximum ($) |
|
Contracts on provisional sales |
|
|
|
|
|
|
|
|
|
|
|
|
|
|
|
|
|
|
2026 settlements |
|
|
2,120 |
|
|
|
— |
|
|
|
49.78 |
|
|
|
63.43 |
|
|
N/A |
|
|
N/A |
|
Contracts on forecasted sales |
|
|
|
|
|
|
|
|
|
|
|
|
|
|
|
|
|
|
2026 settlements |
|
|
800 |
|
|
|
4 |
|
|
|
34.29 |
|
|
|
55.70 |
|
|
|
3,000 |
|
|
|
4,840 |
|
In December 2025, we entered into financially-settled put option contracts to manage the exposure of future silver sales to potential declines in market prices of silver. These put options give us the option, but not the obligation, to realize established prices on quantities of silver to be sold in the future. Total premium paid for the put contracts was $25 million and we recorded a $10.4 million unrealized loss on the puts during the year ending December 31, 2025. The following table summarizes the quantities of metals for which we have entered into put contracts and the average exercise prices as of December 31, 2025:
|
|
|
|
|
|
|
|
|
Settlement Period |
|
Production Protected |
|
|
Strike price per ounce |
|
|
|
Silver (ounces in 000's) |
|
|
($) |
|
Contracts on forecasted sales |
|
|
|
|
|
|
2026 settlements |
|
|
9,672 |
|
|
|
50.00 |
|
At December 31, 2025 and 2024, we recorded the following balances for the fair value of derivative contracts held at that time (in millions):
|
|
|
|
|
|
|
|
|
|
|
|
|
|
|
|
|
|
|
|
|
|
|
|
|
|
|
December 31, 2025 |
|
|
December 31, 2024 |
|
Balance sheet line item: |
|
Contracts in an asset position |
|
|
Contracts in a liability position |
|
|
Net asset (liability) |
|
|
Contracts in an asset position |
|
|
Contracts in a liability position |
|
|
Net asset (liability) |
|
Other current assets |
|
$ |
8.6 |
|
|
$ |
— |
|
|
$ |
8.6 |
|
|
$ |
11.5 |
|
|
$ |
— |
|
|
$ |
11.5 |
|
Other non-current assets |
|
$ |
7.2 |
|
|
$ |
— |
|
|
$ |
7.2 |
|
|
$ |
6.6 |
|
|
$ |
— |
|
|
$ |
6.6 |
|
Current derivatives liability |
|
$ |
— |
|
|
$ |
(36.4 |
) |
|
$ |
(36.4 |
) |
|
$ |
— |
|
|
$ |
— |
|
|
$ |
— |
|
Net realized and unrealized gains of approximately $0.2 million related to the effective portion of the contracts designated as hedges were included in accumulated other comprehensive loss as of December 31, 2025. Realized and unrealized gains and losses will be transferred from accumulated other comprehensive loss to current earnings as the underlying forecasted sales transaction is recognized. We estimate approximately $1.1 million in net realized and unrealized gains included in accumulated other comprehensive loss as of December 31, 2025 will be reclassified to current earnings in the next twelve months. The realized gains arose due to cash settlement of zinc and lead contracts in 2023 and zinc contracts in 2022 prior to maturity for cash proceeds of $8.5 million and $17.4 million, respectively, which have now been fully recognized.
We recognized a net loss of $12.0 million (2024: $1.3 million net gain; 2023: $19.7 million net gain), including a $13.1 million gain transferred from accumulated other comprehensive income (loss) ("AOCI") (2024: $11.4 million gain transferred from AOCI; 2023: $20.6 million gain transferred from AOCI), during 2025 on the contracts utilized to manage exposure to prices of metals in our concentrate shipments, which is included in sales. The net gain recognized on the contracts offsets loss related to price adjustments on our provisional concentrate sales, both of which resulted from changes to silver, gold, lead and zinc prices between the time of sale and final settlement. The net losses and gains recognized on the contracts offset gains and losses related to price adjustments on our provisional concentrate sales due to changes to silver, gold, lead and zinc prices between the time of sale and final settlement.
Foreign Currency
We operate or have mining interests in Canada, which exposes us to risks associated with fluctuations in the exchange rates between the USD and CAD. We have determined the functional currency for our Canadian operations is the USD. As such, foreign exchange gains and losses associated with the re-measurement of monetary assets and liabilities from CAD to USD are recorded to earnings each period. For the year ended December 31, 2025, we recognized a net foreign exchange loss of $6.0 million. Foreign currency exchange rates are influenced by a number of factors beyond our control. A 10% change in the exchange rate between the USD and CAD from the rate at December 31, 2025 would have resulted in a change of approximately $3.9 million in our net foreign exchange gain or loss.
We utilize a program to manage our exposure to fluctuations in the exchange rate between the USD and CAD and the impact on our future operating costs denominated in CAD. In November 2021, we initiated a similar program related to future development costs denominated in CAD, and have used a similar program, on a limited basis, related to interest payments on our previously held IQ Notes (see Note 10 of Notes to Consolidated Financial Statements). The programs utilize forward contracts to buy CAD. Each contract related to operating costs is designated as a cash flow hedge, while contracts related to development and interest costs have not been designated
as hedges as of December 31, 2025. Our risk management policy allows for up to 75% of our planned cost exposure for five years into the future to be covered under such programs, and for potential additional programs to manage other foreign currency-related exposure areas. These instruments do, however, expose us to (i) credit risk in the form of non-performance by counterparties for contracts in which the contract exchange rate exceeds the spot exchange rate of a currency and (ii) exchange rate risk to the extent that the spot exchange rate exceeds the contract exchange rate for amounts of our operating costs covered under contract positions. As of December 31, 2025, we had a total of 165 forward contracts outstanding to buy a total of CAD $101.0 million having a notional amount of USD $73.1 million with CAD-to-USD exchange rates ranging between 1.3148 and 1.4202, with the following exposures in 2026:
•Forecasted cash operating costs at Keno Hill of CAD $59.5 million at an average CAD-to-USD exchange rate of 1.377.
•Forecasted capital expenditures at Keno Hill of CAD $37.5 million at an average CAD-to-USD exchange rate of 1.390.
•Forecasted exploration expenditures at Keno Hill of CAD $3.3 million at an average CAD-to-USD exchange rate of 1.383.
•Forecasted Corporate expenditures of CAD $1.3 million at an average CAD-to-USD exchange rate of 1.354.
As of December 31, 2025 and 2024, we recorded the following balances for the fair value of the contracts (in millions):
|
|
|
|
|
|
|
|
|
|
|
December 31, |
|
Balance sheet line item: |
|
2025 |
|
|
2024 |
|
Other current assets |
|
$ |
1.1 |
|
|
$ |
— |
|
Other non-current assets |
|
|
— |
|
|
|
— |
|
Current derivative liabilities |
|
|
(0.8 |
) |
|
|
(2.4 |
) |
Non-current derivative liabilities |
|
|
— |
|
|
|
(0.4 |
) |
Net unrealized losses of approximately $0.9 million related to the effective portion of the hedges were included in accumulated other comprehensive income (loss) as of December 31, 2025. Unrealized gains and losses will be transferred from accumulated other comprehensive loss to discontinued operations as the underlying operating expenses are recognized. We estimate approximately $0.9 million in net unrealized losses included in accumulated other comprehensive income (loss) as of December 31, 2025 would be reclassified to discontinued operations in the next twelve months.
Net realized losses of approximately $4.1 million (2024: $3.8 million loss; 2023: $3.6 million) on contracts related to underlying expenses which have been recognized were transferred from accumulated other comprehensive loss and included in discontinued operations for the year ended December 31, 2025. Net realized gains of approximately $4.8 million (2024: $5.7 million loss; 2023: $1.2 million gains) related to contracts not designated as hedges and no net unrealized gains or losses related to ineffectiveness of the hedges were included in fair value adjustments, net on our consolidated statements of operations and comprehensive (loss) income for the year ended December 31, 2025.
Interest Rates
We have a $225.0 million credit facility, and amounts drawn on the facility are subject to variable rates of interest based on a spread over the Term Secured Overnight Financing Rate ("SOFR") or an alternative base rate. Interest rates fluctuate due to economic factors beyond our control. As of December 31, 2025, we had no amounts drawn under the facility and $6.7 million for letters of credit. Assuming all revolving loans currently available to us were fully drawn, each one percentage point change in interest rates would result in a $2.2 million change in annual cash interest expense on our credit facility. See Note 10 of Notes to Consolidated Financial Statements for more information on our credit facility.
Item 8. Financial Statements and Supplementary Data
Our Consolidated Financial Statements are included herein beginning on page F-1. Financial statement schedules are omitted as they are not applicable or the information required in the schedule is already included in the Consolidated Financial Statements.
Index to Consolidated Financial Statements
Report of Independent Registered Public Accounting Firm
Shareholders and Board of Directors
Hecla Mining Company
Coeur d’Alene, Idaho
Opinion on the Consolidated Financial Statements
We have audited the accompanying consolidated balance sheets of Hecla Mining Company (the “Company”) as of December 31, 2025 and 2024, the related consolidated statements of operations and comprehensive income (loss), changes in stockholders’ equity, and cash flows for each of the three years in the period ended December 31, 2025, and the related notes (collectively referred to as the “consolidated financial statements”). In our opinion, the consolidated financial statements present fairly, in all material respects, the financial position of the Company at December 31, 2025 and 2024, and the results of its operations and its cash flows for each of the three years in the period ended December 31, 2025, in conformity with accounting principles generally accepted in the United States of America.
We also have audited, in accordance with the standards of the Public Company Accounting Oversight Board (United States) (PCAOB), the Company's internal control over financial reporting as of December 31, 2025, based on criteria established in Internal Control – Integrated Framework (2013) issued by the Committee of Sponsoring Organizations of the Treadway Commission (COSO) and our report dated February 17, 2026 (not presented herein) expressed an unqualified opinion thereon.
Basis for Opinion
These consolidated financial statements are the responsibility of the Company’s management. Our responsibility is to express an opinion on the Company’s consolidated financial statements based on our audits. We are a public accounting firm registered with the PCAOB and are required to be independent with respect to the Company in accordance with the U.S. federal securities laws and the applicable rules and regulations of the Securities and Exchange Commission and the PCAOB.
We conducted our audits in accordance with the standards of the PCAOB. Those standards require that we plan and perform the audit to obtain reasonable assurance about whether the consolidated financial statements are free of material misstatement, whether due to error or fraud.
Our audits included performing procedures to assess the risks of material misstatement of the consolidated financial statements, whether due to error or fraud, and performing procedures that respond to those risks. Such procedures included examining, on a test basis, evidence regarding the amounts and disclosures in the consolidated financial statements. Our audits also included evaluating the accounting principles used and significant estimates made by management, as well as evaluating the overall presentation of the consolidated financial statements. We believe that our audits provide a reasonable basis for our opinion.
Critical Audit Matter
The critical audit matter communicated below is a matter arising from the current period audit of the consolidated financial statements that was communicated or required to be communicated to the audit committee and that: (1) relates to accounts or disclosures that are material to the consolidated financial statements and (2) involved our especially challenging, subjective, or complex judgments. The communication of the critical audit matter does not alter in any way our opinion on the consolidated financial statements, taken as a whole, and we are not, by communicating the critical audit matter below, providing a separate opinion on the critical audit matter or on the accounts or disclosures to which it relates.
Revenue Recognition of Concentrate Sales – Greens Creek, Lucky Friday and Keno Hill
The Company’s consolidated concentrate revenue balance was $1.046 billion for the year ended December 31, 2025. As described in Note 4 to the Company’s consolidated financial statements, sales of all metals products sold directly to customers are recorded as revenues upon completion of the performance obligations and transfer of control of the product to the customer. For concentrate sales, the performance obligation is met, the transaction price can be reasonably estimated, and revenue is recognized generally at the time of shipment at estimated forward prices for the anticipated month of settlement. The amount of consideration for concentrate sales is variable due to changes in metal prices and final agreed upon concentrate content specifications between the time of shipment and final settlement.
We identified revenue recognition of concentrate sales, specific to Greens Creek, Lucky Friday and Keno Hill as a critical audit matter. Management applies judgement in estimating the value of variable consideration for concentrate sales, including assessing for changes in metals prices and concentrate content specifications between the time of shipment and final settlement. Auditing these judgements
and estimates involved especially challenging and subjective auditor judgement due to the nature and extent of audit effort required to address the matter.
The primary procedures we performed to address this critical audit matter included:
•Assessing the reasonableness of management’s estimate for changes in metal prices between the time of shipment and final settlement with the customer by comparing to the published forward metals pricing for the contracted quotational period of the customer contract.
•Assessing the reasonableness of management’s estimate for concentrate content specifications between the time of shipment and final settlement with the customer at year-end by obtaining final settlement documentation or performing substantive analytical procedures by developing expectations using reliable internal data and comparing recorded amounts to those expectations.
/s/ BDO USA, P.C.
We have served as the Company's auditor since 2001.
Spokane, Washington
February 17, 2026, except for the effects of discontinued operations discussed in Note 3 and the effects of the reclassifications discussed in Note 2 for which the date is August 28, 2026
Hecla Mining Company and Subsidiaries
Consolidated Statements of Operations and Comprehensive Income (Loss)
(Dollars and shares in thousands, except per share amounts)
|
|
|
|
|
|
|
|
|
|
|
|
|
|
|
Year Ended December 31, |
|
|
|
2025 |
|
|
2024 |
|
|
2023 |
|
|
|
|
|
|
|
|
|
|
|
Sales |
|
$ |
1,103,902 |
|
|
$ |
720,246 |
|
|
$ |
542,549 |
|
COSTS AND EXPENSES |
|
|
|
|
|
|
|
|
|
Costs applicable to sales (1) |
|
|
467,313 |
|
|
|
419,976 |
|
|
|
331,042 |
|
Costs applicable to sales - temporarily suspended operations (1) |
|
|
— |
|
|
|
1,583 |
|
|
|
20,489 |
|
Depreciation, depletion and amortization |
|
|
126,784 |
|
|
|
115,503 |
|
|
|
89,747 |
|
General and administrative |
|
|
57,626 |
|
|
|
45,405 |
|
|
|
40,638 |
|
Exploration and pre-development |
|
|
27,352 |
|
|
|
25,458 |
|
|
|
26,827 |
|
Care and maintenance |
|
|
14,005 |
|
|
|
14,346 |
|
|
|
18,683 |
|
Provision for closed operations and environmental matters |
|
|
7,867 |
|
|
|
6,843 |
|
|
|
7,575 |
|
Write down of property, plant and equipment |
|
|
— |
|
|
|
14,574 |
|
|
|
— |
|
Other operating expense (income), net |
|
|
6,546 |
|
|
|
(47,204 |
) |
|
|
(4,461 |
) |
Total costs and expenses |
|
|
707,493 |
|
|
|
596,484 |
|
|
|
530,540 |
|
Income from operations |
|
|
396,409 |
|
|
|
123,762 |
|
|
|
12,009 |
|
Other expense: |
|
|
|
|
|
|
|
|
|
Fair value adjustments, net |
|
|
8,332 |
|
|
|
3,541 |
|
|
|
1,735 |
|
Foreign exchange (loss) gain, net |
|
|
(6,019 |
) |
|
|
8,063 |
|
|
|
(4,145 |
) |
Other (expense) income, net |
|
|
(930 |
) |
|
|
4,169 |
|
|
|
5,465 |
|
Interest expense |
|
|
(40,991 |
) |
|
|
(49,331 |
) |
|
|
(43,065 |
) |
Total other expense: |
|
|
(39,608 |
) |
|
|
(33,558 |
) |
|
|
(40,010 |
) |
Income (loss) before income and mining taxes |
|
|
356,801 |
|
|
|
90,204 |
|
|
|
(28,001 |
) |
Income and mining tax provision |
|
|
(98,742 |
) |
|
|
(39,969 |
) |
|
|
(12,246 |
) |
Income (loss) from continuing operations |
|
|
258,059 |
|
|
|
50,235 |
|
|
|
(40,247 |
) |
Income (loss) from discontinued operations, net of income and mining taxes |
|
|
63,653 |
|
|
|
(14,433 |
) |
|
|
(43,970 |
) |
Net income |
|
|
321,712 |
|
|
|
35,802 |
|
|
|
(84,217 |
) |
Preferred stock dividends |
|
|
(552 |
) |
|
|
(552 |
) |
|
|
(552 |
) |
Net income (loss) applicable to common stockholders |
|
$ |
321,160 |
|
|
$ |
35,250 |
|
|
$ |
(84,769 |
) |
|
|
|
|
|
|
|
|
|
|
Comprehensive income (loss): |
|
|
|
|
|
|
|
|
|
Income (loss) from continuing operations |
|
$ |
258,059 |
|
|
$ |
50,235 |
|
|
$ |
(40,247 |
) |
Other comprehensive (loss) income, net of tax: |
|
|
|
|
|
|
|
|
|
Unrealized gain (loss) and amortization of prior service on pension plans |
|
|
11,421 |
|
|
|
(8,389 |
) |
|
|
(1,157 |
) |
Unrealized (loss) gain on derivative contracts designated as hedge transactions |
|
|
(4,489 |
) |
|
|
(7,714 |
) |
|
|
4,546 |
|
Total change in accumulated other comprehensive income (loss), net |
|
$ |
6,932 |
|
|
$ |
(16,103 |
) |
|
$ |
3,389 |
|
Comprehensive income (loss) from continuing operations |
|
|
264,991 |
|
|
|
34,132 |
|
|
|
(36,858 |
) |
Comprehensive income (loss) from discontinued operations |
|
|
63,653 |
|
|
|
(14,433 |
) |
|
|
(43,970 |
) |
Comprehensive income (loss) |
|
$ |
328,644 |
|
|
$ |
19,699 |
|
|
$ |
(80,828 |
) |
|
|
|
|
|
|
|
|
|
|
Net income per common share |
|
|
|
|
|
|
|
|
|
Basic and Diluted: |
|
|
|
|
|
|
|
|
|
Continuing operations |
|
$ |
0.39 |
|
|
$ |
0.08 |
|
|
$ |
(0.07 |
) |
Discontinued operations |
|
|
0.10 |
|
|
|
(0.02 |
) |
|
|
(0.07 |
) |
Basic and diluted net income (loss) per common share after preferred dividends |
|
$ |
0.49 |
|
|
$ |
0.06 |
|
|
$ |
(0.14 |
) |
|
|
|
|
|
|
|
|
|
|
Weighted average number of common shares outstanding – basic |
|
|
651,965 |
|
|
|
620,848 |
|
|
|
605,668 |
|
Weighted average number of common shares outstanding – diluted |
|
|
655,768 |
|
|
|
622,535 |
|
|
|
605,668 |
|
(1) Excludes depreciation, depletion and amortization
The accompanying notes are an integral part of the consolidated financial statements.
Hecla Mining Company and Subsidiaries
Consolidated Statements of Cash Flows
(In thousands)
|
|
|
|
|
|
|
|
|
|
|
|
|
|
|
Year Ended December 31, |
|
|
|
2025 |
|
|
2024 |
|
|
2023 |
|
|
|
|
|
|
|
|
|
|
|
Operating activities: |
|
|
|
|
|
|
|
|
|
Net income (loss) |
|
$ |
321,712 |
|
|
$ |
35,802 |
|
|
$ |
(84,217 |
) |
Less: Income (loss) from discontinued operations, net of taxes |
|
|
63,653 |
|
|
|
(14,433 |
) |
|
|
(43,970 |
) |
Income (loss) from continuing operations |
|
$ |
258,059 |
|
|
$ |
50,235 |
|
|
$ |
(40,247 |
) |
Non-cash elements included in net income (loss): |
|
|
|
|
|
|
|
|
|
Depreciation, depletion and amortization |
|
|
132,337 |
|
|
|
117,636 |
|
|
|
97,635 |
|
Fair value adjustments, net |
|
|
(8,332 |
) |
|
|
(3,541 |
) |
|
|
(1,735 |
) |
Inventory adjustments |
|
|
13,012 |
|
|
|
5,383 |
|
|
|
8,082 |
|
Provision for reclamation and closure costs |
|
|
10,352 |
|
|
|
8,547 |
|
|
|
8,787 |
|
Deferred income taxes |
|
|
80,001 |
|
|
|
33,211 |
|
|
|
8,400 |
|
Stock-based compensation |
|
|
10,918 |
|
|
|
8,659 |
|
|
|
6,598 |
|
Foreign exchange (gain) loss |
|
|
6,019 |
|
|
|
(8,063 |
) |
|
|
4,145 |
|
Write-down of property, plant and equipment |
|
|
— |
|
|
|
14,574 |
|
|
|
— |
|
Other non-cash items, net |
|
|
10,005 |
|
|
|
(2,548 |
) |
|
|
(1,729 |
) |
Changes in assets and liabilities: |
|
|
|
|
|
|
|
|
|
Accounts receivable |
|
|
(138,175 |
) |
|
|
(18,331 |
) |
|
|
26,561 |
|
Inventories |
|
|
(21,245 |
) |
|
|
(23,654 |
) |
|
|
(10,425 |
) |
Other current and non-current assets |
|
|
24,774 |
|
|
|
(7,414 |
) |
|
|
(30,840 |
) |
Accounts payable, accrued and other current liabilities |
|
|
108 |
|
|
|
(6,697 |
) |
|
|
6,974 |
|
Accrued payroll and related benefits |
|
|
20,724 |
|
|
|
9,101 |
|
|
|
(3,948 |
) |
Accrued taxes |
|
|
12,112 |
|
|
|
2,817 |
|
|
|
(255 |
) |
Accrued reclamation and closure costs and other non-current liabilities |
|
|
(7,230 |
) |
|
|
(12,571 |
) |
|
|
(2,582 |
) |
Cash provided by operating activities of continuing operations |
|
|
403,439 |
|
|
|
167,344 |
|
|
|
75,421 |
|
Cash provided by operating activities of discontinued operations |
|
|
159,199 |
|
|
|
50,933 |
|
|
|
78 |
|
Net cash provided by operating activities |
|
|
562,638 |
|
|
|
218,277 |
|
|
|
75,499 |
|
Investing activities: |
|
|
|
|
|
|
|
|
|
Additions to property, plant and equipment and mine development |
|
|
(190,875 |
) |
|
|
(153,788 |
) |
|
|
(153,831 |
) |
Proceeds from disposition of assets |
|
|
734 |
|
|
|
1,694 |
|
|
|
1,329 |
|
Acquisition, net |
|
|
— |
|
|
|
— |
|
|
|
228 |
|
Proceeds from sale or exchange of investments |
|
|
28,087 |
|
|
|
— |
|
|
|
— |
|
Purchase of silver puts |
|
|
(25,000 |
) |
|
|
— |
|
|
|
— |
|
Purchases of investments |
|
|
(21,932 |
) |
|
|
(73 |
) |
|
|
(8,962 |
) |
Cash used in investing activities of continuing operations |
|
|
(208,986 |
) |
|
|
(152,167 |
) |
|
|
(161,236 |
) |
Cash used in investing activities of discontinued operations |
|
|
(61,514 |
) |
|
|
(60,704 |
) |
|
|
(70,056 |
) |
Net cash used in investing activities |
|
|
(270,500 |
) |
|
|
(212,871 |
) |
|
|
(231,292 |
) |
Financing activities: |
|
|
|
|
|
|
|
|
|
Proceeds from issuance of common stock, net of offering costs |
|
|
216,225 |
|
|
|
58,368 |
|
|
|
56,684 |
|
Dividends paid to common and preferred stockholders |
|
|
(10,375 |
) |
|
|
(25,331 |
) |
|
|
(15,713 |
) |
Acquisition of treasury shares from employee equity awards |
|
|
(885 |
) |
|
|
(1,197 |
) |
|
|
(2,036 |
) |
Borrowings of debt |
|
|
153,000 |
|
|
|
279,000 |
|
|
|
239,000 |
|
Repayments of debt |
|
|
(427,245 |
) |
|
|
(384,000 |
) |
|
|
(111,000 |
) |
Repayments of finance leases and other |
|
|
(6,690 |
) |
|
|
(9,182 |
) |
|
|
(9,864 |
) |
Cash (used in) provided by financing activities of continuing operations |
|
|
(75,970 |
) |
|
|
(82,342 |
) |
|
|
157,071 |
|
Cash used by financing activities of discontinued operations |
|
|
(2,025 |
) |
|
|
(1,482 |
) |
|
|
(741 |
) |
Net cash (used in) provided by financing activities |
|
|
(77,995 |
) |
|
|
(83,824 |
) |
|
|
156,330 |
|
Effect of exchange rates on cash |
|
|
544 |
|
|
|
(1,076 |
) |
|
|
1,095 |
|
Net increase (decrease) in cash and cash equivalents and restricted cash and cash equivalents |
|
|
214,687 |
|
|
|
(79,494 |
) |
|
|
1,632 |
|
Cash and cash equivalents and restricted cash and cash equivalents at beginning of year |
|
|
28,045 |
|
|
|
107,539 |
|
|
|
105,907 |
|
Cash and cash equivalents and restricted cash and cash equivalents at end of year |
|
$ |
242,732 |
|
|
$ |
28,045 |
|
|
$ |
107,539 |
|
Reconciliation of cash and cash equivalents and restricted cash and cash equivalents above to where reported on the consolidated balance sheet |
|
|
|
|
|
|
|
|
|
Cash and cash equivalents |
|
$ |
241,558 |
|
|
$ |
26,868 |
|
|
$ |
106,374 |
|
Non-current restricted cash and cash equivalents |
|
|
1,174 |
|
|
|
1,177 |
|
|
|
1,165 |
|
Total cash and cash equivalents and restricted cash and cash equivalents as reported on the consolidated statements of cash flows |
|
$ |
242,732 |
|
|
$ |
28,045 |
|
|
$ |
107,539 |
|
Supplemental disclosure of cash flow information: |
|
|
|
|
|
|
|
|
|
Cash paid during year for: |
|
|
|
|
|
|
|
|
|
Interest |
|
$ |
44,462 |
|
|
$ |
45,558 |
|
|
$ |
37,490 |
|
Income and mining taxes, net of refunds |
|
$ |
6,466 |
|
|
$ |
3,965 |
|
|
$ |
3,447 |
|
|
|
|
|
|
|
|
|
|
|
|
|
|
Non-cash investing and financing activities: |
|
|
|
|
|
|
|
|
|
Addition of finance lease obligations and right-of-use assets |
|
$ |
630 |
|
|
$ |
5,605 |
|
|
$ |
16,116 |
|
Recognition of operating lease liabilities and right-of-use assets |
|
$ |
1,382 |
|
|
$ |
— |
|
|
$ |
203 |
|
Properties, plants, equipment and mine development additions in accounts payable and accrued liabilities |
|
$ |
4,559 |
|
|
$ |
1,975 |
|
|
$ |
— |
|
Common stock contributed to pension plans |
|
$ |
— |
|
|
$ |
— |
|
|
$ |
1,035 |
|
Common stock issued as incentive compensation |
|
$ |
2,503 |
|
|
$ |
6,588 |
|
|
$ |
— |
|
Common stock issued to directors |
|
$ |
1,034 |
|
|
$ |
796 |
|
|
$ |
676 |
|
Common stock issued to interim CEO |
|
$ |
— |
|
|
$ |
283 |
|
|
$ |
— |
|
Common stock issued for 401(k) match |
|
$ |
5,052 |
|
|
$ |
4,763 |
|
|
$ |
4,608 |
|
Common stock issued for warrant exercises |
|
$ |
— |
|
|
$ |
372 |
|
|
$ |
— |
|
Common stock issued to ATAC Resources Ltd. stockholders |
|
$ |
— |
|
|
$ |
— |
|
|
$ |
18,789 |
|
The accompanying notes are an integral part of the consolidated financial statements.
Hecla Mining Company and Subsidiaries
Consolidated Balance Sheets
(In thousands, except share and per share data)
|
|
|
|
|
|
|
|
|
|
|
December 31, |
|
|
|
2025 |
|
|
2024 |
|
|
|
|
|
|
|
|
ASSETS |
|
|
|
|
|
|
Current assets: |
|
|
|
|
|
|
Cash and cash equivalents |
|
$ |
241,558 |
|
|
$ |
26,868 |
|
Accounts receivable: |
|
|
|
|
|
|
Trade |
|
|
170,230 |
|
|
|
31,515 |
|
Other, net |
|
|
12,019 |
|
|
|
11,107 |
|
Inventories: |
|
|
|
|
|
|
Product inventories |
|
|
26,518 |
|
|
|
21,230 |
|
Materials and supplies |
|
|
55,169 |
|
|
|
50,105 |
|
Current investments |
|
|
59,644 |
|
|
|
— |
|
Other current assets |
|
|
23,421 |
|
|
|
24,558 |
|
Assets of discontinued operations |
|
|
40,785 |
|
|
|
48,769 |
|
Total current assets |
|
|
629,344 |
|
|
|
214,152 |
|
Non-current investments |
|
|
47,842 |
|
|
|
33,897 |
|
Restricted cash and cash equivalents |
|
|
1,174 |
|
|
|
1,177 |
|
Properties, plants, equipment and mine development, net |
|
|
2,130,581 |
|
|
|
2,066,422 |
|
Operating lease right-of-use assets |
|
|
8,859 |
|
|
|
7,544 |
|
Other non-current assets |
|
|
31,901 |
|
|
|
29,361 |
|
Assets of discontinued operations |
|
|
710,944 |
|
|
|
628,507 |
|
Total assets |
|
$ |
3,560,645 |
|
|
$ |
2,981,060 |
|
LIABILITIES |
|
|
|
|
|
|
Current liabilities: |
|
|
|
|
|
|
Accounts payable and accrued liabilities |
|
$ |
77,592 |
|
|
$ |
62,503 |
|
Accrued payroll and related benefits |
|
|
30,228 |
|
|
|
16,591 |
|
Accrued taxes |
|
|
18,544 |
|
|
|
6,312 |
|
Current debt |
|
|
— |
|
|
|
33,617 |
|
Finance leases |
|
|
4,262 |
|
|
|
5,510 |
|
Accrued reclamation and closure costs |
|
|
13,795 |
|
|
|
13,748 |
|
Accrued interest |
|
|
7,678 |
|
|
|
14,316 |
|
Derivative liabilities |
|
|
37,181 |
|
|
|
2,368 |
|
Other current liabilities |
|
|
1,926 |
|
|
|
1,730 |
|
Liabilities of discontinued operations |
|
|
40,358 |
|
|
|
41,143 |
|
Total current liabilities |
|
|
231,564 |
|
|
|
197,838 |
|
Accrued reclamation and closure costs |
|
|
112,491 |
|
|
|
94,157 |
|
Long-term debt including finance leases |
|
|
263,171 |
|
|
|
501,195 |
|
Deferred tax liability |
|
|
157,585 |
|
|
|
60,073 |
|
Other non-current liabilities |
|
|
33,912 |
|
|
|
11,793 |
|
Liabilities of discontinued operations |
|
|
170,276 |
|
|
|
76,490 |
|
Total liabilities |
|
|
968,999 |
|
|
|
941,546 |
|
Commitments and contingencies (Notes 6, 7, 10, 11, and 17) |
|
|
|
|
|
|
STOCKHOLDERS’ EQUITY |
|
|
|
|
|
|
|
|
|
|
|
|
|
Preferred stock, 5,000,000 shares authorized: |
|
|
|
|
|
|
Series B preferred stock, $0.25 par value, 2025 - 153,956 shares issued and outstanding and 2024 - 157,756 shares, liquidation preference — $7,698 |
|
|
39 |
|
|
|
39 |
|
Common stock, $0.25 par value, authorized 1,250,000,000 shares; issued 2025 — 679,220,408
shares and 2024 — 640,547,918 shares |
|
|
169,689 |
|
|
|
160,052 |
|
Capital surplus |
|
|
2,643,211 |
|
|
|
2,418,149 |
|
Accumulated deficit |
|
|
(182,143 |
) |
|
|
(493,529 |
) |
Accumulated other comprehensive loss, net |
|
|
(3,334 |
) |
|
|
(10,266 |
) |
Less treasury stock, at cost; 2025 — 8,920,348 and 2024 — 8,813,127 shares issued and held in treasury |
|
|
(35,816 |
) |
|
|
(34,931 |
) |
Total stockholders’ equity |
|
|
2,591,646 |
|
|
|
2,039,514 |
|
Total liabilities and stockholders’ equity |
|
$ |
3,560,645 |
|
|
$ |
2,981,060 |
|
The accompanying notes are an integral part of the consolidated financial statements.
Hecla Mining Company and Subsidiaries
Consolidated Statements of Changes in Stockholders’ Equity
For the Years Ended December 31, 2025, 2024 and 2023
(Dollars in thousands)
|
|
|
|
|
|
|
|
|
|
|
|
|
|
|
|
|
|
|
|
|
|
|
|
|
|
|
|
|
|
|
Series B
Preferred
Stock |
|
|
Common
Stock |
|
|
Capital
Surplus |
|
|
Accumulated
Deficit |
|
|
Accumulated
Other
Comprehensive Income
(Loss), net |
|
|
Treasury
Stock |
|
|
Total |
|
|
|
|
|
|
|
|
|
|
|
|
|
|
|
|
|
|
|
|
|
|
|
Balances, January 1, 2023 |
|
|
39 |
|
|
|
151,819 |
|
|
|
2,260,290 |
|
|
|
(403,931 |
) |
|
|
2,448 |
|
|
|
(31,698 |
) |
|
|
1,978,967 |
|
Net loss |
|
|
— |
|
|
|
— |
|
|
|
— |
|
|
|
(84,217 |
) |
|
|
— |
|
|
|
— |
|
|
|
(84,217 |
) |
Common stock issued to directors (125,063 shares) |
|
|
— |
|
|
|
31 |
|
|
|
645 |
|
|
|
— |
|
|
|
— |
|
|
|
— |
|
|
|
676 |
|
Common stock issued for 401(k) match (898,894 shares) |
|
|
— |
|
|
|
225 |
|
|
|
4,383 |
|
|
|
— |
|
|
|
— |
|
|
|
— |
|
|
|
4,608 |
|
Stock-based compensation expense |
|
|
— |
|
|
|
— |
|
|
|
5,922 |
|
|
|
— |
|
|
|
— |
|
|
|
— |
|
|
|
5,922 |
|
Incentive compensation distributed (1,432,323 shares) |
|
|
— |
|
|
|
359 |
|
|
|
(359 |
) |
|
|
— |
|
|
|
— |
|
|
|
(2,036 |
) |
|
|
(2,036 |
) |
Common stock ($0.0375 per share) and Series B Preferred stock ($3.50 per share) dividends declared |
|
|
— |
|
|
|
— |
|
|
|
— |
|
|
|
(15,713 |
) |
|
|
— |
|
|
|
— |
|
|
|
(15,713 |
) |
Common stock issued to pension plans (249,500 shares) |
|
|
— |
|
|
|
62 |
|
|
|
973 |
|
|
|
— |
|
|
|
— |
|
|
|
— |
|
|
|
1,035 |
|
Common stock issued to ATAC Resources Ltd. shareholders (3,676,904 shares) |
|
|
— |
|
|
|
919 |
|
|
|
17,870 |
|
|
|
— |
|
|
|
— |
|
|
|
— |
|
|
|
18,789 |
|
Common stock issued under ATM program (10,645,198 shares) |
|
|
— |
|
|
|
2,661 |
|
|
|
54,023 |
|
|
|
— |
|
|
|
— |
|
|
|
— |
|
|
|
56,684 |
|
Other comprehensive income |
|
|
— |
|
|
|
— |
|
|
|
— |
|
|
|
— |
|
|
|
3,389 |
|
|
|
— |
|
|
|
3,389 |
|
Balances, December 31, 2023 |
|
|
39 |
|
|
|
156,076 |
|
|
|
2,343,747 |
|
|
|
(503,861 |
) |
|
|
5,837 |
|
|
|
(33,734 |
) |
|
|
1,968,104 |
|
Net income |
|
|
— |
|
|
|
— |
|
|
|
— |
|
|
|
35,802 |
|
|
|
— |
|
|
|
— |
|
|
|
35,802 |
|
Common stock issued as compensation to interim CEO (48,489 shares) |
|
|
— |
|
|
|
12 |
|
|
|
271 |
|
|
|
— |
|
|
|
— |
|
|
|
— |
|
|
|
283 |
|
Common stock issued to directors (150,387 shares) |
|
|
— |
|
|
|
38 |
|
|
|
758 |
|
|
|
— |
|
|
|
— |
|
|
|
— |
|
|
|
796 |
|
Common stock issued for 401(k) match (940,392 shares) |
|
|
— |
|
|
|
235 |
|
|
|
4,528 |
|
|
|
— |
|
|
|
— |
|
|
|
— |
|
|
|
4,763 |
|
Common stock issued for warrant exercises (1,488,050 shares) |
|
|
— |
|
|
|
372 |
|
|
|
(372 |
) |
|
|
— |
|
|
|
— |
|
|
|
— |
|
|
|
— |
|
Stock-based compensation expense |
|
|
— |
|
|
|
— |
|
|
|
7,580 |
|
|
|
— |
|
|
|
— |
|
|
|
— |
|
|
|
7,580 |
|
Incentive compensation distributed (3,933,870 shares) |
|
|
— |
|
|
|
984 |
|
|
|
5,604 |
|
|
|
— |
|
|
|
— |
|
|
|
(1,197 |
) |
|
|
5,391 |
|
Common stock ($0.04 per share) and Series B Preferred stock ($3.50 per share) dividends declared |
|
|
— |
|
|
|
— |
|
|
|
— |
|
|
|
(25,470 |
) |
|
|
— |
|
|
|
— |
|
|
|
(25,470 |
) |
Common stock issued under ATM program (9,339,287 shares) |
|
|
— |
|
|
|
2,335 |
|
|
|
56,033 |
|
|
|
— |
|
|
|
— |
|
|
|
— |
|
|
|
58,368 |
|
Common stock issued upon conversion of 20 Series B Preferred stock (64 shares) |
|
|
— |
|
|
|
— |
|
|
|
— |
|
|
|
— |
|
|
|
— |
|
|
|
— |
|
|
|
— |
|
Other comprehensive loss |
|
|
— |
|
|
|
— |
|
|
|
— |
|
|
|
— |
|
|
|
(16,103 |
) |
|
|
|
|
|
(16,103 |
) |
Balances, December 31, 2024 |
|
$ |
39 |
|
|
$ |
160,052 |
|
|
$ |
2,418,149 |
|
|
$ |
(493,529 |
) |
|
$ |
(10,266 |
) |
|
$ |
(34,931 |
) |
|
$ |
2,039,514 |
|
Net income |
|
|
— |
|
|
|
— |
|
|
|
— |
|
|
|
321,712 |
|
|
|
— |
|
|
|
— |
|
|
|
321,712 |
|
Common stock issued to directors (179,836 shares) |
|
|
— |
|
|
|
41 |
|
|
|
993 |
|
|
|
— |
|
|
|
— |
|
|
|
— |
|
|
|
1,034 |
|
Common stock issued for 401(k) match (894,784 shares) |
|
|
— |
|
|
|
198 |
|
|
|
4,854 |
|
|
|
— |
|
|
|
— |
|
|
|
— |
|
|
|
5,052 |
|
Stock-based compensation expense |
|
|
|
|
|
— |
|
|
|
9,884 |
|
|
|
— |
|
|
|
— |
|
|
|
— |
|
|
|
9,884 |
|
Incentive compensation distributed (1,637,151 shares) |
|
|
— |
|
|
|
406 |
|
|
|
2,097 |
|
|
|
— |
|
|
|
— |
|
|
|
(885 |
) |
|
|
1,618 |
|
Common stock ($0.015 per share) and Series B Preferred stock ($3.50 per share) dividends declared |
|
|
— |
|
|
|
— |
|
|
|
— |
|
|
|
(10,326 |
) |
|
|
— |
|
|
|
— |
|
|
|
(10,326 |
) |
Common stock issued under ATM program (35,959,328 shares), net of offering costs |
|
|
— |
|
|
|
8,990 |
|
|
|
207,235 |
|
|
|
— |
|
|
|
— |
|
|
|
— |
|
|
|
216,225 |
|
Common stock issued upon conversion of 3,541 Series B Preferred stock (11,385 shares) |
|
|
— |
|
|
|
2 |
|
|
|
(1 |
) |
|
|
— |
|
|
|
— |
|
|
|
— |
|
|
|
1 |
|
Other comprehensive income |
|
|
— |
|
|
|
— |
|
|
|
— |
|
|
|
— |
|
|
|
6,932 |
|
|
|
— |
|
|
|
6,932 |
|
Balances, December 31, 2025 |
|
$ |
39 |
|
|
$ |
169,689 |
|
|
$ |
2,643,211 |
|
|
$ |
(182,143 |
) |
|
$ |
(3,334 |
) |
|
$ |
(35,816 |
) |
|
$ |
2,591,646 |
|
The accompanying notes are an integral part of the consolidated financial statements.
Hecla Mining Company and Subsidiaries
Notes to Consolidated Financial Statements
Note 1: The Company
Hecla Mining Company, and its affiliates and subsidiaries (collectively, “Hecla,” “we,” “us” or “the Company”), is the largest silver producer in the United States and Canada. In addition to operating mines in Alaska, Idaho and Quebec, Canada, the Company is developing a mine in the Yukon, Canada, and owns a number of exploration and pre-development projects in world-class silver and gold mining districts throughout North America. Our current holding company structure dates from the incorporation of Hecla Mining Company in 2006 and the renaming of our subsidiary (previously Hecla Mining Company) as Hecla Limited. Hecla Limited was incorporated on October 14, 1891 as an Idaho Corporation in northern Idaho’s Silver Valley. We believe we are the oldest operating precious metals mining company in the United States and the largest silver producer in the United States and Canada. Our corporate offices are in Coeur d’Alene, Idaho and Vancouver, British Columbia. The cash flow and profitability of the Company’s operations are significantly affected by the market price of silver, gold, lead and zinc, which are affected by numerous factors beyond our control.
References to “CAD” and “MXN” refer to the Canadian Dollar and Mexican Peso, respectively.
Sale of Casa Berardi
On January 26, 2026, following completion of a strategic review of Casa Berardi, we announced that we entered into a material definitive agreement to sell our wholly-owned subsidiary Hecla Quebec Inc., which owns the Casa Berardi operation to Orezone Gold Corporation (“Orezone”). The transaction closed on March 25, 2026. See Note 3: Sale of Hecla Quebec Inc. and Discontinued Operations for additional information.
Note 2: Summary of Significant Accounting Policies
A. Principles of Consolidation, Basis of Presentation and Other Information — Our Consolidated Financial Statements have been prepared in accordance with GAAP, and include our accounts and our wholly-owned subsidiaries’ accounts. All inter-company balances and transactions have been eliminated in consolidation.
B. Assumptions and Use of Estimates — Preparing financial statements requires management to make estimates and assumptions that affect the reported amounts and related disclosure of assets, liabilities, revenue and expenses at the date of the consolidated financial statements and reporting periods. We consider our most significant accounting estimates to be future metals prices; obligations for environmental, reclamation and closure matters and mineral reserves and resources. Other significant areas requiring the use of management assumptions and estimates relate to reserves for contingencies and litigation; asset impairments, including long-lived assets; valuation of deferred tax assets; and post-employment, post-retirement and other employee benefit assets and liabilities. We have based our estimates on historical experience and various other assumptions that we believe to be reasonable. Accordingly, actual results may differ materially from these estimates under different assumptions or conditions.
C. Cash and Cash Equivalents — Cash and cash equivalents consist of all cash balances and highly liquid investments with a remaining maturity of three months or less when purchased and are carried at fair value. Cash and cash equivalents are invested in money market funds, certificates of deposit, U.S. government and federal agency securities, municipal securities and corporate bonds. At certain times, amounts on deposit may exceed federal deposit insurance limits.
D. Investments — We determine the appropriate classification of our investments at the time of purchase and re-evaluate such determinations at each reporting date. Currently all our investments are marketable equity securities and are carried at fair value. Marketable securities we anticipate selling within the next twelve months are included in other current assets. Gains and losses on the sale of securities are recognized on a specific identification basis. Gains and losses of marketable securities and investments accounted for under the equity method are included as a component of a separate line item, “fair value adjustments, net,” and "Other income", respectively, both of which are included on our consolidated statements of operations and comprehensive income (loss).
E. Inventories — Major types of inventories include materials and supplies and metals product inventory, which is determined by the stage at which the ore is in the production process (stockpiled ore, in-process and finished goods). Product inventories are stated at the lower of full cost of production or estimated net realizable value based on current metals prices. Materials and supplies inventories are stated at average cost.
Stockpiled ore inventory represents ore that has been mined, hauled to the surface, and is available for further processing. Stockpiles are measured by estimating the number of tons added and removed from the stockpile, the amount of contained metal ounces or pounds (based on assay data) and the estimated metallurgical recovery rates (based on the expected processing method). Costs are allocated to a stockpile based on relative values of material stockpiled and processed using current mining costs incurred up to the point
of stockpiling the ore, including applicable overhead, depreciation, depletion and amortization relating to mining operations, and removed at each stockpile’s average cost per recoverable unit.
In-process inventory represents material that is currently in the process of being converted to a saleable product. Conversion processes vary depending on the nature of the ore and the specific processing facility, but include mill in-circuit, flotation, and carbon-in-leach. In-process material is measured based on assays of the material fed into the process and the projected recoveries of the respective processing plants. In-process inventory is valued at the lower of the average cost of the material fed into the process attributable to the source material coming from the mine and stockpile plus the in-process conversion costs, including applicable depreciation, depletion and amortization relating to the process facilities incurred to that point in the process, or net realizable value.
Finished goods inventory includes doré and concentrates at our operations, doré in transit to refiners or at refiners waiting to be processed, and bullion in our accounts at refineries.
F. Restricted Cash and Cash Equivalents — Restricted cash and cash equivalents primarily represent investments in certificates of deposit and bonds of U.S. government agencies and are restricted primarily for reclamation funding or surety bonds. Restricted cash and cash equivalents balances are carried at fair value. Non-current restricted cash and cash equivalents is reported in a separate line on the consolidated balance sheets and totaled $1.2 million at December 31, 2025 and 2024, respectively.
G. Properties, Plants, Equipment and Mine Development – Costs are capitalized when it has been determined an ore body can be economically developed pursuant to certain internal investment criteria. The development stage begins at new projects when our management and/or Board of Directors makes the decision to bring a mine into commercial production, and ends when the production stage, or exploitation of reserves, begins. Expenditures incurred during the development and production stages for new assets, new facilities, alterations to existing facilities that extend the useful lives of those facilities, and major mine development expenditures are capitalized, including primary development costs such as costs of building access ways, shaft sinking, lateral development, drift development, ramps and infrastructure developments. Costs to improve, alter, or rehabilitate primary development assets which appreciably extend the life, increase capacity, or improve the efficiency or safety of such assets are also capitalized.
The costs of removing overburden and waste materials to access the ore body at an open-pit mine prior to the production stage are referred to as “pre-stripping costs.” Pre-stripping costs are capitalized during the development stage. Where multiple open pits exist at an operation utilizing common facilities, pre-stripping costs are capitalized at each pit. The production stage of a mine commences when saleable materials, beyond a de minimis amount, are produced. Stripping costs incurred during the production stage are treated as variable production costs included as a component of inventory, to be recognized in costs applicable to sales in the same period as the revenue from the sale of inventory. When stripping costs incurred during the production phase result in the construction of an asset with an alternative use, such as a tailings storage facility, a portion of those stripping costs are capitalized.
Costs for exploration, pre-development, secondary development at operating mines, including drilling costs related to those activities (discussed further below), and maintenance and repairs on capitalized properties, plants and equipment are charged to operations as incurred. Exploration costs include those relating to activities carried out in search of previously unidentified resources or exploration targets, (a) at undeveloped concessions, or (b) at operating mines already containing proven and probable reserves, where a determination remains pending as to whether new target deposits outside of the existing reserve areas can be economically developed. Pre-development activities involve costs incurred in the exploration stage that may ultimately benefit production, such as underground ramp development, which are expensed due to the lack of evidence of economic viability, which is necessary to demonstrate future recoverability of these expenses. At an underground mine, secondary development costs are incurred for preparation of an ore body for production in a specific ore block, stope or work area, providing a relatively short-lived benefit only to the mine area they relate to, and not to the ore body as a whole. Primary development costs benefit long-term production, multiple mine areas, or the ore body as a whole, and are therefore capitalized.
Drilling, development and related costs are either classified as exploration, pre-development or secondary development, as defined above, and charged to operations as incurred, or capitalized, based on the following criteria:
•whether the costs are incurred to further define resources or exploration targets at and adjacent to existing reserve areas or intended to assist with mine planning within a reserve area;
•whether the drilling or development costs relate to an ore body that has been determined to be commercially mineable, and a decision has been made to put the ore body into commercial production; and
•whether, at the time the cost is incurred: (a) the expenditure embodies a probable future benefit that involves a capacity, singly or in combination with other assets, to contribute directly or indirectly to future net cash inflows, (b) we can obtain the benefit and control others’ access to it, and (c) the transaction or event giving rise to our right to or control of the benefit has already occurred.
If all of these criteria are met, drilling, development and related costs are capitalized. Drilling and development costs not meeting all of these criteria are expensed as incurred. The following factors are considered in determining whether or not the criteria listed above have been met, and capitalization of drilling and development costs is appropriate:
•completion of a favorable economic study and mine plan for the ore body targeted;
•authorization of development of the ore body by management and/or the Board of Directors; and
•there is a justifiable expectation, based on applicable laws and regulations, that issuance of permits or resolution of legal issues and/or contractual requirements necessary for us to have the right to or control of the future benefit from the targeted ore body have been met.
Drilling and related costs of $12.2 million, $12.4 million, and $17.6 million for the years ended December 31, 2025, 2024 and 2023, respectively, met our criteria for capitalization listed above at our production stage properties.
When assets are retired or sold, the costs and related allowances for depreciation and amortization are eliminated from the accounts and any resulting gain or loss is reflected in current period net income (loss).
Our mineral interests, which are tangible assets, include acquired undeveloped mineral interests and royalty interests. Undeveloped mineral interests include: (i) resources which are measured, indicated or inferred with insufficient drill spacing or quality to qualify as proven and probable reserves; and (ii) inferred material and exploration targets not immediately adjacent to existing proven and probable reserves but accessible within the immediate mine infrastructure. Residual values for undeveloped mineral interests represent the expected fair value of the interests at the time we plan to convert, develop, further explore or dispose of the interests and are evaluated at least annually.
H. Depreciation, Depletion and Amortization — Capitalized costs are depreciated or depleted using the straight-line method or units-of-production method at rates sufficient to depreciate such costs over the shorter of estimated productive lives of such facilities or the useful life of the individual assets. Productive lives range from 2 to 14 years, but do not exceed the useful life of the individual asset. Determination of expected useful lives for amortization calculations are made on a property-by-property or asset-by-asset basis at least annually. Our estimates for reserves and resources are a key component in determining our units-of-production depreciation rates, with net book value of many assets depreciated over remaining estimated reserves. Reserves are estimates made by our professional technical personnel of the amount of metals that they believe could be economically and legally extracted or produced at the time of the reserve determination (discussed in J. Proven and Probable Mineral Reserves below). Our estimates of proven and probable mineral reserves and resources may change, possibly in the near term, resulting in changes to depreciation, depletion and amortization rates in future reporting periods.
Undeveloped mineral interests and value beyond proven and probable reserves are not amortized until such time as there are proven and probable reserves or the related mineralized material is converted to proven and probable reserves. At that time, the basis of the mineral interest is amortized on a units-of-production basis. Pursuant to our policy on impairment of long-lived assets (discussed further below), if it is determined that an undeveloped mineral interest cannot be economically converted to proven and probable reserves and its carrying value exceeds its estimated undiscounted future cash flows, the basis of the mineral interest is reduced to its fair value and an impairment loss is recorded to expense in the period in which it is determined to be impaired.
I. Impairment of Long-lived Assets — Management reviews and evaluates the net carrying value of all facilities, including idle facilities, for impairment upon the occurrence of events or changes in circumstances that indicate that the related carrying amounts may not be recoverable. We perform the test for recoverability of each property based on the estimated probability adjusted undiscounted expected future cash flows that will be generated from operations at each property, potential future asset disposals, the estimated salvage value of the surface plant and equipment, and the value associated with property interests.
Although management has made what it believes to be a reasonable estimate of factors based on current conditions and information, assumptions underlying future cash flows, which includes the estimated value of resources and exploration targets, are subject to significant risks and uncertainties. Estimates of undiscounted expected future cash flows are dependent upon, among other factors, estimates of: (i) metals to be recovered from proven and probable mineral reserves and identified resources and exploration targets beyond proven and probable reserves, (ii) future production and capital costs, (iii) estimated metals prices (considering current and historical prices, forward pricing curves and related factors) over the estimated remaining mine life, (iv) market values of mineral interests and (v) potential estimated sales value. It is possible that changes could occur in the near term that could adversely affect our estimate of future cash flows to be generated from our operating properties. If estimated probability adjusted undiscounted expected cash flows are less than the carrying value of a property, an impairment loss is recognized for the difference between the carrying value and fair value of the property.
J. Proven and Probable Mineral Reserves — At least annually, management reviews the reserves used to estimate the quantities and grades of ore at our mines which we believe can be recovered and sold economically. Management’s calculations of proven and probable mineral reserves are based on financial, engineering and geological estimates, including future metals prices and operating costs, and an assessment of our ability to obtain the permits required to mine and process the material. From time to time, management obtains external audits or reviews of reserves.
Reserve estimates will change as existing reserves are depleted through production, as additional reserves are proven and added to the estimates and as market prices of metals, production or capital costs, smelter terms, the grade or tonnage of the deposit, throughput, dilution of the ore or recovery rates change.
K. Leases — Contractual arrangements are assessed at inception to determine if they represent or contain a lease. Right-of-use (“ROU”) assets related to operating leases are separately reported in the Consolidated Balance Sheets. ROU assets related to finance leases are included in Properties, plants, equipment and mine development, net.
Operating and finance lease ROU assets and lease liabilities are recognized at the lease commencement date based on the present value of the future lease payments over the lease term. When the rate implicit to the lease cannot be readily determined, we utilize our incremental borrowing rate in determining the present value of the future lease payments. The incremental borrowing rate is derived from information available at the lease commencement date and represents the rate of interest that we would have to pay to borrow on a collateralized basis over a similar term an amount equal to the lease payments in a similar economic environment. The ROU asset includes any lease payments made and lease incentives received prior to the commencement date. Operating lease ROU assets also include any cumulative prepaid or accrued rent when the lease payments are uneven throughout the lease term. The ROU assets and lease liabilities may include options to extend or terminate the lease when it is reasonably certain that we will exercise that option.
L. Income and Mining Taxes — We provide for federal, state and foreign income taxes currently payable, as well as those deferred, due to timing differences between reporting income and expenses for financial statement purposes versus tax purposes. Federal, state/provincial and foreign tax benefits are recorded as a reduction of income taxes, when applicable. We record deferred tax assets and liabilities for expected future tax consequences of temporary differences between the financial statement carrying amounts and the tax bases of those assets and liabilities, as well as operating loss and tax credit carryforwards, using enacted tax rates in effect in the years in which the differences are expected to reverse. We have elected to account for global intangible low-taxed income tax GILTI as a period cost and recognize the tax expense on income from foreign jurisdiction in the year incurred.
We evaluate uncertain tax positions in a two-step process, whereby (i) it is determined whether it is more likely than not that the tax positions will be sustained based on the technical merits of the position and (ii) for those tax positions that meet the more-likely-than-not recognition threshold, the largest amount of tax benefit that is greater than 50% likely of being realized upon ultimate settlement with the related tax authority would be recognized.
We evaluate our ability to realize deferred tax assets by considering the sources and timing of taxable income, including the reversal of existing temporary differences, the ability to carryback tax attributes to prior periods, qualifying tax-planning strategies, and estimates of future taxable income exclusive of reversing temporary differences. In determining future taxable income, the Company’s assumptions include the amount of pre-tax operating income according to different state, federal and international taxing jurisdictions, the origination of future temporary differences, and the implementation of feasible and prudent tax-planning strategies. Should we determine that a portion of our deferred tax assets will not be realized, a valuation allowance is recorded in the period that such determination is made. When we determine, based on the existence of sufficient evidence, that more or less of the deferred tax assets are more likely than not to be realized, an adjustment to the valuation allowance is made in the period such a determination is made.
We classify as income taxes mine license taxes incurred in the states of Alaska and Idaho, the net proceeds taxes incurred in Nevada, and resource taxes incurred in Quebec and Yukon, Canada.
M. Reclamation and Remediation Costs (Asset Retirement Obligations) — At our operating properties, we record a liability for the present value of our estimated environmental remediation costs, and the related asset created with it, in the period in which the liability is incurred. The liability is accreted and the asset is depreciated over the life of the related assets. Adjustments for changes resulting from the passage of time and changes to either the timing or amount of the original present value estimate underlying the obligation are made in the period incurred.
At our non-operating properties, we accrue costs associated with environmental remediation obligations when it is probable that such costs will be incurred and they are reasonably estimable. Accruals for estimated losses from environmental remediation obligations have historically been recognized no later than completion of the remediation feasibility study for such facility and are charged to current earnings under provision for closed operations and environmental matters. Costs of future expenditures for environmental remediation are not discounted to their present value unless subject to a contractually obligated fixed payment schedule. Such costs are based on management’s current estimate of amounts to be incurred when the remediation work is performed, within current laws and regulations.
Future closure, reclamation and environmental-related expenditures are difficult to estimate in many circumstances, due to the early stage nature of investigations, uncertainties associated with defining the nature and extent of environmental contamination, the application of laws and regulations by regulatory authorities, and changes in reclamation or remediation technology. We periodically review accrued liabilities for such reclamation and remediation costs as evidence becomes available indicating that our liabilities have potentially changed. Changes in estimates at our non-operating properties are reflected in current period net income (loss).
N. Revenue Recognition and Trade Accounts Receivable — Sales of all metals products sold directly to customers, including by-product metals, are recorded as revenues and accounts receivable upon completion of the performance obligations and transfer of control of the product to the customer. For sales of metals from refined doré, the performance obligation is met, the transaction price is known, and revenue is recognized at the time of transfer of control of the agreed-upon metal quantities to the customer by the refiner. For sales of unrefined doré, the performance obligation is met, the transaction price is known, and revenue is recognized at the time of transfer of title and control of the doré containing the agreed-upon metal quantities to the customer. For concentrate sales, the performance obligation is met, the transaction price can be reasonably estimated, and revenue is recognized generally at the time of shipment at estimated forward prices for the anticipated month of settlement. Due to the time elapsed from shipment to the customer and the final settlement with the customer, we must estimate the prices at which sales of our concentrates will be settled. Previously recorded sales and accounts receivable are adjusted to estimated settlement metals prices until final settlement by the customer. As discussed in P. Risk Management Contracts below, we seek to mitigate this exposure by using financially-settled forward contracts for some of the metals contained in our concentrate shipments.
Refining, selling and shipping costs related to sales of doré, and metals from doré, are recorded to costs applicable to sales as incurred. Sales and accounts receivable for concentrate shipments are recorded net of charges by the customers for treatment, refining, smelting losses, and other charges negotiated by us with the customers. Charges are estimated by us upon shipment of concentrates based on contractual terms, and actual charges typically do not vary materially from our estimates. Costs charged by customers include fixed costs per ton of concentrate, and price escalators which allow the customers to participate in the increase of lead and zinc prices above a negotiated baseline.
The Company's wholly owned subsidiary Elsa Reclamation and Development Company Ltd. ("ERDC"), generates revenue from performing environmental remediation services for the Crown-Indigenous Relations and Northern Affairs Canada ("CIRNAC"), a department of the Federal Government of Canada. ERDC and CIRNAC agree on annual work plans, which detail the scope of activities to be completed. Based on the work plan, the performance obligations to be met and the transaction price is known. Revenue is recognized on a monthly basis, as the required environmental remediation services performance obligations are completed and CIRNAC approves the activities performed. Modification to the scope of work would be agreed to separately with CIRNAC as no work outside of the work plan is reimbursable.
O. Foreign Currency — The functional currency for our operations located in the U.S., Mexico and Canada is the U.S. dollar (“USD”) for all periods presented. Accordingly, for Keno Hill in Canada and San Sebastian in Mexico, we have translated our monetary assets and liabilities at the period-end exchange rate, and non-monetary assets and liabilities at historical rates, with income and expenses translated at the average exchange rate for the current period. All translation gains and losses have been included in the current period net income (loss). Expenses incurred at our foreign operations and denominated in CAD and MXN expose us to exchange rate fluctuations between those currencies and the USD. As discussed in P. Risk Management Contracts below, we seek to mitigate this exposure by using financially-settled forward contracts to sell CAD.
P. Risk Management Contracts — We use derivative financial instruments as part of an overall risk-management strategy as a means of managing exposure to changes in metals prices and exchange rate fluctuations between the USD and CAD. We do not hold or issue derivative financial instruments for speculative trading purposes. We measure derivative contracts as assets or liabilities based on their fair value. Amounts recognized for the fair value of derivative asset and liability positions with the same counterparty and which would be settled on a net basis are offset against each other on our consolidated balance sheets. Gains or losses resulting from changes in the fair value of derivatives in each period are recorded either in current earnings or other comprehensive income (“OCI”), depending on the use of the derivative, whether it qualifies for hedge accounting and whether that hedge is effective. Amounts deferred in OCI are reclassified to sales of products (for metals price-related contracts) or costs applicable to sales (for foreign currency-related contracts). Ineffective portions of any change in fair value of a derivative are recorded in current period other operating income (expense). For derivatives qualifying as hedges, when the hedged items are sold, extinguished or terminated, or it is determined the hedged transactions are no longer likely to occur, gains or losses on the derivatives are reclassified from OCI to current earnings. As of December 31, 2025 and 2024, certain of our foreign currency-related forward contracts and metals prices hedges qualified for hedge accounting, with unrealized gains and loss related to the effective portion of the contracts included in OCI.
Q. Stock-Based Compensation — The fair values of equity instruments granted to employees that have vesting periods are expensed over the vesting periods on a straight-line basis. The fair values of instruments having no vesting period are expensed when granted. Stock-based compensation expense is recorded among general and administrative expenses, exploration and pre-development and costs applicable to sales.
R. Basic and Diluted Income (Loss) Per Common Share — We calculate basic income (loss) per share on the basis of the weighted average number of shares of common stock outstanding during the period. Diluted income per share is calculated using the weighted average number of shares of common stock outstanding during the period plus the effect of potential dilutive common shares during the period using the treasury stock and if-converted methods.
S. Comprehensive Income (Loss) — In addition to net income (loss), comprehensive income (loss) includes certain changes in equity during a period, such as adjustments to minimum pension liabilities, adjustments to recognize the over-funded or under-funded status of our defined benefit pension plans, and the change in fair value of derivative contracts designated as hedge transactions, net of tax, if applicable.
T. Discontinued Operations - The Company reports the results of operations of a business as discontinued operations if a disposal represents a strategic shift that has (or will have) a major effect on the Company's operations and financial results when the business is classified as held for sale, in accordance with ASC 360, Property, Plant and Equipment and ASC 250-20, Presentation of Financial Statements - Discontinued Operations. The results of discontinued operations are reported in Income (Loss) from discontinued operations, net of income and mining taxes in the Consolidated Statements of Operations and Comprehensive Income (Loss) for current and prior periods, including any gain or loss recognized on closing or adjustment of the carrying amount to fair value less cost to sell.
U. Reclassifications — Certain amounts in 2023 and 2024 have been reclassified in the Consolidated Statements of Operations and Comprehensive Income (Loss) and Note 5. Business Segments, Sales of Products and Significant Customers to conform with the 2025 presentation.
V. New Accounting Pronouncements —
Accounting Standards Updates that Became Effective in the Current Period
In December 2023, the FASB issued ASU 2023-09, Income Taxes (Topic 740): Improvement to Income Tax Disclosures, amending income tax disclosure requirements for the effective tax rate reconciliation and income taxes paid. The amendments in ASU 2023-09 are effective for fiscal years beginning after December 15, 2024 and are applied prospectively. Early adoption and retrospective application of the amendments are permitted. We retrospectively adopted the income tax disclosures required under the amendments in the year ended December 31, 2025 consolidated financial statements.
Accounting Standards Updates to Become Effective in Future Periods
In November 2024, the FASB issued ASU 2024-03, Income Statement - Reporting Comprehensive Income (Topic 220): Expense Disaggregation Disclosures, which includes amendments to require the disclosure of certain specific costs and expenses that are included in a relevant expense caption on the face of the income statement. Specific costs and expenses that would be required to be disclosed include: purchases of inventory, employee compensation, depreciation and intangible asset amortization. Additionally, a qualitative description of other items is required, equal to the difference between the relevant expense caption and the separately disclosed specific costs. The amendments in ASU 2024-03 are effective for fiscal years beginning after December 15, 2026, and for interim periods beginning after December 15, 2027, and are applied either prospectively or retrospectively at the option of the Company. We are evaluating the impact of the amendments on our consolidated financial statements and disclosures.
Note 3: Sale of Hecla Quebec Inc. and Discontinued Operations
On March 25, 2026, we completed the sale of our Hecla Quebec Inc. ("Hecla Quebec") subsidiary which owns the Casa Berardi mine to Orezone Gold Corporation ("Orezone") for total consideration with a fair value of $385.7 million comprised of the following:
•Cash of $170.0 million upon closing on March 25, 2026
•Accounts receivable related to working capital adjustments of $16.6 million
•65,757,265 Orezone common shares valued at $106.1 million on closing
•Deferred cash consideration ("Deferred Cash Consideration") with a fair value of $57.1 million for the cash payments of $30 million and $50 million to be received 18 months and 30 months after closing, respectively
•Contingent cash consideration ("Contingent Cash Consideration") with a fair value of $35.9 million for a total of up to $241 million of undiscounted payments consisting of:
oA fair value of $3.3 million for two annual gold-price related payments of $5 million each should the average gold price exceed $4,200/oz for the first and second years following closing
oA fair value of $9.9 million for two contingent payments of $10 million each due upon issuance of certain permits to open pit mine two additional identified orebodies
oA fair value of $22.7 million for certain future gold production-based royalty payments with an undiscounted value of up to $211 million ($80/ounce for the first 500,000 ounces, then $180/ounce thereafter from future open pit operations)
Orezone has a set-off right to reduce the unpaid balance of the Deferred Cash Consideration payments by 50% of the amount by which the financial assurance required by the Quebec government under the updated Casa Berardi closure plan exceeds $150 million, excluding increases caused by Orezone's post-closing actions. Our current estimate of that excess, being $11.5 million has been included in determining the fair values of the Deferred Cash Consideration.
The fair value of the Deferred Cash Consideration was determined using a present value model by reference to Orezone's estimated credit rating and considering the expected closure excess amount to be withheld from the first payment. The Deferred Cash Consideration payments have been classified as noncurrent receivables, which is included in other non-current assets on the unaudited interim Condensed Consolidated Balance Sheet, due to being contractual rights to receive cash at 18 and 30 months, and have been recorded at amortized cost. The discount will be unwound in line with the effective interest method and recognized as interest income over the respective payment periods for each payment.
The fair value of each Contingent Cash Consideration payment to be received was determined by using an option pricing model, with significant assumptions including the following: expected success and timing of permitting, the timing of when production would commence, forward gold prices, and Orezone's estimated credit rating. The Company concluded that each contingent consideration payment to be received is a financial asset as it will be settled in cash. The Company next evaluated whether each contingent consideration payment is within the scope of ASC 815 "Derivatives and Hedging" or not. For the contingent consideration payment to be received linked to future gold prices, we concluded that the underlying being the gold price is a market rate, and that the fair value of this contingent consideration payment is assessed at each reporting date, with changes in fair value recorded in earnings. The contingent consideration payments linked to future assets have been classified as current and non-current receivables, which is included in other current and non-current assets on the Condensed Consolidated Balance Sheet, due to being contractual rights to receive cash at 12 and 24 months, and have been recorded at fair value.
For the contingent consideration payments linked to permitting success and future production following permitting success, we concluded these contingent consideration payments are not within the scope of ASC 815, "Derivatives and Hedging" as the receipt of the permits and future production are subject to operational and/or regulatory factors. The Company elected to follow the guidance in ASC 450, Contingencies which requires subsequent assessment for indicators of impairment. Additionally, payment received in excess of initial fair value recorded will be recognized as gains in the period received. The contingent consideration payments linked to permitting success and future production following permitting success, have been classified as non-current receivables, which is included in other non-current assets on the Condensed Consolidated Balance Sheet.
We determined that the sale of Hecla Quebec represents a strategic shift that has a major effect on our operations and financial results and therefore, the Casa Berardi operation is no longer a reportable segment and its financial results are reflected in the Company’s audited consolidated financial statements as a discontinued operation for all periods presented.
The following table presents the major classes of line items constituting income from discontinued operations, net of tax, in our Consolidated Statements of Operations and Comprehensive Income (Loss) for the years ended December 31, 2025, 2024, and 2023:
|
|
|
|
|
|
|
|
|
|
|
|
|
Year ended December 31, |
|
|
2025 |
|
|
2024 |
|
|
2023 |
|
Sales |
$ |
319,117 |
|
|
$ |
209,679 |
|
|
$ |
177,678 |
|
COSTS AND EXPENSES |
|
|
|
|
|
|
|
|
Costs applicable to sales(1) |
|
173,486 |
|
|
|
150,779 |
|
|
|
155,304 |
|
Depreciation, depletion and amortization |
|
33,233 |
|
|
|
72,835 |
|
|
|
66,037 |
|
General and administrative |
|
— |
|
|
|
— |
|
|
|
2,084 |
|
Exploration and pre-development |
|
393 |
|
|
|
1,863 |
|
|
|
5,685 |
|
Other operating expense, net |
|
(6,381 |
) |
|
|
1,688 |
|
|
|
5,251 |
|
Total costs and expenses |
|
200,731 |
|
|
|
227,165 |
|
|
|
234,361 |
|
Income (loss) from discontinued operations |
|
118,386 |
|
|
|
(17,486 |
) |
|
|
(56,683 |
) |
Other (expense) income: |
|
|
|
|
|
|
|
|
Interest expense |
|
(590 |
) |
|
|
(503 |
) |
|
|
(254 |
) |
Fair value adjustments, net |
|
4,123 |
|
|
|
(5,744 |
) |
|
|
1,190 |
|
Other income |
|
204 |
|
|
|
257 |
|
|
|
418 |
|
Net foreign exchange gain (loss) |
|
255 |
|
|
|
(512 |
) |
|
|
335 |
|
Total other income (expense) |
|
3,992 |
|
|
|
(6,502 |
) |
|
|
1,689 |
|
Income (loss) from discontinued operations, before income and mining taxes |
|
122,378 |
|
|
|
(23,988 |
) |
|
|
(54,994 |
) |
Income and mining tax (provision) benefit |
|
(58,725 |
) |
|
|
9,555 |
|
|
|
11,024 |
|
Income (loss) from discontinued operations, net of income and mining taxes |
$ |
63,653 |
|
|
$ |
(14,433 |
) |
|
$ |
(43,970 |
) |
(1) Excludes depreciation, depletion and amortization
The following table presents the carrying amounts of the major classes of asset and liabilities of discontinued operations to the Consolidated Balance Sheet as of December 31, 2025 and 2024:
|
|
|
|
|
|
|
|
|
|
December 31, 2025 |
|
December 31, 2024 |
|
ASSETS |
|
|
|
|
|
Accounts receivable |
|
$ |
5,091 |
|
$ |
6,431 |
|
Inventories: |
|
|
|
|
|
Product inventories |
|
|
11,615 |
|
|
13,732 |
|
Materials and supplies |
|
|
21,483 |
|
|
19,869 |
|
Other current assets |
|
|
2,596 |
|
|
8,737 |
|
Assets of discontinued operations, current |
|
|
40,785 |
|
|
48,769 |
|
Property, plants, equipment and mine development, net |
|
|
710,246 |
|
|
627,697 |
|
Other non-current assets |
|
|
698 |
|
|
810 |
|
Assets of discontinued operations, non-current |
|
|
710,944 |
|
|
628,507 |
|
Total assets |
|
$ |
751,729 |
|
$ |
677,276 |
|
|
|
|
|
|
|
LIABILITIES |
|
|
|
|
|
Current liabilities: |
|
|
|
|
|
Accounts payable and accrued liabilities |
|
$ |
24,690 |
|
$ |
26,454 |
|
Accrued payroll and related benefits |
|
|
7,891 |
|
|
6,243 |
|
Accrued taxes |
|
|
4,866 |
|
|
— |
|
Finance leases |
|
|
2,911 |
|
|
2,659 |
|
Other current liabilities |
|
|
— |
|
|
5,787 |
|
Liabilities of discontinued operations, current |
|
|
40,358 |
|
|
41,143 |
|
Accrued reclamation and closure costs |
|
|
75,980 |
|
|
17,005 |
|
Deferred tax liabilities |
|
|
88,840 |
|
|
50,193 |
|
Other non-current liabilities |
|
|
5,456 |
|
|
9,292 |
|
Liabilities of discontinued operations, non-current |
|
|
170,276 |
|
|
76,490 |
|
Total liabilities |
|
$ |
210,634 |
|
$ |
117,633 |
|
Note 4: Investments
At December 31, 2025 the fair value of our investments was $107.5 million, of which $59.6 million were presented as current investments and $47.8 million as non-current investments (2024: $33.9 million). Our investments consist of marketable equity securities which are carried at fair value and includes our investment in Cascadia which was previously accounted for under the equity method. We invested an additional $0.1 million in Cascadia in 2024, and recognized $0.1 million, $0.7 million and $0.3 million in equity losses of Cascadia during 2025, 2024 and 2023, respectively, which is included in the line item "Other income, net" in our Consolidated Statement of Operations and Comprehensive Income (Loss), prior to discontinuing equity accounting in August 2025 following the loss of significant influence over Cascadia. During 2023 we acquired marketable equity securities at a cost of $9.0 million. During 2025 we recognized $51.9 million in realized and unrealized gains and in 2024 and 2023, we recognized $3.7 million in unrealized gains and $0.2 million in net unrealized losses, respectively, as part of the line item fair value adjustments, net on our statement of consolidated operations and comprehensive income (loss).
Note 5: Business Segments, Sales of Products and Significant Customers
We discover, acquire and develop mines and other mineral interests and produce and market (i) concentrates containing silver, gold, lead, zinc and copper (ii) carbon material containing silver and gold, and (iii) doré containing silver and gold. We are currently organized and managed in three segments: Greens Creek, Lucky Friday and Keno Hill.
The Company regularly reviews its segment reporting for alignment with its strategic goals and operational structure as well as for evaluation of business performance and the allocation of resources by Hecla's President and Chief Executive Officer, who has been identified as our Chief Operating Decision Maker. The CODM evaluates the performance for all of our reportable segments based on segment gross profit or loss. For all segments, the CODM uses segment gross profit or loss to assess segment performance and allocate resources for each segment predominantly in the annual budget and forecasting process. The CODM considers budget to actual variances on a monthly basis when making decisions about allocating capital and personnel to the segments. Significant segment expenses that drive the financial performance of our reportable segments are (i) salaries, wages and other benefits, (ii) contractors, (iii) materials and consumables (iv) change in product inventory and (v) other direct production costs. In further evaluating the operational performance of each segment, the CODM also considers the amount of metals production versus budget, and the grade of the metal processed. Intersegment sales are transacted on the same basis as sales to third parties.
General corporate activities not associated with operating mines and their various exploration activities, as well as idle properties and environmental remediation services in the Yukon, Canada, are presented as “other.” The nature of the items that reconcile gross profit (loss) to income (loss) before income and mining taxes are not related to our reportable segments.
The tables below present information about our reportable segments as of and for the years ended December 31, 2025, 2024 and 2023 (in thousands).
|
|
|
|
|
|
|
|
|
|
|
|
|
|
|
|
|
|
|
Year ended December 31, 2025 |
Greens Creek |
|
Lucky Friday |
|
Keno Hill |
|
Total Reportable Segments |
|
Other |
|
Total |
|
|
|
|
|
|
|
|
|
|
|
|
|
|
Metal sales |
$ |
612,827 |
|
$ |
306,640 |
|
$ |
145,317 |
|
$ |
1,064,784 |
|
$ |
— |
|
$ |
1,064,784 |
|
Environmental remediation services |
|
— |
|
|
— |
|
|
— |
|
|
— |
|
|
39,118 |
|
|
39,118 |
|
Intersegment sales |
|
— |
|
|
— |
|
|
6,123 |
|
$ |
6,123 |
|
|
— |
|
|
6,123 |
|
Reconciliation of sales |
|
612,827 |
|
|
306,640 |
|
|
151,440 |
|
|
1,070,907 |
|
|
39,118 |
|
|
1,110,025 |
|
Elimination of intersegment sales |
|
|
|
|
|
(6,123 |
) |
|
(6,123 |
) |
|
|
|
(6,123 |
) |
Total consolidated sales |
|
|
|
|
|
|
|
|
|
|
|
1,103,902 |
|
Salaries, wages and other benefits |
|
75,888 |
|
|
63,134 |
|
|
28,459 |
|
|
167,481 |
|
|
598 |
|
|
168,079 |
|
Contractors |
|
7,425 |
|
|
15,628 |
|
|
14,746 |
|
|
37,799 |
|
|
37,295 |
|
|
75,094 |
|
Materials and consumables |
|
106,959 |
|
|
44,817 |
|
|
27,300 |
|
|
179,076 |
|
|
679 |
|
|
179,755 |
|
Product inventory change |
|
1,258 |
|
|
346 |
|
|
(1,452 |
) |
|
152 |
|
|
— |
|
|
152 |
|
Other direct production costs |
|
42,691 |
|
|
(1,290 |
) |
|
2,830 |
|
|
44,231 |
|
|
2 |
|
|
44,233 |
|
Depreciation, depletion and amortization |
|
55,960 |
|
|
51,055 |
|
|
19,769 |
|
|
126,784 |
|
|
— |
|
|
126,784 |
|
Gross profit |
$ |
322,646 |
|
$ |
132,950 |
|
$ |
53,665 |
|
$ |
509,261 |
|
$ |
544 |
|
$ |
509,805 |
|
Other operating expenses (a) |
|
|
|
|
|
|
|
|
|
|
|
113,396 |
|
Income from operations |
|
|
|
|
|
|
|
|
|
|
|
396,409 |
|
|
|
|
|
|
|
|
|
|
|
|
|
|
Other Expense: |
|
|
|
|
|
|
|
|
|
|
|
|
Interest expense |
|
|
|
|
|
|
|
|
|
|
|
(40,991 |
) |
Fair value adjustments, net |
|
|
|
|
|
|
|
|
|
|
|
8,332 |
|
Foreign exchange gain, net |
|
|
|
|
|
|
|
|
|
|
|
(6,019 |
) |
Other income |
|
|
|
|
|
|
|
|
|
|
|
(930 |
) |
Income before income and mining taxes |
|
|
|
|
|
|
|
|
|
|
$ |
356,801 |
|
|
|
|
|
|
|
|
|
|
|
|
|
|
Capital additions |
$ |
54,617 |
|
$ |
72,933 |
|
$ |
58,192 |
|
$ |
185,742 |
|
$ |
5,133 |
|
$ |
190,875 |
|
Identifiable assets |
|
640,011 |
|
|
688,997 |
|
|
505,205 |
|
|
1,834,213 |
|
|
974,703 |
|
|
2,808,916 |
|
(a) Other operating expense items include general and administrative, exploration and pre-development, care and maintenance costs, provision for closed operations and environmental matters, write-down of property, plant and equipment and other operating (income) expense, net.
|
|
|
|
|
|
|
|
|
|
|
|
|
|
|
|
|
|
|
Year ended December 31, 2024 |
Greens Creek |
|
Lucky Friday |
|
Keno Hill |
|
Total Reportable Segments |
|
Other |
|
Total |
|
|
|
|
|
|
|
|
|
|
|
|
|
|
Metal sales |
$ |
421,574 |
|
$ |
203,154 |
|
$ |
74,962 |
|
$ |
699,690 |
|
$ |
— |
|
$ |
699,690 |
|
Environmental remediation services |
|
— |
|
|
— |
|
|
— |
|
$ |
— |
|
|
20,556 |
|
|
20,556 |
|
Intersegment sales |
|
— |
|
|
— |
|
|
3,834 |
|
$ |
3,834 |
|
|
— |
|
|
3,834 |
|
Reconciliation of sales |
|
421,574 |
|
|
203,154 |
|
|
78,796 |
|
|
703,524 |
|
|
20,556 |
|
|
724,080 |
|
Elimination of intersegment sales |
|
— |
|
|
— |
|
|
(3,834 |
) |
|
(3,834 |
) |
|
— |
|
|
(3,834 |
) |
Total consolidated sales |
|
|
|
|
|
|
|
|
|
|
|
720,246 |
|
Salaries, wages and other benefits |
|
69,990 |
|
|
52,879 |
|
|
29,658 |
|
$ |
152,527 |
|
|
206 |
|
|
152,733 |
|
Contractors |
|
6,135 |
|
|
14,154 |
|
|
22,960 |
|
$ |
43,249 |
|
|
19,696 |
|
|
62,945 |
|
Materials and consumables |
|
93,223 |
|
|
39,957 |
|
|
28,648 |
|
$ |
161,828 |
|
|
625 |
|
|
162,453 |
|
Product inventory change |
|
5,858 |
|
|
(2,628 |
) |
|
(8,902 |
) |
$ |
(5,672 |
) |
|
— |
|
|
(5,672 |
) |
Other direct production costs |
|
39,471 |
|
|
657 |
|
|
8,972 |
|
$ |
49,100 |
|
|
— |
|
|
49,100 |
|
Depreciation, depletion and amortization (a) |
|
53,450 |
|
|
41,673 |
|
|
20,380 |
|
$ |
115,503 |
|
|
— |
|
|
115,503 |
|
Gross profit/(loss)(a) |
$ |
153,447 |
|
$ |
56,462 |
|
$ |
(26,754 |
) |
$ |
183,155 |
|
$ |
29 |
|
$ |
183,184 |
|
Other operating expenses (b) |
|
|
|
|
|
|
|
|
|
|
|
59,422 |
|
Income from operations |
|
|
|
|
|
|
|
|
|
|
|
123,762 |
|
|
|
|
|
|
|
|
|
|
|
|
|
|
Other Expense: |
|
|
|
|
|
|
|
|
|
|
|
|
Interest expense |
|
|
|
|
|
|
|
|
|
|
|
(49,331 |
) |
Fair value adjustments, net |
|
|
|
|
|
|
|
|
|
|
|
3,541 |
|
Foreign exchange gain, net |
|
|
|
|
|
|
|
|
|
|
|
8,063 |
|
Other income |
|
|
|
|
|
|
|
|
|
|
|
4,169 |
|
Income before income and mining taxes |
|
|
|
|
|
|
|
|
|
|
$ |
90,204 |
|
|
|
|
|
|
|
|
|
|
|
|
|
|
Capital additions |
$ |
47,795 |
|
$ |
49,592 |
|
$ |
54,869 |
|
$ |
152,256 |
|
$ |
1,532 |
|
$ |
153,788 |
|
Identifiable assets |
|
564,334 |
|
|
587,945 |
|
|
413,982 |
|
|
1,566,261 |
|
|
737,523 |
|
|
2,303,784 |
|
(a) Previously reported transfers to ramp-up and suspension costs which were included as part of other operating expenses of $2,207 for Lucky Friday and $26,754 for Keno Hill have been included in the significant segment expenses and depreciation, depletion and amortization above, and the resultant calculation of gross profit/(loss).
(b) Other operating expense items include general and administrative, exploration and pre-development, care and maintenance costs, provision for closed operations and environmental matters, write-down of property, plant and equipment and other operating (income) expense, net.
Lucky Friday's income from operations for 2024 includes $50.0 million of business interruption and property damage insurance proceeds received during the respective periods related to the fire which suspended Lucky Friday's operations from August 2023 through January 8, 2024. The insurance proceeds received are recorded as part of "Other operating (income) expense, net" in our Consolidated Statements of Operations and Comprehensive Income (Loss).
During 2024, the Company wrote down $14.6 million of property, plant and mine development which had no salvage value. Of this amount, $13.9 million is included in Lucky Friday's income from operations and is related to the remote vein miner machine for which (i) we no longer had a use following the success of the Underhand Closed Bench mining method, (ii) we had been unsuccessful in locating a buyer, and (iii) the vendor advised us during the period that it would discontinue support for the program. The write down is recorded as part of "Write down of Property, Plant and Mine Development" in our Consolidated Statements of Operations and Comprehensive Income (Loss).
|
|
|
|
|
|
|
|
|
|
|
|
|
|
|
|
|
|
|
Year ended December 31, 2023 |
Greens Creek |
|
Lucky Friday |
|
Keno Hill |
|
Total Reportable Segments |
|
Other |
|
Total |
|
|
|
|
|
|
|
|
|
|
|
|
|
|
Metal sales |
$ |
384,504 |
|
$ |
116,284 |
|
$ |
35,518 |
|
$ |
536,306 |
|
$ |
960 |
|
$ |
537,266 |
|
Environmental remediation services |
|
— |
|
|
— |
|
|
— |
|
|
— |
|
|
5,283 |
|
|
5,283 |
|
Intersegment sales |
|
— |
|
|
— |
|
|
— |
|
|
— |
|
|
— |
|
|
— |
|
Reconciliation of sales |
|
384,504 |
|
|
116,284 |
|
|
35,518 |
|
|
536,306 |
|
|
6,243 |
|
|
542,549 |
|
Elimination of intersegment sales |
|
|
|
|
|
|
|
|
|
|
|
— |
|
Total consolidated sales |
|
|
|
|
|
|
|
|
|
|
|
542,549 |
|
Salaries, wages and employee benefits |
|
68,183 |
|
|
43,142 |
|
|
21,569 |
|
$ |
132,894 |
|
|
3,029 |
|
|
135,923 |
|
Contractors |
|
5,917 |
|
|
8,681 |
|
|
10,472 |
|
$ |
25,070 |
|
|
1,125 |
|
|
26,195 |
|
Materials and consumables |
|
89,850 |
|
|
27,030 |
|
|
18,018 |
|
$ |
134,898 |
|
|
1,606 |
|
|
136,504 |
|
Product inventory change |
|
4,266 |
|
|
8,014 |
|
|
(1,163 |
) |
$ |
11,117 |
|
|
269 |
|
|
11,386 |
|
Other direct production costs |
|
37,684 |
|
|
(6,519 |
) |
|
10,187 |
|
$ |
41,352 |
|
|
171 |
|
|
41,523 |
|
Depreciation, depletion and amortization (a) |
|
53,995 |
|
|
29,384 |
|
|
6,228 |
|
$ |
89,607 |
|
|
140 |
|
|
89,747 |
|
Gross profit (loss) (a) |
$ |
124,609 |
|
$ |
6,552 |
|
$ |
(29,793 |
) |
$ |
101,368 |
|
$ |
(97 |
) |
$ |
101,271 |
|
Other operating expenses (b) |
|
|
|
|
|
|
|
|
|
|
|
89,262 |
|
Income from operations |
|
|
|
|
|
|
|
|
|
|
|
12,009 |
|
|
|
|
|
|
|
|
|
|
|
|
|
|
Other Expense: |
|
|
|
|
|
|
|
|
|
|
|
|
Interest expense |
|
|
|
|
|
|
|
|
|
|
|
(43,065 |
) |
Fair value adjustments, net |
|
|
|
|
|
|
|
|
|
|
|
1,735 |
|
Foreign exchange loss, net |
|
|
|
|
|
|
|
|
|
|
|
(4,145 |
) |
Other income |
|
|
|
|
|
|
|
|
|
|
|
5,465 |
|
Loss before income and mining taxes |
|
|
|
|
|
|
|
|
|
|
$ |
(28,001 |
) |
|
|
|
|
|
|
|
|
|
|
|
|
|
Capital additions |
$ |
43,542 |
|
$ |
65,337 |
|
$ |
44,672 |
|
$ |
153,551 |
|
$ |
280 |
|
$ |
153,831 |
|
Identifiable assets |
|
569,369 |
|
|
578,110 |
|
|
362,986 |
|
|
1,510,465 |
|
|
820,841 |
|
|
2,331,306 |
|
(a) Previously reported transfers to ramp-up and suspension costs which were reported as part of other operating expenses of $25,548 for Lucky Friday and $29,793 for Keno Hill have been included in the significant segment expenses and depreciation, depletion and amortization above, and the resultant calculation of gross profit/(loss).
(b) Other operating expense items include general and administrative, exploration and pre-development, care and maintenance costs, provision for closed operations and environmental matters, write-down of property, plant and equipment and other operating (income) expense, net.
The following are our long-lived assets by geographic area as of December 31, 2025 and 2024 (in thousands):
|
|
|
|
|
|
|
|
|
|
|
2025 |
|
|
2024 |
|
United States |
|
$ |
1,714,956 |
|
|
$ |
1,684,890 |
|
Canada |
|
|
408,025 |
|
|
|
373,915 |
|
Mexico |
|
|
7,600 |
|
|
|
7,617 |
|
Total long-lived assets |
|
$ |
2,130,581 |
|
|
$ |
2,066,422 |
|
Our products consist of metal concentrates, which we sell to custom smelters, metal traders and third-party processors, and unrefined bullion bars (doré), which may be sold as doré or further refined before sale to precious metal traders. Revenue is recognized upon the completion of the performance obligations and transfer of control of the product to the customer.
For concentrate sales, which we currently have at Greens Creek, Lucky Friday, and Keno Hill, the performance obligation is met, the transaction price can be reasonably estimated, and revenue is recognized generally at the time of shipment. Concentrates sold at Lucky Friday typically leave the mine and are received by the customer within the same day. However, there is a period of time between shipment of concentrates from Greens Creek and Keno Hill and their physical receipt by the customer, and judgment is required in determining when control has been transferred to the customer and the performance obligation has been met for those shipments. We have determined control is met, title is transferred and the performance obligation is met upon shipment of concentrate parcels from Greens Creek and Keno Hill because, at that time, 1) legal title is transferred to the customer, 2) the customer has accepted the parcel and obtained the ability to realize all of the benefits from the product, 3) the concentrate content specifications are known, have been communicated to the customer, and the customer has the significant risks and rewards of ownership of it, 4) it is very unlikely a concentrate parcel from Greens Creek will be rejected by a customer upon physical receipt, and 5) we have the right to payment for the parcel.
Judgment is also required in identifying our concentrate sales performance obligations. Most of our concentrate sales involve “frame contracts” with smelters that can cover multiple years and specify certain terms under which individual parcels of concentrates are sold. However, some terms are not specified in the frame contracts and/or can be renegotiated as part of annual amendments to the frame contract. We have determined parcel shipments represent individual performance obligations satisfied at the point in time when control of the shipment is transferred to the customer.
The amount of consideration we receive for our concentrate sales is variable and fluctuates due to changes in metals prices between the time of shipment and final settlement with the customer. However, we are able to reasonably estimate the transaction price for the concentrate sales at the time of shipment using forward prices for the month of settlement, and previously recorded sales and accounts receivable are adjusted to estimated settlement metals prices until final settlement with the customer. Also, it is unlikely a significant reversal of revenue for any one concentrate parcel will occur. As such, we use the expected value method to price the parcels until the final settlement date occurs, at which time the final transaction price is known. At December 31, 2025, metals contained in concentrate sales and exposed to future price changes totaled 3.5 million ounces of silver, 2,272 ounces of gold, 14,028 tons of zinc, and 8,322 tons of lead. However, as discussed in Note 11, we seek to mitigate the risk of price adjustments by using financially-settled forward contracts and commodity price collars for some of our sales.
Sales and accounts receivable for concentrate shipments are recorded net of charges for treatment, refining, smelting losses, and other charges negotiated by us with the customers, which represent components of the transaction price. Charges are estimated by us upon shipment of concentrates based on contractual terms, and actual charges typically do not vary materially from our estimates. Costs charged by customers include fixed treatment and refining costs per ton of concentrate and may include price escalators which allow the customers to participate in the increase of lead and zinc prices above a negotiated baseline. Costs for shipping concentrates to customers are recorded to costs applicable to sales as incurred.
Sales of metal concentrates and metal products are made principally to custom smelters, third-party processors and metal traders. The percentage of metal sales contributed by each segment is reflected in the following table:
|
|
|
|
|
|
|
|
|
|
|
|
|
|
|
Year Ended December 31, |
|
|
|
2025 |
|
|
2024 |
|
|
2023 |
|
Greens Creek |
|
|
57.6 |
% |
|
|
60.3 |
% |
|
|
71.6 |
% |
Lucky Friday |
|
|
28.8 |
% |
|
|
29.0 |
% |
|
|
21.6 |
% |
Keno Hill |
|
|
13.6 |
% |
|
|
10.7 |
% |
|
|
6.6 |
% |
Other |
|
|
— |
|
|
|
— |
|
|
|
0.2 |
% |
|
|
|
100 |
% |
|
|
100 |
% |
|
|
100 |
% |
Total sales for the years ended December 31, 2025, 2024 and 2023 were as follows (in thousands):
|
|
|
|
|
|
|
|
|
|
|
|
|
|
|
Year Ended December 31, |
|
|
|
2025 |
|
|
2024 |
|
|
2023 |
|
Silver |
|
$ |
688,383 |
|
|
$ |
413,312 |
|
|
$ |
301,768 |
|
Gold |
|
|
165,996 |
|
|
|
109,245 |
|
|
|
97,449 |
|
Lead |
|
|
91,272 |
|
|
|
87,223 |
|
|
|
72,728 |
|
Zinc |
|
|
131,954 |
|
|
|
130,767 |
|
|
|
116,230 |
|
Copper |
|
|
3,194 |
|
|
|
416 |
|
|
|
— |
|
Less: Smelter and refining charges |
|
|
(16,015 |
) |
|
|
(41,273 |
) |
|
|
(50,909 |
) |
Total metal sales |
|
|
1,064,784 |
|
|
|
699,690 |
|
|
|
537,266 |
|
Environmental remediation services |
|
|
39,118 |
|
|
|
20,556 |
|
|
|
5,283 |
|
Total sales |
|
$ |
1,103,902 |
|
|
$ |
720,246 |
|
|
$ |
542,549 |
|
The following is metal sales information by geographic area based on the location of smelters and metal traders (for concentrate shipments) and the location of parent companies (for doré sales to metal traders) for the years ended December 31, 2025, 2024 and 2023 (in thousands):
|
|
|
|
|
|
|
|
|
|
|
|
|
|
|
2025 |
|
|
2024 |
|
|
2023 |
|
United States |
|
$ |
60,679 |
|
|
$ |
41,079 |
|
|
$ |
36,307 |
|
Canada |
|
|
327,947 |
|
|
|
247,744 |
|
|
|
197,414 |
|
Japan |
|
|
56,233 |
|
|
|
44,561 |
|
|
|
52,744 |
|
Korea |
|
|
611,284 |
|
|
|
181,372 |
|
|
|
127,590 |
|
China |
|
|
29,804 |
|
|
|
183,644 |
|
|
|
103,534 |
|
Others |
|
|
8,458 |
|
|
|
— |
|
|
|
— |
|
Total, excluding gains/losses on derivative contracts |
|
$ |
1,094,405 |
|
|
$ |
698,400 |
|
|
$ |
517,589 |
|
Metal sales by significant product type for the years ended December 31, 2025, 2024 and 2023 were as follows (in thousands):
|
|
|
|
|
|
|
|
|
|
|
|
|
|
|
Year Ended December 31, |
|
|
|
2025 |
|
|
2024 |
|
|
2023 |
|
Metals from doré - Greens Creek |
|
$ |
47,948 |
|
|
$ |
36,115 |
|
|
$ |
37,976 |
|
Silver concentrate - Greens Creek, Lucky Friday, Keno Hill |
|
|
870,489 |
|
|
|
493,584 |
|
|
|
356,941 |
|
Zinc concentrate - Greens Creek, Lucky Friday, Keno Hill |
|
|
138,068 |
|
|
|
111,101 |
|
|
|
80,274 |
|
Precious metals concentrate - Greens Creek |
|
|
37,900 |
|
|
|
57,600 |
|
|
|
42,398 |
|
Total, excluding gains/losses on forward contracts |
|
$ |
1,094,405 |
|
|
$ |
698,400 |
|
|
$ |
517,589 |
|
Metal sales for 2025, 2024 and 2023 included net losses of $29.6 million and net gains of $1.3 million and $19.7 million, respectively, on derivative contracts for silver, gold, lead and zinc contained in our sales. See Note 11 for more information.
Metal sales from continuing operations to significant metals customers as a percentage of total sales were as follows for the years ended December 31, 2025, 2024 and 2023:
|
|
|
|
|
|
|
|
|
|
|
|
|
|
|
Year Ended December 31, |
|
|
|
2025 |
|
|
2024 |
|
|
2023 |
|
Customer A - Greens Creek, Lucky Friday |
|
|
31.9 |
% |
|
|
36.5 |
% |
|
|
15.7 |
% |
Customer B - Greens Creek, Keno Hill |
|
|
30.4 |
% |
|
|
24.1 |
% |
|
|
20.6 |
% |
Customer C - Greens Creek, Keno Hill |
|
|
12.5 |
% |
|
|
20.7 |
% |
|
|
12.6 |
% |
Our trade accounts receivable balance related to contracts with customers was $170.2 million, $31.5 million and $19.4 million at December 31, 2025, 2024 and 2023, respectively, and included no allowance for credit losses. Trade accounts receivable balances with significant metals customers as of December 31, 2025, 2024 and 2023 were as follows:
|
|
|
|
|
|
|
|
|
|
|
|
|
|
|
2025 |
|
|
2024 |
|
|
2023 |
|
Customer A |
|
|
48.7 |
% |
|
|
46.1 |
% |
|
|
22.2 |
% |
Customer B |
|
|
41.3 |
% |
|
|
16.8 |
% |
|
|
3.3 |
% |
Customer C |
|
|
5.2 |
% |
|
|
28.2 |
% |
|
|
— |
|
Customer D |
|
|
— |
|
|
|
— |
|
|
|
34.8 |
% |
Customer G |
|
|
0.4 |
% |
|
|
7.2 |
% |
|
|
24.2 |
% |
We have determined our contracts do not include a significant financing component. For sales of metal from doré, payment is received at the time the performance obligation is satisfied. The amount of consideration for concentrate sales is variable, and we receive payment for a significant portion of the estimated value of concentrate parcels within a relatively short period of time after the performance obligation is satisfied.
Our environmental services remediation revenue is all generated by our ERDC subsidiary and all from one customer CIRNAC. Annually, ERDC and CIRNAC agree to detailed work plans ("DWP") covering the planned activities from April 1 to March 31, the Canadian government's fiscal year. All DWPs are a separate performance obligation, which are satisfied over time as the services are performed and CIRNAC approves the work performed. Payment terms are 30 days after receipt of an invoice by CIRNAC. CIRNAC has the ability to cancel the contract with or without cause by providing written notice to the Company. ERDC is owed for work performed as of the date of cancellation. As at December 31, 2025, 2024 and 2023, CIRNAC owed us $8.2 million, $8.8 million and $3.6 million, which is included as part of "Other Accounts Receivable" on our consolidated balance sheet.
We do not incur significant costs to obtain contracts, nor costs to fulfill contracts which are not addressed by other accounting standards. Therefore, we have not recognized an asset for such costs as of December 31, 2025 and 2024.
Note 6: Environmental and Reclamation Activities
The liabilities accrued for our reclamation and closure costs at December 31, 2025 and 2024 were as follows (in thousands):
|
|
|
|
|
|
|
|
|
|
|
2025 |
|
|
2024 |
|
Operating properties: |
|
|
|
|
|
|
Greens Creek |
|
$ |
51,634 |
|
|
$ |
38,737 |
|
Lucky Friday |
|
|
14,914 |
|
|
|
10,982 |
|
Keno Hill |
|
|
3,733 |
|
|
|
3,500 |
|
Non-operating properties: |
|
|
|
|
|
|
Nevada |
|
|
35,885 |
|
|
|
33,700 |
|
Troy mine |
|
|
3,007 |
|
|
|
3,385 |
|
Johnny M |
|
|
9,703 |
|
|
|
10,148 |
|
All other sites |
|
|
7,410 |
|
|
|
7,454 |
|
Total |
|
|
126,286 |
|
|
|
107,906 |
|
Reclamation and closure costs, current |
|
|
(13,795 |
) |
|
|
(13,748 |
) |
Reclamation and closure costs, non-current |
|
$ |
112,491 |
|
|
$ |
94,158 |
|
The activity in our accrued reclamation and closure cost liability for the years ended December 31, 2025, 2024 and 2023 was as follows (in thousands):
|
|
|
|
|
Balance at January 1, 2023 |
|
|
105,647 |
|
Accruals for estimated costs and revisions due to changes in reclamation plans |
|
|
4,643 |
|
Accretion expense |
|
|
6,217 |
|
Payment of reclamation obligations |
|
|
(7,205 |
) |
Balance at December 31, 2023 |
|
|
109,302 |
|
Accruals for estimated costs and revisions due to changes in reclamation plans |
|
|
816 |
|
Accretion expense |
|
|
6,285 |
|
Payment of reclamation obligations |
|
|
(8,497 |
) |
Balance at December 31, 2024 |
|
|
107,906 |
|
Accruals for estimated costs and revisions due to changes in reclamation plans |
|
|
17,647 |
|
Accretion expense |
|
|
6,157 |
|
Payment of reclamation obligations |
|
|
(5,424 |
) |
Balance at December 31, 2025 |
|
$ |
126,286 |
|
Asset Retirement Obligations
Below is a reconciliation as of December 31, 2025 and 2024 (in thousands) of the asset retirement obligations (“ARO”) which are included in our total accrued reclamation and closure costs of $126.3 million and $107.9 million, respectively, discussed above. The estimated reclamation and closure costs were discounted using credit adjusted, risk-free interest rates ranging from 5.75% to 14.5% from the time we incurred the obligation to the time we expect to pay the retirement obligation.
Payments for reclamation obligations were incurred at Lucky Friday and Greens Creek, and at our former operating mines San Sebastian, Troy and Johnny M.
|
|
|
|
|
|
|
|
|
|
|
2025 |
|
|
2024 |
|
Balance January 1 |
|
$ |
107,906 |
|
|
$ |
109,302 |
|
Changes in obligations due to changes in reclamation plans |
|
|
17,647 |
|
|
|
816 |
|
Accretion expense |
|
|
6,157 |
|
|
|
6,285 |
|
Payment of asset retirement obligations |
|
|
(5,424 |
) |
|
|
(8,497 |
) |
Balance at December 31 |
|
$ |
126,286 |
|
|
$ |
107,906 |
|
The AROs related to the changes described above were discounted using a credit adjusted, risk-free interest rate of between 2.75% and 7.5% and inflation rates ranging from 1.8% to 4%.
Note 7: Employee Benefit Plans
Pensions and Other Post-retirement Plans
We sponsor defined benefit pension plans covering substantially all U.S. employees and a Supplemental Excess Retirement Plan (“SERP”) covering certain eligible employees. During July 2024, we closed the Hecla Mining Company Retirement Plan for Employees
(the “Hecla Plan”) to new participants. The closure of the Hecla Plan does not affect employees hired prior to July 19, 2024, and they will continue to accrue benefits. Benefits to retirees will continue unchanged.
The following tables provide a reconciliation of the changes in the plans’ benefit obligations and fair value of assets over the two-year period ended December 31, 2025, and the funded status as of December 31, 2025 and 2024 (in thousands):
|
|
|
|
|
|
|
|
|
|
|
Pension Benefits |
|
|
|
2025 |
|
|
2024 |
|
Change in benefit obligation: |
|
|
|
|
|
|
Benefit obligation at beginning of year |
|
$ |
168,004 |
|
|
$ |
149,426 |
|
Service cost |
|
|
4,270 |
|
|
|
3,659 |
|
Interest cost |
|
|
8,377 |
|
|
|
8,302 |
|
Change due to mortality change |
|
|
266 |
|
|
|
2,430 |
|
Change due to discount rate change |
|
|
(3,739 |
) |
|
|
10,819 |
|
Actuarial return |
|
|
249 |
|
|
|
1,714 |
|
Benefits paid |
|
|
(9,237 |
) |
|
|
(8,346 |
) |
Benefit obligation at end of year |
|
|
168,190 |
|
|
|
168,004 |
|
Change in fair value of plan assets: |
|
|
|
|
|
|
Fair value of plan assets at beginning of year |
|
|
184,334 |
|
|
|
176,958 |
|
Actual return on plan assets |
|
|
31,372 |
|
|
|
15,722 |
|
SERP assets to non-current investments |
|
|
(39,641 |
) |
|
|
— |
|
Benefits paid |
|
|
(7,961 |
) |
|
|
(8,346 |
) |
Fair value of plan assets at end of year |
|
|
168,104 |
|
|
|
184,334 |
|
Funded status at end of year |
|
$ |
(86 |
) |
|
$ |
16,330 |
|
The assets of the SERP are recorded in investments in the consolidated balance sheet as these are held in a Rabbi Trust and not classified as Plan Assets. An out-of-period correction was made to reclassify the SERP assets to non-current investments.
The following table provides the amounts recognized in the consolidated balance sheets as of December 31, 2025 and 2024 (in thousands):
|
|
|
|
|
|
|
|
|
|
|
Pension Benefits |
|
|
|
2025 |
|
|
2024 |
|
Non-current assets: |
|
|
|
|
|
|
Accrued benefit asset |
|
$ |
22,369 |
|
|
$ |
19,879 |
|
Pension liability |
|
|
|
|
|
|
Accrued current benefit liability |
|
|
— |
|
|
|
(1,556 |
) |
Accrued benefit liability |
|
|
(22,455 |
) |
|
|
(1,993 |
) |
Accumulated other comprehensive loss |
|
|
3,870 |
|
|
|
19,489 |
|
Net amount recognized |
|
$ |
3,784 |
|
|
$ |
35,819 |
|
The benefit obligation and prepaid benefit costs were calculated by applying the following weighted average assumptions:
|
|
|
|
|
|
|
|
|
|
|
Pension Benefits |
|
|
|
2025 |
|
|
2024 |
|
Discount rate: net periodic pension cost |
|
|
5.35 |
% |
|
|
5.14 |
% |
Discount rate: projected benefit obligation |
|
|
5.35 |
% |
|
|
5.14 |
% |
Expected rate of return on plan assets |
|
|
7.25 |
% |
|
|
7.25 |
% |
Rate of compensation increase: net periodic pension cost |
|
3.5% |
|
(1) |
3% |
|
Rate of compensation increase: projected benefit obligation |
|
3.5% |
|
(1) |
3% |
|
(1) 3.5% for 2025 and 2026, 3% per year thereafter.
The above assumptions were calculated based on information as of December 31, 2025 and 2024, the measurement dates for the plans. The discount rate is based on the yield curve for investment-grade corporate bonds as published by the U.S. Treasury Department. The expected rate of return on plan assets is based upon consideration of the plan’s current asset mix, historical long-term return rates and the plan’s historical performance. Our current assumption for the rate on plan assets is 7.25%. The vested benefit obligation is determined based on the actuarial present value of benefits to which employees are currently entitled, based on employees' expected date of separation or retirement.
Net periodic pension cost for the plans consisted of the following in 2025, 2024, and 2023 (in thousands):
|
|
|
|
|
|
|
|
|
|
|
|
|
|
|
Pension Benefits |
|
|
|
2025 |
|
|
2024 |
|
|
2023 |
|
Service cost |
|
$ |
4,270 |
|
|
$ |
3,659 |
|
|
$ |
3,794 |
|
Interest cost |
|
|
8,377 |
|
|
|
8,302 |
|
|
|
7,974 |
|
Expected return on plan assets |
|
|
(10,187 |
) |
|
|
(12,544 |
) |
|
|
(12,428 |
) |
Amortization of prior service cost |
|
|
82 |
|
|
|
265 |
|
|
|
500 |
|
Amortization of net loss (gain) |
|
|
2,030 |
|
|
|
61 |
|
|
|
(188 |
) |
Net periodic pension (benefit) cost |
|
$ |
4,572 |
|
|
$ |
(257 |
) |
|
$ |
(348 |
) |
The service cost component of net periodic pension cost is included in the same line items of our consolidated financial statements as other employee compensation costs. The net cost (benefit) of $0.3 million, ($3.9) million and ($4.1) million for 2025, 2024 and 2023, respectively, related to all other components of net periodic pension cost is included in other income on our consolidated statements of operations and comprehensive income (loss).
Each defined benefit pension plan's statement of investment policy delineates the responsibilities of the board, the committee which administers the plan, the investment manager(s), and investment adviser/consultant, and provides guidelines on investment management. Investment objectives are established for each of the asset categories included in the pension plans with comparisons of performance against appropriate benchmarks. Each plan's policy calls for investments to be supervised by qualified investment managers. The investment managers are monitored on an ongoing basis by our outside consultant, with formal reporting to us and the consultant performed each quarter. The policy sets forth the following allocation of assets:
|
|
|
|
|
|
|
|
|
|
|
Target |
|
|
Maximum |
|
Large cap U.S. equities |
|
|
17 |
% |
|
|
20 |
% |
Small cap U.S. equities |
|
|
8 |
% |
|
|
10 |
% |
Non-U.S. equities |
|
|
25 |
% |
|
|
30 |
% |
U.S. Fixed income |
|
|
18 |
% |
|
|
23 |
% |
Emerging markets debt |
|
|
5 |
% |
|
|
8 |
% |
Real estate |
|
|
15 |
% |
|
|
18 |
% |
Absolute return |
|
|
5 |
% |
|
|
7 |
% |
Company stock/Real return |
|
|
7 |
% |
|
|
13 |
% |
Each defined benefit pension plan's statement of investment policy and objectives aspires to achieve the assumed long term rate of return on plan assets established by the plan’s actuary plus one percent.
Accounting guidance has established a hierarchy of assets measured at fair value on a recurring basis. The three levels included in the hierarchy are:
Level 1: quoted prices in active markets for identical assets or liabilities
Level 2: significant other observable inputs
Level 3: significant unobservable inputs
The fair values by asset category in each pension plan, along with their hierarchy levels, are as follows as of December 31, 2025 (in thousands):
|
|
|
|
|
|
|
|
|
|
|
|
|
|
|
|
|
|
|
Hecla plan |
|
Lucky Friday |
|
|
Level 1 |
|
Level 2 |
|
Level 3 |
|
Total |
|
Level 1 |
|
Level 2 |
|
Level 3 |
|
Total |
Investments measured at fair value |
|
|
|
|
|
|
|
|
|
|
|
|
|
|
|
|
Interest-bearing cash |
|
$568 |
|
$— |
|
$— |
|
$568 |
|
$156 |
|
$— |
|
$— |
|
$156 |
Common stock |
|
7 |
|
— |
|
— |
|
7 |
|
— |
|
— |
|
— |
|
— |
Mutual funds |
|
78,805 |
|
— |
|
— |
|
78,805 |
|
18,574 |
|
— |
|
— |
|
18,574 |
Total investments in the fair value hierarchy |
|
79,380 |
|
— |
|
— |
|
79,380 |
|
18,730 |
|
— |
|
— |
|
18,730 |
Investments measured at net asset value |
|
|
|
|
|
|
|
|
|
|
|
|
|
|
|
|
Real estate funds |
|
— |
|
— |
|
— |
|
18,585 |
|
— |
|
— |
|
4,348 |
|
4,348 |
Common collective funds |
|
— |
|
— |
|
— |
|
38,356 |
|
— |
|
5,270 |
|
3,435 |
|
8,705 |
Total investments measured at net asset value |
|
— |
|
— |
|
— |
|
56,941 |
|
— |
|
5,270 |
|
7,783 |
|
13,053 |
Total fair value |
|
$79,380 |
|
$— |
|
$— |
|
$136,321 |
|
$18,730 |
|
$5,270 |
|
$7,783 |
|
$31,783 |
The fair values by asset category in each defined benefit pension plan, along with their hierarchy levels, were as follows as of December 31, 2024 (in thousands):
|
|
|
|
|
|
|
|
|
|
|
|
|
|
|
|
|
|
|
Hecla plans |
|
Lucky Friday |
|
|
Level 1 |
|
Level 2 |
|
Level 3 |
|
Total |
|
Level 1 |
|
Level 2 |
|
Level 3 |
|
Total |
Investments measured at fair value |
|
|
|
|
|
|
|
|
|
|
|
|
|
|
|
|
Interest-bearing cash |
|
$2,699 |
|
$— |
|
$— |
|
$2,699 |
|
$123 |
|
$— |
|
$— |
|
$123 |
Common stock |
|
18,874 |
|
— |
|
— |
|
18,874 |
|
2,932 |
|
— |
|
— |
|
2,932 |
Mutual funds |
|
87,823 |
|
— |
|
— |
|
87,823 |
|
13,016 |
|
— |
|
— |
|
13,016 |
Total investments in the fair value hierarchy |
|
109,396 |
|
— |
|
— |
|
109,396 |
|
16,071 |
|
— |
|
— |
|
16,071 |
Investments measured at net asset value |
|
|
|
|
|
|
|
|
|
|
|
|
|
|
|
|
Real estate funds |
|
— |
|
— |
|
— |
|
16,318 |
|
— |
|
— |
|
— |
|
3,698 |
Common collective funds |
|
— |
|
— |
|
— |
|
31,688 |
|
— |
|
— |
|
— |
|
7,163 |
Total investments measured at net asset value |
|
— |
|
— |
|
— |
|
48,006 |
|
— |
|
— |
|
— |
|
10,861 |
Total fair value |
|
$109,396 |
|
$— |
|
$— |
|
$157,402 |
|
$16,071 |
|
$— |
|
$— |
|
$26,932 |
Common stock investments included investments in Hecla common stock as of December 31, 2025 of $18.5 million (2024: $18.9 million) for the Hecla Plan and $3.0 million (2024: $2.9 million) for the Lucky Friday retirement plan.
Generally, investments are valued based on information provided by fund managers to each plan's trustee as reviewed by management and its investment advisers. Mutual funds and equities are valued based on available exchange data. Commingled equity funds consist of publicly-traded investments.
Fair value for real estate funds, hedge funds and common collective equity funds is measured using the net asset value per share (or its equivalent) practical expedient (“NAV”), and has not been categorized in the fair value hierarchy. There are no unfunded commitments related to these investments. There are no restrictions on redemptions of these funds as of December 31, 2025, except as limited by the redemption terms discussed below. The following summarizes information on the asset classes measured using NAV:
|
|
|
|
|
|
|
Investment strategy |
|
Redemption terms |
Real estate funds |
|
Invest in real estate properties among the four major property types (office, industrial, retail and multi-family) |
|
Allowed quarterly with notice of between 45 and 60 days |
Hedge funds |
|
Invest in a variety of asset classes which aim to diversify sources of returns |
|
Allowed quarterly with notice of 90 days |
Common collective funds |
|
Invest in U.S. large cap or small/medium cap public equities in actively traded managed equity portfolios |
|
Allowed daily or with notice of 30 days |
The following are estimates of future benefit payments, which reflect expected future service as appropriate, related to our pension plans (in thousands):
|
|
|
|
|
Year Ending December 31, |
|
Pension
Plans |
|
2026 |
|
$ |
10,273 |
|
2027 |
|
|
10,275 |
|
2028 |
|
|
10,549 |
|
2029 |
|
|
10,713 |
|
2030 |
|
|
10,996 |
|
Years 2031-2035 |
|
|
55,143 |
|
The last time we made a contribution to the plans was during 2023 in the form of $0.2 million in shares of our common stock contributed to the Hecla Plan, respectively. We do not expect to be required to contribute to our defined benefit plans in 2026, but we may choose to do so.
The following table indicates whether our pension plans had accumulated benefit obligations (“ABO”) in excess of plan assets, or plan assets exceeded ABO. In 2025, one of our plans had ABOs in excess of plan assets. During 2024 two of our plans had plan assets in excess of the ABO and one did not (in thousands).
|
|
|
|
|
|
|
|
|
|
|
|
|
|
|
|
|
2025 |
|
|
2025 |
|
|
2024 |
|
|
2024 |
|
|
Plan Assets Exceed ABO |
|
|
ABO Exceed Plan Assets |
|
|
Plan Assets Exceed ABO |
|
|
ABO Exceed Plan Assets |
|
Projected benefit obligation |
$ |
145,736 |
|
|
$ |
22,454 |
|
|
$ |
48,251 |
|
|
$ |
119,753 |
|
Accumulated benefit obligation |
|
142,230 |
|
|
|
21,834 |
|
|
|
47,262 |
|
|
|
116,148 |
|
Fair value of plan assets |
|
168,104 |
|
|
|
— |
|
|
|
66,573 |
|
|
|
117,761 |
|
For the pension plans, the following amounts are included in “Accumulated other comprehensive income, net” on our balance sheet as of December 31, 2025, that have not yet been recognized as components of net periodic benefit cost (in thousands):
|
|
|
|
|
|
|
Pension
Benefits |
|
Unamortized net loss |
|
$ |
3,647 |
|
Unamortized prior service cost |
|
|
223 |
|
Except for a limited number of employees who participate in the SERP, non-U.S. employees are not eligible to participate in the defined benefit pension plans that we maintain for U.S. employees. Canadian employees participate in Canada's public retirement income system, which includes the following components: (i) the Canada (or Quebec) Pension Plan, which is an employee and employer contributory, earnings-related social insurance program, and (ii) the Old Age Security program. Mexican employees participate in Mexico's public retirement income system, which is based on contributions the employee, employer and the government submit to the retirement savings system. The system is administered through savings accounts managed by private fund managers selected by the participant.
Capital Accumulation Plans
Our Capital Accumulation Plan ("401(k) plan") is available to all U.S. salaried and certain hourly employees upon employment. We make a matching contribution in the form of cash or stock of 100% of an employee’s contribution up to 6% of eligible earnings. Our matching contributions, all in Hecla common stock, were $5.1 million, $4.8 million and $4.6 million in 2025, 2024 and 2023, respectively.
We also maintain a 401(k) plan that is available to all hourly employees at Lucky Friday upon employment. When an employee meets eligibility requirements we make a matching cash contribution of 100% of the employee’s contribution up to, but not exceeding, 6% of the employee’s eligible earnings. Our matching contributions were $1.9 million, $1.6 million and $1.3 million in 2025, 2024 and 2023, respectively.
Note 8: Income and Mining Taxes
Major components of our income and mining tax provision for the years ended December 31, 2025, 2024 and 2023 are as follows (in thousands):
|
|
|
|
|
|
|
|
|
|
|
|
|
|
|
2025 |
|
|
2024 |
|
|
2023 |
|
Current: |
|
|
|
|
|
|
|
|
|
United States |
|
$ |
— |
|
|
$ |
— |
|
|
$ |
— |
|
State income and state mining taxes |
|
|
(17,469 |
) |
|
|
(6,758 |
) |
|
|
(3,846 |
) |
Canada |
|
|
— |
|
|
|
— |
|
|
|
— |
|
Canada - provincial mining taxes |
|
|
(1,272 |
) |
|
|
— |
|
|
|
— |
|
Total current income and mining tax provision |
|
|
(18,741 |
) |
|
|
(6,758 |
) |
|
|
(3,846 |
) |
Deferred: |
|
|
|
|
|
|
|
|
|
United States |
|
|
(58,959 |
) |
|
|
(29,517 |
) |
|
|
(7,115 |
) |
State and state mining taxes |
|
|
(17,246 |
) |
|
|
(5,682 |
) |
|
|
(3,136 |
) |
Canada |
|
|
(1,714 |
) |
|
|
— |
|
|
|
— |
|
Canada - provincial mining taxes |
|
|
(2,082 |
) |
|
|
1,988 |
|
|
|
1,851 |
|
Total deferred income and mining tax provision |
|
|
(80,001 |
) |
|
|
(33,211 |
) |
|
|
(8,400 |
) |
Total income and mining tax provision |
|
$ |
(98,742 |
) |
|
$ |
(39,969 |
) |
|
$ |
(12,246 |
) |
Domestic and foreign components of income (loss) before income and mining taxes for the years ended December 31, 2025, 2024 and 2023 are as follows (in thousands):
|
|
|
|
|
|
|
|
|
|
|
|
|
|
|
2025 |
|
|
2024 |
|
|
2023 |
|
|
|
|
|
|
|
|
|
|
|
United States |
|
$ |
304,122 |
|
|
$ |
138,986 |
|
|
$ |
18,528 |
|
Canada |
|
|
54,848 |
|
|
|
(46,293 |
) |
|
|
(42,426 |
) |
Mexico |
|
|
(2,169 |
) |
|
|
(2,489 |
) |
|
|
(4,103 |
) |
Total |
|
$ |
356,801 |
|
|
$ |
90,204 |
|
|
$ |
(28,001 |
) |
The Company paid the following income and mining tax payments net of refunds for the years ended December 31, 2025, 2024 and 2023(in thousands):
|
|
|
|
|
|
|
|
|
|
|
|
|
|
|
2025 |
|
|
2024 |
|
|
2023 |
|
United States |
|
$ |
— |
|
|
$ |
— |
|
|
$ |
— |
|
Alaska |
|
|
6,203 |
|
|
|
3,926 |
|
|
|
3,197 |
|
Idaho |
|
|
263 |
|
|
|
9 |
|
|
|
247 |
|
Canada |
|
|
— |
|
|
|
27 |
|
|
|
— |
|
Other |
|
|
— |
|
|
|
3 |
|
|
|
3 |
|
Total |
|
$ |
6,466 |
|
|
$ |
3,965 |
|
|
$ |
3,447 |
|
The annual tax provision is different from the amount that would be provided by applying the United States statutory federal income tax rate to our pretax income (loss). The reasons for the difference for the years ended December 31, 2025, 2024 and 2023 are (in thousands):
|
|
|
|
|
|
|
|
|
|
|
|
|
|
|
|
|
|
|
|
|
|
|
|
|
|
|
2025 |
|
|
2024 |
|
|
2023 |
|
|
|
|
|
|
|
|
|
|
|
|
|
|
|
|
|
Income and mining tax (provision) / benefit at statutory rate |
|
$ |
(74,927 |
) |
|
|
21 |
% |
|
$ |
(18,943 |
) |
|
|
21 |
% |
|
$ |
5,880 |
|
|
|
21 |
% |
|
|
|
|
|
|
|
|
|
|
|
|
|
|
|
|
|
|
|
State and local income tax, net of federal (national) income tax effect |
|
|
|
|
|
|
|
|
|
|
|
|
|
|
|
|
|
|
State taxes, net of federal tax benefit (a) |
|
|
(16,080 |
) |
|
|
4 |
|
|
|
(7,102 |
) |
|
|
8 |
|
|
|
(1,623 |
) |
|
|
(6 |
) |
US Mining and other taxes (b) |
|
|
(16,884 |
) |
|
|
5 |
|
|
|
(6,611 |
) |
|
|
7 |
|
|
|
(3,867 |
) |
|
|
(14 |
) |
Foreign tax effects |
|
|
|
|
|
|
|
|
|
|
|
|
|
|
|
|
|
|
Canada |
|
|
|
|
|
|
|
|
|
|
|
|
|
|
|
|
|
|
Canada - Rate differential on foreign earnings |
|
|
2,808 |
|
|
|
(1 |
) |
|
|
(3,445 |
) |
|
|
4 |
|
|
|
(12,175 |
) |
|
|
(43 |
) |
Canada - Currency remeasurement |
|
|
1,872 |
|
|
|
(1 |
) |
|
|
(3,065 |
) |
|
|
3 |
|
|
|
2,240 |
|
|
|
8 |
|
Canada - Mining taxes |
|
|
(3,563 |
) |
|
|
1 |
|
|
|
— |
|
|
|
— |
|
|
|
— |
|
|
|
0 |
|
Canada - Provincial taxes |
|
|
(4,834 |
) |
|
|
1 |
|
|
|
7,837 |
|
|
|
(9 |
) |
|
|
15,516 |
|
|
|
55 |
|
Canada - Other |
|
|
1,080 |
|
|
|
— |
|
|
|
1,683 |
|
|
|
(2 |
) |
|
|
744 |
|
|
|
3 |
|
Canada - Change in valuation allowance |
|
|
4,437 |
|
|
|
(1 |
) |
|
|
(7,000 |
) |
|
|
8 |
|
|
|
(6,731 |
) |
|
|
(24 |
) |
Provincial - Change in valuation allowance |
|
|
3,495 |
|
|
|
(1 |
) |
|
|
(5,598 |
) |
|
|
6 |
|
|
|
(4,764 |
) |
|
|
(17 |
) |
Provincial - Currency remeasurement |
|
|
1,580 |
|
|
|
(1 |
) |
|
|
1,856 |
|
|
|
(2 |
) |
|
|
(1,888 |
) |
|
|
(7 |
) |
Mexico |
|
|
|
|
|
|
|
|
|
|
|
|
|
|
|
|
|
|
Rate differential on foreign earnings |
|
|
195 |
|
|
|
— |
|
|
|
224 |
|
|
|
— |
|
|
|
369 |
|
|
|
1 |
|
Currency remeasurement |
|
|
1,543 |
|
|
|
— |
|
|
|
(2,297 |
) |
|
|
3 |
|
|
|
283 |
|
|
|
1 |
|
Change in valuation allowance |
|
|
(2,178 |
) |
|
|
1 |
|
|
|
1,617 |
|
|
|
(2 |
) |
|
|
(3,098 |
) |
|
|
(11 |
) |
Other |
|
|
(15 |
) |
|
|
— |
|
|
|
(67 |
) |
|
|
— |
|
|
|
1,584 |
|
|
|
6 |
|
Effect of Cross-Border Tax Laws |
|
|
|
|
|
|
|
|
|
|
|
|
|
|
|
|
|
|
Global intangible low-taxed income |
|
|
(5,634 |
) |
|
|
2 |
|
|
|
— |
|
|
|
— |
|
|
|
— |
|
|
|
— |
|
Subpart F |
|
|
(6,368 |
) |
|
|
2 |
|
|
|
— |
|
|
|
— |
|
|
|
— |
|
|
|
— |
|
Change in valuation allowance |
|
|
(3,875 |
) |
|
|
1 |
|
|
|
(3,387 |
) |
|
|
4 |
|
|
|
(5,712 |
) |
|
|
(20 |
) |
Nontaxable or nondeductible items |
|
|
|
|
|
|
|
|
|
|
|
|
|
|
|
|
|
|
Percentage depletion |
|
|
23,571 |
|
|
|
(7 |
) |
|
|
9,896 |
|
|
|
(11 |
) |
|
|
4,205 |
|
|
|
15 |
|
Transfer Pricing Allocation |
|
|
(1,795 |
) |
|
|
1 |
|
|
|
(755 |
) |
|
|
1 |
|
|
|
— |
|
|
|
— |
|
Compensation |
|
|
(838 |
) |
|
|
— |
|
|
|
(2,588 |
) |
|
|
3 |
|
|
|
(1,536 |
) |
|
|
(6 |
) |
Other |
|
|
(2,332 |
) |
|
|
1 |
|
|
|
(2,224 |
) |
|
|
2 |
|
|
|
(1,673 |
) |
|
|
(6 |
) |
Total (provision) benefit |
|
$ |
(98,742 |
) |
|
|
28 |
% |
|
$ |
(39,969 |
) |
|
|
44 |
% |
|
$ |
(12,246 |
) |
|
|
(44 |
)% |
(a) State taxes in Alaska made up the majority (greater than 50 percent) of the tax effect in this category.
(b) Mining taxes for Alaska Mine License Tax made up the majority (greater than 50 percent) of the tax effect in this category. |
|
|
|
|
|
|
|
|
|
|
|
|
|
|
|
|
At December 31, 2025 and 2024, the net deferred tax liability was $157.6 million and $60.1 million, respectively. The individual components of our net deferred tax assets and liabilities are reflected in the table below (in thousands).
|
|
|
|
|
|
|
|
|
|
|
December 31, |
|
|
|
2025 |
|
|
2024 |
|
Deferred tax assets: |
|
|
|
|
|
|
Accrued reclamation costs |
|
$ |
33,270 |
|
|
$ |
28,032 |
|
Deferred exploration |
|
|
21,691 |
|
|
|
21,591 |
|
Foreign net operating losses |
|
|
54,523 |
|
|
|
50,090 |
|
Domestic net operating losses |
|
|
126,186 |
|
|
|
191,583 |
|
Foreign exchange loss |
|
|
21,348 |
|
|
|
29,292 |
|
Foreign tax credit carryforward |
|
|
516 |
|
|
|
1,576 |
|
Miscellaneous |
|
|
40,560 |
|
|
|
30,014 |
|
Total deferred tax assets |
|
|
298,094 |
|
|
|
352,178 |
|
Valuation allowance |
|
|
(111,426 |
) |
|
|
(115,105 |
) |
Total deferred tax assets |
|
|
186,668 |
|
|
|
237,073 |
|
Deferred tax liabilities: |
|
|
|
|
|
|
Miscellaneous |
|
|
(17,123 |
) |
|
|
(7,716 |
) |
Properties, plants and equipment |
|
|
(327,130 |
) |
|
|
(289,430 |
) |
Total deferred tax liabilities |
|
|
(344,253 |
) |
|
|
(297,146 |
) |
Net deferred tax liability |
|
$ |
(157,585 |
) |
|
$ |
(60,073 |
) |
We evaluated the positive and negative evidence available to determine the amount of valuation allowance required on our deferred tax assets. At December 31, 2025, the balance of our valuation allowances was $111.4 million compared to $115.1 million at December 31, 2024. We retained a balance of valuation allowance on Hecla US operations at December 31, 2025 of $0.5 million for state loss carryforwards and foreign tax credits. In the Nevada U.S. Group, the scheduling of reversing deferred tax assets and liabilities determined that existing tax loss carryforwards subject to the limitation of eighty percent reduction of taxable income may be limited in the future. A valuation allowance is recorded for $44.1 million. Due to cessation of operations in Mexico at the end of 2020, we are uncertain when a source of taxable income will be available in that jurisdiction. Therefore, a valuation allowance of $13.7 million was retained on deferred tax assets in Mexico. As of December 31, 2025, a $53.0 million valuation allowance is recorded for Canadian jurisdictions, primarily related to the Alexco acquisition in 2022. The changes in the valuation allowance for the years ended December 31, 2025, 2024 and 2023, are as follows (in thousands):
|
|
|
|
|
|
|
|
|
|
|
|
|
|
|
2025 |
|
|
2024 |
|
|
2023 |
|
Balance at beginning of year |
|
$ |
(115,105 |
) |
|
$ |
(100,910 |
) |
|
$ |
(72,856 |
) |
Valuation allowance on deferred tax assets acquired with the ATAC (2023) and Alexco (2022) acquisitions |
|
|
— |
|
|
|
— |
|
|
|
(8,077 |
) |
Decrease (increase) related to non-recognition of deferred tax assets due to uncertainty of recovery and increase related to non-utilization of net operating loss carryforwards |
|
|
(7,113 |
) |
|
|
(16,965 |
) |
|
|
(21,114 |
) |
Decrease related to either or a combination of (i) utilization, (ii) release due to future benefit, and (iii) expiration of deferred tax assets as applicable |
|
|
10,792 |
|
|
|
2,770 |
|
|
|
1,137 |
|
Balance at end of year |
|
$ |
(111,426 |
) |
|
$ |
(115,105 |
) |
|
$ |
(100,910 |
) |
The Company has permanently reinvested its Canadian and Mexican’s undistributed earnings to support ongoing mining activities and continued project development. Accordingly, no deferred tax liability has been recorded for foreign withholding taxes, U.S. Federal and State income taxes. As of December 31, 2025, the Company does not have any foreign undistributed earnings.
As of December 31, 2025, for U.S. income tax purposes, we have federal and state net operating loss carryforwards of $577.2 million and $67.4 million, respectively. U.S. net operating loss carryforwards for periods arising before January 1, 2018 have a 20-year expiration period, the earliest of which could expire in 2031. U.S. net operating loss carryforwards of $493.8 million arising in 2018 and future periods have an indefinite carryforward period. We have foreign and provincial net operating loss carryforwards of $194.2 million, which expire between 2031 and 2044. Our utilization of U.S. net operating loss carryforwards may be subject to annual limitations if there is a change in control as defined under Internal Revenue Code Section 382. As of December 31, 2025, no change in control has occurred in the Hecla U.S. group. Net operating losses acquired with the Nevada U.S. Group are subject to limitation under Internal Revenue Code Section 382. However, the annual limitation is not expected to have a material impact on our ability to utilize the losses.
We have Internal Revenue Code Section 163(j) interest expense limitation carryforwards in the Nevada U.S. Group of $34.4 million as of December 31, 2025. The carryforward results in a future tax benefit of $7.2 million and has an indefinite carryforward period. There are no 163(j) interest limitations in the Hecla US group as of December 31, 2025.
We have excessive interest and financing expense limitation ("EIFEL") carryforwards of $22.7 million in Alexco Group as of December 31, 2025. The carryforward results in a future tax benefit of $6.1 million and has an indefinite carryforward period.
As of December 31, 2025, we have foreign tax credit carryforwards of $0.5 million. The carryforward period for foreign tax credits is 10 years. Our foreign tax credits will expire in 2026.
We file income tax returns in the U.S. federal jurisdiction, and various state and foreign jurisdictions. We are no longer subject to income tax examinations by U.S. federal and state tax authorities for years prior to 2002, nor subject to examinations by foreign tax authorities for years prior to 2018. We are currently under examination in certain local Canadian tax jurisdictions. However, we do not anticipate any material adjustments.
We had no unrecognized tax benefits as of December 31, 2025 or 2024. Due to the net operating loss carryover provision, coupled with the lack of any unrecognized tax benefits, we have not provided for any interest or penalties associated with any unrecognized tax benefits. If interest and penalties were to be assessed, our policy is to charge interest to interest expense, and penalties to other operating expense. It is not anticipated that there will be any significant changes to unrecognized tax benefits within the next 12 months.
On July 4, 2025, the One Big Beautiful Bill Act (the “OBBBA”) was enacted in the U.S. The OBBBA permanently extends multiple tax provisions of the 2017 Tax Cuts and Jobs Act, as well as repeals, modifies and introduces various other tax provisions including, but not limited to federal bonus depreciation and current deductions for domestic research and development expenditures. We have elected bonus depreciation for the year-ended 2025 and do not anticipate that the other items in the OBBBA will have a material impact on the Company's consolidated financial statements. We continue to evaluate the impact the OBBBA may have on the Company as the legislation has various future effective dates.
Pillar Two is a global tax framework that establishes a 15% minimum effective tax rate and was developed by the Organization for Economic Co-operation and Development (“OECD”). In 2024, Canada enacted its Global Minimum Tax Act (“GMTA”) which implements Pillar Two. Due to the Company’s worldwide projected revenue for the year ended 2025 we anticipate we will fall within the scope of Pillar Two rules beginning on January 1, 2026. The Company primarily operates in jurisdictions with a tax rate exceeding 15% and does not anticipate a material impact on its financial statements. The Company will continue to monitor developments and evaluate the potential impact of Pillar Two in future periods.
Note 9: Income (Loss) per Common Share
We calculate basic income (loss) per share using, as the denominator, the weighted average number of common shares outstanding during the period. Diluted income (loss) per share uses, as its denominator, the weighted average number of common shares outstanding during the period plus the effect of potential dilutive common shares during the period using the treasury stock method for options, warrants, performance based and restricted stock units, and if-converted method for convertible preferred shares.
Potential dilutive common shares include outstanding unvested restricted stock unit awards, deferred restricted stock units, performance based units, warrants and convertible preferred stock (collectively referred to as dilutive units) for periods in which we have reported net income. The 2024 dilutive units exclude the impact of 2,068,000 warrants exercisable at $8.02 per warrant, due to their anti-dilutive impact. For periods in which we reported net losses, potential dilutive units are excluded, as their conversion and exercise would not reduce earnings per share. Under the if-converted method, preferred shares would not dilute earnings per share in any of the periods presented.
The following table represents net income (loss) per common share – basic and diluted (in thousands, except income (loss) per share):
|
|
|
|
|
|
|
|
|
|
|
|
|
|
|
Year ended December 31, |
|
|
|
2025 |
|
|
2024 |
|
|
2023 |
|
|
|
|
|
|
|
|
|
|
|
Numerator |
|
|
|
|
|
|
|
|
|
Income (loss) from continuing operations |
|
$ |
258,059 |
|
|
$ |
50,235 |
|
|
$ |
(40,247 |
) |
Income (loss) from discontinued operations |
|
|
63,653 |
|
|
|
(14,433 |
) |
|
|
(43,970 |
) |
Preferred stock dividends |
|
|
(552 |
) |
|
|
(552 |
) |
|
|
(552 |
) |
Net income (loss) applicable to common stockholders |
|
$ |
321,160 |
|
|
$ |
35,250 |
|
|
$ |
(84,769 |
) |
|
|
|
|
|
|
|
|
|
|
Denominator |
|
|
|
|
|
|
|
|
|
Basic weighted average common shares |
|
|
651,965 |
|
|
|
620,848 |
|
|
|
605,668 |
|
Dilutive units |
|
|
3,803 |
|
|
|
1,687 |
|
|
|
— |
|
Diluted weighted average common shares |
|
|
655,768 |
|
|
|
622,535 |
|
|
|
605,668 |
|
|
|
|
|
|
|
|
|
|
|
Basic income (loss) per share: |
|
|
|
|
|
|
|
|
|
Income from continuing operations after preferred dividends |
|
$ |
0.39 |
|
|
$ |
0.08 |
|
|
$ |
(0.07 |
) |
Income (loss) from discontinued operations |
|
|
0.10 |
|
|
|
(0.02 |
) |
|
|
(0.07 |
) |
Basic net income (loss) per common share after preferred dividends |
|
$ |
0.49 |
|
|
$ |
0.06 |
|
|
$ |
(0.14 |
) |
|
|
|
|
|
|
|
|
|
|
Diluted income (loss) per share: |
|
|
|
|
|
|
|
|
|
Income from continuing operations after preferred dividends |
|
$ |
0.39 |
|
|
$ |
0.08 |
|
|
$ |
(0.07 |
) |
Income (loss) from discontinued operations |
|
|
0.10 |
|
|
|
(0.02 |
) |
|
|
(0.07 |
) |
Diluted net income (loss) per common share after preferred dividends |
|
$ |
0.49 |
|
|
$ |
0.06 |
|
|
$ |
(0.14 |
) |
For the year ended December 31, 2023, 3,616,006 outstanding dilutive units were excluded from the computation of diluted loss per share, as our reported net loss would cause their conversion and exercise to have no effect on the calculation of loss per share.
Note 10: Debt, Credit Facility and Leases
Debt Summary
Our debt as of December 31, 2025 and 2024 consisted of our outstanding 7.25% Senior Notes due February 15, 2028 (“Senior Notes”) and any drawn amounts on our $225 million Credit Agreement. At December 31, 2024, our debt also included our Investissement Quebec Series 2020-A Senior Notes due July 9, 2025 (the “IQ Notes”). These debt arrangements are discussed further below. The following tables summarize our current and long-term debt balances, including principal amounts outstanding under the Credit Agreement, as of December 31, 2025 and 2024 (in thousands):
|
|
|
|
|
|
|
December 31, 2025 |
|
|
|
Senior Notes |
|
Principal |
|
$ |
263,000 |
|
Unamortized discount and issuance costs |
|
|
(1,053 |
) |
Long-term debt |
|
|
261,947 |
|
|
|
|
|
|
|
|
|
|
|
|
|
|
|
|
|
|
|
|
December 31, 2024 |
|
|
|
Senior Notes |
|
|
IQ Notes |
|
|
Credit Agreement |
|
|
Total |
|
Principal |
|
$ |
475,000 |
|
|
$ |
33,525 |
|
|
$ |
23,000 |
|
|
$ |
531,525 |
|
Unamortized discount/premium and issuance costs |
|
|
(2,816 |
) |
|
|
92 |
|
|
|
|
|
|
(2,724 |
) |
Total debt |
|
$ |
472,184 |
|
|
$ |
33,617 |
|
|
$ |
23,000 |
|
|
$ |
528,801 |
|
Less: current debt |
|
|
— |
|
|
|
(33,617 |
) |
|
|
— |
|
|
|
(33,617 |
) |
Long-term debt |
|
$ |
472,184 |
|
|
$ |
— |
|
|
$ |
23,000 |
|
|
$ |
495,184 |
|
The following table summarizes the scheduled annual future payments, including interest, for the Senior Notes as of December 31, 2025 (in thousands).
|
|
|
|
|
|
|
Senior Notes |
|
2026 |
|
$ |
19,068 |
|
2027 |
|
|
19,068 |
|
2028 |
|
|
265,403 |
|
Total |
|
$ |
303,539 |
|
Senior Notes
On February 19, 2020, we completed an offering of $475 million in aggregate principal amount of our Senior Notes under our shelf registration statement previously filed with the Securities and Exchange Commission. The Senior Notes are governed by the Indenture, dated as of February 19, 2020, as amended, among Hecla and certain of our subsidiaries and The Bank of New York Mellon Trust Company, N.A., as trustee. On March 19, 2020, the net proceeds from the offering of the Senior Notes ($469.5 million) were used, together with cash on hand, to redeem all of our previously-outstanding 6.875% Senior Notes that were due in 2021 (the "2021 Notes.")
The Senior Notes were recorded net of a 1.16% initial purchaser discount totaling $5.5 million. The Senior Notes bear interest at a rate of 7.25% per year from the date of issuance or from the most recent payment date on which interest has been paid or provided for. Interest on the Senior Notes is payable on February 15 and August 15 of each year, commencing August 15, 2020. During 2025, 2024 and 2023, interest expense on the statement of operations and comprehensive income (loss) related to the Senior Notes and amortization of the initial purchaser discount and fees related to the issuance of the Senior Notes totaled $34.6 million, $35.4 million and $34.4 million, respectively.
The Senior Notes are guaranteed on a senior unsecured basis by certain of our subsidiaries (the “Guarantors”). The Senior Notes and the guarantees are, respectively, Hecla's and the Guarantors' general senior unsecured obligations and are subordinated to all of Hecla's and the Guarantors' existing and future secured debt to the extent of the assets securing that secured debt. In addition, the Senior Notes are effectively subordinated to all of the liabilities of Hecla's subsidiaries that are not guaranteeing the Senior Notes, to the extent of the assets of those subsidiaries.
Since February 15, 2023, the Senior Notes are redeemable in whole or in part, on the redemption dates specified in the Indenture, at the following redemption prices (expressed as a percentage of the principal amount) plus accrued interest, if any, to the redemption date: (i) 105.438% for the twelve-month period beginning after February 15, 2023, (ii) 103.625% for the twelve-month period beginning after February 15, 2024, (iii) 101.813% for the twelve-month period beginning after February 15, 2025, and (iv) 100.0% after February 15, 2026. Since February 15, 2023, we may redeem up to 35% of the Senior Notes with the net cash proceeds of certain equity offerings. During 2025, we redeemed $212 million of our Senior Notes for a total payment of $216.0 million, including $3.8 million as a call premium and $0.2 million of interest. The partial redemption of the Senior Notes resulted in a loss on extinguishment of $4.9 million, of which $3.8 million related to the call premium and $1.1 million related to the pro-rata expensing of deferred debt issuance costs, which was recorded as part of interest expense on the statement of operations and comprehensive income (loss).
Upon the occurrence of a change of control (as defined in the Indenture), each holder of Senior Notes will have the right to require us to purchase all or a portion of such holder's Senior Notes pursuant to a change of control offer (as defined in the Indenture), at a purchase price equal to 101% of the principal amount thereof plus accrued and unpaid interest, if any, to the date of purchase, subject to the rights of holders of the Senior Notes on the relevant record date to receive interest due on the relevant interest payment date.
IQ Notes
On July 9, 2020, we entered into a note purchase agreement pursuant to which we issued CAD$50 million (USD$36.8 million at the time of the transaction) in aggregate principal amount of our IQ Notes to Investissement Québec, a financing arm of the Québec government. The IQ Notes were issued at a premium of 103.65%, or CAD$1.8 million, implying an effective annual yield of 5.74% and an aggregate principal amount to be repaid of CAD$48.2 million. The IQ Notes bore interest on amounts outstanding at a rate of 6.515% per year, payable on January 9 and July 9 of each year, commencing January 9, 2021.
On July 9, 2025, we repaid the IQ Notes, for a total payment of $34.7 million, including interest of $1.1 million and net of hedging. During 2025, 2024 and 2023, interest expense related to the IQ Notes, including premium and origination fees, totaled $1.1 million, $2.2 million and $2.3 million, respectively.
Credit Agreement
On July 21, 2022, we entered into a revolving credit agreement (the "Original Credit Agreement") with various financial institutions (the “Lenders”), Bank of Montreal and Bank of America, N.A. as letters of credit issuers, and Bank of America, N.A., as administrative agent for the Lenders and as swingline lender. The Original Credit Agreement was amended on May 3, 2024, when we
entered into a First Amendment to Credit Agreement (the “First Amendment”), which made certain changes to the Original Credit Agreement (the Original Credit Agreement, as amended, modified and supplemented by the First Amendment, is referred to hereafter as the “Credit Agreement”). The First Amendment modified the Original Credit Agreement as follows:
•Increased the amount available for borrowing to $225 million from $150 million, plus a $75 million accordion option;
•Extended the maturity date to July 21, 2028 from July 21, 2026 (the maturity date of the Credit Agreement will be accelerated to August 15, 2027 if our Senior Notes are not refinanced by that date);
•National Bank, TD Securities, Bank of Nova Scotia and ING were added as new Lenders and Credit Suisse AG, New York Branch assigned its interests in the Original Credit Agreement to its affiliate UBS AG, Stamford Branch immediately prior to entering into the First Amendment.
Proceeds of the revolving loans under the Credit Agreement may be used for general corporate purposes. The interest rate on the outstanding loans under the Credit Agreement is based on the Company’s net leverage ratio and is calculated at (i) Term Secured Overnight Financing Rate ("SOFR") plus 2% to 3.5% or (ii) Bank of America’s Base Rate plus 1% to 2.5% with Base Rate being the 14 highest of (i) the Bank of America prime rate, (ii) the Federal Funds rate plus .50% or (iii) Term SOFR plus 1.00%. For each amount drawn, we elect whether we draw on a one, three or six month basis or annual basis for SOFR. If we elect to draw for greater than six months, we pay interest quarterly on the outstanding amount.
We are also required to pay a commitment fee of between 0.45% to 0.78750%, depending on our net leverage ratio. Letters of credit issued under the Credit Agreement bear a fee between 2.00% and 3.50% based on our net leverage ratio, as well as a fronting fee to each issuing bank at an agreed upon rate per annum on the average daily dollar amount of our letter of credit exposure.
Hecla Mining Company and certain of our subsidiaries are the borrowers under the Credit Agreement, while certain of our other subsidiaries are guarantors of the borrowers’ obligations under the Credit Agreement. As further security, the Credit Agreement is collateralized by a mortgage on the Greens Creek mine, the equity interests of subsidiaries that own the Greens Creek mine or are part of the Greens Creek Joint Venture and our subsidiary Hecla Admiralty Company (the “Greens Creek Group”), and by all of the Greens Creek Group’s rights and interests in the Greens Creek Joint Venture Agreement, and in all assets of the joint venture and of any member of the Greens Creek Group.
As of December 31, 2025, $6.7 million (2024: $6.2 million) was used for letters of credit, and no amount (2024: $23.0 million) was drawn on the facility leaving $218.3 million available for borrowing.
We believe we were in compliance with all covenants under the Credit Agreement as of December 31, 2025.
Finance Leases
We have entered into various lease agreements, primarily for equipment at our operations, which we have determined to be finance leases. At December 31, 2025, the total liability associated with the finance leases, including certain purchase option amounts, was $5.5 million (2024: $11.5 million), with $4.3 million (2024: $5.5 million) of the liability classified as current and $2.4 million (2024: $8.2 million) classified as non-current. The assets related to these leases are recorded in properties, plants, equipment and mine development, net, on our consolidated balance sheets and totaled $0.4 million as of December 31, 2025 (2024: $4.4 million), net of accumulated depreciation. Expense during 2025, 2024 and 2023 related to finance leases included $4.7 million, $6.0 million and $11.6 million, respectively, for amortization of the related assets, and $0.2 million, $0.4 million and $0.3 million, respectively, for interest expense. The total obligation for future minimum finance lease payments was $5.7 million as of December 31, 2025, with $0.2 million attributed to interest. Our finance leases as of December 31, 2025 had a weighted average remaining term of 1.2 years (2024: 1.6 years) and a weighted average discount rate of 4.5% (2024: 6.1%).
At December 31, 2025, the annual maturities of finance lease commitments, including interest, were (in thousands):
|
|
|
|
|
Twelve-month period ending December 31, |
|
|
|
2026 |
|
$ |
4,468 |
|
2027 |
|
|
1,247 |
|
Total |
|
|
5,715 |
|
Less: effect of interest |
|
|
(229 |
) |
Net finance lease obligation |
|
$ |
5,486 |
|
Operating Leases
We have entered into various lease agreements, primarily for equipment, buildings and other facilities, and land at our operations and corporate offices, which we have determined to be operating leases. Some of the operating leases allow for extension of the lease
beyond the current term at our option. We have considered the likelihood and estimated duration of the extension options in determining the lease term for measurement of the liability and right-of-use asset. For our operating leases as of December 31, 2025, we have assumed a weighted average discount rate of 5.5% (2024: 5.7%). As of December 31, 2025, the total liability balance associated with the operating leases was $9.3 million (2024: $8.0 million), with $1.1 million (2024: $0.9 million) of the liability classified as current as part of Other Current Liabilities and the remaining $8.2 million (2024: $7.1 million) classified as non-current as part of Other Non-Current Liabilities on our balance sheet. The right-of-use assets for our operating leases are recorded as a non-current asset on our consolidated balance sheets and totaled $8.9 million and $7.5 million as of December 31, 2025 and 2024, respectively. During 2025, 2024 and 2023, operating lease expense, and cash paid for operating leases included in net cash provided by operating activities, totaled $3.8 million, $3.8 million and $3.1 million, respectively. The weighted-average remaining lease term for our operating leases as of December 31, 2025 was 6.1 years (2024: 7.3 years).
At December 31, 2025, the annual maturities of undiscounted operating lease payments, including assumed extensions beyond the current lease terms, were (in thousands):
|
|
|
|
|
Twelve-month period ending December 31, |
|
|
|
2026 |
|
$ |
1,501 |
|
2027 |
|
|
1,485 |
|
2028 |
|
|
1,489 |
|
2029 |
|
|
1,494 |
|
2030 |
|
|
1,127 |
|
More than 5 years |
|
|
5,060 |
|
Total |
|
|
12,156 |
|
Less: effect of discounting |
|
|
(2,862 |
) |
Operating lease liability |
|
$ |
9,294 |
|
Note 11: Derivative Instruments
General
Our current risk management policy provides that up to 75% of five years of our foreign currency, lead and zinc metals price and silver and gold price exposure may be covered under a derivatives program with certain other limitations. Our program also utilizes derivatives to manage price risk exposure created from when revenue is recognized from a shipment of concentrate until final settlement.
These instruments expose us to (i) credit risk in the form of non-performance by counterparties for contracts in which the contract price exceeds the spot price of the hedged commodity or foreign currency and (ii) price risk to the extent that the spot price or currency exchange rate exceeds the contract price for quantities of our production and/or forecasted costs covered under contract positions.
Foreign Currency
Our wholly-owned subsidiaries owning our Keno Hill operation are USD-functional entities which routinely incur expenses denominated in CAD. Such expenses expose us to exchange rate fluctuations between the USD and CAD. We have a program to manage our exposure to fluctuations in the USD exchange rate for these subsidiaries' future operating and capital costs denominated in CAD. The program related to forecasted cash operating costs at Keno Hill utilizes forward contracts to buy CAD, some of which are designated as cash flow hedges. As of December 31, 2025, we have a total of 165 forward contracts outstanding to buy a total of CAD $101.6 million having a notional amount of USD$73.1 million with CAD-to-USD exchange rates ranging between 1.3148 and 1.4202, with the following exposures for 2026:
•Forecasted cash operating costs of CAD $59.5 million at an average CAD to USD exchange rate of 1.377.
•Forecasted capital expenditures of CAD $37.5 million at an average CAD-to-USD exchange rate of 1.390.
•Forecasted exploration expenditures of CAD$3.3 million at an average CAD-to-USD exchange rate of 1.383.
•Forecasted Corporate costs of CAD$1.3 million at an average CAD-to-USD exchange rate of 1.354.
As of December 31, 2025 and 2024, we recorded the following balances for the fair value of the contracts (in millions):
|
|
|
|
|
|
|
|
|
|
|
December 31, |
|
Balance sheet line item: |
|
2025 |
|
|
2024 |
|
Other current assets |
|
$ |
1.1 |
|
|
$ |
— |
|
Other non-current assets |
|
|
— |
|
|
|
— |
|
Current derivative liabilities |
|
|
(0.8 |
) |
|
|
(2.4 |
) |
Non-current derivative liabilities |
|
|
— |
|
|
|
(0.4 |
) |
Net unrealized losses of approximately $0.9 million related to the effective portion of the hedges were included in accumulated other comprehensive income (loss) as of December 31, 2025. Unrealized gains and losses will be transferred from accumulated other comprehensive loss to discontinued as the underlying operating expenses are recognized. We estimate approximately $0.9 million in net unrealized losses included in accumulated other comprehensive income (loss) as of December 31, 2025 will be reclassified to discontinued operations in the next twelve months.
For the year ended December 31, 2025, net realized losses of approximately $4.1 million (2024 and 2023: net realized losses of $3.8 million and $3.6 million, respectively), on contracts related to underlying expenses which have been recognized were transferred from accumulated other comprehensive loss and included discontinued operations. For the year ended December 31, 2025, net realized gains of approximately $4.8 million (2024: net unrealized losses of $5.7 million; 2023: net unrealized gains of $1.2 million) related to contracts not designated as hedges and no net unrealized gains or losses related to ineffectiveness of the hedges were included in fair value adjustments, net on our consolidated statements of operations and comprehensive income (loss).
Metals Prices
We currently use some combination of financially-settled forward contracts, Collars or put options to manage the exposure to:
•changes in prices of silver, gold, zinc, and lead contained in our concentrate shipments between the time of shipment and final settlement; and
•changes in prices of zinc, lead, silver, and gold contained in our forecasted future concentrate shipments.
The following tables summarize the quantities of metals committed under forward sales contracts at December 31, 2025 and 2024:
|
|
|
|
|
|
|
|
|
|
|
|
|
|
|
|
|
December 31, 2025 |
|
Pounds under contract (in 000's) |
|
|
Average price per pound |
|
|
|
Zinc |
|
|
Lead |
|
|
Zinc |
|
|
Lead |
|
|
|
(pounds) |
|
|
(pounds) |
|
|
(pounds) |
|
|
(pounds) |
|
Contracts on provisional sales |
|
|
|
|
|
|
|
|
|
|
|
|
2026 settlements |
|
|
18,850 |
|
|
|
13,117 |
|
|
$ |
1.37 |
|
|
$ |
1.05 |
|
Contracts on forecasted sales |
|
|
|
|
|
|
|
|
|
|
|
|
2026 settlements |
|
|
53,407 |
|
|
|
42,108 |
|
|
$ |
1.33 |
|
|
$ |
1.02 |
|
2027 settlements |
|
|
23,810 |
|
|
|
— |
|
|
$ |
1.36 |
|
|
N/A |
|
|
|
|
|
|
|
|
|
|
|
|
|
|
|
|
|
|
|
|
|
|
|
|
|
|
|
|
|
|
|
|
|
|
December 31, 2024 |
|
Ounces/pounds under contract (in 000's) |
|
|
Average price per ounce/pound |
|
|
|
Silver |
|
|
Gold |
|
|
Zinc |
|
|
Lead |
|
|
Silver |
|
|
Gold |
|
|
Zinc |
|
|
Lead |
|
|
|
(ounces) |
|
|
(ounces) |
|
|
(pounds) |
|
|
(pounds) |
|
|
(ounces) |
|
|
(ounces) |
|
|
(pounds) |
|
|
(pounds) |
|
Contracts on provisional sales |
|
|
|
|
|
|
|
|
|
|
|
|
|
|
|
|
|
|
|
|
|
|
|
|
2024 settlements |
|
|
1,535 |
|
|
|
2 |
|
|
|
20,834 |
|
|
|
14,661 |
|
|
$ |
31.46 |
|
|
$ |
2,673 |
|
|
$ |
1.40 |
|
|
$ |
0.97 |
|
Contracts on forecasted sales |
|
|
|
|
|
|
|
|
|
|
|
|
|
|
|
|
|
|
|
|
|
|
|
|
2024 settlements |
|
|
— |
|
|
|
— |
|
|
|
59,194 |
|
|
|
47,840 |
|
|
N/A |
|
|
N/A |
|
|
$ |
1.39 |
|
|
$ |
0.99 |
|
2025 settlements |
|
|
— |
|
|
|
— |
|
|
|
6,283 |
|
|
|
52,911 |
|
|
N/A |
|
|
N/A |
|
|
$ |
1.41 |
|
|
$ |
1.03 |
|
We designate the contracts for lead and zinc contained in our forecasted future shipments as hedges for accounting purposes, with gains and losses deferred to accumulated other comprehensive loss until the hedged product ships. The forward contracts for silver and gold contained in our concentrate shipments have not been designated as hedges and are marked-to-market through earnings each period.
Since the first quarter of 2025, we have and continue to utilize Collars to manage our exposure to changes in the price of precious metals in both our provisional concentrate sales and forecasted Keno Hill future concentrate shipments. These Collars provide us a contractual right to receive at least the minimum price if market prices fall below the minimum price level specified in the contracts, while limiting our potential gains to the maximum price level specified in the contracts, even if market prices rise higher. This strategy helps protect us from significant price drops while still allowing for some upside potential within the minimum and maximum price range. For the year ending December 31, 2025, these collars had net losses of $51.5 million. For accounting purposes, they are not designated as hedges. The following tables summarize the quantities of metals hedged under Collars at December 31, 2025:
|
|
|
|
|
|
|
|
|
|
|
|
|
|
|
|
|
|
|
|
|
|
|
|
|
Settlement Period |
|
Production Protected |
|
|
Average strike price per silver ounce |
|
|
Average strike price per gold ounce |
|
|
|
Silver (ounces) |
|
|
Gold (ounces) |
|
|
Minimum ($) |
|
|
Maximum ($) |
|
|
Minimum ($) |
|
|
Maximum ($) |
|
Contracts on provisional sales |
|
|
|
|
|
|
|
|
|
|
|
|
|
|
|
|
|
|
2026 settlements |
|
|
2,120 |
|
|
|
— |
|
|
|
49.78 |
|
|
|
63.43 |
|
|
N/A |
|
|
N/A |
|
Contracts on forecasted sales |
|
|
|
|
|
|
|
|
|
|
|
|
|
|
|
|
|
|
2026 settlements |
|
|
800 |
|
|
|
4 |
|
|
|
34.29 |
|
|
|
55.70 |
|
|
|
3,000 |
|
|
|
4,840 |
|
In December 2025, we entered into financially-settled put option contracts to manage the exposure of future silver sales to potential declines in market prices of silver. These put options give us the option, but not the obligation, to realize established prices on quantities of silver to be sold in the future. Total premium paid for the put contracts was $25 million and we recorded a $10.4 million unrealized loss on the puts during the year ending December 31, 2025. The following table summarizes the quantities of metals for which we have entered into put contracts and the average exercise prices as of December 31, 2025:
|
|
|
|
|
|
|
|
|
Settlement Period |
|
Production Protected |
|
|
Strike price per ounce |
|
|
|
Silver (ounces in 000's) |
|
|
($) |
|
Contracts on forecasted sales |
|
|
|
|
|
|
2026 settlements |
|
|
9,672 |
|
|
|
50.00 |
|
At December 31, 2025 and 2024, we recorded the following balances for the fair value of derivative contracts held at that time (in millions):
|
|
|
|
|
|
|
|
|
|
|
|
|
|
|
|
|
|
|
|
|
|
|
|
|
|
|
December 31, 2025 |
|
|
December 31, 2024 |
|
Balance sheet line item: |
|
Contracts in an asset position |
|
|
Contracts in a liability position |
|
|
Net asset (liability) |
|
|
Contracts in an asset position |
|
|
Contracts in a liability position |
|
|
Net asset (liability) |
|
Other current assets |
|
$ |
8.6 |
|
|
$ |
— |
|
|
$ |
8.6 |
|
|
$ |
11.5 |
|
|
$ |
— |
|
|
$ |
11.5 |
|
Other non-current assets |
|
|
7.2 |
|
|
|
— |
|
|
|
7.2 |
|
|
|
6.6 |
|
|
|
— |
|
|
|
6.6 |
|
Current derivatives liability |
|
|
— |
|
|
|
(36.4 |
) |
|
|
(36.4 |
) |
|
|
— |
|
|
|
— |
|
|
|
— |
|
Other non-current liability |
|
|
— |
|
|
|
(1.9 |
) |
|
|
(1.9 |
) |
|
|
— |
|
|
|
— |
|
|
|
— |
|
Net realized and unrealized gains of approximately $0.2 million related to the effective portion of the contracts designated as hedges were included in accumulated other comprehensive loss as of December 31, 2025. Realized and unrealized gains and losses will be transferred from accumulated other comprehensive loss to current earnings as the underlying forecasted sales transaction is recognized. We estimate approximately $1.1 million in net realized and unrealized gains included in accumulated other comprehensive loss as of December 31, 2025 will be reclassified to current earnings in the next twelve months.
We recognized a net loss of $12.0 million, including a $13.1 million gain transferred from accumulated other comprehensive income (loss), during 2025 on the contracts utilized to manage exposure to prices of metals in our concentrate shipments, which is included in sales. The net gain recognized on the contracts offsets loss related to price adjustments on our provisional concentrate sales, both of which resulted from changes to silver, gold, lead and zinc prices between the time of sale and final settlement.
We recognized a net gain of $1.3 million, including a $11.4 million gain transferred from accumulated other comprehensive income (loss), during 2024 on the contracts utilized to manage exposure to prices of metals in our concentrate shipments, which is included in sales. The net gain recognized on the contracts offsets loss related to price adjustments on our provisional concentrate sales, both of which resulted from changes to silver, gold, lead and zinc prices between the time of sale and final settlement.
We recognized a net gain of $19.7 million during 2023 on the contracts utilized to manage exposure to prices of metals in our concentrate shipments, which is included in sales. The net gain recognized on the contracts offsets loss related to price adjustments on our provisional concentrate sales, both of which resulted from changes to silver, gold, lead and zinc prices between the time of sale and final settlement.
Credit-risk-related Contingent Features
Certain of our derivative contracts contain cross default provisions which provide that a default under our revolving credit agreement would cause a default under the derivative contract. As of December 31, 2025, we have not posted any collateral related to these contracts. The fair value of derivatives in a net liability position related to these arrangements was $43.6 million as of December 31, 2025, and includes accrued interest but excludes any adjustment for nonperformance risk. If we were in breach of any of these provisions at December 31, 2025, we could have been required to settle our obligations under the agreements at their termination value of $43.6 million.
Note 12: Fair Value Measurement
Fair value adjustments, net is comprised of the following (in thousands):
|
|
|
|
|
|
|
|
|
|
|
|
|
|
|
Year Ended December 31, |
|
|
|
2025 |
|
|
2024 |
|
|
2023 |
|
(Loss) gain on derivative contracts |
|
$ |
(43,568 |
) |
|
$ |
(162 |
) |
|
$ |
1,978 |
|
Unrealized gain (loss) on investments in equity securities |
|
|
40,914 |
|
|
|
3,703 |
|
|
|
(243 |
) |
Gain on disposition or exchange of investments |
|
|
10,986 |
|
|
|
— |
|
|
|
— |
|
Total fair value adjustments, net |
|
$ |
8,332 |
|
|
$ |
3,541 |
|
|
$ |
1,735 |
|
Accounting guidance has established a hierarchy for inputs used to measure assets and liabilities at fair value on a recurring basis. The fair value hierarchy gives the highest priority to unadjusted quoted prices in active markets for identical assets and liabilities (Level 1) and the lowest priority to unobservable inputs (Level 3). The three levels included in the hierarchy are:
Level 1: quoted prices in active markets for identical assets or liabilities;
Level 2: significant other observable inputs; and
Level 3: significant unobservable inputs.
The table below sets forth our assets and liabilities (in thousands) that were accounted for at fair value on a recurring basis and the fair value calculation input hierarchy level that we have determined applies to each asset and liability category. See Note 7 for information on the fair values of our defined benefit pension plan assets.
|
|
|
|
|
|
|
|
|
|
|
|
|
Balance at
December 31,
2025 |
|
|
Balance at
December 31,
2024 |
|
|
Input
Hierarchy
Level |
Assets: |
|
|
|
|
|
|
|
|
Cash and cash equivalents: |
|
|
|
|
|
|
|
|
Money market funds and other bank deposits |
|
$ |
241,558 |
|
|
$ |
26,868 |
|
|
Level 1 |
Current and non-current investments: |
|
|
|
|
|
|
|
|
Equity securities |
|
|
107,486 |
|
|
|
33,158 |
|
|
Level 1 |
Trade accounts receivable: |
|
|
|
|
|
|
|
|
Receivables from provisional concentrate sales |
|
|
170,230 |
|
|
|
31,515 |
|
|
Level 2 |
Derivative contracts - other current assets and other non-current assets: |
|
|
|
|
|
|
|
|
Metal forward contracts |
|
|
15,840 |
|
|
|
18,039 |
|
|
Level 2 |
Foreign exchange contracts |
|
|
1,127 |
|
|
|
— |
|
|
Level 2 |
Restricted cash and cash equivalents balances: |
|
|
|
|
|
|
|
|
Certificates of deposit and other deposits |
|
|
1,174 |
|
|
|
1,177 |
|
|
Level 1 |
|
|
|
|
|
|
|
|
|
Liabilities |
|
|
|
|
|
|
|
|
Derivative contracts - current and non-current derivative liabilities: |
|
|
|
|
|
|
|
|
Metal forward contracts |
|
$ |
38,273 |
|
|
$ |
— |
|
|
Level 2 |
Foreign exchange contracts |
|
|
829 |
|
|
|
10,176 |
|
|
Level 2 |
Cash and cash equivalents consist primarily of money market funds which are carried at fair value.
Current and non-current restricted cash and cash equivalents balances consist primarily of certificates of deposit, U.S. Treasury securities, and other deposits which are carried at fair value.
Our current and non-current investments consist of marketable equity securities of companies in the mining industry which are valued using quoted market prices for each security.
Trade accounts receivable include amounts due to us for shipments of concentrates, doré, metals sold from doré, and carbon material sold to customers. Revenues and the corresponding accounts receivable for sales of metals products are recorded when title and risk of loss transfer to the customer (generally at the time of ship loading, or at the time of arrival at the customer for trucked products). Sales of concentrates are recorded using estimated forward prices for the anticipated month of settlement applied to our estimate of payable metal quantities contained in each shipment. Sales are recorded net of estimated treatment and refining charges, which are also impacted by changes in metals prices and quantities of contained metals. We estimate the prices at which sales of our concentrates will be settled due to the time elapsed between shipment and final settlement with the customer. Receivables for previously recorded concentrate sales are adjusted to reflect estimated forward metals prices at the end of each period until final settlement by the customer. We obtain the forward metals prices used each period from a pricing service. Changes in metals prices between shipment and final settlement result in changes to revenues previously recorded upon shipment.
We use financially-settled forward contracts to manage exposure to changes in the exchange rate between the USD and CAD, and the impact on CAD-denominated operating and capital costs incurred at our Keno Hill development project (see Note 11 for more information). The contracts related to operating costs qualify for hedge accounting, while the contracts related to capital costs have not been designated as hedges. Unrealized gains and losses related to the effective portion of the contracts designated as hedges are included in accumulated other comprehensive loss, and unrealized gains and losses related to the contracts not designated as hedges and the ineffective portion of the contracts designated as hedges are included in earnings each period. The fair value of each contract represents the present value of the difference between the forward exchange rate for the contract settlement period as of the measurement date and the contract settlement exchange rate.
We use some combination of financially-settled forward contracts and commodity price collars to manage the exposure to changes in prices of silver, gold, zinc and lead contained in our concentrate shipments that have not reached final settlement. We also use financially-settled forward contracts, commodity price collars and silver put options to manage the exposure to changes in prices of silver, gold, lead and zinc contained in our forecasted future concentrate shipments (see Note 11 for more information). The derivative instruments for silver and gold contained in our concentrate shipments have not been designated as hedges and are marked-to-market through earnings each period. The fair value of each forward contract represents the present value of the difference between the forward metal price for the contract settlement period as of the measurement date and the contract settlement metal price.
At December 31, 2025, our Senior Notes were recorded at their carrying value of $261.9 million, net of unamortized initial purchaser discount and issuance costs. The estimated fair values of our Senior Notes were $264.7 million at December 31, 2025. Quoted prices, which we consider to be Level 1 inputs, are utilized to estimate the fair value of the Senior Notes. The credit agreement, which we consider to be Level 1 in the fair value hierarchy, has a carrying and fair value of nil as no amounts were drawn at December 31, 2025. See Note 12 for more information.
Note 13: Stockholders’ Equity
Authorized Share Capital
At our annual meeting of shareholders on May 21, 2025, our stockholders approved an amendment to our restated certification of incorporation increasing the number of authorized shares of our common stock from 750,000,000 to 1,250,000,000.
Common Stock
Subject to the rights of the holders of any outstanding shares of preferred stock, each share of common stock is entitled to: (i) one vote on all matters presented to the stockholders, with no cumulative voting rights; (ii) receive such dividends as may be declared by the Board of Directors out of funds legally available therefor; and (iii) in the event of our liquidation or dissolution, share ratably in any distribution of our assets.
Dividends
In September 2011 and February 2012, our Board of Directors (“Board”) adopted a common stock dividend policy that had two components: (1) a dividend that links the amount of dividends on our common stock to our average quarterly realized silver price in the preceding quarter, and (2) a minimum annual dividend of $0.01 per share of common stock, in each case, payable quarterly, if and when declared. In September 2020, we amended the dividend policy to (1) reduce the minimum quarterly realized silver price threshold for the first component above from $30 per ounce to $25 per ounce, and (2) increased the minimum annual dividend from $0.01 per share to $0.015 per share. In each of May and September 2021, our Board approved an increase in our silver-linked dividend policy by $0.01 per year, and in September 2021 also approved a reduction in the minimum realized silver price threshold to $20 from $25 per ounce.
In early February 2025, we revised our common stock dividend policy to eliminate the silver-linked component while maintaining the annual common stock dividend, however the declaration and payment of dividends remain in the sole discretion of our Board of Directors, and there can be no assurance it will declare any future dividend.
Total quarterly common stock and preferred stock dividends declared by our Board for the years ended December 31, 2025, 2024 and 2023 amounted to $10.3 million, $25.5 million and $15.7 million respectively. The common stock dividend declared by the Board in the third quarter of 2020 and each subsequent quarter with the exception of the fourth quarter of 2022 has included the silver-linked component, as the realized silver price was above the minimum thresholds applicable to each of those quarters. Prior to 2011, no dividends had been declared on our common stock since 1990.
At-The-Market Equity Distribution Agreement
Pursuant to an equity distribution agreement dated February 18, 2021, we may offer and sell up to 60 million shares of our common stock from time to time to or through sales agents in ATM offerings. Sales of the shares, if any, will be made by means of ordinary brokers transactions or as otherwise agreed between the Company and the agents as principals. Whether or not we engage in sales from time to time may depend on a variety of factors, including share price, our cash resources, customary black-out restrictions, and whether we have any material inside information. The agreement can be terminated by us at any time. Any sales of shares under the equity distribution agreement are registered under the Securities Act of 1933, as amended, pursuant to a shelf registration statement on Form S-3. During the year ended December 31, 2025, we sold 35,959,328 shares under the agreement for proceeds of $216.2 million, net of commissions and fees of $3.3 million, which were used to redeem $212 million of our Senior Notes. In total since September 2022 through December 31, 2025, we have sold 59,802,012 shares under the agreement for total proceeds of $348.5 million, net of commissions and fees of $5.4 million.
Common Stock Repurchase Program
In 2012, our Board approved a stock repurchase program under which we are authorized to repurchase up to 20 million shares of our outstanding common stock from time to time in open market or privately negotiated transactions, depending on prevailing market conditions and other factors. The repurchase program may be modified, suspended or discontinued by us at any time. As of December 31, 2025, a total of 934,100 shares have been repurchased under the program, at an average price of $3.99 per share. No shares were purchased under the program during the periods covered by these financial statements.
Preferred Stock
We have 153,956 shares (2024: 157,756 shares) of Series B Preferred Stock (“Preferred Stock”) outstanding which are listed on the New York Stock Exchange. The Preferred Stock ranks senior to our common stock with respect to dividend payments, and amounts due upon liquidation, dissolution or winding up. While the Preferred Stock remains outstanding, we cannot authorize the creation or issuance of any class or series of stock that ranks senior to the Preferred Stock with respect to dividend payments, and amounts due upon liquidation, dissolution or winding up, without the consent of 66 2/3% of the Preferred Stockholders. Preferred Stockholders are entitled to receive, when, as and if declared by our Board, an annual cash dividend of $3.50 per share of Preferred Stock, payable quarterly in arrears. Dividends are cumulative from the date of issuance, regardless of whether we have assets legally available for such payment. Total quarterly preferred stock dividends declared by our Board for the years ended December 31, 2025, 2024 and 2023 amounted to $552,000 per year, respectively. Interest is not payable on any accumulated dividends. The Preferred Stock is redeemable at our option at $50 per share of Preferred Stock, plus any unpaid dividends up to the date of redemption. The Preferred Stock has a liquidation preference of $50 per share of Preferred stock, or $7.7 million, plus an amount per share equal to all dividends undeclared and unpaid thereon to the date of final distribution. Except in limited circumstances, the Preferred Stockholders have no voting rights. Each share of Preferred Stock is convertible, in whole or in part, at the holder’s option into our common stock at a conversion price of $15.55 per common stock. During 2025, 3,541 shares of Preferred Stock were converted into 11,385 shares of our common stock.
Stock Award Plans
We use stock-based compensation plans to aid us in attracting, retaining and motivating our employees, as well as to provide incentives more directly linked to increases in stockholder value. These plans provide for the grant of options to purchase shares of our common stock, the issuance of restricted stock units, performance-based shares and other equity-based awards.
Stock-based compensation expense amounts for restricted stock units, performance based grants and common stock grants (collectively "incentive compensation") to employees, shares granted to the interim CEO (in 2024) and non-employee directors totaled $10.9 million, $8.7 million and $6.6 million for the years ended December 31, 2025, 2024 and 2023, respectively. Over the next twelve months, we expect to recognize $7.4 million in additional compensation expense as outstanding restricted stock units and performance-based shares vest.
Stock Incentive Plan
During 2010, our stockholders voted to approve the adoption of our 2010 Stock Incentive Plan and to reserve up to 20,000,000 shares of common stock for issuance under the plan. In the second quarter of 2019, our stockholders voted to approve an amendment to
the plan to restore the number of shares of common stock available for issuance under the 2010 plan to the original 20,000,000 shares (along with other changes). The Board has broad authority under the 2010 plan to fix the terms and conditions of individual agreements with participants, including the duration of the award and any vesting requirements. As of December 31, 2025, there were 7,435,880 shares available for future grant under the 2010 plan.
Directors’ Stock Plan
In 2017, we adopted the amended and restated Hecla Mining Company Stock Plan for Non-Employee Directors (the “Directors’ Stock Plan”), which may be terminated by our Board of Directors at any time. Each non-employee director is credited each year with that number of shares determined by dividing $125,000 by the average closing price for our common stock on the New York Stock Exchange for the prior calendar year. A minimum of 25% of the shares credited each year is held in trust for the benefit of each director until delivered to the director. Each director may elect, prior to the first day of the applicable year, to have a greater percentage contributed to the trust for that year. Delivery of the shares from the trust occurs upon the earliest of: (1) death or disability; (2) retirement; (3) a cessation of the director’s service for any other reason; (4) a change in control; or (5) at the election of the director at any time, provided, however, that shares must be held in the trust for at least two years prior to delivery. During 2025, 2024, and 2023, 165,025, 150,387, and 125,063 shares, respectively, were credited to the non-employee directors. During 2025, 2024, and 2023, $1.0 million, $0.8 million, and $0.7 million, respectively, was charged to general and administrative expense associated with the shares issued to the non-employee directors. During 2025, one director retired and 246,673 shares were distributed to him. At December 31, 2025, there were 1,874,764 available for grant in the future under the plan.
Restricted Stock Units
Unvested restricted stock units ("RSU") activity granted by the Board to employees are summarized as follows:
|
|
|
|
|
|
|
|
|
|
|
Shares |
|
|
Weighted Average
Grant Date Fair
Value per Share |
|
Unvested, January 1, 2023 |
|
|
1,796,115 |
|
|
$ |
4.23 |
|
Granted |
|
|
1,316,120 |
|
|
$ |
5.05 |
|
Canceled |
|
|
(336,060 |
) |
|
$ |
4.90 |
|
Vested |
|
|
(918,927 |
) |
|
$ |
5.05 |
|
Unvested, December 31, 2023 |
|
|
1,857,248 |
|
|
$ |
4.28 |
|
Granted |
|
|
1,538,407 |
|
|
$ |
5.17 |
|
Canceled |
|
|
(130,450 |
) |
|
$ |
5.00 |
|
Vested |
|
|
(908,132 |
) |
|
$ |
4.45 |
|
Unvested, December 31, 2024 |
|
|
2,357,073 |
|
|
$ |
4.76 |
|
Granted |
|
|
2,052,542 |
|
|
$ |
5.86 |
|
Canceled |
|
|
(245,736 |
) |
|
$ |
5.29 |
|
Vested |
|
|
(1,150,382 |
) |
|
$ |
4.75 |
|
Unvested, December 31, 2025 |
|
|
3,013,497 |
|
|
$ |
5.47 |
|
Unvested RSUs will be forfeited by participants upon termination of employment in advance of vesting, with the exception of termination due to retirement if certain criteria are met. At December 31, 2025, there was unrecognized compensation expense of $10.2 million related to unvested RSUs to be recognized over a weighted average period of 1.6 years. The fair value of RSUs that vested during 2025, 2024 and 2023 was $5.5 million, $4.7 million and $4.6 million, respectively.
Performance-Based Shares
We periodically grant performance-based share awards ("PSUs") to certain senior employees. The value of the PSUs (if any) is based on the ranking of the market performance of our common stock relative to the performance of the common stock of a group of peer companies over a three-year measurement period. The number of shares to be issued (if any) is based on the value of the PSUs divided by the share price at grant date. The compensation cost is measured using a Monte Carlo simulation to estimate their value at grant date, and the expense related to the performance-based awards (if any) will be recognized on a straight-line basis over the thirty months following that date of the PSUs.
Unvested PSUs activity granted by the Board to eligible employees are summarized as follows:
|
|
|
|
|
|
|
|
|
|
|
Shares |
|
|
Weighted Average
Grant Date Fair
Value per Share |
|
Unvested, January 1, 2023 |
|
|
599,858 |
|
|
$ |
5.54 |
|
Granted |
|
|
336,096 |
|
|
$ |
3.54 |
|
Canceled |
|
|
(109,727 |
) |
|
$ |
5.30 |
|
Vested (1) |
|
|
(205,425 |
) |
|
$ |
8.17 |
|
Unvested, December 31, 2023 |
|
|
620,802 |
|
|
$ |
3.63 |
|
Granted |
|
|
542,770 |
|
|
$ |
3.32 |
|
Forfeited (2) |
|
|
(290,950 |
) |
|
$ |
3.78 |
|
Unvested, December 31, 2024 |
|
|
872,622 |
|
|
$ |
3.39 |
|
Granted |
|
|
840,205 |
|
|
$ |
0.06 |
|
Vested (1) |
|
|
(354,861 |
) |
|
$ |
3.32 |
|
Cancelled |
|
|
(62,223 |
) |
|
$ |
1.22 |
|
Unvested, December 31, 2025 |
|
|
1,295,743 |
|
|
$ |
1.34 |
|
(1) Vested on December 31 and distributed in February of the following year
Unvested PSUs will be forfeited by participants upon termination of employment in advance of vesting. At December 31, 2025, there was unrecognized compensation expense of $0.9 million related to unvested PSUs to be recognized over a weighted average period of 1.6 years. The fair value of PSUs that vested on December 31, 2025 and 2023, and were distributed in February 2026 and 2024 was $6.8 million and $0.7 million, respectively.
In connection with the vesting of RSUs, PSUs and other stock grants, employees have in the past, at their election and when permitted by us, chosen to satisfy their tax withholding obligations through net share settlement, pursuant to which we withhold the number of shares necessary to satisfy such withholding obligations and pay the obligations in cash. Pursuant to such net settlements, in 2025, we withheld 151,976 shares valued at approximately $0.9 million, or $5.82 per share, in 2024, we withheld 277,966 shares valued at approximately $1.2 million, or $4.31 per share, and in 2023, we withheld 404,514 shares valued at approximately $2.0 million, or $5.03 per share.
Warrants
We have 2,068,000 warrants outstanding at December 31, 2025 and 2024, each with an exercise price of $8.02 which expire in April 2032. The warrants were issued as part of the Klondex acquisition purchase consideration in July 2018. Each warrant entitles the warrant holder to purchase one share of our common stock.
During 2024, the warrant holder of 2,068,000 warrants with an exercise price of $1.57 and an expiration date of February 2029, exercised all their warrants by means of a cashless exercise whereby 1,488,050 shares were issued.
Note 14: Accumulated Other Comprehensive Income (Loss)
The following table lists the beginning balance, yearly activity and ending balance of each component of “Accumulated Other Comprehensive Income (Loss), net” (in thousands):
|
|
|
|
|
|
|
|
|
|
|
|
|
|
|
Changes in fair value of derivative contracts designated as hedge transactions |
|
|
Adjustments
For Pension Plans |
|
|
Total
Accumulated
Other
Comprehensive
Income (Loss), Net |
|
Balance January 1, 2023 |
|
$ |
9,162 |
|
|
$ |
(6,714 |
) |
|
$ |
2,448 |
|
Other comprehensive income (loss) before reclassification |
|
|
22,384 |
|
|
|
(1,333 |
) |
|
|
21,051 |
|
Reclassification from AOCI to sales |
|
|
(18,669 |
) |
|
|
— |
|
|
|
(18,669 |
) |
Reclassification from AOCI to discontinued operations |
|
|
3,608 |
|
|
|
— |
|
|
|
3,608 |
|
Reclassification from AOCI to other expense (income) |
|
|
(1,094 |
) |
|
|
(252 |
) |
|
|
(1,346 |
) |
Provision for income taxes |
|
|
(1,683 |
) |
|
|
428 |
|
|
|
(1,255 |
) |
Net current year other comprehensive income (loss) |
|
|
4,546 |
|
|
|
(1,157 |
) |
|
|
3,389 |
|
Balance December 31, 2023 |
|
|
13,708 |
|
|
|
(7,871 |
) |
|
|
5,837 |
|
Other comprehensive loss before reclassification |
|
|
(2,930 |
) |
|
|
(11,880 |
) |
|
|
(14,810 |
) |
Reclassification from AOCI to sales |
|
|
(11,392 |
) |
|
|
— |
|
|
|
(11,392 |
) |
Reclassification from AOCI to discontinued operations |
|
|
3,786 |
|
|
|
— |
|
|
|
3,786 |
|
Reclassification from AOCI to other expense (income) |
|
|
— |
|
|
|
422 |
|
|
|
422 |
|
Provision for income taxes |
|
|
2,822 |
|
|
|
3,069 |
|
|
|
5,891 |
|
Net current year other comprehensive loss |
|
|
(7,714 |
) |
|
|
(8,389 |
) |
|
|
(16,103 |
) |
Balance December 31, 2024 |
|
|
5,994 |
|
|
|
(16,260 |
) |
|
|
(10,266 |
) |
Other comprehensive income before reclassification |
|
|
6,143 |
|
|
|
11,916 |
|
|
|
18,059 |
|
Reclassification from AOCI to sales |
|
|
(13,121 |
) |
|
|
— |
|
|
|
(13,121 |
) |
Reclassification from AOCI to discontinued operations |
|
|
4,139 |
|
|
|
— |
|
|
|
4,139 |
|
Reclassification from AOCI to fair value adjustments |
|
|
— |
|
|
|
(15,359 |
) |
|
|
(15,359 |
) |
Reclassification from AOCI to other expense (income) |
|
|
— |
|
|
|
6,407 |
|
|
|
6,407 |
|
Provision for income taxes |
|
|
(1,650 |
) |
|
|
8,457 |
|
|
|
6,807 |
|
Net current year other comprehensive (loss) income |
|
|
(4,489 |
) |
|
|
11,421 |
|
|
|
6,932 |
|
Balance December 31, 2025 |
|
$ |
1,505 |
|
|
$ |
(4,839 |
) |
|
$ |
(3,334 |
) |
See Note 7 for more information on our employee benefit plans and Note 11 for more information on our derivative instruments.
Note 15: Product Inventories
Product Inventories
Our major components of product inventories are (in thousands):
|
|
|
|
|
|
|
|
|
|
|
2025 |
|
|
2024 |
|
Concentrates |
|
$ |
15,656 |
|
|
$ |
8,720 |
|
Stockpiled ore |
|
|
10,862 |
|
|
|
12,510 |
|
Total product inventories |
|
|
26,518 |
|
|
|
21,230 |
|
Note 16: Properties, Plants, Equipment and Mine Development, net, and Lease Commitments
Properties, Plants, Equipment and Mine Development
Our major components of properties, plants, equipment, and mine development are (in thousands):
|
|
|
|
|
|
|
|
|
|
|
December 31, |
|
|
|
2025 |
|
|
2024 |
|
|
|
|
|
|
|
|
Mining properties, including asset retirement obligations |
|
$ |
761,053 |
|
|
$ |
695,786 |
|
Development costs |
|
|
523,775 |
|
|
|
476,315 |
|
Plants and equipment |
|
|
1,377,237 |
|
|
|
1,289,306 |
|
Land |
|
|
32,962 |
|
|
|
35,680 |
|
Mineral interests |
|
|
828,829 |
|
|
|
842,431 |
|
Construction in progress |
|
|
72,281 |
|
|
|
66,566 |
|
|
|
|
3,596,137 |
|
|
|
3,406,084 |
|
Less accumulated depreciation, depletion and amortization |
|
|
1,465,556 |
|
|
|
1,339,662 |
|
Net carrying value |
|
$ |
2,130,581 |
|
|
$ |
2,066,422 |
|
During 2025, we incurred total capital expenditures of $190.9 million. This excludes non-cash items for equipment acquired under finance leases and adjustments for asset retirement obligations, and includes acquisitions of mineral interests and land. The expenditures included $72.9 million at Lucky Friday, $58.2 million at Keno Hill, and $54.6 million at Greens Creek.
Mineral interests include amounts for value beyond proven and probable reserves (“VBPP”) related to mines and exploration or pre-development interests acquired by us which are not depleted until the mineralized material they relate to is converted to proven and probable reserves. As of December 31, 2025, mineral interests included VBPP assets of $388.2 million, $69.7 million, and $83.0 million, respectively, at Nevada, Greens Creek, and Keno Hill, along with various other properties. As of December 31, 2024, mineral interests included VBPP assets of $388.2 million, $83.3 million, and $95.7 million, respectively, at Nevada, Greens Creek and Keno Hill, along with various other properties.
Note 17: Commitments, Contingencies, and Obligations
San Mateo Creek Basin, New Mexico
In July 2018, the EPA informed Hecla Limited that it and several other potentially responsible parties (“PRPs”) may be liable for cleanup of the San Mateo Creek Basin (“SMCB”), which is an approximately 321 square mile area in New Mexico that contains numerous legacy uranium mines and mills. At the time, the EPA stated it had incurred approximately $9.6 million in response costs. Also, in May, 2022, and August, 2024, Hecla Limited received a letter from a PRP notifying Hecla Limited that other PRPs may seek cost recovery and contribution from Hecla Limited under CERCLA for certain investigatory work performed by the PRPs at the SMCB site. Hecla Limited cannot with reasonable certainty estimate the amount or range of liability, if any, relating to this matter because of, among other reasons, the lack of information concerning the site, including the relative contributions of contamination by the various PRPs.
Carpenter Snow Creek and Barker-Hughesville Sites in Montana
In July 2010, the EPA made a formal request to Hecla for information regarding the Carpenter Snow Creek Superfund site located in Cascade County, Montana. The Carpenter Snow Creek site is located in a historical mining district, and in the early 1980s Hecla Limited leased 6 mining claims and performed limited exploration activities at the site. Hecla Limited terminated the mining lease in 1988.
In June 2011, the EPA informed Hecla Limited that it believes Hecla Limited, and several other PRPs, may be liable for cleanup of the site or for costs incurred by the EPA in cleaning up the site. The EPA stated in the letter that it has incurred approximately $4.5 million in response costs and estimated that total remediation costs may exceed $100 million. Hecla Limited cannot with reasonable certainty estimate the amount or range of liability, if any, relating to this matter because of, among other reasons, the lack of information concerning the site, including the relative contributions of contamination by various other PRPs.
In February 2017, the EPA made a formal request to Hecla for information regarding the Barker-Hughesville Mining District Superfund site located in Judith Basin and Cascade Counties, Montana. Hecla Limited submitted a response in April 2017. The Barker-Hughesville site is located in a historic mining district, and between approximately June and December 1983, Hecla Limited was party to an agreement with another mining company under which limited exploration activities occurred at or near the site.
In August 2018, the EPA informed Hecla Limited that it and several other PRPs may be liable for cleanup of the site or for costs incurred by the EPA in cleaning up the site. The EPA did not include an amount of its alleged response costs to date. Hecla Limited cannot with reasonable certainty estimate the amount or range of liability, if any, relating to this matter because of, among other reasons, the lack of information concerning past or anticipated future costs at the site and the relative contributions of contamination by various other PRPs.
Contingencies Relating to former Casa Berardi Segment
In May 2023, the wall of an impoundment dam (HM3) storing mixed waste material (i.e. clay, till, and rock, but not tailings or other deleterious materials) stripped during open pit mining at our former Casa Berardi mine experienced a slip resulting in the waste material being mobilized downstream. The incident was investigated by the Quebec Ministry of Environment, Fight Against Climate Change, Wildlife and Parks.
Under the terms of our sale of Hecla Quebec to Orezone, we have agreed to reimburse Orezone for any financial penalties, fines, charges, surcharges, or other amounts payable as a result of the HM3 incident described above, excluding any remediation, closure or similar work at HM3 or any costs associated therewith. We are not liable for any portion of such penalties resulting from actions taken at Casa Berardi after closing. Another term of the transaction provides Orezone with a set-off right to reduce future deferred cash payments owed to us if the financial assurance required under Casa Berardi’s updated closure plan exceeds $150 million. Specifically, Orezone may reduce such future payments by 50% of any amount by which the required financial assurance exceeds $150 million, excluding amounts arising from the mine's post-closing actions that increase the closure scope beyond what was contemplated at the time of sale.
Debt
See Note 10 for information on the commitments related to our debt arrangements as of December 31, 2025.
Other Commitments
Our contractual obligations as of December 31, 2025 included open purchase orders and commitments of $6.1 million, $7.1 million, and $6.8 million for various capital and non-capital items at Greens Creek, Lucky Friday, Keno Hill, respectively. We also have total commitments of $5.7 million relating to scheduled payments on finance leases, including interest, primarily for equipment at our Greens Creek, Lucky Friday, and Keno Hill units, and total commitments of $9.3 million relating to payments on operating leases (see Note 10 for more information). As part of our ongoing business and operations, we are required to provide surety bonds, bank letters of credit, and restricted deposits for various purposes, including financial support for environmental reclamation obligations and workers compensation programs. As of December 31, 2025, we had surety bonds totaling $206.3 million and letters of credit totaling $6.7 million in place as financial support for future reclamation and closure costs, self-insurance, and employee benefit plans. The obligations associated with these instruments are generally related to performance requirements that we address through ongoing operations. As the requirements are met, the beneficiary of the associated instruments cancels or returns the instrument to the issuing entity. Certain of these instruments are associated with operating sites with long-lived assets and will remain outstanding until closure of the sites. We believe we are in compliance with all applicable bonding requirements and will be able to satisfy future bonding requirements as they arise.
Other Contingencies
We also have certain other contingencies resulting from litigation, claims, EPA investigations, and other commitments and are subject to a variety of environmental and safety laws and regulations incident to the ordinary course of business, including two active lawsuits in federal courts in Idaho and Alaska, respectively, involving labor and employment matters. We currently have no basis to conclude that any or all of such contingencies will materially affect our financial position, results of operations or cash flows. However, in the future, there may be changes to these contingencies, or additional contingencies may occur, any of which might result in an accrual or a change in current accruals recorded by us, and there can be no assurance that their ultimate disposition will not have a material adverse effect on our financial position, results of operations or cash flows.