Shareholder Report
Jun. 30, 2026
USD ($)
holding
Jun. 30, 2025
This annual shareholder report contains important information about the Matrix Advisors Value ETF (the “Fund”) for the period of July 1, 2025 to June 30, 2026 (the “Period”). You can find additional information about the Fund at https://matrixadvisorsvalueetf.com. You can also request this information by contacting us at (215) 330-4476. For information regarding your Fund shares or account, including account balances, transactions, or distributions, please contact your financial intermediary. | |||||||||||
Availability of Additional Information
For additional information about the Fund, including its prospectus, financial information, holdings, and proxy information, visit https://matrixadvisorsvalueetf.com. You can also request information by calling (215) 330-4476.
Householding
Householding is an option available to certain investors of the Fund. Householding is a method of delivery, based on the preference of the individual investor, in which a single copy of certain shareholder documents can be delivered to investors who share the same address, even if their accounts are registered under different names. Householding for the Fund is available through certain broker-dealers. If you are interested in enrolling in householding and receiving a single copy of prospectuses and other shareholder documents or you are currently enrolled in householding and wish to change your householding status, please contact your broker-dealer.
| WHAT WERE THE FUND COSTS FOR THE PERIOD? (based on a hypothetical $10,000 investment) | |||||||||||
| COST OF $10,000 INVESTMENT | COST PAID AS A PERCENTAGE OF $10,000 INVESTMENT | ||||||||||
| $85 | 0.75% | ||||||||||
| WHAT FACTORS INFLUENCED PERFORMANCE FOR THE PERIOD? | |||||||||||
For the Period, the Fund outperformed its benchmarks returning 27.35% (based on NAV) during the period while the Russell 1000 Value® Index and S&P 500® Index returned 27.09% and 22.32%, respectively. The Fund’s outperformance was due to a combination of sector weightings and good stock selection. Sector weightings reflect the Sub-Adviser’s highest-conviction positioning. These stocks did well because they delivered good earnings and positive outlooks for their businesses going forward.
The largest contributors to the Fund’s performance during the Period were stocks in the Technology, Industrials, Financials, and Communications Services sectors. Specifically, our Technology names benefited from investor’s enthusiasm over the build out of AI, with the semiconductor and chip companies, Applied Materials, Qualcomm, and Texas Instruments among our top performing stocks. In Industrials, FedEx and Generac were the top performers. FedEx has been revitalized under new senior management and Generac is seeing strong new business supplying back up power for data centers. In Financials, the bull market lifted Goldman Sachs and Morgan Stanley who showed strong results from trading, wealth management and investment banking. In Communication Services, Alphabet was a standout performer, receiving positive reviews for its AI capabilities.
Detractors from performance were stocks in the Consumer Discretionary and Consumer Staples sectors. The lackluster performance from these sectors was more about investors gravitating to higher growth areas of the market rather than specific names.
The Sub-Adviser employs a bottom-up stock selection process. The portfolio is built stock by stock with risk controls to manage sector risk. The Sub Adviser does not attempt “to time the market” or mimic a benchmark. The Sub Adviser invests in where it finds the best opportunities for long-term capital appreciation, employing a rigorous valuation disciple on our purchase and sale decisions.
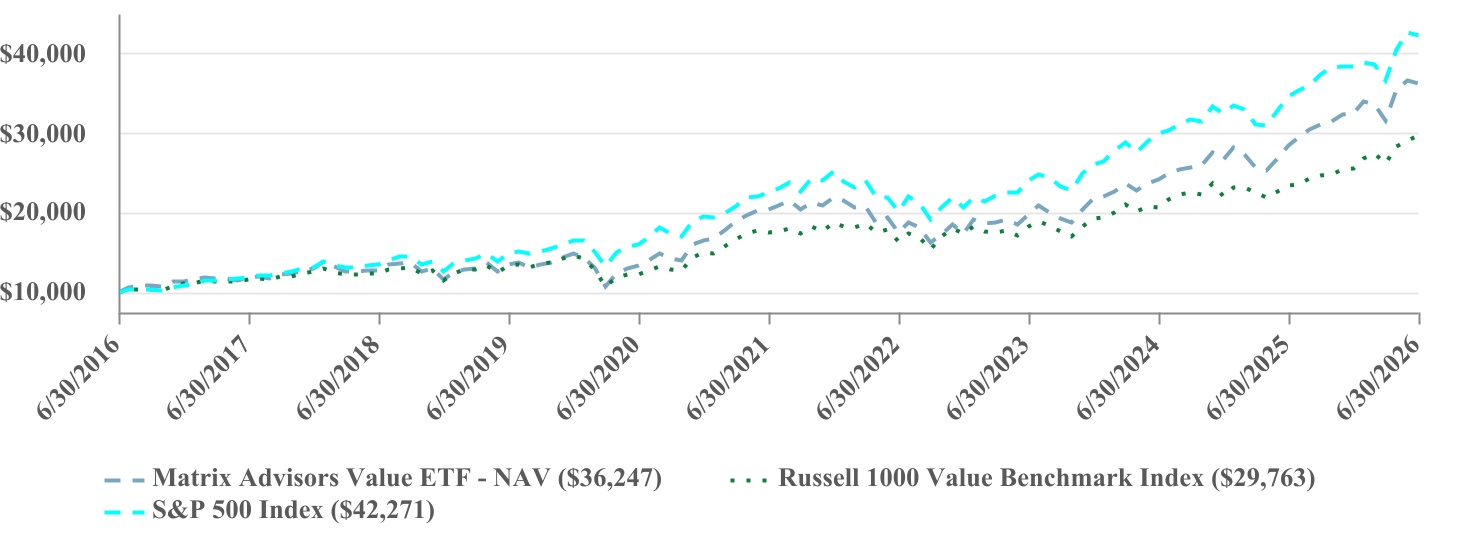
| PERFORMANCE OF A HYPOTHETICAL $10,000 INVESTMENT | |||||||||||
| PERFORMANCE | ||||||||||||||||||||
| One Year | Five Year | Ten Year | ||||||||||||||||||
| Matrix Advisors Value ETF - NAV | 27.35% | 12.14% | 13.74% | |||||||||||||||||
| Russell 1000 Value Index | 27.09% | 11.17% | 11.52% | |||||||||||||||||
| S&P 500 Index | 22.32% | 13.41% | 15.51% | |||||||||||||||||
| The Russell 1000 Value Index is provided as a broad measure of market performance. The S&P 500 Index is provided as a measure of the Fund’s investment strategy and universe. | ||||||||||||||||||||
The Fund’s past performance is not a good predictor of how the Fund will perform in the future. The graph and table do not reflect the deduction of taxes that a shareholder would pay on fund distributions or redemption of fund shares. | ||||||||||||||||||||
| On February 21, 2025, the Fund acquired all of the assets and liabilities of the Matrix Advisors Value Fund (the “Predecessor Mutual Fund”) in a tax-free reorganization (the “Reorganization”). The Predecessor Mutual Fund had an investment objective and investment strategies that were substantially similar as those of the Fund. The Fund’s performance for periods prior to February 21, 2025 is that of the Predecessor Mutual Fund. | ||||||||||||||||||||
Visit https://matrixadvisorsvalueetf.com for more recent performance information. | ||||||||||||||||||||
| KEY FUND STATISTICS (as of Period End) | ||||||||||||||||||||
| Net Assets | $90,582,551 | Fund Advisory Fees | $629,082 | |||||||||||||||||
| # of Portfolio Holdings | 28 | Portfolio Turnover Rate* | 29% | |||||||||||||||||
| *Portfolio turnover is not annualized and is calculated without regard to short-term securities having a maturity of less than one year. Excludes impact of in-kind transactions. | ||||||||||||||||||||
| SECTOR WEIGHTING (as a % of Net Assets) | |||||
| Information Technology | 26.0% | ||||
| Financials | 24.5% | ||||
| Communication Services | 14.7% | ||||
| Consumer Discretionary | 11.1% | ||||
| Health Care | 9.0% | ||||
| Consumer Staples | 6.3% | ||||
| Industrials | 5.8% | ||||
| Cash and Cash Equivalents | 2.6% | ||||
| TOP 10 HOLDINGS (as a % of Net Assets) | |||||
| Alphabet, Inc. - Class C | 7.8% | ||||
| Microsoft Corp. | 6.3% | ||||
| Apple, Inc. | 6.3% | ||||
| Generac Holdings, Inc. | 5.8% | ||||
| Amazon.com, Inc. | 5.2% | ||||
| Applied Materials, Inc. | 4.5% | ||||
| Meta Platforms, Inc. - Class A | 4.2% | ||||
| PNC Financial Services Group, Inc. | 3.9% | ||||
| Jpmorgan Chase & Co. | 3.8% | ||||
| Wells Fargo & Co. | 3.5% | ||||