The Fund acquired all of the assets and liabilities of The Disciplined Growth Investors Fund, a series of Financial Investors Trust (the “Predecessor Fund”), in a tax-free reorganization on July 11, 2025. In connection with this acquisition, shares of the Predecessor Fund were exchanged for shares of the Fund. The Predecessor Fund had an investment objective and strategies that were, in all material respects, the same as those of the Fund, and was managed in a manner that, in all material respects, complied with the investment guidelines and restrictions of the Fund. The Fund is a continuation of the Predecessor Fund, and therefore, the performance information includes the performance of the Predecessor Fund.
The following information provides some indication of the risks of investing in the Fund by showing how the Fund’s performance has varied over time.
The bar chart depicts the change in performance from year to year during the periods indicated. If sales charges were included, the returns would be lower. The table compares the Fund’s average annual returns for the periods indicated to a broad-based securities market index. The index is not actively managed and is not available for direct investment. The bar charts and performance tables assume reinvestment of dividends and distributions. The Fund’s past performance (before and after taxes) does not necessarily indicate how the Fund will perform in the future. Updated performance information is available on the Fund’s website at www.dgifund.com.
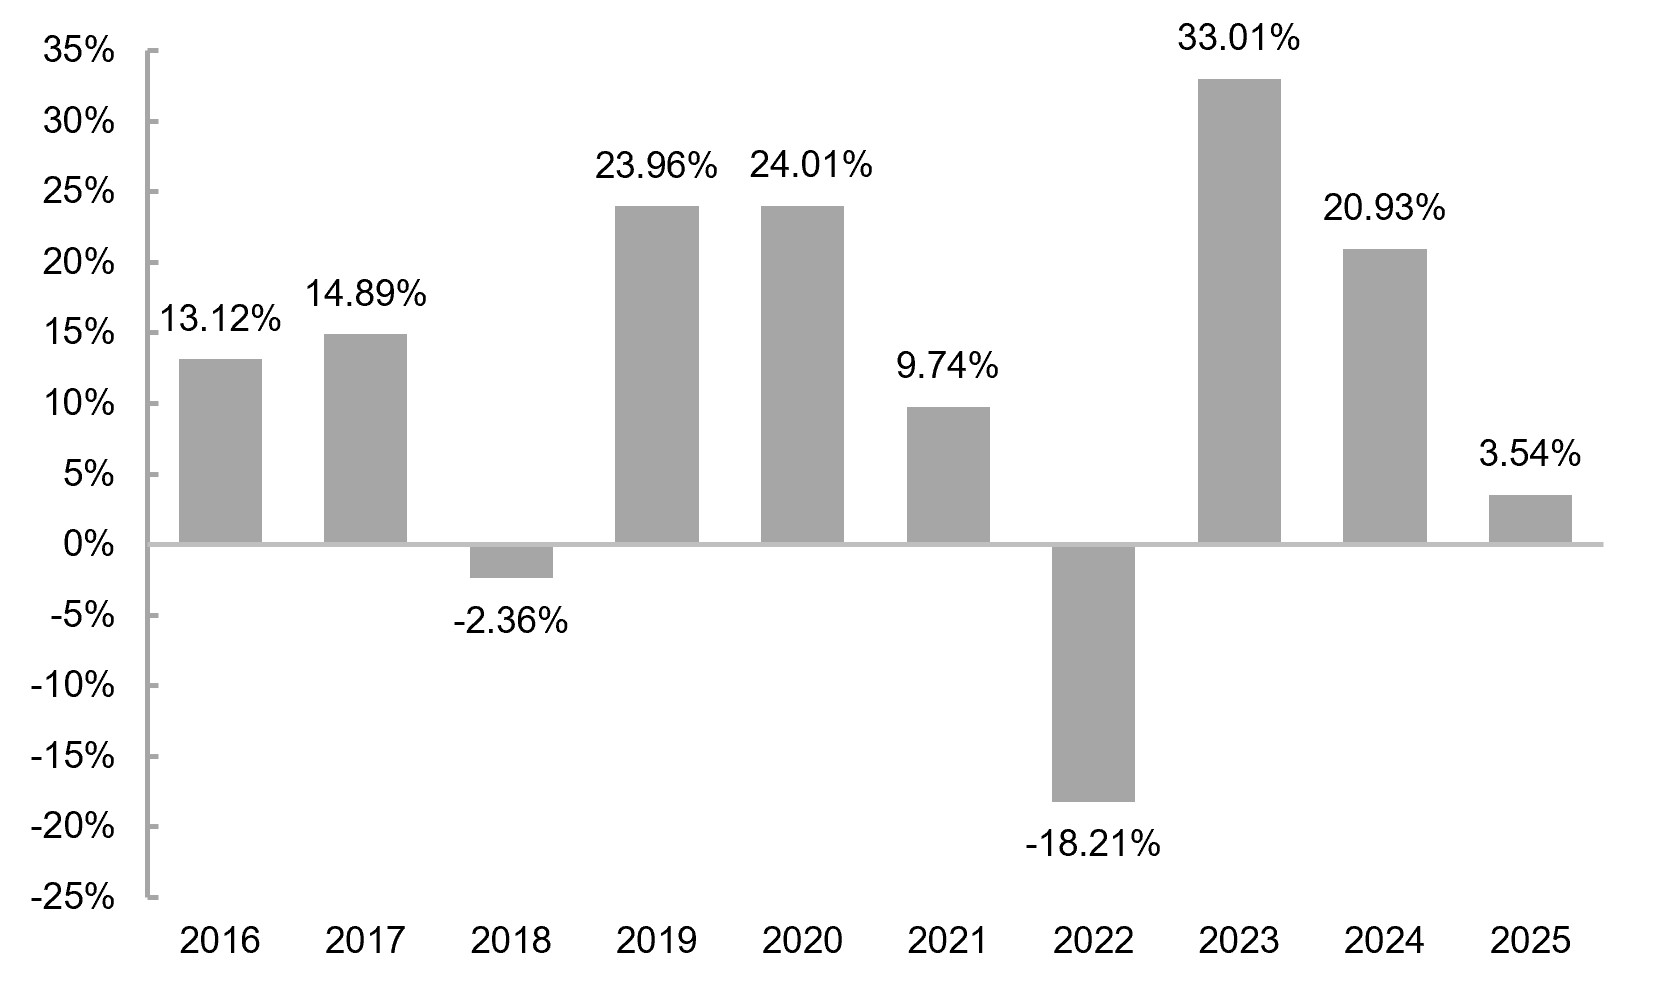
*The Fund’s year-to-date return as of June 30, 2026 was 17.09%.
| Return | Quarter/Year | |
| Highest Return | 23.15% | |
| Lowest Return | -19.25% |
Average Annual Total Returns
(for the Periods Ended December 31, 2025)
| One Year | Five Year | Ten Year | |
| Return Before Taxes | 3.54% | 8.37% | 11.30% |
| Return After Taxes on Distributions | 1.60% | 5.07% | 8.60% |
| Return After Taxes on Distributions and Sale of Fund Shares | 3.39% | 5.19% | 7.98% |
| S&P
500 Total Return Index® (reflects no deductions for fees, expenses, or taxes) |
17.88% | 4.49% | 14.82% |
After-tax returns are calculated using the historical highest individual federal marginal income tax rates during the periods covered by the table above and do not reflect the impact of state and local taxes. Actual after-tax returns depend on an investor’s tax situation and may differ from those shown. After-tax returns shown are not relevant to investors who hold their Shares through tax deferred arrangements such as an individual retirement account (“IRA”) or other tax-advantaged accounts. In certain cases, the figure representing “Return After Taxes on Distributions and Sale of Shares” may be higher than the other return figures for the same period. A higher after-tax return results when a capital loss occurs upon redemption and provides an assumed tax deduction that benefits the investor.
Prior Performance of Predecessor Limited Partnership
As a newly registered mutual fund, the Fund does not have prior performance as a mutual fund. The prior performance shown below is for the Fund’s predecessor limited partnership, Navigator Investors, L.P. (the “Predecessor Fund”). The prior performance is net of management fees and other expenses. The Fund acquired all of the assets and liabilities of the Predecessor Fund in a tax-free reorganization on or about January 26, 2026. The Predecessor Fund has been managed in the same style since the Adviser’s inception on March 31, 1997. The Fund’s investment goals, policies, guidelines and restrictions are, in all material respects, equivalent to the Predecessor Fund.
The following information shows the Predecessor Fund’s annual returns and long-term performance reflecting the actual fees and expenses that were charged when the Fund was a limited partnership. The Predecessor Fund was not subject to certain investment restrictions, diversification requirements and other restrictions of the 1940 Act and of the Internal Revenue Code that are applicable to the Fund, which if they had been applicable to the Predecessor Fund, might have adversely affected its performance.
The following information provides some indication of the risks of investing in the Fund by showing how the Predecessor Fund’s performance has varied over time.
The bar chart depicts the change in performance from year to year during the periods indicated. The table compares the Predecessor Fund’s average annual returns for the periods indicated to a broad-based securities market index and supplemental index. The indices are not actively managed and are not available for direct investment. The bar chart and performance table assume reinvestment of dividends and distributions. The Predecessor Fund’s past performance does not necessarily indicate how the Fund will perform in the future. After-tax returns are not provided because the DGIQX Predecessor Fund’s tax treatment was different than that of a registered investment company. Updated performance information is available on the Fund’s website at www.dgifund.com.
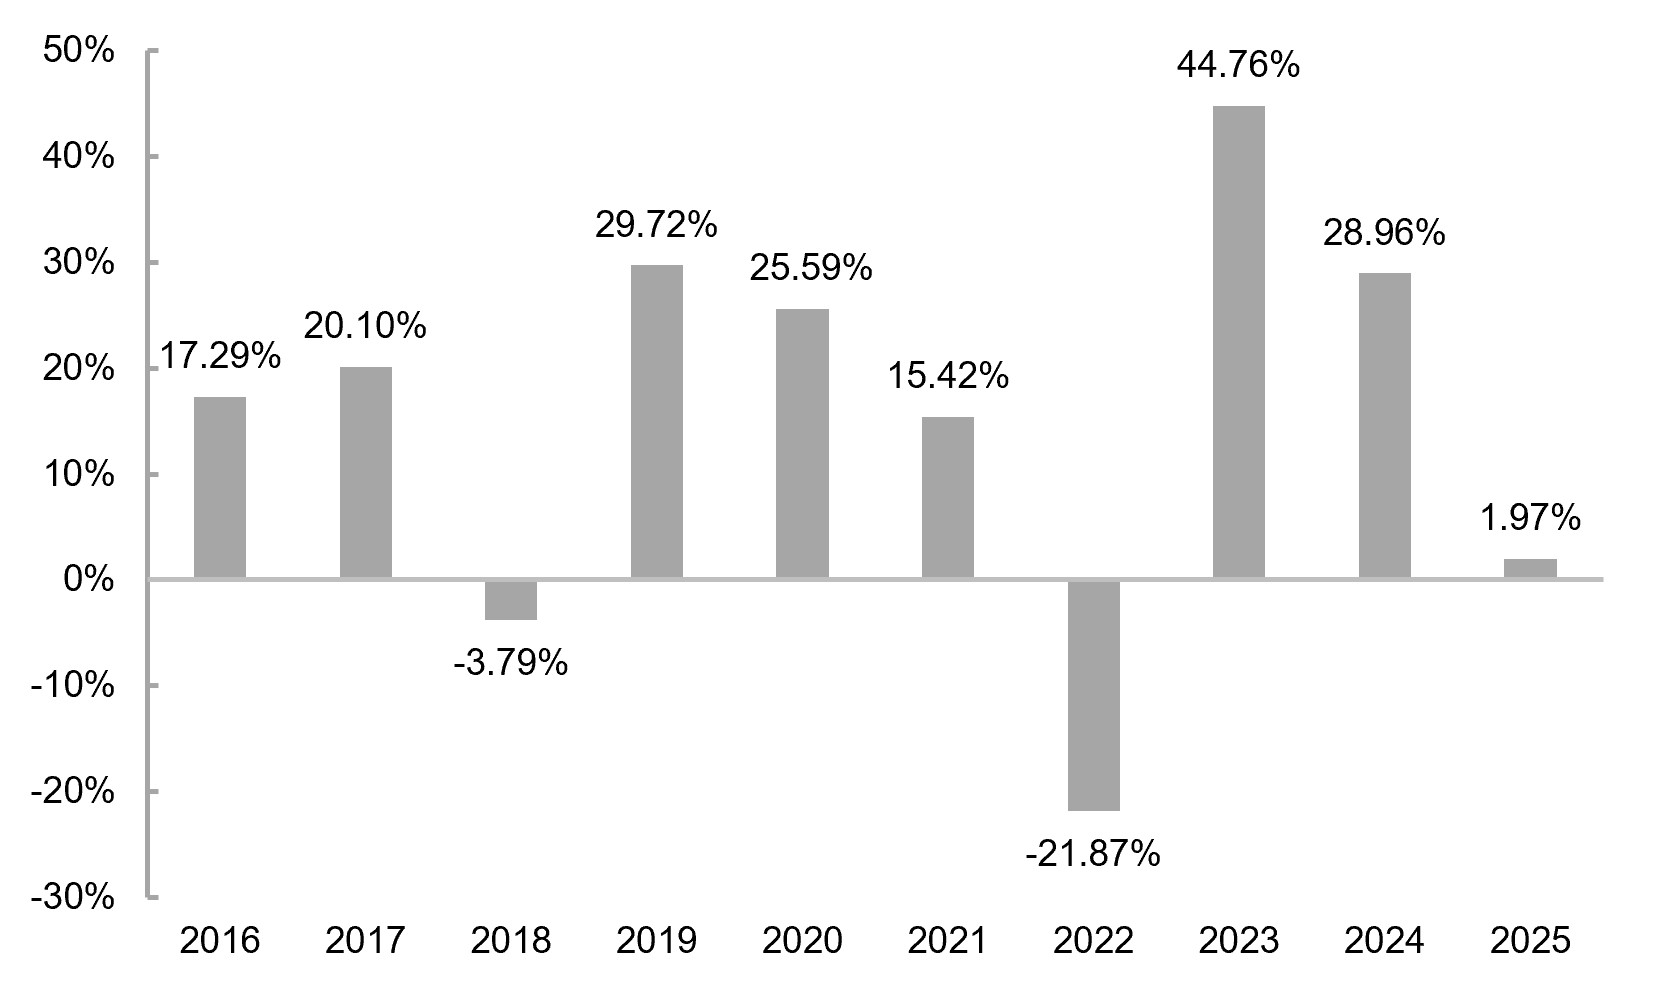
*The Fund’s year-to-date return as of June 30, 2026 was 22.66%.
| Return | Quarter/Year | ||
| Highest Return | 32.16% | ||
| Lowest Return | -26.44% |
Average Annual Total Returns (for the Periods Ended December 31, 2025) |
| One Year | Five Year | Ten Year | |
| Return Before Taxes | 1.97% | 11.41% | 14.25% |
| Return After Taxes on Distributions | N/A | N/A | N/A |
| Return After Taxes on Distributions and Sale of Fund Shares | N/A | N/A | N/A |
Bloomberg US 3000 Total Return Index (reflects no deductions for fees, expenses, or taxes) |
17.21% | 13.09% | 14.27% |
| Bloomberg
U.S. Mid Cap Growth Index (reflects no deductions for fees, expenses, or taxes) |
10.28% | 6.89% | 11.83% |
After-tax returns are calculated using the historical highest individual federal marginal income tax rates during the periods covered by the table above and do not reflect the impact of state and local taxes. Actual after-tax returns depend on an investor’s tax situation and may differ from those shown. After-tax returns shown are not relevant to investors who hold their Shares through tax deferred arrangements such as an individual retirement account (“IRA”) or other tax-advantaged accounts. In certain cases, the figure representing “Return After Taxes on Distributions and Sale of Shares” may be higher than the other return figures for the same period. A higher after-tax return results when a capital loss occurs upon redemption and provides an assumed tax deduction that benefits the investor.
The following information provides some indication of the risks of investing in the Fund by showing how the Fund’s performance has varied over time.
The bar chart depicts the change in performance from year to year during the periods indicated. If sales charges were included, the returns would be lower. The Fund is the successor to the predecessor Vulcan Value Partners Fund (the “Predecessor Fund”), a mutual fund with substantially similar investment objectives, policies, and restrictions, as a result of the reorganization of the Predecessor Fund into the Fund on September 12, 2025. The performance provided in the bar chart and table includes the Fund and Predecessor Fund. The table compares the Fund’s average annual returns for the periods indicated to broad-based securities market indices. The indices are not actively managed and are not available for direct investment. The bar charts and performance tables assume reinvestment of dividends and distributions. The Fund’s past performance (before and after taxes) does not necessarily indicate how it will perform in the future. Updated performance information is available on the Fund’s website at https://vulcanvaluepartners.com/strategies/large-cap/mutual-fund/ or by calling 1-877-421-5078.
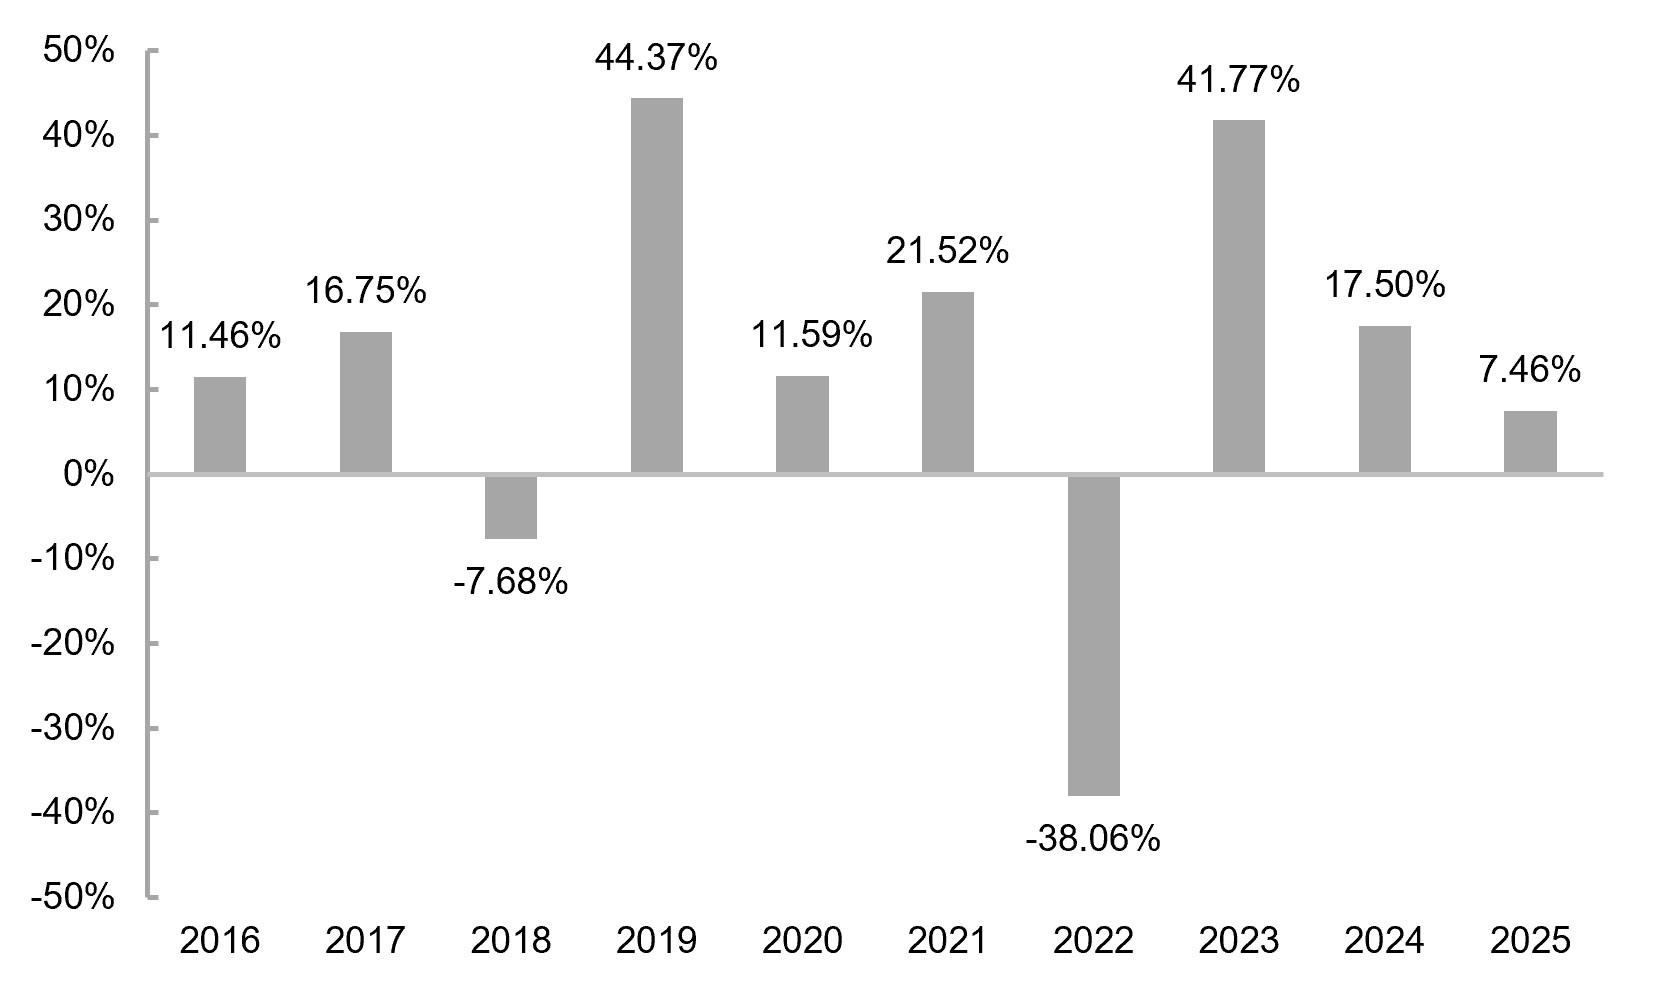
*The bar chart above shows returns for Investor Class shares. #As of June 30, 2026, the year-to-date total return was -6.03% for the Investor Class shares. |
| Return | Quarter/Year | |||
| Highest Return | 24.87% | |||
| Lowest Return | -28.51% | |||
| Institutional Class Shares | One Year | Five Year | Since Inception* | Ten Year |
| Return Before Taxes | 7.80% | 6.41% | 9.49% | N/A |
| Return After Taxes on Distributions | 6.03% | 5.06% | 8.11% | N/A |
| Return After Taxes on Distributions and Sale of Fund Shares | 5.36% | 4.65% | 7.22% | N/A |
| Investor Class Shares | ||||
| Return Before Taxes | 7.46% | 6.14% | 10.85% | 10.06% |
| Return After Taxes on Distributions | 5.79% | 4.83% | 9.69% | 8.80% |
| Return After Taxes on Distributions and Sale of Fund Shares | 5.17% | 4.44% | 8.84% | 7.86% |
| S&P
500 Total Return Index® (reflects no deductions for fees, expenses, or taxes) |
17.88% | 14.42% | 14.05% | 14.82% |
Russell 1000 Value Index® (reflects no deductions for fees, expenses, or taxes) |
15.91% | 11.33% | 11.00% | 10.53% |
| * | Inception date for Institutional Class Shares: May 1, 2019 |
After-tax returns are calculated using the historical highest individual federal marginal income tax rates during the periods covered by the table above and do not reflect the impact of state and local taxes. Actual after-tax returns depend on an investor’s tax situation and may differ from those shown. After-tax returns shown are not relevant to investors who hold their Shares through tax deferred arrangements such as an individual retirement account (“IRA”) or other tax-advantaged accounts. In certain cases, the figure representing “Return After Taxes on Distributions and Sale of Shares” may be higher than the other return figures for the same period. A higher after-tax return results when a capital loss occurs upon redemption and provides an assumed tax deduction that benefits the investor.
The following information provides some indication of the risks of investing in the Fund by showing how the Fund’s performance has varied over time.
The bar chart depicts the change in performance from year to year during the periods indicated. If sales charges were included, the returns would be lower. The Fund is the successor to the predecessor Vulcan Value Partners Small Cap Fund (the “Predecessor Fund”), a mutual fund with substantially similar investment objectives, policies, and restrictions, as a result of the reorganization of the Predecessor Fund into the Fund on September 12, 2025. The performance provided in the bar chart and table includes the Fund and Predecessor Fund. The table compares the Fund’s average annual returns for the periods indicated to broad-based securities market indices. The indices are not actively managed and are not available for direct investment. The bar charts and performance tables assume reinvestment of dividends and distributions. The Fund’s past performance (before and after taxes) does not necessarily indicate how it will perform in the future. Updated performance information is available on the Fund’s website at https://vulcanvaluepartners.com/strategies/small-cap/mutual-fund or by calling 1-877-421-5078.
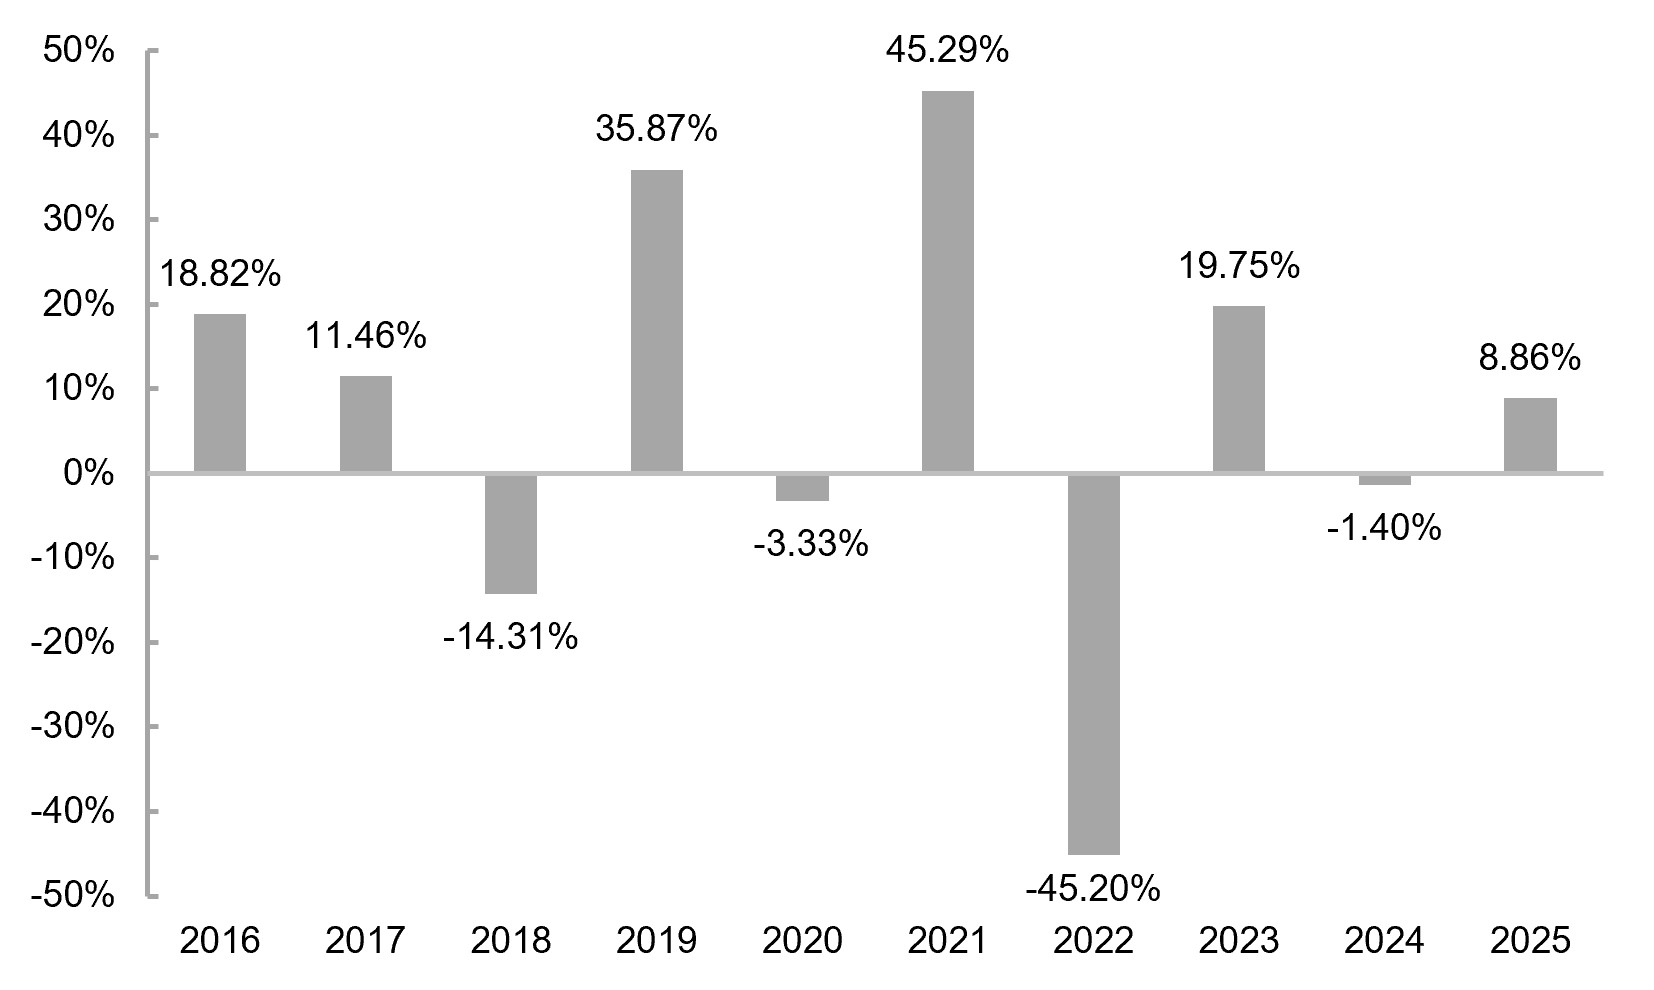
*The bar chart above shows returns for Investor Class shares. #As of June 30, 2026, the year-to-date total return was 5.33% for the Investor Class shares. |
| Return | Quarter/Year | |||
| Highest Return | 39.75% | |||
| Lowest Return | -42.25% | |||
| Institutional Class Shares | One Year | Five Year | Since Inception* | Ten Year |
| Return Before Taxes | 9.09% | 0.70% | 1.88% | |
| Return After Taxes on Distributions | 7.98% | (1.60%) | (0.05%) | |
| Return After Taxes on Distributions and Sale of Fund Shares | 5.36% | 0.08% | 1.09% | |
| Investor Class Shares | ||||
| Return Before Taxes | 8.86% | 0.46% | N/A | 4.31% |
| Return After Taxes on Distributions | 7.80% | (1.82%) | N/A | 2.37% |
| Return After Taxes on Distributions and Sale of Fund Shares | 5.23% | (0.09%) | N/A |
3.00% |
| S&P
500® Total Return Index (reflects no deductions for fees, expenses, or taxes) |
17.88% | 14.42% | 14.05% | 14.82% |
Russell 2000 Index® (reflects no deductions for fees, expenses, or taxes) |
12.81% | 6.09% | 8.51% | 9.62% |
Russell 2000 Value Index® (reflects no deductions for fees, expenses, or taxes) |
12.59% | 8.88% | 8.29% | 9.27% |
| * | Inception Date for Institutional Class Shares: May 1, 2019 |
After-tax returns are calculated using the historical highest individual federal marginal income tax rates during the periods covered by the table above and do not reflect the impact of state and local taxes. Actual after-tax returns depend on an investor’s tax situation and may differ from those shown. After-tax returns shown are not relevant to investors who hold their Shares through tax-deferred arrangements such as an individual retirement account (“IRA”) or other tax-advantaged accounts. In certain cases, the figure representing “Return After Taxes on Distributions and Sale of Shares” may be higher than the other return figures for the same period. A higher after-tax return results when a capital loss occurs upon redemption and provides an assumed tax deduction that benefits the investor.