
Exhibit 1U.1
Forge Group, Inc. Announces 2nd Quarter 2026 Financial Results
BETHESDA, Maryland, August 28, 2026– Forge Group, Inc. (the “Company”, “we”, “us”, “our”, or “Forge”) (OTC ID: FIGP), a specialist commercial auto insurance business, recently announced its financial results for the six months ended June 30, 2026.
The Company has provided certain selected financial data in the table below for the three months ended June 30, 2026 (“2Q26”) and 2025 (“2Q25”), respectively, and the six months ended June 30, 2026 (“1H26”) and 2025 (“1H25”), respectively:
| | Three months ended June 30 | | | Six months ended June 30 | |
||||||||||||||||||
| | 2026 | | | 2025 | | | | | | | 2026 | | | 2025 | | | | | |
||||
($000s except per-share items) | | (unaudited) | | | (unaudited) | | | Change | | | (unaudited) | | | (unaudited) | | | Change | |
||||||
Gross premiums written | | | 8,562 | | | | 6,778 | | | | 26.3 | % | | | 20,019 | | | | 15,691 | | | | 27.6 | % |
Net premiums written | | | 8,001 | | | | 6,360 | | | | 25.8 | % | | | 18,701 | | | | 14,716 | | | | 27.1 | % |
Net premiums earned | | | 8,916 | | | | 7,703 | | | | 15.7 | % | | | 17,303 | | | | 14,771 | | | | 17.1 | % |
Underwriting income (loss) ¹ | | | (249 | ) | | | 517 | | | | (766 | ) | | | (502 | ) | | | 93 | | | | (595 | ) |
Pre-tax operating income (loss) ² | | | 261 | | | | 978 | | | | (717 | ) | | | 509 | | | | 1,037 | | | | (528 | ) |
| | | | | | | | | | | | | | | | | | | | | | | | |
Operating ratios | | | | | | | | | | | | | | | | | | | | | | | | |
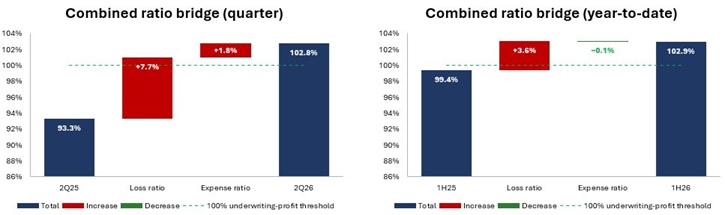
Loss ratio ³ | | | 62.6 | % | | | 54.9 | % | | | 7.7 | % | | | 61.4 | % | | | 57.8 | % | | | 3.6 | % |
Expense ratio ⁴ | | | 40.2 | % | | | 38.4 | % | | | 1.8 | % | | | 41.5 | % | | | 41.6 | % | | | -0.1 | % |
Combined ratio ⁵ | | | 102.8 | % | | | 93.3 | % | | | 9.5 | % | | | 102.9 | % | | | 99.4 | % | | | 3.5 | % |
Less: Investment ratio ⁶ | | | -5.7 | % | | | -6.0 | % | | | 0.3 | % | | | (5.8% | ) | | | -6.4 | % | | | 0.6 | % |
Operating ratio ⁷ | | | 97.1 | % | | | 87.3 | % | | | 9.8 | % | | | 97.1 | % | | | 93.0 | % | | | 4.1 | % |
| | | | | | | | | | | | | | | | | | | | | | | | |
GAAP items | | | | | | | | | | | | | | | | | | | | | | | | |
Basic earnings per share | | $ | 0.15 | | | $ | 0.63 | | | | -76.3 | % | | $ | 0.73 | | | $ | 0.49 | | | | 48.8 | % |
Diluted earnings per share | | $ | 0.14 | | | $ | 0.56 | | | | -75.0 | % | | $ | 0.67 | | | $ | 0.48 | | | | 39.6 | % |
| | | | | | | | | | | | | | | | | | | | | | | | |
Non-GAAP items | | | | | | | | | | | | | | | | | | | | | | | | |
Adjusted book value per share ⁸ | | $ | 23.31 | | | $ | 20.97 | | | | 11.2 | % | | $ | 23.31 | | | $ | 20.97 | | | | 11.2 | % |
Adjusted tangible book value per share ⁹ | | $ | 21.29 | | | $ | 18.84 | | | | 13.0 | % | | $ | 21.29 | | | $ | 18.84 | | | | 13.0 | % |
Pre-tax operating income (loss) per share ¹⁰ | | $ | 0.10 | | | $ | 0.38 | | | | -73.7 | % | | $ | 0.20 | | | $ | 0.40 | | | | -51.6 | % |
Footnotes
| 1. | Underwriting income (loss) is a non-GAAP financial metric which measures the pre-tax profitability of our insurance operations before considering investment income. It is derived by subtracting loss and loss adjustment expense and underwriting expenses from net premiums earned. |
| 2. | Pre-tax operating income (loss) is a non-GAAP financial metric which measures the profitability of our insurance operations before considering the impact of net realized and unrealized gains (losses) and income (loss) from real estate operations. |
| 3. | Loss ratio is losses and loss adjustment expenses incurred expressed as a percentage of net premiums earned. |
| 4. | Expense ratio is underwriting expenses expressed as a percentage of net premiums earned. |
| 5. | Combined ratio is the sum of the loss ratio and the expense ratio. |
| 6. | Investment ratio is net investment income expressed as a percentage of net premiums earned. |
| 7. | Operating ratio is the combined ratio minus the investment ratio. |
| 8. | Adjusted book value per share is a non-GAAP financial metric that our board and management team uses to evaluate overall long-term corporate performance. See Exhibits for more detail. |
| 9. | Adjusted tangible book value per share is a non-GAAP financial metric that our board and management team uses to evaluate overall long-term corporate performance. See Exhibits for more detail. |
| 10. | Pre-tax operating income (loss) per share is a non-GAAP financial metric. See Exhibits for more detail. |
How to read these results:
Combined ratio = loss ratio + expense ratio. Below 100% produces an underwriting profit.
Operating ratio = combined ratio less investment ratio. Below 100% produces an operating profit.
Volatility. At our scale, quarterly results can vary meaningfully from period to period.
What moved this quarter:
Premium growth. Gross premiums written rose 26.3% in the quarter and 27.6% year-to-date — our second consecutive quarter of mid-to-high-twenties growth.
Loss ratio. 62.6% versus 54.9%. The prior-year quarter benefited from an unusually favorable severity environment; the current quarter reflects normalization rather than any change in underwriting standards. Our loss ratio continues to perform below commercial auto industry averages.
Expense ratio. 40.2% versus 38.4% in the quarter, but 41.5% versus 41.6% year-to-date — essentially flat over six months. The quarterly increase primarily reflects planned investment in people and an increase in our technology costs, which are our two largest fixed operating expense items.
Book value. Adjusted book value per share grew 11.2% year over year and adjusted tangible book value per share grew 13.0%.
Combined ratio bridge:
The Company commented:
Our business continued to grow at a healthy pace in the second quarter, with gross premiums written up 26.3% and year-to-date growth of 27.6%. We believe this reflects the return on the investments we have made: our FIRE 2.0 agent platform, our A- (Excellent) rating from A.M. Best, and the expansion of our distribution capabilities.
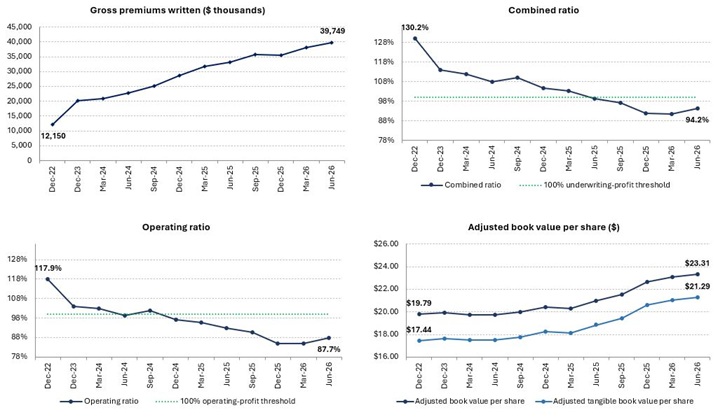
It is worth putting these results in context. Forge has a long operating history, but in many respects we have been building a new company since we went public in 2022 — new segments, new technology, new distribution partners, and quite a few new team members. In three and a half years we have grown gross premiums written from approximately $12 million to approximately $40 million on a trailing twelve-month basis, achieved full-year underwriting profitability in 2025 (though not yet consistently on a quarterly basis), and earned a rating upgrade that will open up distribution opportunities previously unavailable to us. We are still relatively early in that build, and improvements in our profitability metrics will not follow a linear path from quarter to quarter. Measured over longer periods the trend is unmistakable, and that is the horizon on which we and our Board manage the business.
Page 2 of 11
Two factors in particular can move results in any given quarter. The first is the timing of investment — the spending required to build a business of scale does not arrive on the same schedule as the revenue and profit it produces, which can hold our expense ratio above where the longer-term trend is heading. The second is our size — at our current scale the loss ratio is inherently lumpy, and any single quarter can look quite different from the long-term trend. This quarter we saw both, with the loss ratio the larger of the two, and together they pushed our combined ratio above 100%.
Our combined ratio was 102.8% for the quarter and 102.9% year-to-date, compared with 93.3% and 99.4% in the prior-year periods. The increase was driven primarily by our loss ratio, which moved to 62.6% in the quarter from 54.9% a year ago. As noted above, we would caution against reading too much into any single quarter in either direction.
The more meaningful lens is the longer-term trend, and there our results remain favorable. On a trailing twelve-month basis, our combined ratio was 94.2% and our operating ratio was 87.7% — both comfortably below 100%. On that same basis our loss ratio of 52.2% remains in line with our expectations and meaningfully below the commercial auto industry generally. We remained profitable on an operating basis this quarter, reporting pre-tax operating income of $260 thousand for the quarter and $509 thousand year-to-date.
On the expense side, the six-month view is the more useful one, and it is encouraging: our year-to-date expense ratio declined slightly even as we continued to invest. As we have discussed previously, our two largest fixed costs are people and technology, and both moved during the first half. On people, we made strategic investments in our business development and claims teams. Expanding business development is how we sustain the premium growth we have experienced over the past few years, though new team members take time to ramp — the expense comes ahead of the revenue. On claims, we would much rather carry excess capacity than the alternative; we are growing quickly, service levels matter, and we see real risk in under-resourcing the function. On technology, pricing for our policy system is tiered and declines as our premium revenue grows, but costs run higher as a percentage of revenue for a period after we cross into a new pricing tier. We have been in that transitional phase for most of 2026 and expect it to begin correcting in the second half as our revenue grows within the current pricing tier. We also continue to pursue efficiency opportunities across the organization, including evaluating where artificial intelligence can reduce manual intervention in our workflows.
We also want to share how we are thinking about our organization. Forge has evolved from a business built principally around public auto into a multi-segment insurer, and our small business segment has met or exceeded most of our production and profitability objectives since we launched it in 2022. The two segments serve different customers with different requirements, and over the coming quarters we expect to sharpen segment-level ownership so each has clear accountability for its own path forward. We view this primarily as a realignment of existing resources rather than a build-out.
We finished the first half with momentum. The investments weighing on our expense ratio today are the same investments that support the next phase of our growth. On the combined ratio, we are already below 100% on a trailing twelve-month basis; what we are working toward now is delivering that in each individual quarter. This mirrors the path we took with our operating ratio, which was our first financial milestone: below 100% on a trailing basis first, then with reasonable consistency on a quarterly basis. While we expect the path to be uneven rather than linear, the longer-term trends give us confidence. We remain grateful for the continued support of our shareholders.
Page 3 of 11
Trailing 12-month trends:
About Forge
Forge Group, Inc. is a commercial auto insurance specialist. We principally focus on delivering commercial auto insurance products to small business owners and operators that operate in (i) certain business class segments and (ii) certain geographic markets in the U.S. Additional information is available on the Company’s website at: www.forgeinsurance.com.
Forward-Looking Statements
This release includes forward-looking statements intended to qualify for the safe harbor from liability established by the Private Securities Litigation Reform Act of 1995. These forward-looking statements generally can be identified by phrases such as the Company or its management "believes," "expects," "anticipates," "foresees," "forecasts," "estimates" or other words or phrases of similar import. Similarly, statements herein that describe the Company’s business strategy, outlook, objectives, plans, intentions, or goals are also forward-looking statements. All such forward-looking statements are subject to certain risks and uncertainties that could cause actual results to differ materially from those in forward-looking statements. Please review the risks factors and uncertainties identified in the Company’s 2025 Annual Report on Form 1-K, Semi-Annual Reports on Form 1-SA and our other filings with the Securities and Exchange Commission. Any forward-looking statement made by the Company in this document speaks only as of the date of this release. Except as required by applicable law, we undertake no obligation to update any forward-looking statements, whether as a result of new information, future events or developments or otherwise.
Page 4 of 11
Note Regarding Financial Measures
Investors should be aware that accounting principles generally accepted in the United States prescribe when a company may reserve for particular risks, including litigation exposures. Accordingly, results for a given reporting period could be significantly affected if and when we establish reserves for one or more contingencies. Also, our regular reserve reviews may result in adjustments of varying magnitude as additional information regarding claims activity becomes known. Reported results, therefore, may be volatile in certain accounting periods.
Special Note Regarding Non-GAAP Financial Measures
We believe that the non-GAAP financial measures in this report, including those in the Exhibits, provide important and useful information for our shareholders. We use these non-GAAP measures for internal planning purposes and to evaluate our ongoing operations and performance. These non-GAAP financial measures are presented as supplemental information and not as alternatives to any GAAP financial measures.
Page 5 of 11
Exhibits
Exhibit 1: Simplified Income Statement
The “Simplified Income Statement” exhibit is a non-GAAP presentation of “Net income (loss) attributable to Forge Group, Inc.” and is based on the Company’s Consolidated Statements of Operations and Comprehensive Earnings. This exhibit separates the Company’s core insurance operations (including investment income earned on income-generating securities) from the following other activities and items: real estate operations, the impact of net realized and unrealized gains (losses) on investment securities, and certain non-recurring items.
| | Three months ended June 30 | | | Six months ended June 30 | |
||||||||||
| | 2026 | | | 2025 | | | 2026 | | | 2025 | |
||||
($000s) | | (unaudited) | | | (unaudited) | | | (unaudited) | | | (unaudited) | |
||||
| | | | | | | | | | | | | | | | |
Net premiums earned | | | 8,916 | | | | 7,703 | | | | 17,303 | | | | 14,771 | |
| | | | | | | | | | | | | | | | |
Losses and loss adjustment expenses | | | 5,579 | | | | 4,228 | | | | 10,624 | | | | 8,531 | |
| | | | | | | | | | | | | | | | |
Policy acquisition costs and other operating expenses | | | 3,486 | | | | 2,857 | | | | 7,024 | | | | 6,019 | |
Lease expense | | | 13 | | | | 52 | | | | 26 | | | | 99 | |
Sublease (income) | | | - | | | | (27 | ) | | | - | | | | (62 | ) |
Depreciation and amortization (excl. real estate) ¹ | | | 67 | | | | 67 | | | | 134 | | | | 134 | |
Service fee and other (income) expense | | | 20 | | | | 9 | | | | (3 | ) | | | (43 | ) |
Underwriting expenses | | | 3,586 | | | | 2,958 | | | | 7,181 | | | | 6,147 | |
| | | | | | | | | | | | | | | | |
Underwriting income (loss) | | | (249 | ) | | | 517 | | | | (502 | ) | | | 93 | |
Net investment income | | | 510 | | | | 461 | | | | 1,011 | | | | 944 | |
Pre-tax operating income (loss) | | | 261 | | | | 978 | | | | 509 | | | | 1,037 | |
Net realized and unrealized gains (losses) ² | | | 625 | | | | 481 | | | | 350 | | | | 205 | |
Income (loss) from real estate operations ³ | | | (199 | ) | | | 10 | | | | (191 | ) | | | 4 | |
Income (loss) before income taxes | | | 687 | | | | 1,469 | | | | 668 | | | | 1,246 | |
Income tax expense (benefit) | | | 281 | | | | 24 | | | | (1,067 | ) | | | 4 | |
Net income (loss) | | | 406 | | | | 1,445 | | | | 1,735 | | | | 1,242 | |
Net loss (gain) attributable to noncontrolling interest | | | 20 | | | | 4 | | | | 20 | | | | (1 | ) |
Net income (loss) attributable to Forge Group, Inc. | | | 426 | | | | 1,449 | | | | 1,755 | | | | 1,241 | |
Dividends payable to preferred shareholders | | | 117 | | | | 117 | | | | 234 | | | | 234 | |
Net income available to common shareholders | | | 309 | | | | 1,332 | | | | 1,521 | | | | 1,007 | |
| | | | | | | | | | | | | | | | |
GAAP Items | | | | | | | | | | | | | | | | |
Basic weighted-average shares outstanding | | | 2,068 | | | | 2,058 | | | | 2,066 | | | | 2,053 | |
Basic earnings per share | | $ | 0.15 | | | $ | 0.63 | | | $ | 0.73 | | | $ | 0.49 | |
Diluted weighted-average shares outstanding | | | 2,136 | | | | 2,564 | | | | 2,591 | | | | 2,095 | |
Diluted earnings per share | | $ | 0.14 | | | $ | 0.56 | | | $ | 0.67 | | | $ | 0.48 | |
| | | | | | | | | | | | | | | | |
Non-GAAP Items | | | | | | | | | | | | | | | | |
Pre-tax operating income (loss) ⁴ | | | 261 | | | | 978 | | | | 509 | | | | 1,037 | |
Weighted-average common share equivalents outstanding ⁵ | | | 2,607 | | | | 2,581 | | | | 2,604 | | | | 2,569 | |
Pre-tax operating income (loss) per share ⁶ | | $ | 0.10 | | | $ | 0.38 | | | $ | 0.20 | | | $ | 0.40 | |
Footnotes
| 1. | Total depreciation and amortization minus depreciation and amortization attributable to real estate. |
| 2. | Net realized investment gains (losses) plus net unrealized gains (losses) on equity securities. |
| 3. | Income from real estate held for investment minus (i) depreciation of real estate held for the production of income, (ii) amortization of leases in place, (iii) amortization of finance costs, (iv) real estate operating expenses, and (v) interest expense. |
| 4. | Pre-tax operating income (loss) is a non-GAAP financial metric which measures the profitability of our insurance operations before considering the impact of net realized and unrealized gains (losses) and income (loss) from real estate operations. |
Page 6 of 11
| 5. | Weighted-average common share equivalents is a non-GAAP measure used as the denominator in computing pre-tax operating income (loss) per share. It is calculated as the sum of (i) basic weighted-average shares outstanding, (ii) incremental shares underlying outstanding stock options (using the treasury stock method), (iii) weighted-average common shares underlying unvested restricted stock awards outstanding, and (iv) weighted-average common shares issuable upon conversion of the Company's Series A Preferred Stock. Unlike diluted weighted-average shares outstanding calculated under GAAP, this measure includes all potentially dilutive securities in all periods, including periods in which the Company reports a loss, when such securities would ordinarily be excluded from the GAAP calculation because their inclusion would be anti-dilutive (i.e., would reduce the loss per share). The Company believes that including these securities on a consistent basis provides a meaningful basis for comparison of per-share operating results across reporting periods. |
| 6. | Pre-tax operating income (loss) per share is a non-GAAP financial measure calculated by dividing pre-tax operating income (loss) (the numerator) by weighted-average common share equivalents (the denominator, as described in footnote 5). Management uses this measure to evaluate the Company's core insurance underwriting profitability on a per-share basis across reporting periods, without the variability in the share count that would result from excluding anti-dilutive securities under GAAP in loss periods. Because this measure departs from GAAP by including potentially dilutive securities regardless of their anti-dilutive effect, it should not be viewed as a substitute for GAAP diluted earnings (loss) per share and should be considered in conjunction with the Company's GAAP financial results. |
Page 7 of 11
Exhibit 2: Adjusted Book Value and Adjusted Tangible Book Value Per Share
“Adjusted book value per share” and “adjusted tangible book value per share” are non-GAAP metrics and are not intended to be an expression of the Company’s opinion of the value of its common stock.
| | As of | |
|||||||||
| | June 30, | | | December 31, | | | June 30, | |
|||
($000s except per-share items) | | 2026 | | | 2025 | | | 2025 | |
|||
| | | | | | | | | | | | |
Calculation of Numerators | | | | | | | | | | | | |
Total equity | | | 54,876 | | | | 53,467 | | | | 48,848 | |
Less: Noncontrolling interest | | | (741 | ) | | | (706 | ) | | | (702 | ) |
GAAP book value | | | 54,135 | | | | 52,761 | | | | 48,146 | |
Less: Accumulated other comprehensive (income) loss (AOCI) | | | 1,181 | | | | 776 | | | | 1,276 | |
GAAP book value excluding AOCI | | | 55,316 | | | | 53,537 | | | | 49,422 | |
Add: Theoretical proceeds from exercise of options ¹ | | | 1,487 | | | | 1,282 | | | | 1,282 | |
Add: Non-GAAP real estate adjustments, net ² | | | 5,613 | | | | 5,380 | | | | 5,002 | |
Adjusted book value (numerator) | | | 62,415 | | | | 60,199 | | | | 55,706 | |
Less: Goodwill and other intangibles | | | (5,408 | ) | | | (5,542 | ) | | | (5,675 | ) |
Adjusted tangible book value (numerator) | | | 57,007 | | | | 54,657 | | | | 50,031 | |
| | | | | | | | | | | | |
Calculation of Denominator | | | | | | | | | | | | |
Common shares outstanding | | | 2,068 | | | | 2,058 | | | | 2,058 | |
Common shares issuable upon conversion of Series A Preferred Stock ³ | | | 458 | | | | 458 | | | | 458 | |
Common shares underlying restricted stock awards outstanding ⁴ | | | 13 | | | | 16 | | | | 16 | |
Common shares issuable upon exercise of outstanding options ⁵ | | | 139 | | | | 124 | | | | 124 | |
Common share equivalents (denominator) | | | 2,678 | | | | 2,656 | | | | 2,656 | |
| | | | | | | | | | | | |
Non-GAAP Measures | | | | | | | | | | | | |
Adjusted book value per share ⁶ | | $ | 23.31 | | | $ | 22.66 | | | $ | 20.97 | |
Adjusted tangible book value per share ⁷ | | $ | 21.29 | | | $ | 20.58 | | | $ | 18.84 | |
Footnotes
| 1. | Proceeds that would be received from the exercise of outstanding stock options (vested and unvested). |
| 2. | Intended to represent Company’s interest in real estate investments at historical cost. See Exhibit 3. |
| 3. | Common shares issuable upon conversion of the Company’s Series A Preferred Stock. |
| 4. | Common shares underlying restricted stock awards outstanding (unvested). |
| 5. | Common shares underlying outstanding stock options (vested and unvested). |
| 6. | Adjusted book value (numerator) divided by common share equivalents (denominator). |
| 7. | Adjusted tangible book value (numerator) divided by common share equivalents (denominator). |
Page 8 of 11
Exhibit 3: Non-GAAP Real Estate Adjustments
The “Non-GAAP Real Estate Adjustments” contains certain non-GAAP adjustments and metrics intended to present the value of the Company’s interest in its real estate investments at historical cost. These non-GAAP adjustments and metrics are not intended to be an expression of the Company’s opinion of the value of its real estate investments.
| | As of | |
|||||||||
| | June 30, | | | December 31, | | | June 30, | |
|||
($000s) | | 2026 | | | 2025 | | | 2025 | |
|||
| | | | | | | | | | | | |
Real estate held for the production of income, net | | | 28,012 | | | | 28,319 | | | | 28,625 | |
Add: Leases in place | | | 1,985 | | | | 2,091 | | | | 2,196 | |
Add: Deferred rent ¹ | | | 2,612 | | | | 2,466 | | | | 2,460 | |
Real assets (GAAP) | | | 32,609 | | | | 32,876 | | | | 33,281 | |
Add: Accumulated depreciation ² | | | 7,456 | | | | 7,150 | | | | 6,844 | |
Add: Accumulated amortization ³ | | | 2,179 | | | | 2,073 | | | | 1,968 | |
Less: Deferred rent | | | (2,612 | ) | | | (2,466 | ) | | | (2,460 | ) |
Real assets (Non-GAAP) ⁴ | | | 39,632 | | | | 39,634 | | | | 39,633 | |
| | | | | | | | | | | | |
Notes payable, net (GAAP) | | | 24,032 | | | | 24,878 | | | | 25,224 | |
Add: Unamortized finance costs | | | 942 | | | | 929 | | | | 933 | |
Notes payable (Non-GAAP) ⁵ | | | 24,974 | | | | 25,807 | | | | 26,157 | |
| | | | | | | | | | | | |
Net real assets (Non-GAAP) ⁶ | | | 14,658 | | | | 13,827 | | | | 13,476 | |
Less: Net real assets (GAAP) ⁷ | | | (8,577 | ) | | | (7,998 | ) | | | (8,057 | ) |
Non-GAAP adjustments ⁸ | | | 6,081 | | | | 5,829 | | | | 5,419 | |
Less: Noncontrolling interest ⁹ | | | (468 | ) | | | (449 | ) | | | (417 | ) |
Non-GAAP real estate adjustments, net | | | 5,613 | | | | 5,380 | | | | 5,002 | |
Footnotes
| 1. | Cumulative difference between actual cash receipts and rental income recorded on a straight-line basis. |
| 2. | Accumulated depreciation on real estate held for the production of income. |
| 3. | Accumulated amortization on leases in place. |
| 4. | Approximation of total cost basis of real estate investments. |
| 5. | Gross principal amount of notes payable. |
| 6. | Real assets (non-GAAP) minus notes payable (non-GAAP). |
| 7. | Real assets (GAAP) minus notes payable (GAAP). |
| 8. | Difference between non-GAAP and GAAP net real assets |
| 9. | Portion of non-GAAP adjustments attributable to 7.7% owned by operating partner. |
Page 9 of 11
Exhibit 4: Consolidated Balance Sheet
| | As of | |
|||||||||
| | June 30, | | | December 31, | | | June 30, | |
|||
| | 2026 | | | 2025 | | | 2025 | |
|||
($000s) | | (unaudited) | | | (audited) | | | (unaudited) | |
|||
| | | | | | | | | | | | |
Assets | | | | | | | | | | | | |
Investments and cash: | | | | | | | | | | | | |
Fixed maturity securities, at fair value | | | 41,873 | | | | 32,840 | | | | 34,493 | |
Redeemable preferred stock, at fair value | | | - | | | | 591 | | | | 1,058 | |
Perpetual preferred stock, at fair value | | | - | | | | 91 | | | | 70 | |
Common stock, at fair value | | | 1,868 | | | | 1,862 | | | | 1,488 | |
Other invested assets | | | 5,894 | | | | 5,586 | | | | 5,189 | |
Real estate held for the production of income, net | | | 28,012 | | | | 28,319 | | | | 28,625 | |
Short-term investments | | | 1,041 | | | | 1,021 | | | | - | |
Cash and cash equivalents | | | 12,143 | | | | 18,198 | | | | 11,591 | |
Restricted cash | | | 770 | | | | 252 | | | | 246 | |
Total investments and cash | | | 91,601 | | | | 88,760 | | | | 82,760 | |
Accrued investment income | | | 377 | | | | 310 | | | | 306 | |
Premium and reinsurance balances receivable | | | 12,449 | | | | 12,215 | | | | 10,208 | |
Ceded unearned premiums | | | 178 | | | | 114 | | | | 143 | |
Reinsurance balances recoverable on unpaid losses | | | 2,535 | | | | 3,531 | | | | 2,236 | |
Deferred policy acquisition costs, net | | | 616 | | | | 528 | | | | 499 | |
Deferred rent | | | 2,612 | | | | 2,466 | | | | 2,460 | |
Leases in place | | | 1,985 | | | | 2,091 | | | | 2,196 | |
Right-of-use asset, net | | | 124 | | | | 146 | | | | 28 | |
Goodwill and other intangibles | | | 5,408 | | | | 5,542 | | | | 5,675 | |
Federal income tax receivable | | | 354 | | | | 281 | | | | - | |
Deferred income tax asset, net | | | 1,573 | | | | 217 | | | | - | |
Defined benefit plan surplus | | | 556 | | | | 535 | | | | - | |
Other assets | | | 1,098 | | | | 1,052 | | | | 1,583 | |
Total assets | | | 121,466 | | | | 117,788 | | | | 108,094 | |
| | | | | | | | | | | | |
Liabilities and Equity | | | | | | | | | | | | |
Liabilities: | | | | | | | | | | | | |
Unpaid losses and loss adjustment expenses | | | 19,364 | | | | 17,232 | | | | 15,555 | |
Unearned premium | | | 19,306 | | | | 17,844 | | | | 15,645 | |
Reinsurance balances payable | | | 4 | | | | 55 | | | | 13 | |
Accrued expenses | | | 3,251 | | | | 3,597 | | | | 2,256 | |
Notes payable | | | 24,032 | | | | 24,878 | | | | 25,224 | |
Defined benefit plan unfunded liability | | | - | | | | - | | | | 1 | |
Operating lease liability, net | | | 130 | | | | 143 | | | | 34 | |
Federal income tax payable | | | - | | | | - | | | | - | |
Other liabilities | | | 503 | | | | 572 | | | | 518 | |
Total liabilities | | | 66,590 | | | | 64,321 | | | | 59,246 | |
Mezzanine Equity: | | | | | | | | | | | | |
Preferred stock, without par value ¹ | | | - | | | | - | | | | - | |
Additional paid-in capital (Preferred Stock) | | | 5,227 | | | | 5,227 | | | | 5,227 | |
Stockholders' Equity: | | | | | | | | | | | | |
Common stock, $0.01 par value ² | | | 21 | | | | 21 | | | | 21 | |
Treasury stock | | | (283 | ) | | | (283 | ) | | | (283 | ) |
Additional paid-in capital | | | 17,195 | | | | 16,937 | | | | 16,913 | |
Unearned employee stock ownership plan shares | | | (1,218 | ) | | | (1,218 | ) | | | (1,421 | ) |
Retained earnings | | | 34,374 | | | | 32,853 | | | | 28,965 | |
Accumulated other comprehensive income (loss), net of tax | | | (1,181 | ) | | | (776 | ) | | | (1,276 | ) |
Noncontrolling interest | | | 741 | | | | 706 | | | | 702 | |
Total equity | | | 54,876 | | | | 53,467 | | | | 48,848 | |
Total liabilities and equity | | | 121,466 | | | | 117,788 | | | | 108,094 | |
Footnotes
| 1. | 1,000,000 shares authorized, 550,000 shares issued and outstanding. |
| 2. | 10,000,000 shares authorized, 2,067,528, 2,057,614 and 2,057,614 issued and outstanding, respectively. |
Page 10 of 11
Exhibit 5: Consolidated Statements of Operations and Comprehensive Earnings
| | Three months ended June 30 | | | Six months ended June 30 | |
||||||||||
| | 2026 | | | 2025 | | | 2026 | | | 2025 | |
||||
($000s) | | (unaudited) | | | (unaudited) | | | (unaudited) | | | (unaudited) | |
||||
| | | | | | | | | | | | | | | | |
Revenues | | | | | | | | | | | | | | | | |
Net premiums earned | | | 8,916 | | | | 7,703 | | | | 17,303 | | | | 14,771 | |
Income from real estate held for investment | | | 537 | | | | 546 | | | | 1,110 | | | | 1,092 | |
Net investment income | | | 510 | | | | 461 | | | | 1,011 | | | | 944 | |
Net realized investment gains (losses) | | | (24 | ) | | | (2 | ) | | | 356 | | | | (21 | ) |
Net unrealized gains (losses) on equity securities | | | 649 | | | | 483 | | | | (6 | ) | | | 226 | |
Service fee and other income (expense) | | | (20 | ) | | | (9 | ) | | | 3 | | | | 43 | |
Total revenues | | | 10,568 | | | | 9,182 | | | | 19,777 | | | | 17,055 | |
| | | | | | | | | | | | | | | | |
Expenses | | | | | | | | | | | | | | | | |
Losses and loss adjustment expenses | | | 5,579 | | | | 4,228 | | | | 10,624 | | | | 8,531 | |
Policy acquisition costs and other operating expenses | | | 3,486 | | | | 2,857 | | | | 7,024 | | | | 6,019 | |
Depreciation and amortization | | | 298 | | | | 296 | | | | 598 | | | | 592 | |
Real estate operating expense | | | 215 | | | | 32 | | | | 271 | | | | 79 | |
Interest expense on debt | | | 290 | | | | 275 | | | | 566 | | | | 551 | |
Lease expense | | | 13 | | | | 52 | | | | 26 | | | | 99 | |
Sublease income | | | - | | | | (27 | ) | | | - | | | | (62 | ) |
Total expenses | | | 9,881 | | | | 7,713 | | | | 19,109 | | | | 15,809 | |
Income before income taxes | | | 687 | | | | 1,469 | | | | 668 | | | | 1,246 | |
Income tax expense (benefit) | | | 281 | | | | 24 | | | | (1,067 | ) | | | 4 | |
Net income (loss) | | | 406 | | | | 1,445 | | | | 1,735 | | | | 1,242 | |
Net loss (gain) attributable to noncontrolling interest | | | 20 | | | | 4 | | | | 20 | | | | (1 | ) |
Net income attributable to Forge Group, Inc. | | | 426 | | | | 1,449 | | | | 1,755 | | | | 1,241 | |
| | | | | | | | | | | | | | | | |
Other comprehensive income (loss), net of tax | | | | | | | | | | | | | | | | |
Unrealized gains (losses) on AFS securities, net of tax | | | (127 | ) | | | 220 | | | | (481 | ) | | | 437 | |
Reclassification adjustment for losses (gains) included in net income | | | (2 | ) | | | - | | | | 96 | | | | - | |
Gains (losses) related to defined benefit plan | | | - | | | | - | | | | (19 | ) | | | - | |
Total other comprehensive income (loss), net of tax | | | (129 | ) | | | 220 | | | | (404 | ) | | | 437 | |
| | | | | | | | | | | | | | | | |
Total comprehensive income | | | 277 | | | | 1,665 | | | | 1,331 | | | | 1,679 | |
Page 11 of 11