Exhibit 99.3
| Q2 2026 Earnings Presentation BW LPG Kristian Sørensen and Samantha Xu 28 August 2026 |
| Disclaimer and forward-looking statements 2 NOT FOR RELEASE, PUBLICATION, DISTRIBUTION OR FORWARDING, IN WHOLE OR IN PART, DIRECTLY OR INDIRECTLY, IN OR IN TO ANY JURISDICTION IN WHICH THE SAME WOULD BE UNLAWFUL. BY ATTENDING THE MEETING WHERE THIS PRESENTATION IS MADE, OR BY READING THE PRESENTATION SLIDES, YOU ACKNOWLEDGE AND AGREE TO COMPLY WITH THE FOLLOWING RESTRICTIONS. This presentation has been produced by BW LPG Limited (“BW LPG”) exclusively for information purposes. This presentation may not be reproduced or redistributed, in whole or in part, to any other person. Matters discussed in this presentation and any materials distributed in connection with this presentation may constitute or include forward–looking statements. Forward–looking statements are statements that are not historical facts and may be identified by words such as “anticipates”, “believes”, “continues”, “estimates”, “expects”, “intends”, “may”, “should”, “will” and similar expressions, such as “going forward”. These forward–looking statements reflect BW LPG’s reasonable beliefs, intentions and current expectations concerning, among other things, BW LPG’s results of operations, financial condition, liquidity, prospects, growth and strategies. Forward–looking statements include statements regarding: objectives, goals, strategies, outlook and growth prospects; future plans, events or performance and potential for future growth; liquidity, capital resources and capital expenditures; economic outlook and industry trends; developments of BW LPG’s markets; the impact of regulatory initiatives; and the strength of BW LPG’s competitors. Forward–looking statements involve risks and uncertainties because they relate to events and depend on circumstances that may or may not occur in the future. The forward–looking statements in this presentation are based upon various assumptions, many of which are based, in turn, upon further assumptions, including without limitation, management’s examination of historical operating trends, data contained in BW LPG’s records and other data available from Fourth parties. Although BW LPG believes that these assumptions were reasonable when made, these assumptions are inherently subject to significant known and unknown risks, uncertainties, contingencies and other important factors which are difficult or impossible to predict and are beyond its control. Forward–looking statements are not guarantees of future performance and such risks, uncertainties, contingencies and other important factors could cause the actual results of operations, financial condition and liquidity of BW LPG or the industry to differ materially from those results expressed or implied in this presentation by such forward–looking statements. No representation is made that any of these forward–looking statements or forecasts will come to pass or that any forecast result will be achieved, and you are cautioned not to place any undue influence on any forward–looking statement. No representation, warranty or undertaking, express or implied, is made by BW LPG, its affiliates or representatives as to, and no reliance should be placed on, the fairness, accuracy, completeness or correctness of the information or the opinions contained herein, for any purpose whatsoever. Neither BW LPG nor any of its affiliates or representatives shall have any responsibility or liability whatsoever (for negligence or otherwise) for any loss whatsoever and howsoever arising from any use of this presentation or its contents or otherwise arising in connection with this presentation. All information in this presentation is subject to updating, revision, verification, correction, completion, amendment and may change materially and without notice. In giving this presentation, none of BW LPG, its affiliates or representatives undertakes any obligation to provide the recipient with access to any additional information or to update this presentation or any information or to correct any inaccuracies in any such information. The information contained in this presentation should be considered in the context of the circumstances prevailing at the time and has not been, and will not be, updated to reflect material developments which may occur after the date of the presentation. The contents of this presentation are not to be construed as legal, business, investment or tax advice. Each recipient should consult its own legal, business, investment or tax adviser as to legal, business, investment or tax advice. By attending this presentation, you acknowledge that you will be solely responsible for your own assessment of the market and the market position of BW LPG and that you will conduct your own analysis and be solely responsible for forming your own view on the potential future performance of the business of BW LPG. This presentation must be read in conjunction with the recent financial information and the disclosures therein. A number of measures are used to report the performance of our business, which are non-IFRS measures, such as TCE income – Shipping per available day, TCE income – Shipping per calendar day and Return on capital employed (ROCE). These measures are defined and reconciliations to the nearest IFRS measure are available in BW LPG’s Q2 2026 Interim Financial Report and BW LPG’s Registration Statement on Form 20-F. Neither this presentation nor anything contained herein shall form the basis of, or be relied upon in connection with, any offer or purchase whatsoever in any jurisdiction and shall not constitute or form part of an offer to sell or the solicitation of an offer to buy any securities in the United States or in any other jurisdiction. The securities referred to herein may not be offered or sold in the United States absent registration with the United States Securities and Exchange Commission or an exemption from registration under the U.S. Securities Act of 1933, as amended (the “Securities Act”). BW LPG does not intend to register any part of any offering in the United States or to conduct a public offering in the United States of the shares to which this presentation relates. In the EEA Member States, with the exception of Norway (each such EEA Member State, a “Relevant State“), this presentation and the information contained herein are intended only for and directed to qualified investors as defined in Article 2(e) of Regulation (EU) 2017/1129 of the European Parliament and of the Council of 14 June 2017 (the “Prospectus Regulation”). The securities mentioned in this presentation are not intended to be offered to the public in any Relevant State and are only available to qualified investors except in accordance with exceptions in the Prospectus Regulation. Persons in any Relevant State who are not qualified investors should not take any actions based on this presentation, nor rely on it. In the United Kingdom, this presentation is directed only at, and communicated only to, persons who are qualified investors within the meaning of Article 2(e) of the Prospectus Regulation as it forms part of domestic law in the United Kingdom by virtue of the European Union (Withdrawal) Act 2018 who are (i) persons who fall within the definition of "investment professional" in Article 19(5) of the Financial Services and Markets Act 2000 (Financial Promotion) Order 2005, as amended (the “Order”), or (ii) persons who fall within Article 49(2)(a) to (d) of the Order, or (iii) persons to whom it may otherwise be lawfully communicated (all such persons referred to in (i), (ii) and (iii) above together being referred to as “Relevant Persons”). This presentation must not be acted on or relied on by persons in the United Kingdom who are not Relevant Persons. |
| Agenda Q2 2026 Q2 2026 highlights Market overview Company performance Q&A |
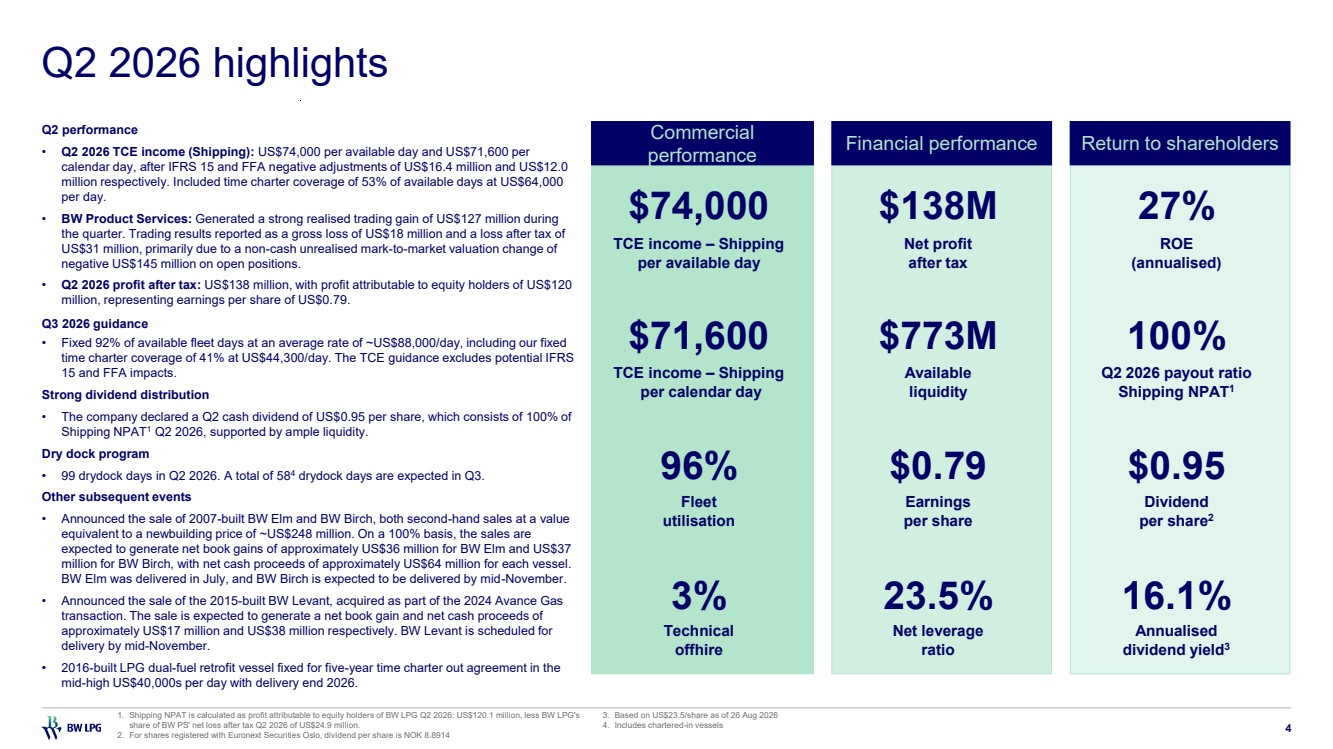
| Q2 2026 highlights 4 Return to shareholders $0.95 Dividend per share2 16.1% Annualised dividend yield3 27% ROE (annualised) 100% Q2 2026 payout ratio Shipping NPAT1 Financial performance $138M Net profit after tax $773M Available liquidity $0.79 Earnings per share 23.5% Net leverage ratio Commercial performance $74,000 TCE income – Shipping per available day $71,600 TCE income – Shipping per calendar day 96% Fleet utilisation 3% Technical offhire 1. Shipping NPAT is calculated as profit attributable to equity holders of BW LPG Q2 2026: US$120.1 million, less BW LPG's share of BW PS' net loss after tax Q2 2026 of US$24.9 million. 2. For shares registered with Euronext Securities Oslo, dividend per share is NOK 8.8914 3. Based on US$23.5/share as of 26 Aug 2026 4. Includes chartered-in vessels Q2 performance • Q2 2026 TCE income (Shipping): US$74,000 per available day and US$71,600 per calendar day, after IFRS 15 and FFA negative adjustments of US$16.4 million and US$12.0 million respectively. Included time charter coverage of 53% of available days at US$64,000 per day. • BW Product Services: Generated a strong realised trading gain of US$127 million during the quarter. Trading results reported as a gross loss of US$18 million and a loss after tax of US$31 million, primarily due to a non-cash unrealised mark-to-market valuation change of negative US$145 million on open positions. • Q2 2026 profit after tax: US$138 million, with profit attributable to equity holders of US$120 million, representing earnings per share of US$0.79. Q3 2026 guidance • Fixed 92% of available fleet days at an average rate of ~US$88,000/day, including our fixed time charter coverage of 41% at US$44,300/day. The TCE guidance excludes potential IFRS 15 and FFA impacts. Strong dividend distribution • The company declared a Q2 cash dividend of US$0.95 per share, which consists of 100% of Shipping NPAT1 Q2 2026, supported by ample liquidity. Dry dock program • 99 drydock days in Q2 2026. A total of 584 drydock days are expected in Q3. Other subsequent events • Announced the sale of 2007-built BW Elm and BW Birch, both second-hand sales at a value equivalent to a newbuilding price of ~US$248 million. On a 100% basis, the sales are expected to generate net book gains of approximately US$36 million for BW Elm and US$37 million for BW Birch, with net cash proceeds of approximately US$64 million for each vessel. BW Elm was delivered in July, and BW Birch is expected to be delivered by mid-November. • Announced the sale of the 2015-built BW Levant, acquired as part of the 2024 Avance Gas transaction. The sale is expected to generate a net book gain and net cash proceeds of approximately US$17 million and US$38 million respectively. BW Levant is scheduled for delivery by mid-November. • 2016-built LPG dual-fuel retrofit vessel fixed for five-year time charter out agreement in the mid-high US$40,000s per day with delivery end 2026. |
| Agenda Q2 2026 Q2 2026 highlights Market overview Company performance Q&A |
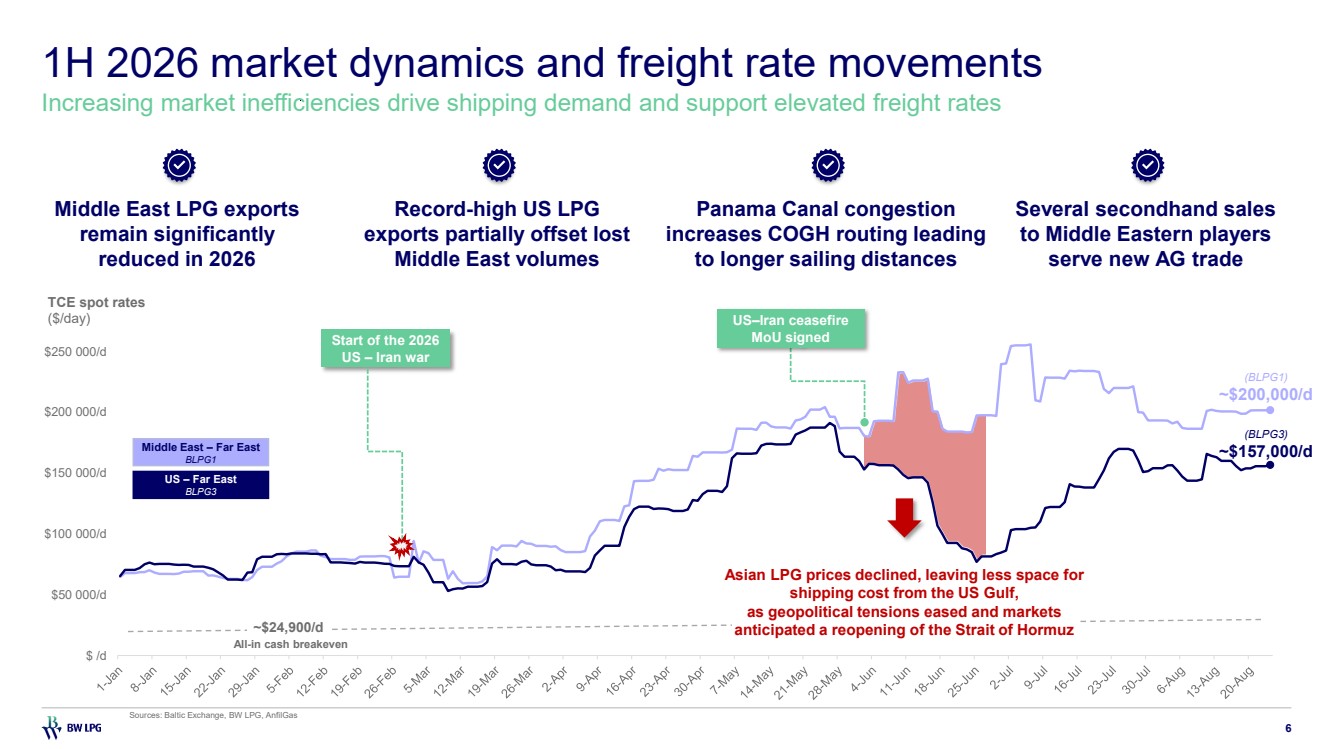
| 1H 2026 market dynamics and freight rate movements 6 Increasing market inefficiencies drive shipping demand and support elevated freight rates Middle East LPG exports remain significantly reduced in 2026 Panama Canal congestion increases COGH routing leading to longer sailing distances Record-high US LPG exports partially offset lost Middle East volumes Several secondhand sales to Middle Eastern players serve new AG trade Sources: Baltic Exchange, BW LPG, AnfilGas $ /d $50 000/d $100 000/d $150 000/d $200 000/d $250 000/d $300 000/d Middle East – Far East BLPG1 US – Far East BLPG3 Start of the 2026 US – Iran war (BLPG3) ~$157,000/d (BLPG1) ~$200,000/d TCE spot rates ($/day) All-in cash breakeven ~$24,900/d US–Iran ceasefire MoU signed Asian LPG prices declined, leaving less space for shipping cost from the US Gulf, as geopolitical tensions eased and markets anticipated a reopening of the Strait of Hormuz |
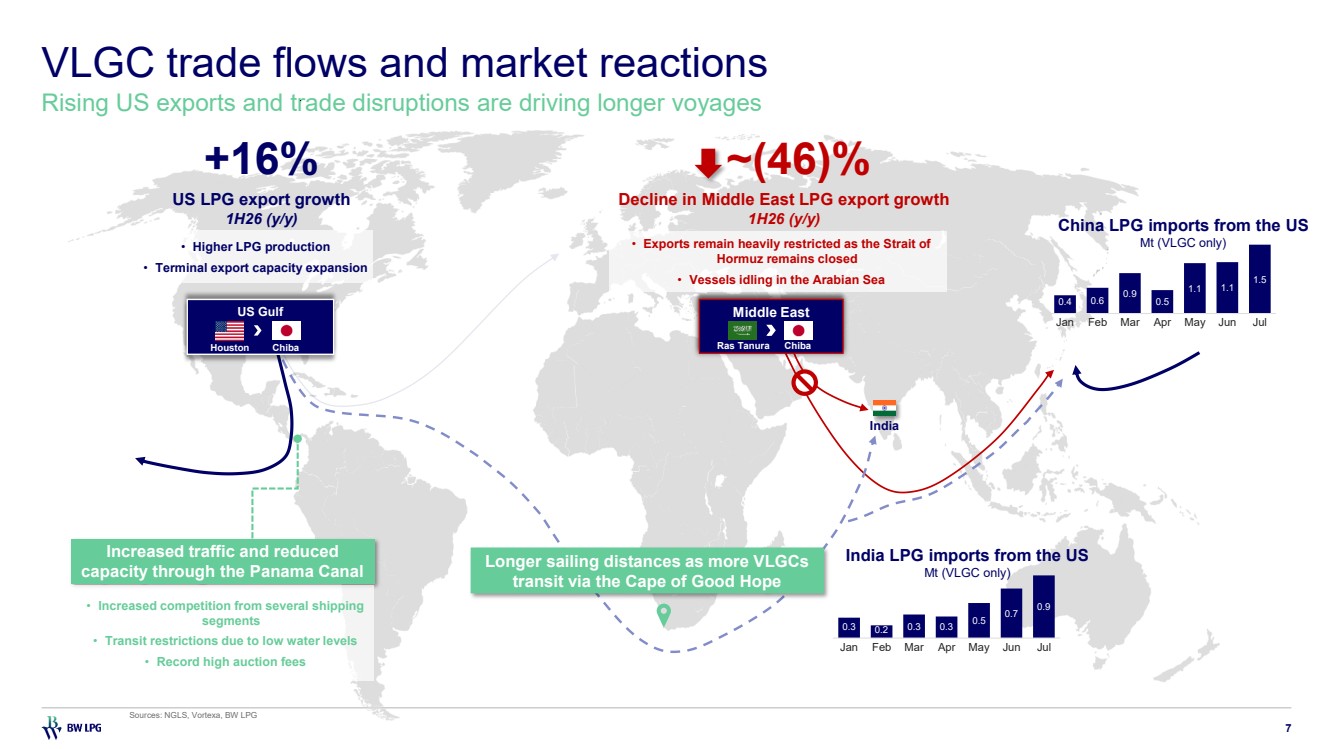
| VLGC trade flows and market reactions 7 Rising US exports and trade disruptions are driving longer voyages Sources: NGLS, Vortexa, BW LPG India US Gulf Houston Chiba Middle East Ras Tanura Chiba US LPG export growth 1H26 (y/y) +16% • Higher LPG production • Terminal export capacity expansion Longer sailing distances as more VLGCs transit via the Cape of Good Hope ~(46)% Decline in Middle East LPG export growth 1H26 (y/y) • Exports remain heavily restricted as the Strait of Hormuz remains closed • Vessels idling in the Arabian Sea 0.4 0.6 0.9 0.5 1.1 1.1 1.5 Jan Feb Mar Apr May Jun Jul China LPG imports from the US Mt (VLGC only) 0.3 0.2 0.3 0.3 0.5 0.7 0.9 Jan Feb Mar Apr May Jun Jul India LPG imports from the US Mt (VLGC only) Increased traffic and reduced capacity through the Panama Canal • Increased competition from several shipping segments • Transit restrictions due to low water levels • Record high auction fees |
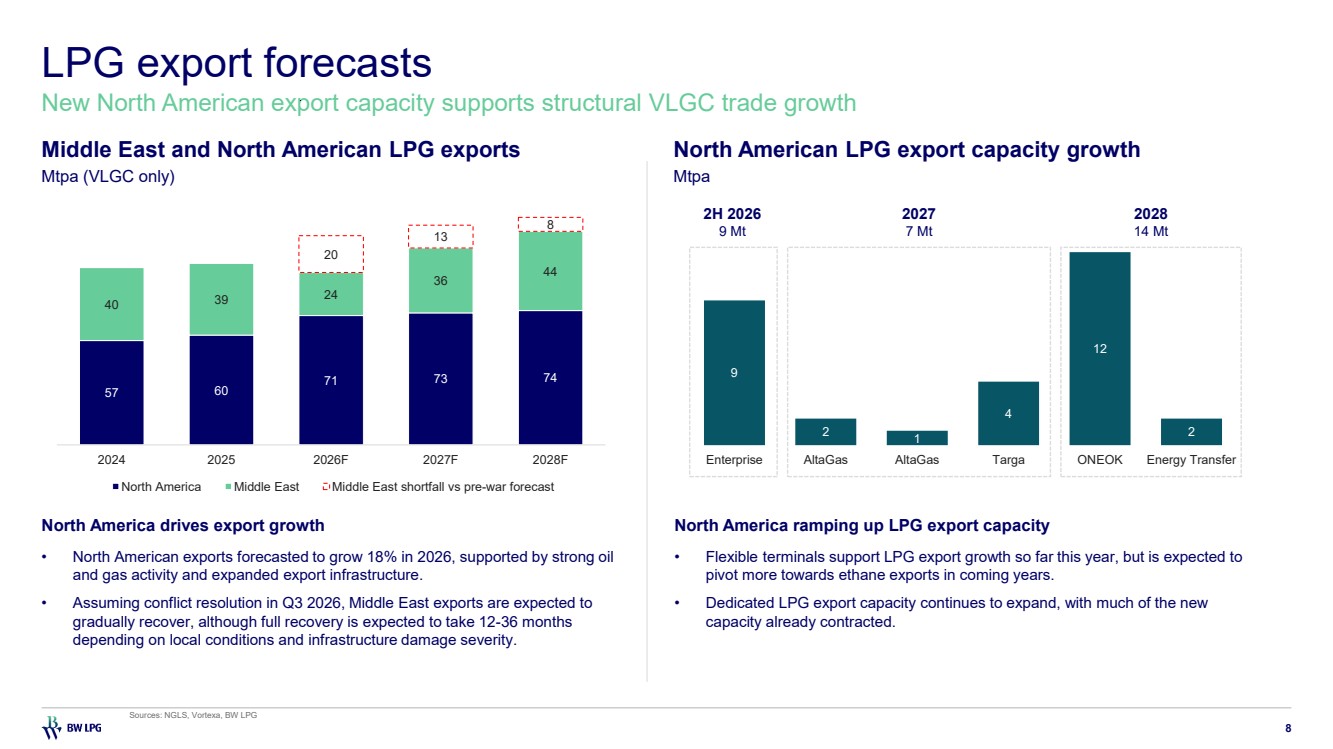
| LPG export forecasts 8 New North American export capacity supports structural VLGC trade growth Sources: NGLS, Vortexa, BW LPG • North American exports forecasted to grow 18% in 2026, supported by strong oil and gas activity and expanded export infrastructure. • Assuming conflict resolution in Q3 2026, Middle East exports are expected to gradually recover, although full recovery is expected to take 12-36 months depending on local conditions and infrastructure damage severity. North America drives export growth • Flexible terminals support LPG export growth so far this year, but is expected to pivot more towards ethane exports in coming years. • Dedicated LPG export capacity continues to expand, with much of the new capacity already contracted. North America ramping up LPG export capacity Middle East and North American LPG exports Mtpa (VLGC only) North American LPG export capacity growth Mtpa 57 60 71 73 74 40 39 24 36 44 20 13 8 2024 2025 2026F 2027F 2028F North America Middle East Middle East shortfall vs pre-war forecast 9 2 1 4 12 2 Enterprise AltaGas AltaGas Targa ONEOK Energy Transfer 2H 2026 9 Mt 2028 14 Mt 2027 7 Mt |
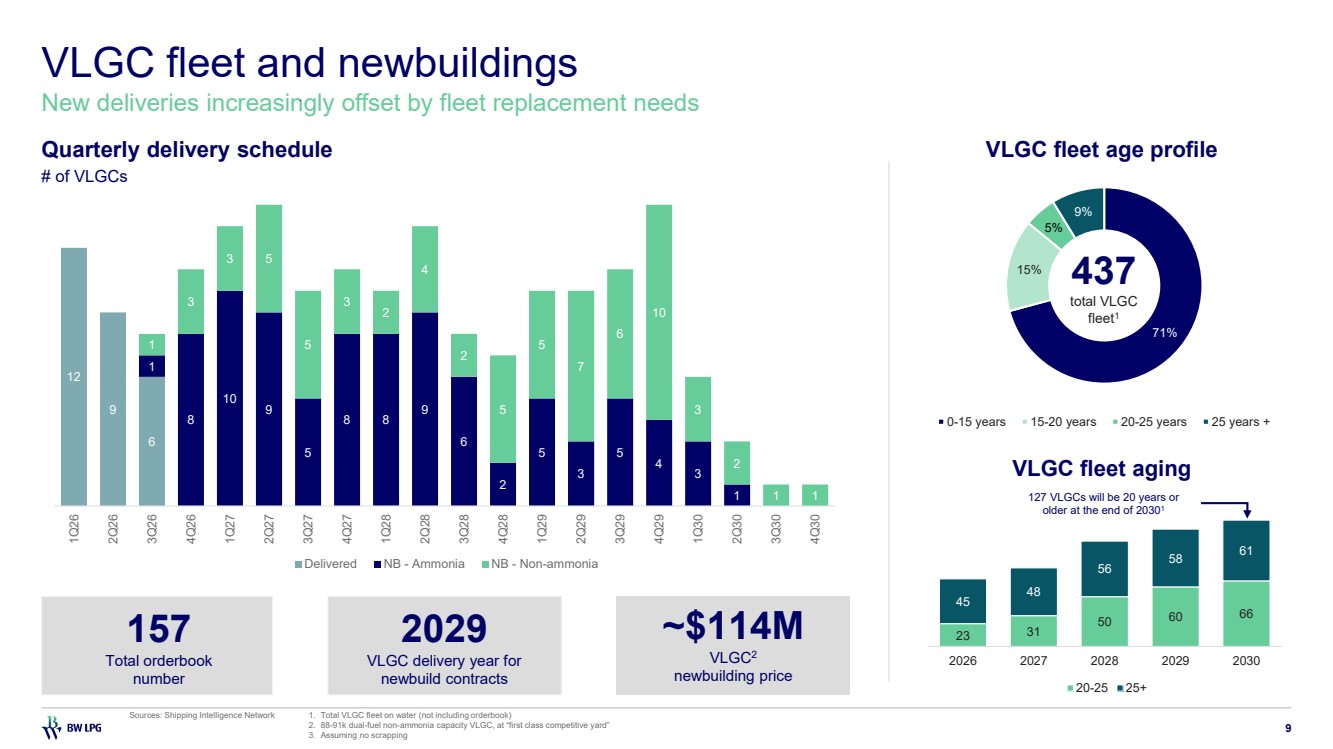
| 23 31 50 60 66 45 48 56 58 61 2026 2027 2028 2029 2030 20-25 25+ VLGC fleet and newbuildings 9 New deliveries increasingly offset by fleet replacement needs Sources: Shipping Intelligence Network 1. Total VLGC fleet on water (not including orderbook) 2. 88-91k dual-fuel non-ammonia capacity VLGC, at “first class competitive yard” 3. Assuming no scrapping Quarterly delivery schedule # of VLGCs VLGC fleet age profile 71% 15% 5% 9% 0-15 years 15-20 years 20-25 years 25 years + 437 total VLGC fleet1 VLGC fleet aging ~$114M VLGC2 newbuilding price 2029 VLGC delivery year for newbuild contracts 157 Total orderbook number 127 VLGCs will be 20 years or older at the end of 20301 12 9 6 1 8 10 9 5 8 8 9 6 2 5 3 5 4 3 1 1 3 3 5 5 3 2 4 2 5 5 7 6 10 3 2 1 1 1Q26 2Q26 3Q26 4Q26 1Q27 2Q27 3Q27 4Q27 1Q28 2Q28 3Q28 4Q28 1Q29 2Q29 3Q29 4Q29 1Q30 2Q30 3Q30 4Q30 Delivered NB - Ammonia NB - Non-ammonia |
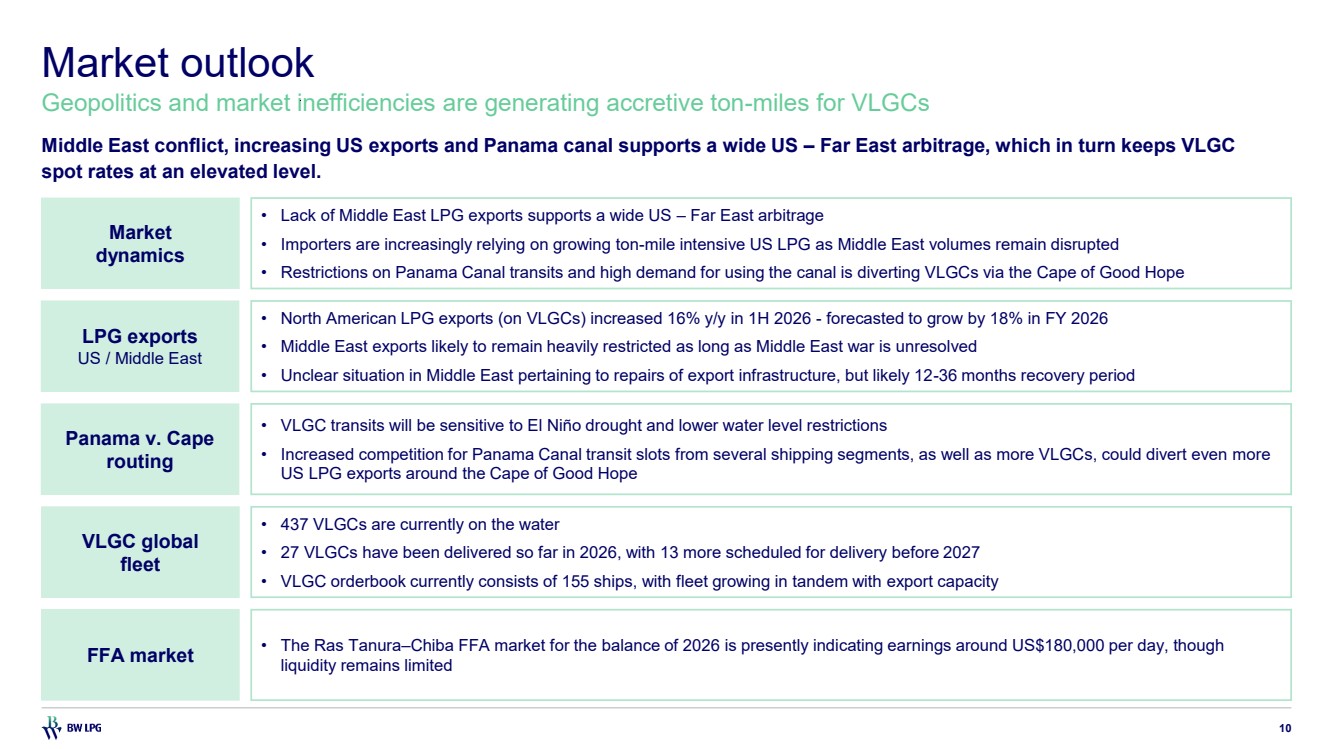
| Market outlook 10 Geopolitics and market inefficiencies are generating accretive ton-miles for VLGCs • 437 VLGCs are currently on the water • 27 VLGCs have been delivered so far in 2026, with 13 more scheduled for delivery before 2027 • VLGC orderbook currently consists of 155 ships, with fleet growing in tandem with export capacity LPG exports US / Middle East Market dynamics VLGC global fleet Panama v. Cape routing FFA market • North American LPG exports (on VLGCs) increased 16% y/y in 1H 2026 - forecasted to grow by 18% in FY 2026 • Middle East exports likely to remain heavily restricted as long as Middle East war is unresolved • Unclear situation in Middle East pertaining to repairs of export infrastructure, but likely 12-36 months recovery period • Lack of Middle East LPG exports supports a wide US – Far East arbitrage • Importers are increasingly relying on growing ton-mile intensive US LPG as Middle East volumes remain disrupted • Restrictions on Panama Canal transits and high demand for using the canal is diverting VLGCs via the Cape of Good Hope • VLGC transits will be sensitive to El Niño drought and lower water level restrictions • Increased competition for Panama Canal transit slots from several shipping segments, as well as more VLGCs, could divert even more US LPG exports around the Cape of Good Hope • The Ras Tanura–Chiba FFA market for the balance of 2026 is presently indicating earnings around US$180,000 per day, though liquidity remains limited Middle East conflict, increasing US exports and Panama canal supports a wide US – Far East arbitrage, which in turn keeps VLGC spot rates at an elevated level. |
| Agenda Q2 2026 Q2 2026 highlights Market overview Company performance Q&A |
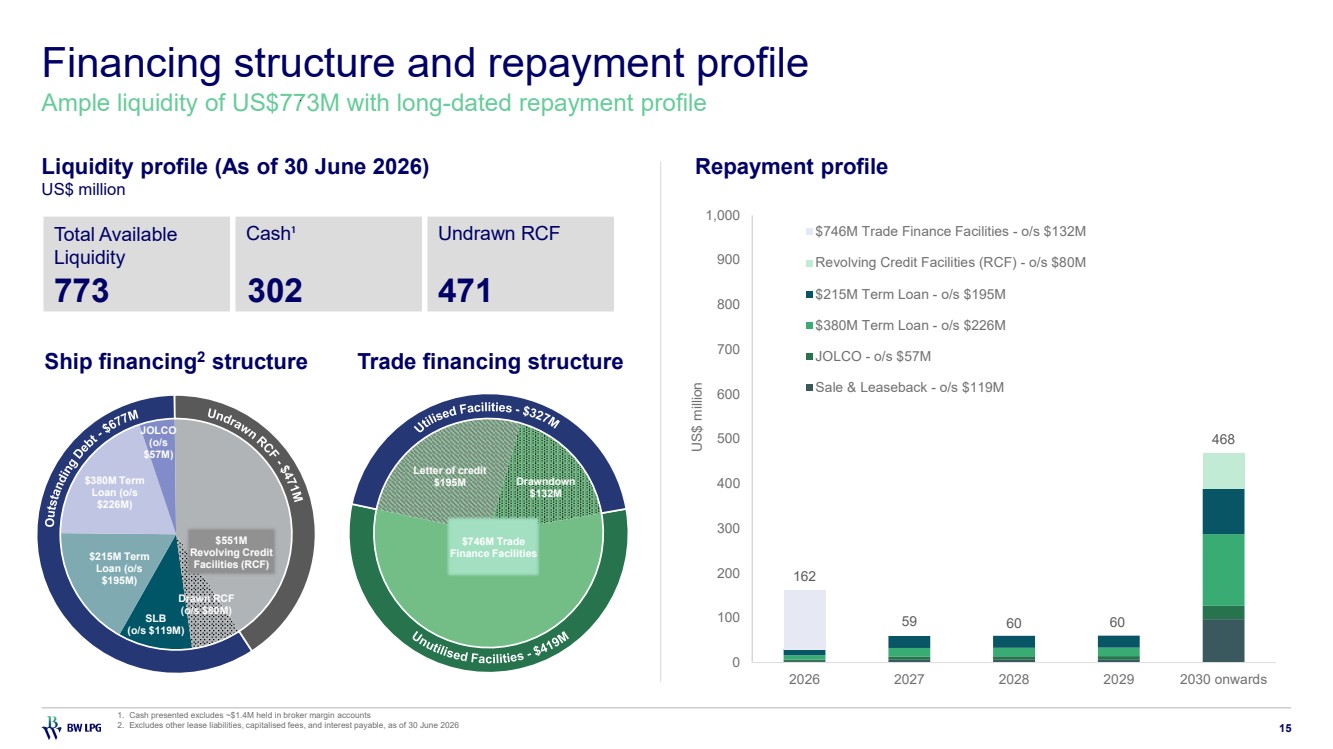
| Shipping – Performance 12 Achieved 96% utilisation generating TCE income – Shipping of US$74,000 per available day Q3 2026 • Fixed 92% of our available fleet days at an average rate of ~US$88,000 per day4, including our fixed time charter coverage of 41% at US$44,300/day. The TCE guidance excludes potential IFRS 15 and FFA impacts. 3% 97% TCE income by calendar days US$71,600/day1 Technical off-hire Available days 53% 46% TCE income by available days US$74,000/day2 US$85,2002 (incl. waiting time and FFA) Spot US$87,6003 (excl. waiting time and FFA) Waiting 1% Time Charter US$64,0005 2H 2026 Time charter % of total Fleet Revenue/ (Cost) in US$M Average day rate TC out – Fixed rate 2% $8 $44,100 TC in – Fixed rate 2% ($7) $37,500 Net $1 Remaining TC out – Fixed rate 39% $249 $44,100 2H 2026 charter portfolio • 41% covered by fixed rate TC out at US$44,100/day • 4% covered by FFA hedges at avg. of US$48,000/day Q2 2026 performance Guidance 1. TCE rates per day are inclusive of both commercial waiting and technical offhire days (i.e. 100% of calendar days) 2. TCE rates per day are inclusive of commercial waiting days and exclusive of technical offhire days (i.e. 100% of available days) 3. TCE rates per day are exclusive of both commercial waiting and technical offhire days 4. Discharge to discharge basis 5. Time charter includes fixed and variable rate |
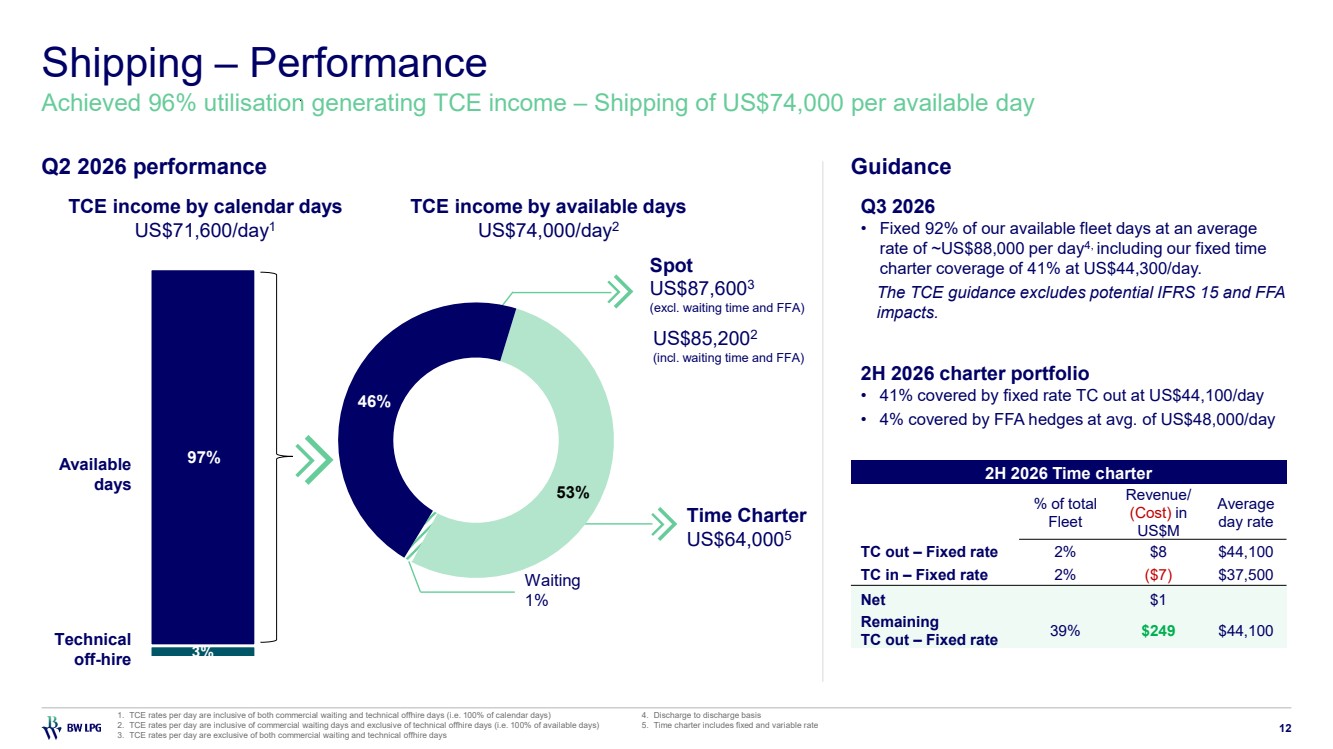
| Product Services – Performance 13 Strong positive realised results under turbulent market conditions as a result of effective risk management Q2 2026 performance Book equity 1. Gross profit from Product Services represents the net trading results which comprise revenue and cost of LPG cargo, derivative gains and losses, and other trading attributable costs, including depreciation from Product Services’ lease-in vessels 2. Unrealised physical shipping is a Non-IFRS measure and refers to the forward value of Time Charter-in contracts based on forward market freight indexes $119M Net asset value end of Q2 $31M Net loss $18M Gross loss1 $17M Average VAR $70M Unrealised physical shipping2 7% BW LPG VLGC cargoes lifted by BW PS 150 127 (190) 45 (13) 119 70 Net assets Q1 2026 Realised positions MTM change in unrealised cargo MTM change in unrealised paper Other expenses Net assets Q2 2026 Unrealised physical shipping Net loss: $31m US$ million |
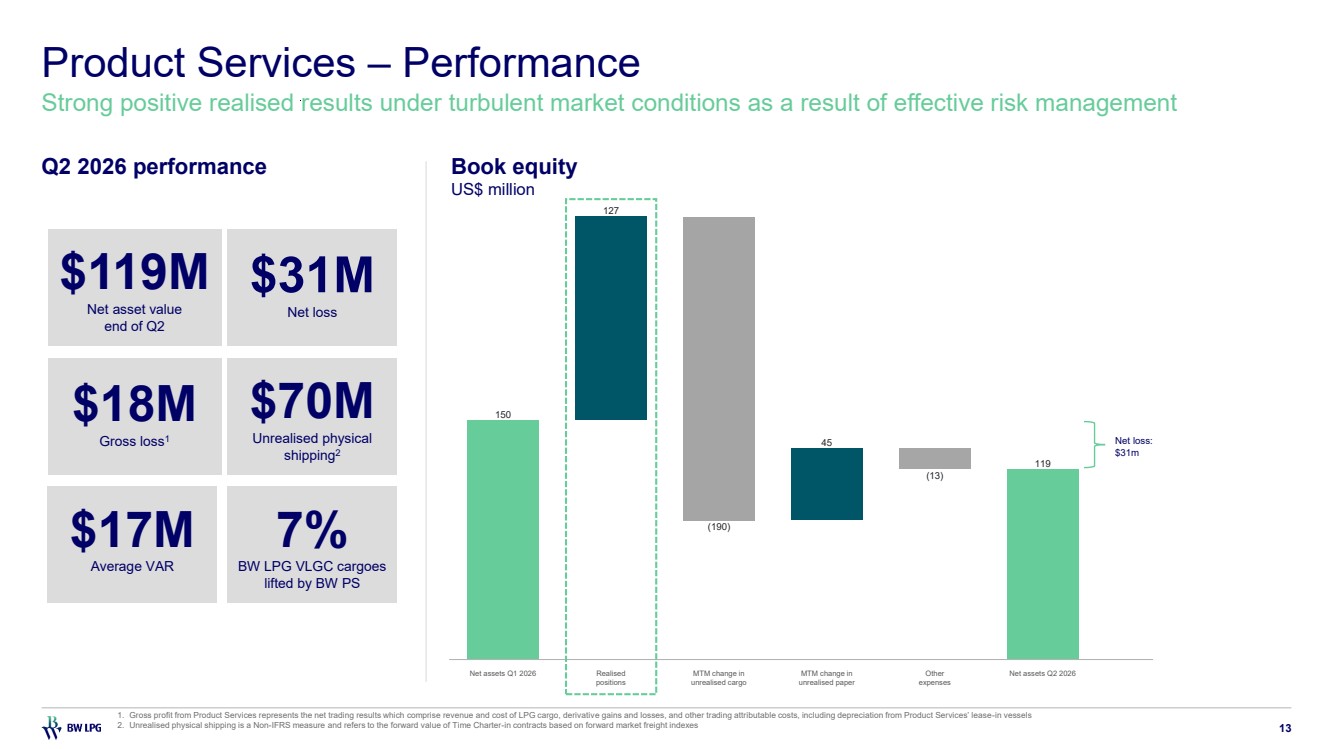
| Financial highlights 14 Low leverage, strong liquidity, ready for growth opportunities Key financials Q2 2026 Financial ratios Q2 2026 US$ million Q2 2026 Daily TCE Income $71,600 Q2 2026 Daily OPEX $8,800 FY 2026 Operating cash breakeven8 Owned $18,800 Total fleet $21,700 FY 2026 All-in cash breakeven9 $24,900 Income statement Profit after tax $138 Profit to equity holders $120 Earnings per share1 $0.79 Dividends per share2 $0.95 Balance sheet Total assets $3,389 Total liabilities $1,334 Total shareholders’ equity $2,055 Shipping per day statistics US$/day Earnings Yield3 (annualised) 18% Dividend Yield4 (annualised) 16.1% ROE5 (annualised) 27% ROCE6 (annualised) 19% Net leverage ratio7 23.5% 0.09 0.85 0.84 0.56 1.28 3.46 2.42 1.47 1.62 2016 2017 2018 2019 2020 2021 2022 2023 2024 2025 YTD 2026 Dividends per share US$ 1.EPS (earnings per share) is computed based on the weighted average number of shares outstanding less treasury shares during the period 2.For shares registered with Euronext Securities Oslo, dividend per share is NOK 8.8914 3.Earnings yield: EPS divided by the share price at the end of the period in USD terms 4.Dividend yield: Based on US$23.5/share as of 26 Aug 2026 5.ROE (return on equity): with respect to a particular financial period, the ratio of the profit after tax to the average of the shareholders’ equity, calculated as the average of the opening and closing balance for the financial period as presented in the consolidated balance sheet. 6.ROCE (return on capital employed): with respect to a particular financial period, the ratio of the operating profit to capital employed defined as the average of the total shareholders’ equity, total borrowings and lease liabilities, calculated as the average of the opening and closing balance for the financial period as presented in the consolidated balance sheet. 7.Net leverage ratio: The sum of total borrowings and lease liabilities minus cash and cash equivalents as set out in the consolidated statement of cash flows, divided by the sum of the total borrowings, total lease liabilities, and shareholders’ equity minus cash and cash equivalents as set out in the consolidated statement of cashflows 8.Operating cash breakeven: Total expected cash costs (excluding capex) divided by available days, owned fleet or total fleet 9.All-in cash breakeven: Operating cash breakeven including capex (maintenance and drydock) (%) |
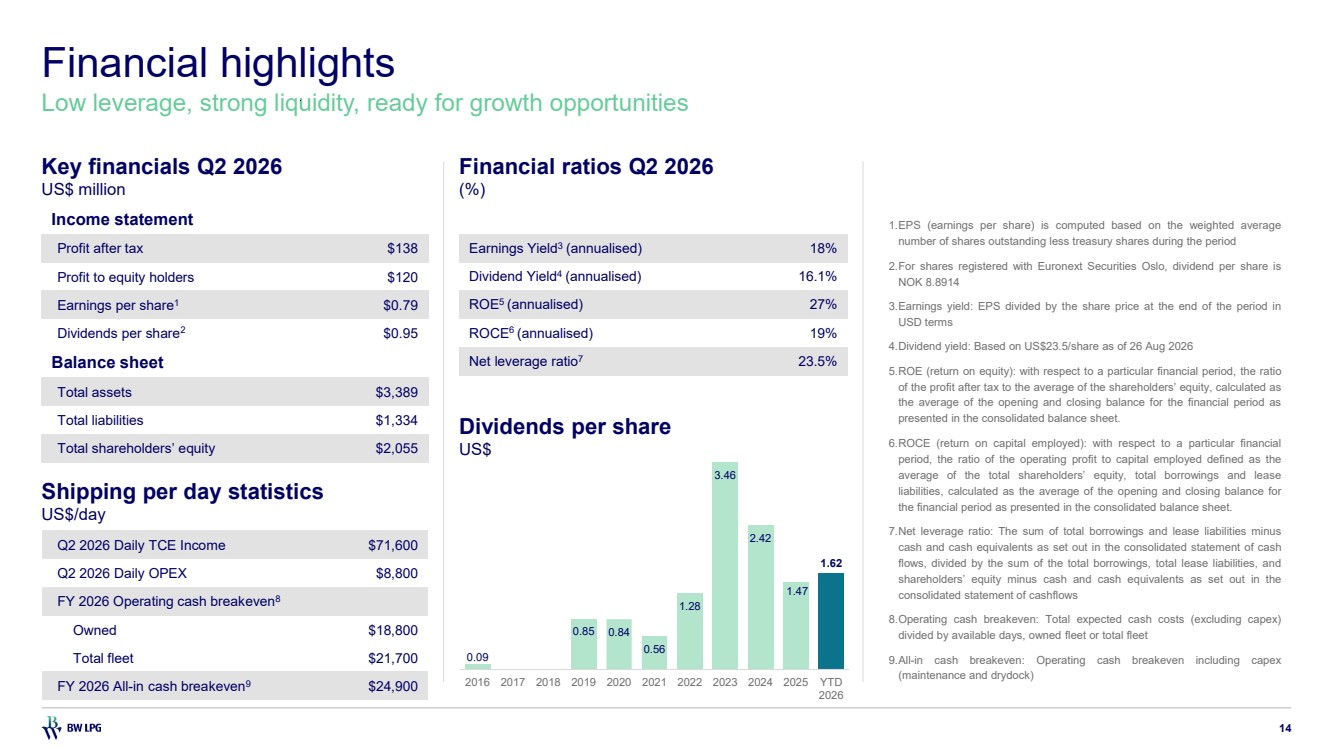
| Financing structure and repayment profile 15 Ample liquidity of US$773M with long-dated repayment profile Liquidity profile (As of 30 June 2026) Repayment profile 1. Cash presented excludes ~$1.4M held in broker margin accounts 2. Excludes other lease liabilities, capitalised fees, and interest payable, as of 30 June 2026 US$ million Total Available Liquidity 773 Undrawn RCF 471 Cash¹ 302 Ship financing2 structure Trade financing structure SLB (o/s $119M) $215M Term Loan (o/s $195M) $380M Term Loan (o/s $226M) JOLCO (o/s $57M) $551M Revolving Credit Facilities (RCF) Drawn RCF (o/s $80M) Undrawn RCF - $471 M O utstanding Debt - $677M Letter of credit $195M Drawndown $132M $746M Trade Finance Facilities Unutilised Facilities - $419M Utilised Facilities - $327M 162 59 60 60 468 0 100 200 300 400 500 600 700 800 900 1,000 2026 2027 2028 2029 2030 onwards US$ million $746M Trade Finance Facilities - o/s $132M Revolving Credit Facilities (RCF) - o/s $80M $215M Term Loan - o/s $195M $380M Term Loan - o/s $226M JOLCO - o/s $57M Sale & Leaseback - o/s $119M |
| Agenda Q2 2026 Q2 2026 highlights Market overview Company performance Q&A |
| Agenda Q&A Kristian Sørensen CEO Samantha Xu CFO |
| Thank you 18 Investor Relations investor.relations@bwlpg.com Ticker Oslo Stock Exchange “BWLPG” New York Stock Exchange “BWLP” LinkedIn linkedin.com/company/bwlpg Website https://www.bwlpg.com/investor/ Telephone +65 6705 5588 Address 10 Pasir Panjang Road Mapletree Business City #17-02 Singapore 117438 |
| Appendix Q2 2026 |

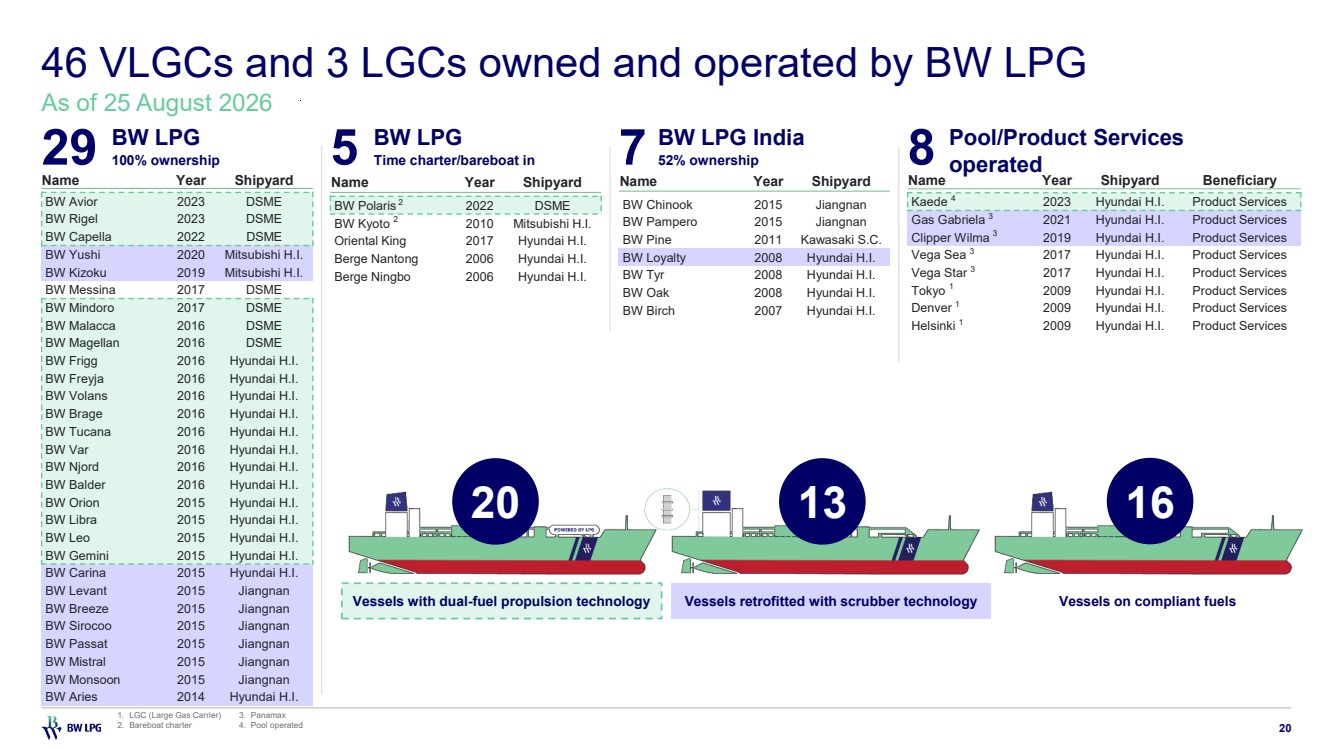
| 46 VLGCs and 3 LGCs owned and operated by BW LPG 20 As of 25 August 2026 BW LPG 100% ownership Vessels with dual-fuel propulsion technology Vessels on compliant fuels 20 29 BW LPG 5 Time charter/bareboat in BW LPG India 7 52% ownership Pool/Product Services 8 operated Vessels retrofitted with scrubber technology 13 16 Name Year Shipyard BW Avior 2023 DSME BW Rigel 2023 DSME BW Capella 2022 DSME BW Yushi 2020 Mitsubishi H.I. BW Kizoku 2019 Mitsubishi H.I. BW Messina 2017 DSME BW Mindoro 2017 DSME BW Malacca 2016 DSME BW Magellan 2016 DSME BW Frigg 2016 Hyundai H.I. BW Freyja 2016 Hyundai H.I. BW Volans 2016 Hyundai H.I. BW Brage 2016 Hyundai H.I. BW Tucana 2016 Hyundai H.I. BW Var 2016 Hyundai H.I. BW Njord 2016 Hyundai H.I. BW Balder 2016 Hyundai H.I. BW Orion 2015 Hyundai H.I. BW Libra 2015 Hyundai H.I. BW Leo 2015 Hyundai H.I. BW Gemini 2015 Hyundai H.I. BW Carina 2015 Hyundai H.I. BW Levant 2015 Jiangnan BW Breeze 2015 Jiangnan BW Sirocoo 2015 Jiangnan BW Passat 2015 Jiangnan BW Mistral 2015 Jiangnan BW Monsoon 2015 Jiangnan BW Aries 2014 Hyundai H.I. Name Year Shipyard BW Polaris 2 2022 DSME BW Kyoto 2 2010 Mitsubishi H.I. Oriental King 2017 Hyundai H.I. Berge Nantong 2006 Hyundai H.I. Berge Ningbo 2006 Hyundai H.I. Name Year Shipyard BW Chinook 2015 Jiangnan BW Pampero 2015 Jiangnan BW Pine 2011 Kawasaki S.C. BW Loyalty 2008 Hyundai H.I. BW Tyr 2008 Hyundai H.I. BW Oak 2008 Hyundai H.I. BW Birch 2007 Hyundai H.I. Name Year Shipyard Beneficiary Kaede 4 2023 Hyundai H.I. Product Services Gas Gabriela 3 2021 Hyundai H.I. Product Services Clipper Wilma 3 2019 Hyundai H.I. Product Services Vega Sea 3 2017 Hyundai H.I. Product Services Vega Star 3 2017 Hyundai H.I. Product Services Tokyo 1 2009 Hyundai H.I. Product Services Denver 1 2009 Hyundai H.I. Product Services Helsinki 1 2009 Hyundai H.I. Product Services 1. LGC (Large Gas Carrier) 2. Bareboat charter 3. Panamax 4. Pool operated |
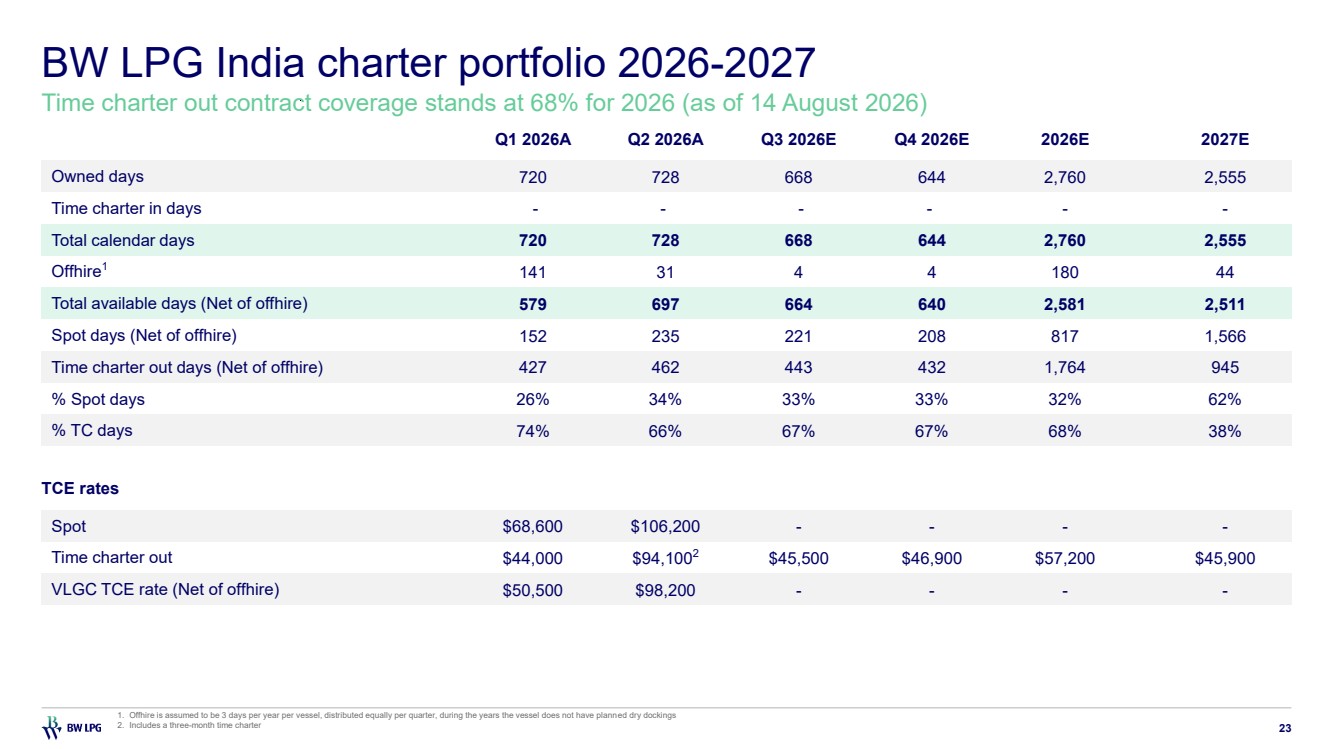
| VLGC charter portfolio overview 21 Fixed rate time charter out coverage for 2H 2026 at 41% with an average rate of US$44,100 per day $48.0 $43.5 $37.7 2026 2027 $57 $1 8% 2026 2027 $13 $12 $15 $16 $1 10% 7% 7% 8% 1Q 26 2Q 26 3Q 26 4Q 26 1Q 27 2Q 27 3Q 27 4Q 27 Quarterly $46.6 $57.1 $44.3 $43.8 $44.0 $44.4 $43.3 $42.5 $38.5 $37.5 $37.5 $37.5 $35.3 1Q 26 2Q 26 3Q 26 4Q 26 1Q 27 2Q 27 3Q 27 4Q 27 Quarterly Avg. TC out rate Avg. TC in rate 2H 2026 Time charter % of total fleet Revenue/ (Cost) in $M Average day rate TC out - Fixed rate 2% $8 $44,100 TC in - Fixed rate 2% ($7) $37,500 Net $1 Remaining TC out - Fixed rate 39% $249 $44,100 Revenue in USD millions % of total available days of the whole fleet Cost in USD millions % of total available days of the whole fleet Yearly Yearly Yearly 3 1 $293 $211 42% 36% 2026 2027 $68 $91 $68 $66 $56 $52 $52 $50 41% 43% 41% 41% 40% 35% 34% 32% 1Q 26 2Q 26 3Q 26 4Q 26 1Q 27 2Q 27 3Q 27 4Q 27 Quarterly 4 Time charter-out % TC days – fixed rate Time charter-out – Fixed rate US$ thousands/day Time charter-in2 % TC days – fixed rate 2H 2026 time charter position 1. % of fleet ratio is basis: TC out is based on total available days and TC in is based on total calendar days 2. Includes both fixed and variable TC in contracts 3. Majority of the TC in contracts will end in 2026 with the last TC in contract expiring in end-Jan 2027 4. Includes a three-month time charter |
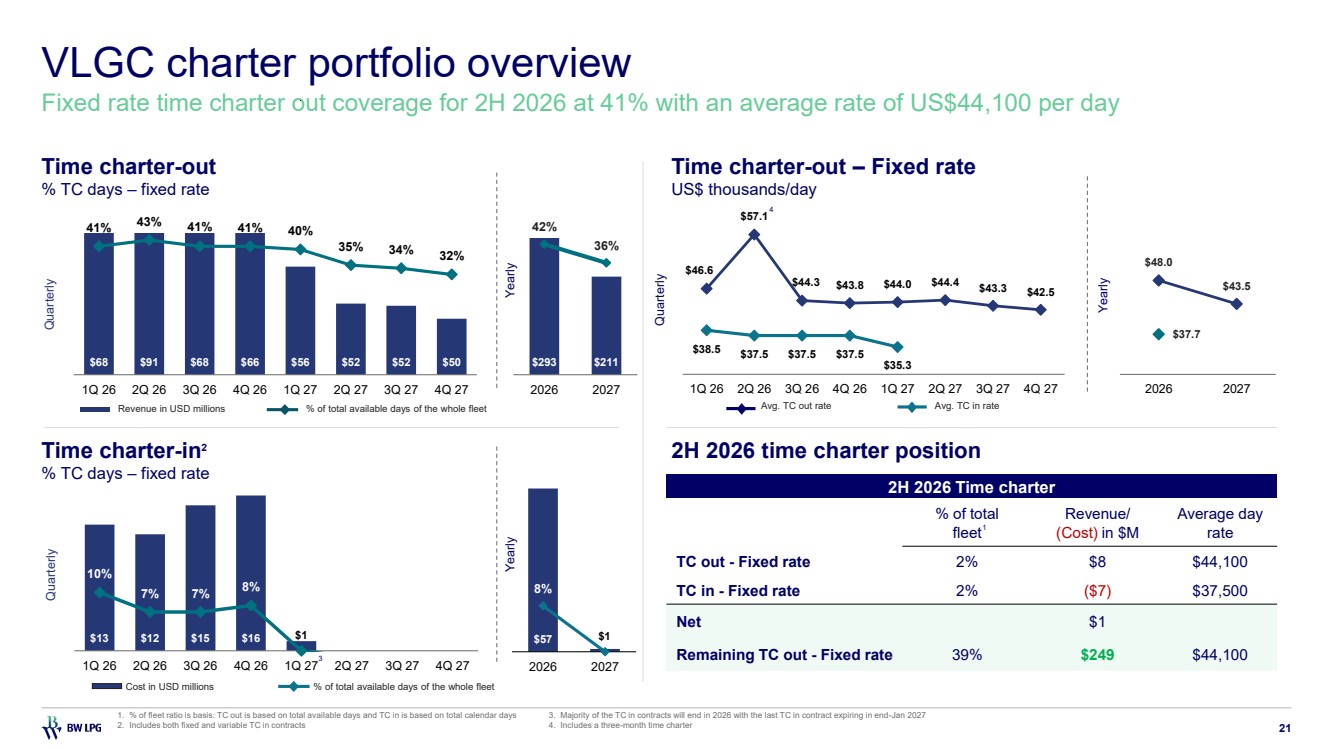
| Shipping segment charter portfolio 2026-2027 22 Fixed rate time charter out contract coverage stands at 42% for 2026 (as of 14 August 2026) Q1 2026A Q2 2026A Q3 2026E Q4 2026E 2026E 2027E Owned days 3,510 3,549 3,520 3,450 14,029 13,505 Time charter in days 340 273 276 276 1,165 34 Total calendar days 3,850 3,822 3,796 3,726 15,194 13,539 Offhire1 263 109 93 65 530 244 Total available days (Net of offhire) 3,587 3,713 3,703 3,661 14,664 13,295 Spot days (Net of offhire) 1,684 1,757 1,830 1,788 7,059 8,015 Time charter out days (Net of offhire) - Fixed rate 1,456 1,594 1,534 1,508 6,092 4,835 Time charter out days (Net of offhire) - Variable rate 447 362 339 365 1,513 445 % Spot days 47% 47% 49% 49% 48% 60% % TC days - Fixed rate 41% 43% 41% 41% 42% 36% % TC days - Variable rate 12% 10% 10% 10% 10% 4% TCE rates Spot $63,700 $85,200 - - - - Time charter out – Fixed rate $46,600 $57,2002 $44,300 $44,000 $48,000 $43,500 VLGC TCE rate (Net of offhire) $55,500 $74,000 - - - - 1. In years when a vessel does not have planned dry docking, an offhire of 3 days per vessel per year is assumed 2. Includes a three-month time charter BW LPG India Charter Portfolio is a subset of the Shipping Segment Charter Portfolio Pool revenue distributed to participants and the associated days are excluded from the presentation |
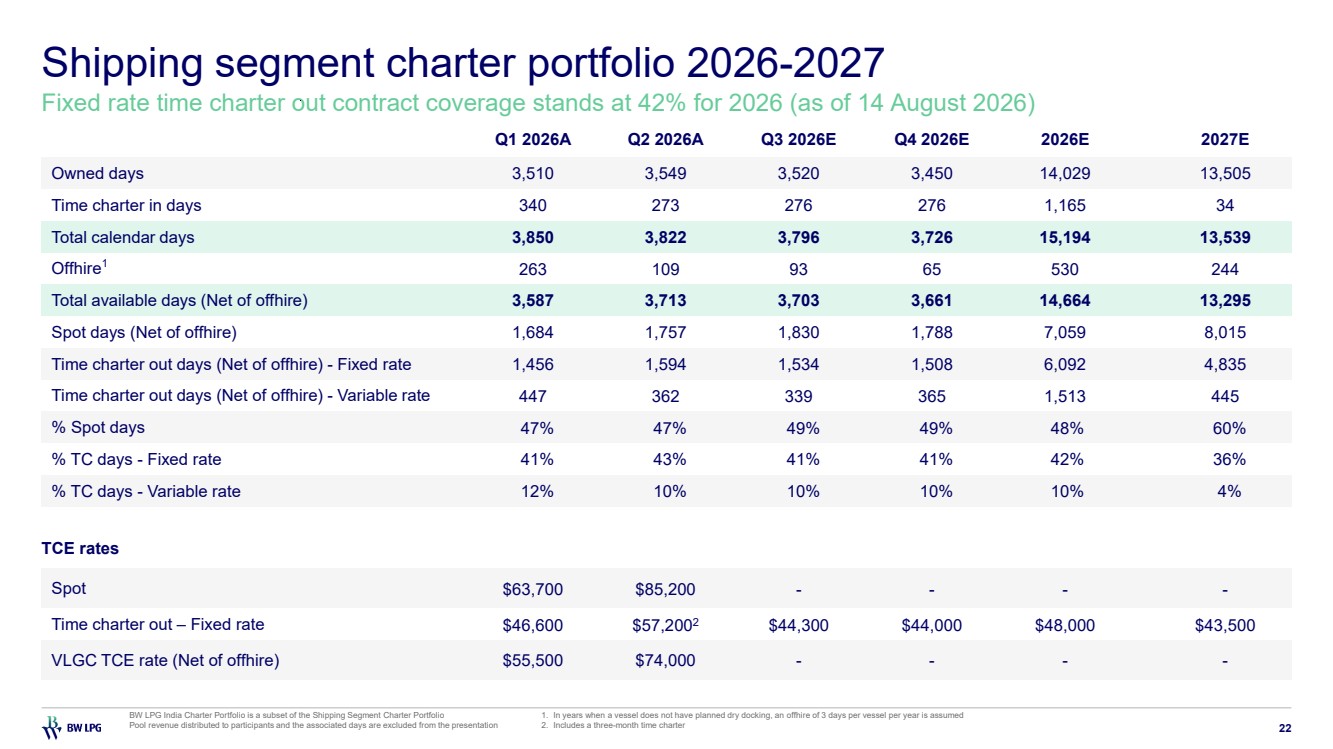
| BW LPG India charter portfolio 2026-2027 23 Time charter out contract coverage stands at 68% for 2026 (as of 14 August 2026) Q1 2026A Q2 2026A Q3 2026E Q4 2026E 2026E 2027E Owned days 720 728 668 644 2,760 2,555 Time charter in days - - - - - - Total calendar days 720 728 668 644 2,760 2,555 Offhire1 141 31 4 4 180 44 Total available days (Net of offhire) 579 697 664 640 2,581 2,511 Spot days (Net of offhire) 152 235 221 208 817 1,566 Time charter out days (Net of offhire) 427 462 443 432 1,764 945 % Spot days 26% 34% 33% 33% 32% 62% % TC days 74% 66% 67% 67% 68% 38% TCE rates Spot $68,600 $106,200 - - - - Time charter out $44,000 $94,1002 $45,500 $46,900 $57,200 $45,900 VLGC TCE rate (Net of offhire) $50,500 $98,200 - - - - 1. Offhire is assumed to be 3 days per year per vessel, distributed equally per quarter, during the years the vessel does not have planned dry dockings 2. Includes a three-month time charter |
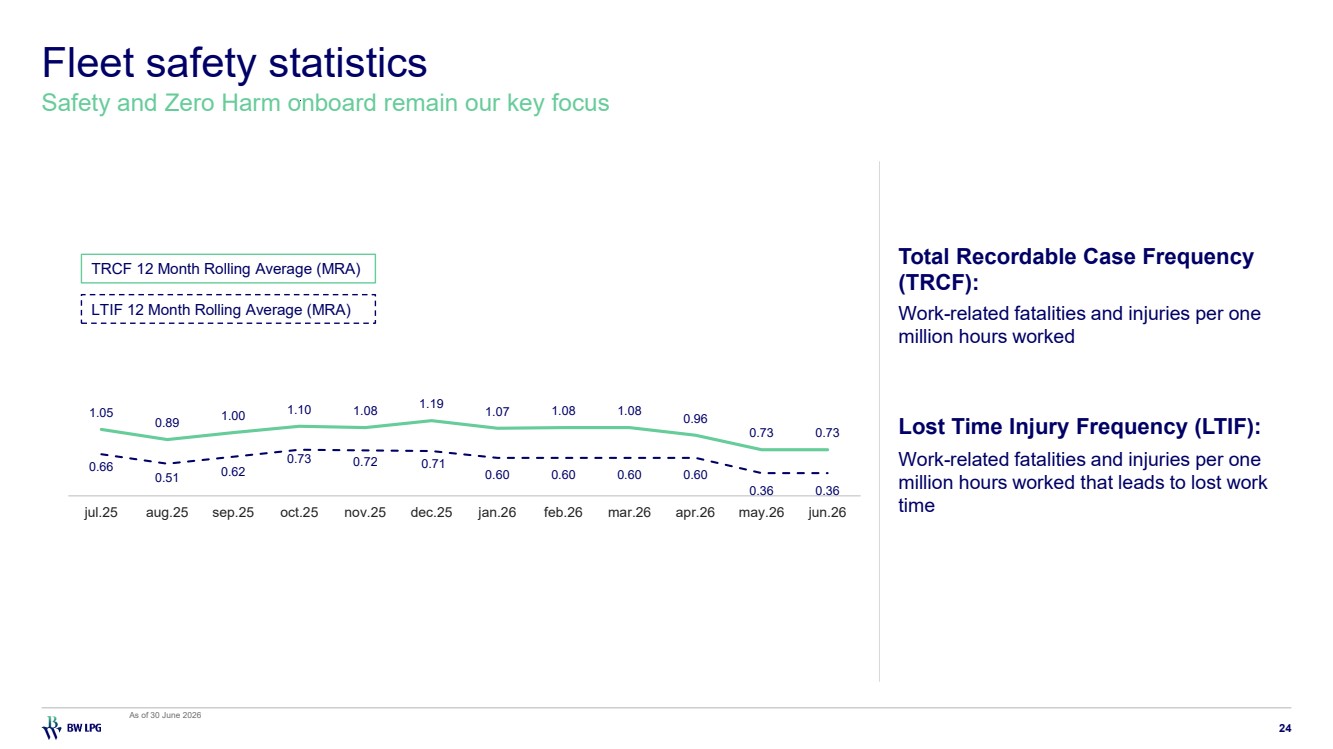
| Fleet safety statistics 24 Safety and Zero Harm onboard remain our key focus TRCF 12 Month Rolling Average (MRA) LTIF 12 Month Rolling Average (MRA) 1.05 0.89 1.00 1.10 1.08 1.19 1.07 1.08 1.08 0.96 0.73 0.73 0.66 0.51 0.62 0.73 0.72 0.71 0.60 0.60 0.60 0.60 0.36 0.36 jul.25 aug.25 sep.25 oct.25 nov.25 dec.25 jan.26 feb.26 mar.26 apr.26 may.26 jun.26 Work-related fatalities and injuries per one million hours worked that leads to lost work time Lost Time Injury Frequency (LTIF): Work-related fatalities and injuries per one million hours worked Total Recordable Case Frequency (TRCF): As of 30 June 2026 |