Performance Management
|
Apr. 30, 2026 |
| Bluemonte Large Cap Core ETF |
|
| Prospectus [Line Items] |
|
| Bar Chart and Performance Table [Heading] |
Performance Information
|
| Performance Narrative [Text Block] |
The Fund commenced operations on June 20,
2025 and, therefore, does not have performance for a full calendar year. Once the Fund has completed a full calendar year of operations,
a bar chart and table will be included that will provide some indication of the risks of investing in the Fund by comparing the Fund’s
return to a broad measure of market performance.
|
| Performance Information Illustrates Variability of Returns [Text] |
Once the Fund has completed a full calendar year of operations,
a bar chart and table will be included that will provide some indication of the risks of investing in the Fund by comparing the Fund’s
return to a broad measure of market performance.
|
| Performance One Year or Less [Text] |
The Fund commenced operations on June 20,
2025 and, therefore, does not have performance for a full calendar year.
|
| Bluemonte Large Cap Growth ETF |
|
| Prospectus [Line Items] |
|
| Bar Chart and Performance Table [Heading] |
Performance Information
|
| Performance Narrative [Text Block] |
The Fund commenced operations on June 20,
2025 and, therefore, does not have performance for a full calendar year. Once the Fund has completed a full calendar year of operations,
a bar chart and table will be included that will provide some indication of the risks of investing in the Fund by comparing the Fund’s
return to a broad measure of market performance.
|
| Performance Information Illustrates Variability of Returns [Text] |
Once the Fund has completed a full calendar year of operations,
a bar chart and table will be included that will provide some indication of the risks of investing in the Fund by comparing the Fund’s
return to a broad measure of market performance.
|
| Performance One Year or Less [Text] |
The Fund commenced operations on June 20,
2025 and, therefore, does not have performance for a full calendar year.
|
| Bluemonte Large Cap Value ETF |
|
| Prospectus [Line Items] |
|
| Bar Chart and Performance Table [Heading] |
Performance Information
|
| Performance Narrative [Text Block] |
The Fund commenced operations on June 20,
2025 and, therefore, does not have performance for a full calendar year. Once the Fund has completed a full calendar year of operations,
a bar chart and table will be included that will provide some indication of the risks of investing in the Fund by comparing the Fund’s
return to a broad measure of market performance.
|
| Performance Information Illustrates Variability of Returns [Text] |
Once the Fund has completed a full calendar year of operations,
a bar chart and table will be included that will provide some indication of the risks of investing in the Fund by comparing the Fund’s
return to a broad measure of market performance.
|
| Performance One Year or Less [Text] |
The Fund commenced operations on June 20,
2025 and, therefore, does not have performance for a full calendar year.
|
| Bluemonte Dynamic Total Market ETF |
|
| Prospectus [Line Items] |
|
| Bar Chart and Performance Table [Heading] |
Performance Information
|
| Performance Narrative [Text Block] |
The Fund commenced operations on June 20,
2025 and, therefore, does not have performance for a full calendar year. Once the Fund has completed a full calendar year of operations,
a bar chart and table will be included that will provide some indication of the risks of investing in the Fund by comparing the Fund’s
return to a broad measure of market performance.
|
| Performance Information Illustrates Variability of Returns [Text] |
Once the Fund has completed a full calendar year of operations,
a bar chart and table will be included that will provide some indication of the risks of investing in the Fund by comparing the Fund’s
return to a broad measure of market performance.
|
| Performance One Year or Less [Text] |
The Fund commenced operations on June 20,
2025 and, therefore, does not have performance for a full calendar year.
|
| Bluemonte Global Equity ETF |
|
| Prospectus [Line Items] |
|
| Bar Chart and Performance Table [Heading] |
Performance Information
|
| Performance Narrative [Text Block] |
The Fund commenced operations on June 20,
2025 and, therefore, does not have performance for a full calendar year. Once the Fund has completed a full calendar year of operations,
a bar chart and table will be included that will provide some indication of the risks of investing in the Fund by comparing the Fund’s
return to a broad measure of market performance.
|
| Performance Information Illustrates Variability of Returns [Text] |
Once the Fund has completed a full calendar year of operations,
a bar chart and table will be included that will provide some indication of the risks of investing in the Fund by comparing the Fund’s
return to a broad measure of market performance.
|
| Performance One Year or Less [Text] |
The Fund commenced operations on June 20,
2025 and, therefore, does not have performance for a full calendar year.
|
| Bluemonte Core Bond ETF |
|
| Prospectus [Line Items] |
|
| Bar Chart and Performance Table [Heading] |
Performance Information
|
| Performance Narrative [Text Block] |
The Fund commenced operations on June 20,
2025 and, therefore, does not have performance for a full calendar year. Once the Fund has completed a full calendar year of operations,
a bar chart and table will be included that will provide some indication of the risks of investing in the Fund by comparing the Fund’s
return to a broad measure of market performance.
|
| Performance Information Illustrates Variability of Returns [Text] |
Once the Fund has completed a full calendar year of operations,
a bar chart and table will be included that will provide some indication of the risks of investing in the Fund by comparing the Fund’s
return to a broad measure of market performance.
|
| Performance One Year or Less [Text] |
The Fund commenced operations on June 20,
2025 and, therefore, does not have performance for a full calendar year.
|
| Bluemonte Short Term Bond ETF |
|
| Prospectus [Line Items] |
|
| Bar Chart and Performance Table [Heading] |
Performance Information
|
| Performance Narrative [Text Block] |
The Fund commenced operations on June 20,
2025 and, therefore, does not have performance for a full calendar year. Once the Fund has completed a full calendar year of operations,
a bar chart and table will be included that will provide some indication of the risks of investing in the Fund by comparing the Fund’s
return to a broad measure of market performance.
|
| Performance Information Illustrates Variability of Returns [Text] |
Once the Fund has completed a full calendar year of operations,
a bar chart and table will be included that will provide some indication of the risks of investing in the Fund by comparing the Fund’s
return to a broad measure of market performance.
|
| Performance One Year or Less [Text] |
The Fund commenced operations on June 20,
2025 and, therefore, does not have performance for a full calendar year.
|
| Bluemonte Long Term Bond ETF |
|
| Prospectus [Line Items] |
|
| Bar Chart and Performance Table [Heading] |
Performance Information
|
| Performance Narrative [Text Block] |
The Fund commenced operations on June 20,
2025 and, therefore, does not have performance for a full calendar year. Once the Fund has completed a full calendar year of operations,
a bar chart and table will be included that will provide some indication of the risks of investing in the Fund by comparing the Fund’s
return to a broad measure of market performance.
|
| Performance Information Illustrates Variability of Returns [Text] |
Once the Fund has completed a full calendar year of operations,
a bar chart and table will be included that will provide some indication of the risks of investing in the Fund by comparing the Fund’s
return to a broad measure of market performance.
|
| Performance One Year or Less [Text] |
The Fund commenced operations on June 20,
2025 and, therefore, does not have performance for a full calendar year.
|
| Bluemonte Diversified Income ETF |
|
| Prospectus [Line Items] |
|
| Bar Chart and Performance Table [Heading] |
Performance Information
|
| Performance Narrative [Text Block] |
The Fund commenced operations on June 20,
2025 and, therefore, does not have performance for a full calendar year. Once the Fund has completed a full calendar year of operations,
a bar chart and table will be included that will provide some indication of the risks of investing in the Fund by comparing the Fund’s
return to a broad measure of market performance.
|
| Performance Information Illustrates Variability of Returns [Text] |
Once the Fund has completed a full calendar year of operations,
a bar chart and table will be included that will provide some indication of the risks of investing in the Fund by comparing the Fund’s
return to a broad measure of market performance.
|
| Performance One Year or Less [Text] |
The Fund commenced operations on June 20,
2025 and, therefore, does not have performance for a full calendar year.
|
| CORE16 Best of Breed Premier Index ETF |
|
| Prospectus [Line Items] |
|
| Bar Chart and Performance Table [Heading] |
Performance Information
|
| Performance Narrative [Text Block] |
The Fund commenced operations on May 20, 2025
and, therefore, does not have performance for a full calendar year. Once the Fund has completed a full calendar year of operations, a
bar chart and table will be included that will provide some indication of the risks of investing in the Fund by comparing the Fund’s
return to a broad measure of market performance.
|
| Performance Information Illustrates Variability of Returns [Text] |
Once the Fund has completed a full calendar year of operations, a
bar chart and table will be included that will provide some indication of the risks of investing in the Fund by comparing the Fund’s
return to a broad measure of market performance.
|
| Performance One Year or Less [Text] |
The Fund commenced operations on May 20, 2025
and, therefore, does not have performance for a full calendar year.
|
| MUSQ Global Music Industry Index ETF |
|
| Prospectus [Line Items] |
|
| Bar Chart and Performance Table [Heading] |
Performance Information
|
| Performance Narrative [Text Block] |
The
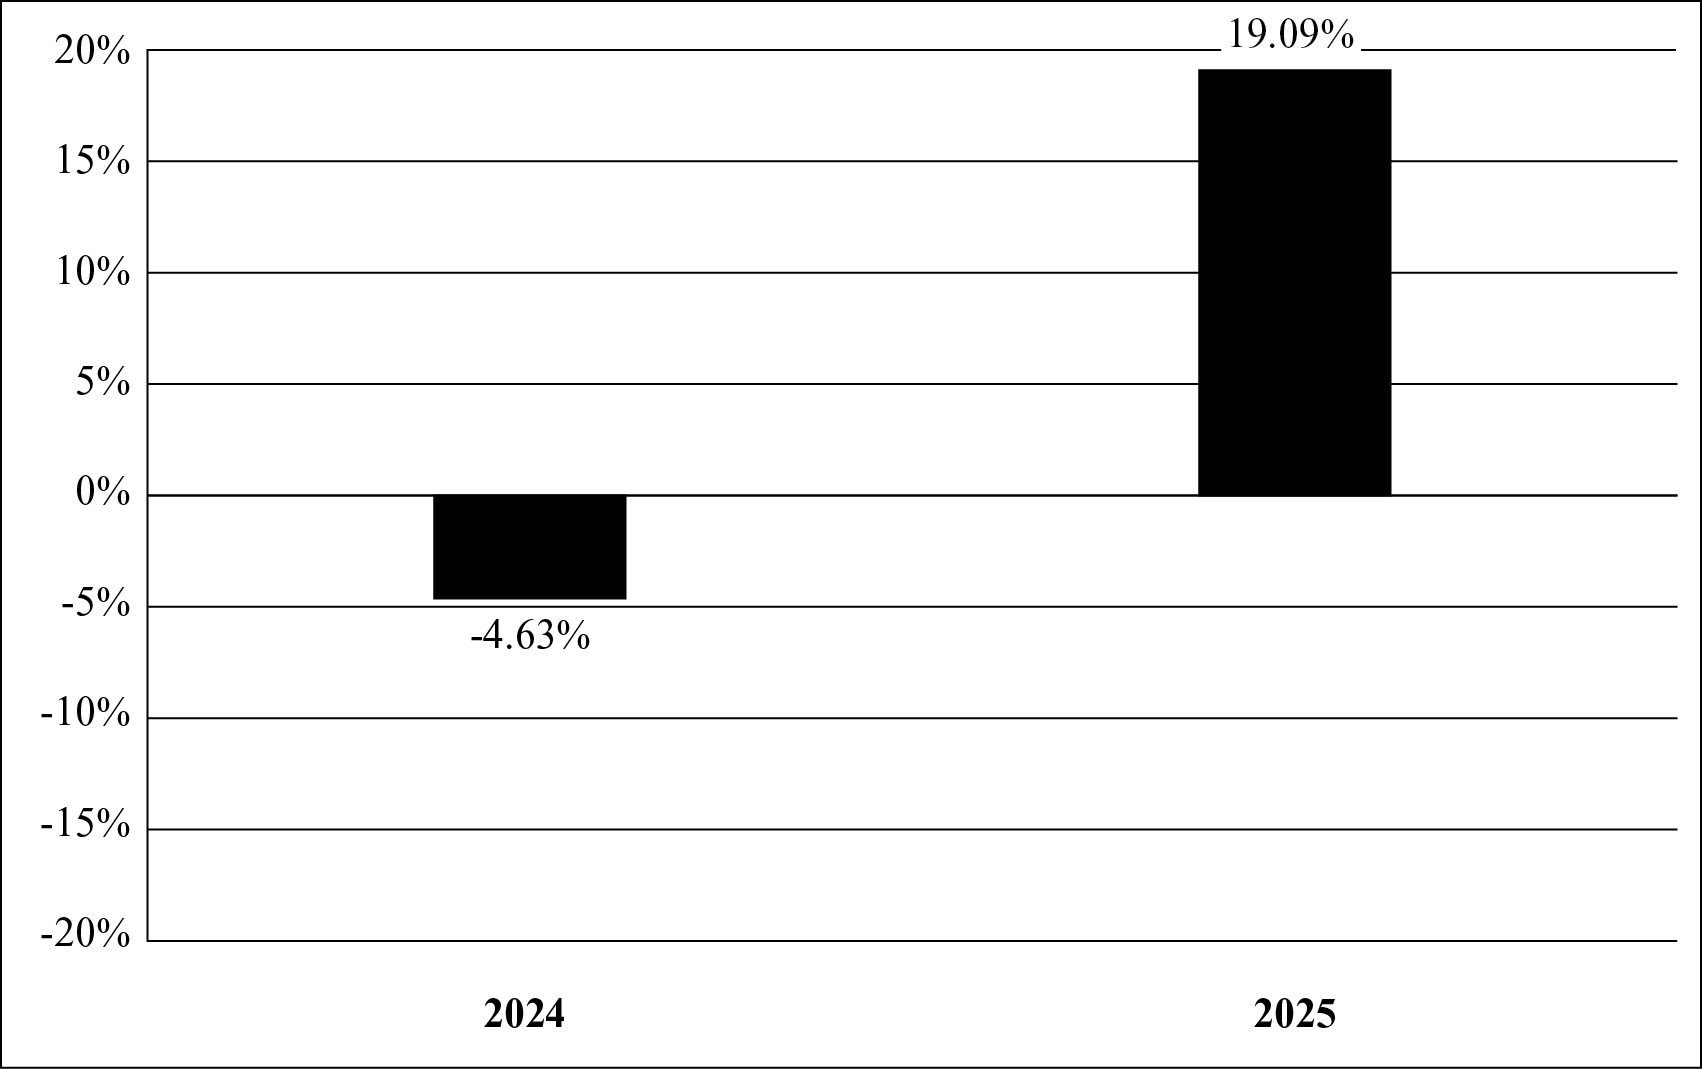
following bar chart and table provide some indication of the risks of investing in the Fund by showing changes in the Fund’s performance
from year to year and by showing how the Fund’s average annual returns for certain time periods compare with the average annual
total returns of the Index, which reflects the type of securities in which the Fund invests, and VettaFi Full World Index, a broad-based
securities market index. The VettaFi Full World Index is an unmanaged float-market cap weighted index that is designed to and targets
each of its countries’ large midcap market cap space across developed and emerging markets. All returns assume reinvestment of dividends
and distributions. The Fund’s past performance (before and after taxes) is not necessarily an indication of how the Fund
will perform in the future. Updated performance information is available online at www.musqetf.com
or by calling 1-855-MUSQ-ETF (687-7383).
|
| Performance Past Does Not Indicate Future [Text] |
The Fund’s past performance (before and after taxes) is not necessarily an indication of how the Fund
will perform in the future.
|
| Performance Information Illustrates Variability of Returns [Text] |
The
following bar chart and table provide some indication of the risks of investing in the Fund by showing changes in the Fund’s performance
from year to year and by showing how the Fund’s average annual returns for certain time periods compare with the average annual
total returns of the Index, which reflects the type of securities in which the Fund invests, and VettaFi Full World Index, a broad-based
securities market index.
|
| Bar Chart [Heading] |
Annual Total Returns as of 12/31*
|
| Bar Chart [Table] |
|
| Bar Chart Footnotes [Text Block] |
*The performance information shown above is
based on a calendar year. The Fund’s year-to-date return as of June 30, 2026 was -11.59%.
|
| Bar Chart Closing [Text Block] |
Best and Worst Quarter Returns (for the period reflected in the
bar chart above)
| | Return | Quarter/Year | | Highest Return | 17.26% | Q2/2025 | | Lowest Return | -4.66% | Q4/2025 |
|
| Year to Date Return, Label [Optional Text] |
year-to-date return
|
| Bar Chart, Year to Date Return |
(11.59%)
|
| Bar Chart, Year to Date Return, Date |
Jun. 30, 2026
|
| Highest Quarterly Return, Label [Optional Text] |
Highest Return
|
| Highest Quarterly Return |
17.26%
|
| Highest Quarterly Return, Date |
Jun. 30, 2025
|
| Lowest Quarterly Return, Label [Optional Text] |
Lowest Return
|
| Lowest Quarterly Return |
(4.66%)
|
| Lowest Quarterly Return, Date |
Dec. 31, 2025
|
| Performance Table Heading |
Average Annual Total Returns for the Periods
Ended December 31, 2025
|
| Performance Table Uses Highest Federal Rate |
After-tax returns are calculated using the historical
highest individual federal marginal income tax rates and do not reflect the impact of state and local taxes.
|
| Performance Table Not Relevant to Tax Deferred |
After-tax returns shown are not relevant to investors who hold their
shares of the Fund through tax-deferred arrangements, such as 401(k) plans or individual retirement accounts.
|
| Performance Table Explanation after Tax Higher |
In some cases, the return
after taxes may exceed the return before taxes due to an assumed tax benefit from any losses on a sale of shares of the Fund at the end
of the measurement period.
|
| Performance [Table] |
| MUSQ Global Music Industry Index ETF | 1 Year | Since Inception
(07-06-2023) | | Return Before Taxes | 19.09% | 6.35% | | Return After Taxes on Distributions | 18.91% | 6.02% | | Return After Taxes on Distributions and Sale of Fund Shares | 11.42% | 4.79% | | MUSQ Global Music Industry Index (reflects no deduction for fees, expenses, or taxes) | 20.17% | 7.17% | | VettaFi Full World Index (reflects no deduction for fees, expenses, or taxes) | 22.89% | 20.11% |
|
| Index No Deduction for Fees, Expenses, or Taxes [Text] |
reflects no deduction for fees, expenses, or taxes
|
| Performance Table Closing [Text Block] |
After-tax returns are calculated using the historical
highest individual federal marginal income tax rates and do not reflect the impact of state and local taxes. Your actual after-tax returns
will depend on your tax situation and may differ from those shown. After-tax returns shown are not relevant to investors who hold their
shares of the Fund through tax-deferred arrangements, such as 401(k) plans or individual retirement accounts. In some cases, the return
after taxes may exceed the return before taxes due to an assumed tax benefit from any losses on a sale of shares of the Fund at the end
of the measurement period.
|
| Performance Availability Website Address [Text] |
www.musqetf.com
|
| Performance Availability Phone [Text] |
687-7383
|
| ROBO Global(R) Robotics and Automation Index ETF |
|
| Prospectus [Line Items] |
|
| Bar Chart and Performance Table [Heading] |
Performance Information
|
| Performance Narrative [Text Block] |
The
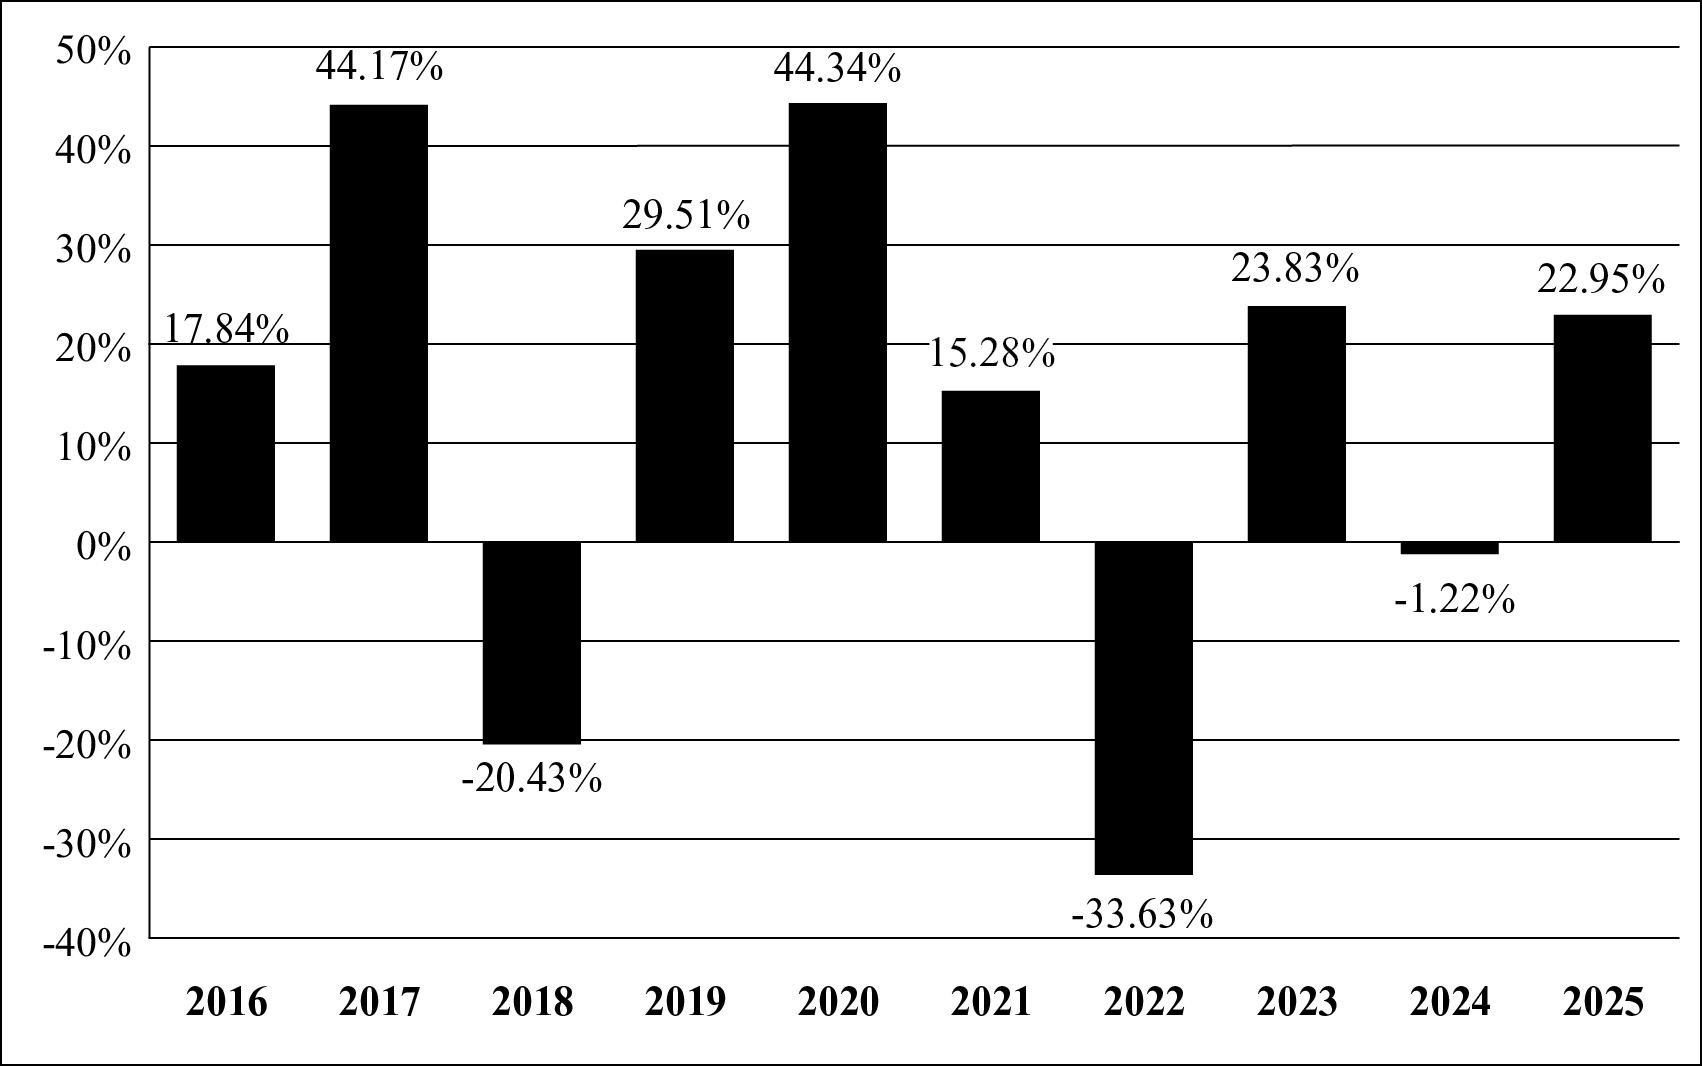
following bar chart and table provide some indication of the risks of investing in the Fund by showing changes in the Fund’s performance
from year to year and by showing how the Fund’s average annual returns for certain time periods compare with the average annual
total returns of the Index, which reflects the type of securities in which the Fund invests, the VettaFi Full World Index, the Fund’s
primary broad-based securities market index, and the S&P 500® Index.
The VettaFi Full World Index is an unmanaged float-market cap weighted index that is designed to and targets each of its countries large
midcap market cap space across developed and emerging markets and the S&P 500® Index
is a broad-based, unmanaged measurement of changes in stock market conditions based on the average of 500 widely held U.S. common stocks.
All returns assume reinvestment of dividends and distributions. The Fund’s past performance (before and after taxes) is not
necessarily an indication of how the Fund will perform in the future. Updated performance information is available online at www.roboglobaletfs.com/robo
or by calling toll-free 1-855-456-ROBO.
|
| Performance Past Does Not Indicate Future [Text] |
The Fund’s past performance (before and after taxes) is not
necessarily an indication of how the Fund will perform in the future.
|
| Performance Information Illustrates Variability of Returns [Text] |
The
following bar chart and table provide some indication of the risks of investing in the Fund by showing changes in the Fund’s performance
from year to year and by showing how the Fund’s average annual returns for certain time periods compare with the average annual
total returns of the Index, which reflects the type of securities in which the Fund invests, the VettaFi Full World Index, the Fund’s
primary broad-based securities market index, and the S&P 500® Index.
|
| Bar Chart [Heading] |
Annual Total Returns as of 12/31*
|
| Bar Chart [Table] |
|
| Bar Chart Footnotes [Text Block] |
*The performance information shown above is
based on a calendar year. The Fund’s year-to-date return as of June 30, 2026 was 22.95%.
|
| Bar Chart Closing [Text Block] |
Best and Worst Quarter Returns (for the period reflected in the
bar chart above)
| | Return | Quarter/Year | | Highest Return | 28.80% | Q2/2020 | | Lowest Return | -23.38% | Q2/2022 |
|
| Year to Date Return, Label [Optional Text] |
year-to-date return
|
| Bar Chart, Year to Date Return |
22.95%
|
| Bar Chart, Year to Date Return, Date |
Jun. 30, 2026
|
| Highest Quarterly Return, Label [Optional Text] |
Highest Return
|
| Highest Quarterly Return |
28.80%
|
| Highest Quarterly Return, Date |
Jun. 30, 2020
|
| Lowest Quarterly Return, Label [Optional Text] |
Lowest Return
|
| Lowest Quarterly Return |
(23.38%)
|
| Lowest Quarterly Return, Date |
Jun. 30, 2022
|
| Performance Table Heading |
Average Annual Total Returns for the Periods
Ended December 31, 2025
|
| Performance Table Uses Highest Federal Rate |
After-tax returns are calculated using the historical
highest individual federal marginal income tax rates and do not reflect the impact of state and local taxes.
|
| Performance Table Not Relevant to Tax Deferred |
After-tax returns shown are not relevant to investors who hold their
shares of the Fund through tax-deferred arrangements such as 401(k) plans or individual retirement accounts.
|
| Performance Table Explanation after Tax Higher |
In some cases the return
after taxes may exceed the return before taxes due to an assumed tax benefit from any losses on a sale of shares of the Fund at the end
of the measurement period.
|
| Performance [Table] |
| ROBO Global® Robotics and Automation Index ETF | 1 Year | 5 Years | 10 Years | | Return Before Taxes | 22.95% | 2.84% | 11.26% | | Return After Taxes on Distributions | 22.91% | 2.83% | 11.26% | | Return After Taxes on Distributions and Sale of Fund Shares | 13.76% | 2.24% | 9.44% | | ROBO Global® Robotics and Automation Index (reflects no deduction for fees, expenses, or taxes) | 24.07% | 3.70% | 12.09% | | VettaFi Full World Index (reflects no deduction for fees, expenses, or taxes) | 22.89% | 11.65% | 12.39% | | S&P 500® Index (reflects no deduction for fees, expenses, or taxes) | 17.88% | 14.42% | 14.82% |
|
| Index No Deduction for Fees, Expenses, or Taxes [Text] |
reflects no deduction for fees, expenses, or taxes
|
| Performance Table Closing [Text Block] |
After-tax returns are calculated using the historical
highest individual federal marginal income tax rates and do not reflect the impact of state and local taxes. Your actual after-tax returns
will depend on your tax situation and may differ from those shown. After-tax returns shown are not relevant to investors who hold their
shares of the Fund through tax-deferred arrangements such as 401(k) plans or individual retirement accounts. In some cases the return
after taxes may exceed the return before taxes due to an assumed tax benefit from any losses on a sale of shares of the Fund at the end
of the measurement period.
|
| Performance Availability Website Address [Text] |
www.roboglobaletfs.com/robo
|
| Performance Availability Phone [Text] |
1-855-456-ROBO
|
| ROBO Global(R) Healthcare Technology and Innovation ETF |
|
| Prospectus [Line Items] |
|
| Bar Chart and Performance Table [Heading] |
Performance Information
|
| Performance Narrative [Text Block] |
The
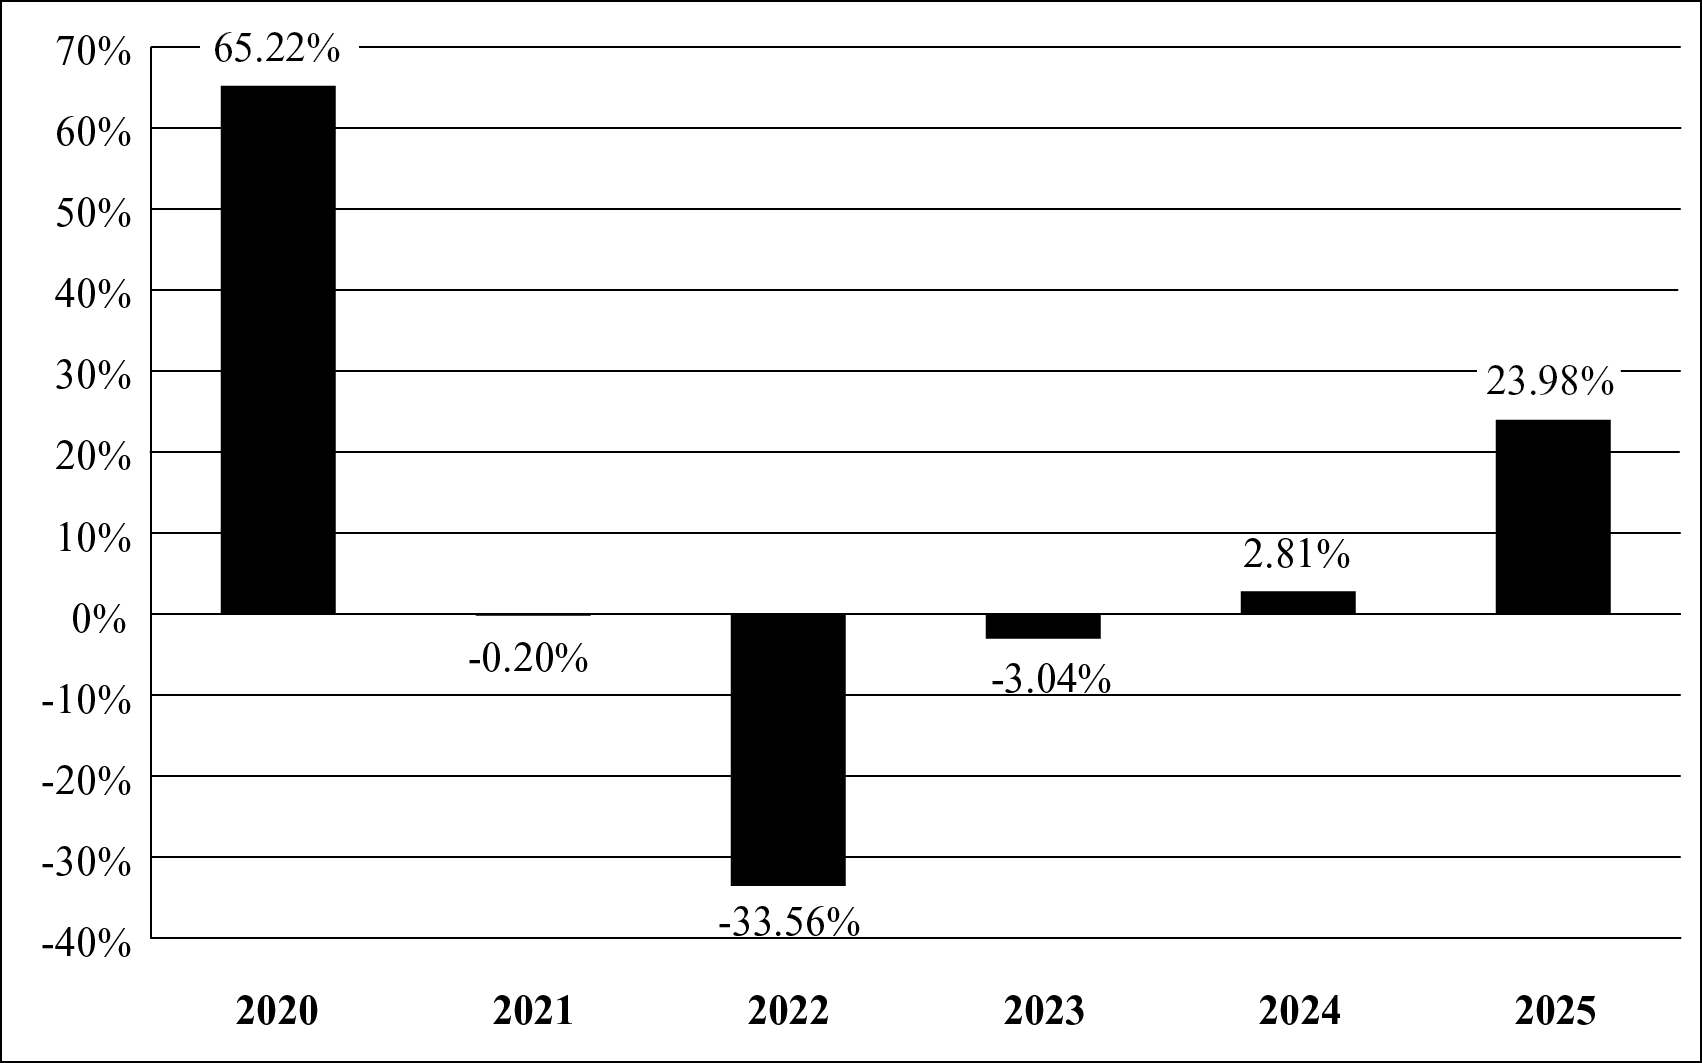
following bar chart and table provide some indication of the risks of investing in the Fund by showing changes in the Fund’s performance
from year to year and by showing how the Fund’s average annual returns for certain time periods compare with the average annual
total returns of the Index, which reflects the type of securities in which the Fund invests, the VettaFi Full World Index, the Fund’s
primary broad-based securities market index, and the S&P 500® Index.
The VettaFi Full World Index is an unmanaged float-market cap weighted index that is designed to and targets each of its countries large
midcap market cap space across developed and emerging markets and the S&P 500® Index
is a broad-based, unmanaged measurement of changes in stock market conditions based on the average of 500 widely held U.S. common stocks.
All returns assume reinvestment of dividends and distributions. The Fund’s past performance (before and after taxes) is not
necessarily an indication of how the Fund will perform in the future. Updated performance information is available online at www.roboglobaletfs.com/htec
or by calling toll-free 1-855-456-ROBO.
|
| Performance Past Does Not Indicate Future [Text] |
The Fund’s past performance (before and after taxes) is not
necessarily an indication of how the Fund will perform in the future.
|
| Performance Information Illustrates Variability of Returns [Text] |
The
following bar chart and table provide some indication of the risks of investing in the Fund by showing changes in the Fund’s performance
from year to year and by showing how the Fund’s average annual returns for certain time periods compare with the average annual
total returns of the Index, which reflects the type of securities in which the Fund invests, the VettaFi Full World Index, the Fund’s
primary broad-based securities market index, and the S&P 500® Index.
|
| Bar Chart [Heading] |
Annual Total Returns as of 12/31*
|
| Bar Chart [Table] |
|
| Bar Chart Footnotes [Text Block] |
*The performance information shown above is
based on a calendar year. The Fund’s year-to-date return as of June 30, 2026 was 5.39%.
|
| Bar Chart Closing [Text Block] |
Best and Worst Quarter Returns (for the period reflected in the
bar chart above)
| | Return | Quarter/Year | | Highest Return | 30.72% | Q2/2020 | | Lowest Return | -20.77% | Q2/2022 |
|
| Year to Date Return, Label [Optional Text] |
year-to-date return
|
| Bar Chart, Year to Date Return |
5.39%
|
| Bar Chart, Year to Date Return, Date |
Jun. 30, 2026
|
| Highest Quarterly Return, Label [Optional Text] |
Highest Return
|
| Highest Quarterly Return |
30.72%
|
| Highest Quarterly Return, Date |
Jun. 30, 2020
|
| Lowest Quarterly Return, Label [Optional Text] |
Lowest Return
|
| Lowest Quarterly Return |
(20.77%)
|
| Lowest Quarterly Return, Date |
Jun. 30, 2022
|
| Performance Table Heading |
Average Annual Total Returns for the Periods
Ended December 31, 2025
|
| Performance Table Uses Highest Federal Rate |
After-tax returns are calculated using the historical
highest individual federal marginal income tax rates and do not reflect the impact of state and local taxes.
|
| Performance Table Not Relevant to Tax Deferred |
After-tax returns shown are not relevant to investors who hold their
shares of the Fund through tax-deferred arrangements such as 401(k) plans or individual retirement accounts.
|
| Performance Table Explanation after Tax Higher |
In some cases the return
after taxes may exceed the return before taxes due to an assumed tax benefit from any losses on a sale of shares of the Fund at the end
of the measurement period.
|
| Performance [Table] |
| ROBO Global® Healthcare Technology and Innovation ETF | 1 Year | 5 Years | Since Inception
(6-24-2019) | | Return Before Taxes | 23.98% | -3.90% | 6.13% | | Return After Taxes on Distributions | 23.59% | -3.97% | 6.08% | | Return After Taxes on Distributions and Sale of Fund Shares | 14.29% | -2.93% | 4.83% | | ROBO Global® Healthcare Technology and Innovation Index (reflects no deduction for fees, expenses, or taxes) | 24.85% | -3.28% | 6.85% | | VettaFi Full World Index (reflects no deduction for fees, expenses, or taxes) | 22.89% | 11.65% | 13.12% | | S&P 500® Index (reflects no deduction for fees, expenses, or taxes) | 17.88% | 14.42% | 15.59% |
|
| Index No Deduction for Fees, Expenses, or Taxes [Text] |
reflects no deduction for fees, expenses, or taxes
|
| Performance Table Closing [Text Block] |
After-tax returns are calculated using the historical
highest individual federal marginal income tax rates and do not reflect the impact of state and local taxes. Your actual after-tax returns
will depend on your tax situation and may differ from those shown. After-tax returns shown are not relevant to investors who hold their
shares of the Fund through tax-deferred arrangements such as 401(k) plans or individual retirement accounts. In some cases the return
after taxes may exceed the return before taxes due to an assumed tax benefit from any losses on a sale of shares of the Fund at the end
of the measurement period.
|
| Performance Availability Website Address [Text] |
www.roboglobaletfs.com/htec
|
| Performance Availability Phone [Text] |
1-855-456-ROBO
|
| ROBO Global(R) Artificial Intelligence ETF |
|
| Prospectus [Line Items] |
|
| Bar Chart and Performance Table [Heading] |
Performance Information
|
| Performance Narrative [Text Block] |
The
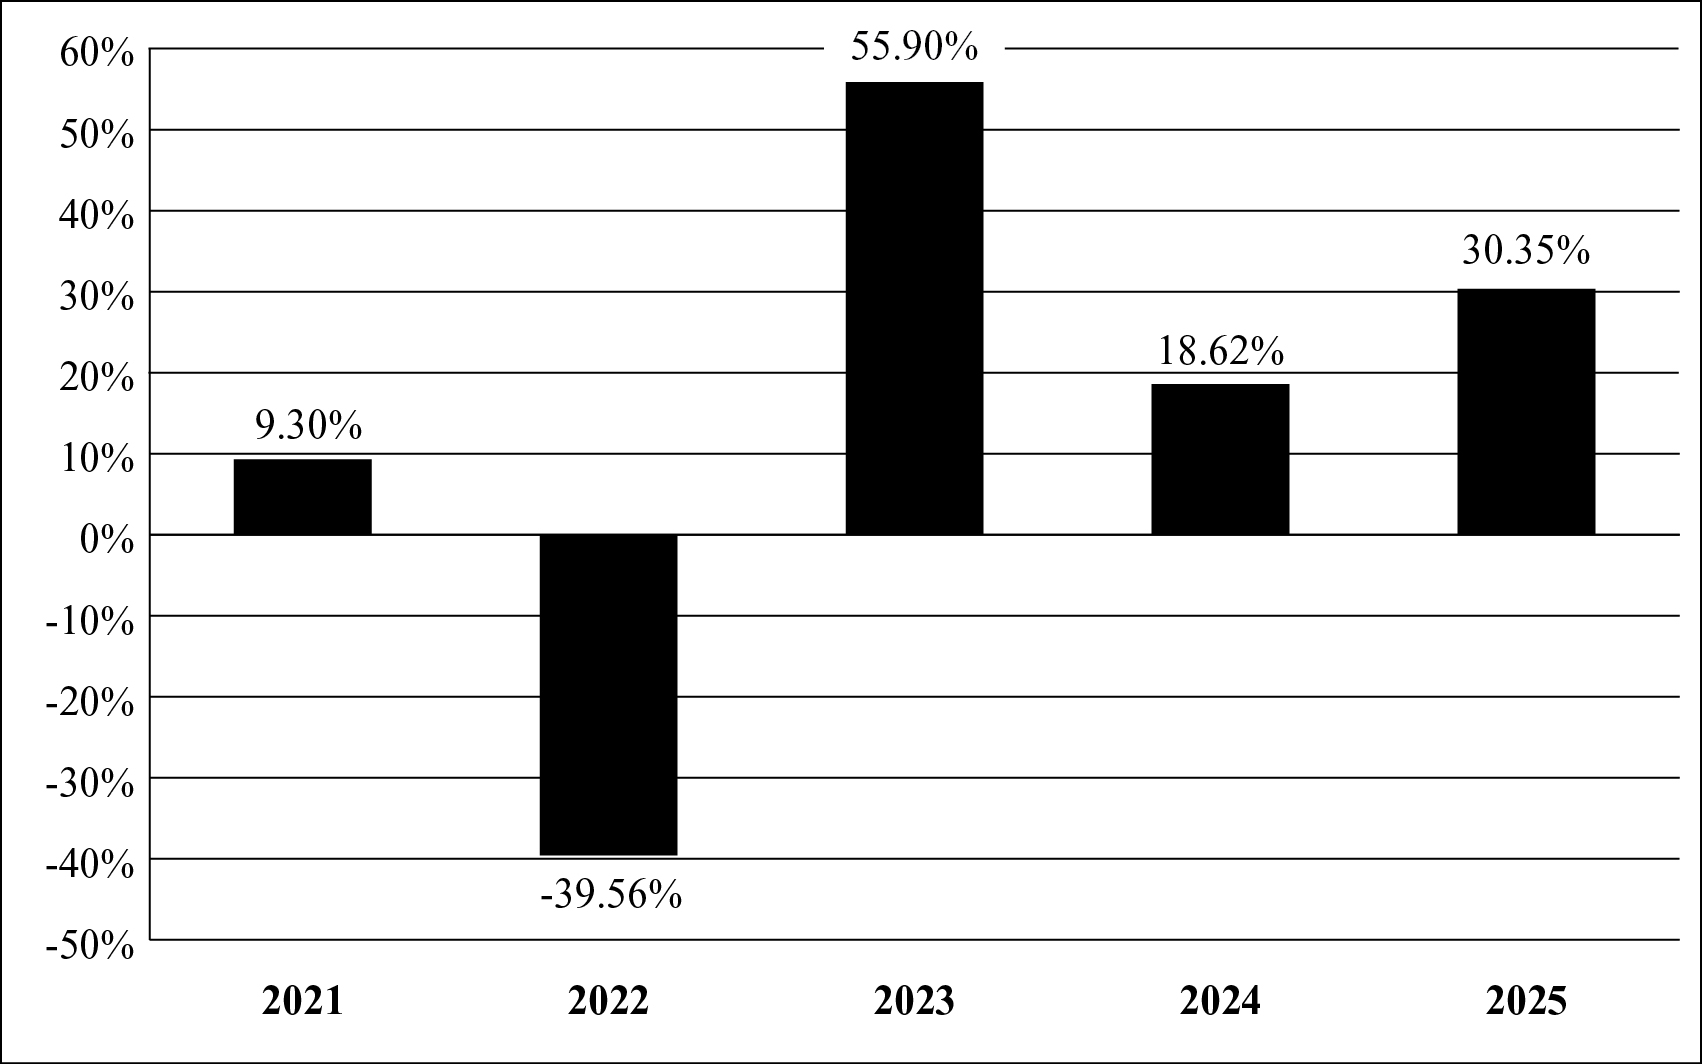
following bar chart and table provide some indication of the risks of investing in the Fund by showing changes in the Fund’s performance
from year to year and by showing how the Fund’s average annual returns for certain time periods compare with the average annual
total returns of the Index, which reflects the type of securities in which the Fund invests, the VettaFi Full World Index, the Fund’s
primary broad-based securities market index, and the S&P 500® Index. The
VettaFi Full World Index is an unmanaged float-market cap weighted index that is designed to and targets each of its countries large
midcap market cap space across developed and emerging markets and the S&P 500® Index
is a broad-based, unmanaged measurement of changes in stock market conditions based on the average of 500 widely held U.S. common stocks.
All returns assume reinvestment of dividends and distributions. The Fund’s past performance (before and after taxes) is not
necessarily an indication of how the Fund will perform in the future. Updated performance information is available online at www.roboglobaletfs.com/thnq
or by calling toll-free 1-855-456-ROBO.
|
| Performance Past Does Not Indicate Future [Text] |
The Fund’s past performance (before and after taxes) is not
necessarily an indication of how the Fund will perform in the future.
|
| Performance Information Illustrates Variability of Returns [Text] |
The
following bar chart and table provide some indication of the risks of investing in the Fund by showing changes in the Fund’s performance
from year to year and by showing how the Fund’s average annual returns for certain time periods compare with the average annual
total returns of the Index, which reflects the type of securities in which the Fund invests, the VettaFi Full World Index, the Fund’s
primary broad-based securities market index, and the S&P 500® Index.
|
| Bar Chart [Heading] |
Annual Total Returns as of 12/31*
|
| Bar Chart [Table] |
|
| Bar Chart Footnotes [Text Block] |
*The performance information shown above is
based on a calendar year. The Fund’s year-to-date return as of June 30, 2026 was 43.38%.
|
| Bar Chart Closing [Text Block] |
Best and Worst Quarter Returns (for the period reflected in the
bar chart above)
| | Return | Quarter/Year | | Highest Return | 24.13% | Q2/2025 | | Lowest Return | -28.15% | Q2/2022 |
|
| Year to Date Return, Label [Optional Text] |
year-to-date return
|
| Bar Chart, Year to Date Return |
43.38%
|
| Bar Chart, Year to Date Return, Date |
Jun. 30, 2026
|
| Highest Quarterly Return, Label [Optional Text] |
Highest Return
|
| Highest Quarterly Return |
24.13%
|
| Highest Quarterly Return, Date |
Jun. 30, 2025
|
| Lowest Quarterly Return, Label [Optional Text] |
Lowest Return
|
| Lowest Quarterly Return |
(28.15%)
|
| Lowest Quarterly Return, Date |
Jun. 30, 2022
|
| Performance Table Heading |
Average Annual Total Returns for the Periods
Ended December 31, 2025
|
| Performance Table Uses Highest Federal Rate |
After-tax returns are calculated using the historical
highest individual federal marginal income tax rates and do not reflect the impact of state and local taxes.
|
| Performance Table Not Relevant to Tax Deferred |
After-tax returns shown are not relevant to investors who hold their
shares of the Fund through tax-deferred arrangements such as 401(k) plans or individual retirement accounts.
|
| Performance Table Explanation after Tax Higher |
In some cases the return
after taxes may exceed the return before taxes due to an assumed tax benefit from any losses on a sale of shares of the Fund at the end
of the measurement period.
|
| Performance [Table] |
| ROBO Global® Artificial Intelligence ETF | 1 Year | 5 Years | Since Inception
(5-8-2020) | | Return Before Taxes | 30.35% | 9.75% | 17.98% | | Return After Taxes on Distributions | 30.28% | 9.74% | 17.96% | | Return After Taxes on Distributions and Sale of Fund Shares | 18.01% | 7.74% | 14.76% | | ROBO Global® Artificial Intelligence Index (reflects no deduction for fees, expenses, or taxes) | 30.82% | 10.12% | 18.39% | | VettaFi Full World Index (reflects no deduction for fees, expenses, or taxes) | 22.89% | 11.65% | 16.16% | | S&P 500® Index (reflects no deduction for fees, expenses, or taxes) | 17.88% | 14.42% | 17.96% |
|
| Index No Deduction for Fees, Expenses, or Taxes [Text] |
reflects no deduction for fees, expenses, or taxes
|
| Performance Table Closing [Text Block] |
After-tax returns are calculated using the historical
highest individual federal marginal income tax rates and do not reflect the impact of state and local taxes. Your actual after-tax returns
will depend on your tax situation and may differ from those shown. After-tax returns shown are not relevant to investors who hold their
shares of the Fund through tax-deferred arrangements such as 401(k) plans or individual retirement accounts. In some cases the return
after taxes may exceed the return before taxes due to an assumed tax benefit from any losses on a sale of shares of the Fund at the end
of the measurement period.
|
| Performance Availability Website Address [Text] |
www.roboglobaletfs.com/thnq
|
| Performance Availability Phone [Text] |
1-855-456-ROBO
|