Performance Management
Aug. 27, 2026
The bar chart and performance table provide an indication of the risks of investing in the Fund. The bar chart shows changes in the performance of the Fund from year to year as of December 31. The performance table compares the Fund’s performance to that of a broad measure of market performance and one or more additional indices with characteristics relevant to the Fund. The Fund's past performance (before and after taxes) is not necessarily an indication of its future performance.
Fund performance reflects any applicable fee waivers and expense reimbursements. Performance returns would be lower without applicable fee waivers and expense reimbursements.
All Fund performance shown assumes the reinvestment of dividends and capital gains and the effect of the Fund’s expenses.
Updated performance information is available on the Fund's website at www.invesco.com/us.
The bar chart does not reflect sales loads. If it did, the annual total returns shown would be lower.
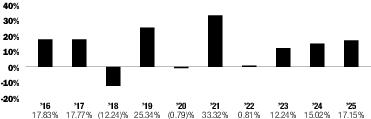
| Class A | Period Ended | Returns |
| Year-to-date | June 30, 2026 | 10.90% |
| Best Quarter | December 31, 2020 | 22.30% |
| Worst Quarter | March 31, 2020 | -32.34% |
| | Inception Date | 1 Year | 5 Years | 10 Years |
| Class A | | | | |
| Return Before Taxes | 10/7/1968 | 10.72 % | 13.95 % | 11.27 % |
| Return After Taxes on Distributions | | 8.54 | 11.46 | 9.27 |
| Return After Taxes on Distributions and Sale of Fund Shares | | 7.84 | 10.73 | 8.75 |
| | ||||
| Class C | 10/26/1993 | 15.26 | 14.39 | 11.24 |
| | ||||
| Class R | 10/1/2002 | 16.85 | 14.96 | 11.62 |
| | ||||
| Class Y | 10/29/2004 | 17.45 | 15.54 | 12.18 |
| | ||||
| Class R5 | 6/1/2010 | 17.48 | 15.58 | 12.25 |
| | ||||
| Class R6 | 9/24/2012 | 17.52 | 15.67 | 12.34 |
| | ||||
| Russell 1000® Value Index (reflects no deduction for fees, expenses or taxes) | | 15.91 | 11.33 | 10.53 |
| | ||||
| S&P 500® Index (reflects no deduction for fees, expenses or taxes) | | 17.88 | 14.42 | 14.82 |
| | ||||
After-tax returns are calculated using the historical highest individual federal marginal income tax rates and do not reflect the impact of state and local taxes. Actual after-tax returns depend on an investor's tax situation and may differ from those shown, and after-tax returns shown are not relevant to investors who hold their Fund shares through tax-advantaged arrangements, such as 401(k) plans, 529 college savings plans or individual retirement accounts. After-tax returns are shown for Class A shares only and after-tax returns for other classes will vary.
The bar chart and performance table provide an indication of the risks of investing in the Fund. The Fund has adopted the performance of the Oppenheimer Value Fund (the predecessor fund) as the result of a reorganization of the predecessor fund into the Fund, which was consummated after the close of business on May 24, 2019 (the “Reorganization”). Prior to the Reorganization, the Fund had not yet commenced operations. The bar chart shows changes in the performance of the predecessor fund and the Fund from year to year as of December 31. The performance table compares the predecessor fund’s and the Fund’s performance to that of a broad measure of market performance and an additional index with characteristics relevant to the Fund. The Fund’s (and the predecessor fund’s) past performance (before and after taxes) is not necessarily an indication of how the Fund will perform in the future.
The returns shown for periods ending on or prior to May 24, 2019 are those of the Class A, Class C, Class R, Class Y and Class I shares of the predecessor fund. Class A, Class C, Class R, Class Y and Class I shares of the predecessor fund were reorganized into Class A, Class C, Class R, Class Y and Class R6 shares, respectively, of the Fund after the close of business on May 24, 2019. Class A, Class C, Class R, Class Y and Class R6 shares’ returns of the Fund will be different from the returns of the predecessor fund as they have different expenses. Performance for Class A shares has been restated to reflect the Fund’s applicable sales charge. Fund performance reflects any applicable fee waivers and expense reimbursements. Performance returns would be lower without applicable fee waivers and expense reimbursements.
All Fund performance shown assumes the reinvestment of dividends and capital gains and the effect of the Fund’s expenses.
Updated performance information is available on the Fund’s website at www.invesco.com/us.
The bar chart does not reflect sales loads. If it did, the annual total returns shown would be lower.
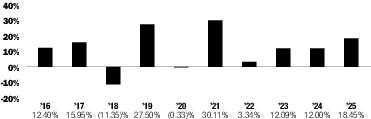
| Class A | Period Ended | Returns |
| Year-to-date | June 30, 2026 | 6.85% |
| Best Quarter | December 31, 2020 | 23.85% |
| Worst Quarter | March 31, 2020 | -33.82% |
| | Inception Date | 1 Year | 5 Years | 10 Years |
| Class A | | | | |
| Return Before Taxes | 9/16/1985 | 11.95 % | 13.57 % | 10.74 % |
| Return After Taxes on Distributions | | 8.33 | 10.41 | 8.02 |
| Return After Taxes on Distributions and Sale of Fund Shares | | 8.92 | 10.07 | 7.96 |
| | ||||
| Class C | 5/1/1996 | 16.54 | 14.00 | 10.70 |
| | ||||
| Class R | 3/1/2001 | 18.11 | 14.56 | 11.08 |
| | ||||
| Class Y | 12/16/1996 | 18.75 | 15.14 | 11.64 |
| | ||||
| Class R5 | 5/24/2019 | 18.87 | 15.27 | 11.63 1 |
| | ||||
| Class R6 | 2/28/2012 | 18.86 | 15.27 | 11.79 |
| | ||||
| Russell 1000® Value Index (reflects no deduction for fees, expenses or taxes) | | 15.91 | 11.33 | 10.53 |
| | ||||
| S&P 500® Index (reflects no deduction for fees, expenses or taxes) | | 17.88 | 14.42 | 14.82 |
| | ||||
1
Performance shown on or prior to the inception date is that of the predecessor fund's Class A shares at net asset value and includes the 12b-1 fees applicable to that class. Although invested in the same portfolio of securities, Class R5 shares' returns of the Fund will be different from Class A shares' returns of the predecessor fund as they have different expenses.
After-tax returns are calculated using the historical highest individual federal marginal income tax rates and do not reflect the impact of state and local taxes. Actual after-tax returns depend on an investor's tax situation and may differ from those shown, and after-tax returns shown are not relevant to investors who hold their Fund shares through tax-advantaged arrangements, such as 401(k) plans, 529 college savings plans or individual retirement accounts. After-tax returns are shown for Class A shares only and after-tax returns for other classes will vary.
The bar chart and performance table provide an indication of the risks of investing in the Fund. The bar chart shows changes in the performance of the Fund from year to year as of December 31. The performance table compares the Fund’s performance to that of a broad measure of market performance and one or more additional indices with characteristics relevant to the Fund. The Fund's past performance (before and after taxes) is not necessarily an indication of its future performance.
Fund performance reflects any applicable fee waivers and expense reimbursements. Performance returns would be lower without applicable fee waivers and expense reimbursements.
All Fund performance shown assumes the reinvestment of dividends and capital gains and the effect of the Fund’s expenses.
Updated performance information is available on the Fund's website at www.invesco.com/us.
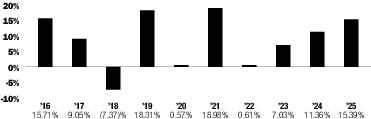
| Investor Class | Period Ended | Returns |
| Year-to-date | June 30, 2026 | 7.38% |
| Best Quarter | December 31, 2022 | 13.07% |
| Worst Quarter | March 31, 2020 | -20.10% |
| | Inception Date | 1 Year | 5 Years | 10 Years |
| Investor Class | | | | |
| Return Before Taxes | 6/2/1986 | 15.39 % | 10.48 % | 8.64 % |
| Return After Taxes on Distributions | | 12.38 | 8.64 | 7.15 |
| Return After Taxes on Distributions and Sale of Fund Shares | | 11.16 | 8.09 | 6.73 |
| | ||||
| Class A | 3/28/2002 | 9.07 | 9.25 | 8.03 |
| | ||||
| Class C | 2/14/2000 | 13.54 | 9.64 | 7.99 |
| | ||||
| Class R | 4/17/2020 | 15.13 | 10.21 1 | 8.37 1 |
| | ||||
| Class Y | 10/3/2008 | 15.69 | 10.75 | 8.91 |
| | ||||
| Class R5 | 10/25/2005 | 15.71 | 10.78 | 8.95 |
| | ||||
| Class R6 | 9/24/2012 | 15.78 | 10.86 | 9.03 |
| | ||||
| Russell 1000® Value Index (reflects no deduction for fees, expenses or taxes) | | 15.91 | 11.33 | 10.53 |
| | ||||
| S&P 500® Index (reflects no deduction for fees, expenses or taxes) | | 17.88 | 14.42 | 14.82 |
| | ||||
1
Performance shown prior to the inception date is that of the Fund's Investor Class shares at net asset value restated to reflect the higher 12b-1 fees applicable to Class R shares. Although invested in the same portfolio of securities, Class R shares' returns of the Fund will be different from Investor Class shares' returns of the Fund as they have different expenses.
After-tax returns are calculated using the historical highest individual federal marginal income tax rates and do not reflect the impact of state and local taxes. Actual after-tax returns depend on an investor’s tax situation and may differ from those shown, and after-tax returns shown are not relevant to investors who hold their Fund shares through tax-advantaged arrangements, such as 401(k) plans, 529 college savings plans or individual retirement accounts. After-tax returns are shown for Investor Class shares only and after-tax returns for other classes will vary.
The bar chart and performance table provide an indication of the risks of investing in the Fund. The bar chart shows changes in the performance of the Fund from year to year as of December 31. The performance table compares the Fund’s performance to that of a broad measure of market performance and one or more additional indices with characteristics relevant to the Fund. The Fund's past performance (before and after taxes) is not necessarily an indication of its future performance.
Fund performance reflects any applicable fee waivers and expense reimbursements. Performance returns would be lower without applicable fee waivers and expense reimbursements.
All Fund performance shown assumes the reinvestment of dividends and capital gains and the effect of the Fund’s expenses.
Updated performance information is available on the Fund's website at www.invesco.com/us.
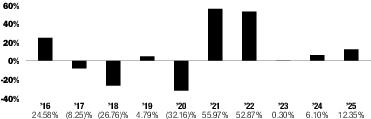
| Investor Class | Period Ended | Returns |
| Year-to-date | June 30, 2026 | 17.52% |
| Best Quarter | March 31, 2022 | 35.66% |
| Worst Quarter | March 31, 2020 | -50.68% |
| | Inception Date | 1 Year | 5 Years | 10 Years |
| Investor Class | | | | |
| Return Before Taxes | 1/19/1984 | 12.35 % | 23.31 % | 5.43 % |
| Return After Taxes on Distributions | | 11.76 | 22.66 | 4.91 |
| Return After Taxes on Distributions and Sale of Fund Shares | | 7.72 | 19.14 | 4.22 |
| | ||||
| Class A | 3/28/2002 | 6.19 | 21.93 | 4.83 |
| | ||||
| Class C | 2/14/2000 | 10.53 | 22.42 | 4.79 |
| | ||||
| Class R1 | 9/30/2025 | 12.09 | 23.01 | 5.16 |
| | ||||
| Class Y | 10/3/2008 | 12.66 | 23.61 | 5.69 |
| | ||||
| Class R5 | 1/31/2006 | 12.74 | 23.76 | 5.87 |
| | ||||
| Class R6 | 4/4/2017 | 12.81 | 23.84 | 5.85 2 |
| | ||||
| MSCI World Energy Index (Net)(reflects reinvested dividends net of withholding taxes, but reflects no deduction for fees, expenses or other taxes) | | 13.32 | 19.54 | 7.62 |
| | ||||
| S&P 500® Index (reflects no deduction for fees, expenses or taxes) | | 17.88 | 14.42 | 14.82 |
| | ||||
1
Performance shown prior to the inception date is that of the Fund's Class A shares at net asset value restated to reflect the higher 12b-1 fees applicable to Class R shares. Although invested in the same portfolio of securities, Class R shares' returns of the Fund will be different from Class A shares' returns of the Fund as they have different expenses.
2
Performance shown prior to the inception date is that of the Fund's Class A shares at net asset value and includes the 12b-1 fees applicable to that class. Although invested in the same portfolio of securities, Class R6 shares' returns of the Fund will be different from Class A shares' returns of the Fund as they have different expenses.
After-tax returns are calculated using the historical highest individual federal marginal income tax rates and do not reflect the impact of state and local taxes. Actual after-tax returns depend on an investor's tax situation and may differ from those shown, and after-tax returns shown are not relevant to investors who hold their Fund shares through tax-advantaged arrangements, such as 401(k) plans, 529 college savings plans or individual retirement accounts. After-tax returns are shown for Investor Class shares only and after-tax returns for other classes will vary.
The bar chart and performance table provide an indication of the risks of investing in the Fund. The Fund has adopted the performance of the Oppenheimer Gold & Special Minerals Fund (the predecessor fund) as the result of a reorganization of the predecessor fund into the Fund, which was consummated after the close of business on May 24, 2019 (the “Reorganization”). Prior to the Reorganization, the Fund had not yet commenced operations. The bar chart shows changes in the performance of the predecessor fund and the Fund from year to year as of December 31. The performance table compares the predecessor fund’s and the Fund’s performance to that of a broad measure of market performance and one or more additional indices with characteristics relevant to the Fund. The Fund’s (and the predecessor fund’s) past performance (before and after taxes) is not necessarily an indication of how the Fund will perform in the future.
The returns shown for periods ending on or prior to May 24, 2019 are those of the Class A, Class C, Class R, Class Y and Class I shares of the predecessor fund. Class A, Class C, Class R, Class Y and Class I shares of the predecessor fund were reorganized into Class A, Class C, Class R, Class Y and Class R6 shares, respectively, of the Fund after the close of business on May 24, 2019. Class A, Class C, Class R, Class Y and Class R6 shares’ returns of the Fund will be different from the returns of the predecessor fund as they have different expenses. Performance for Class A shares has been restated to reflect the Fund’s applicable sales charge.
Fund performance reflects any applicable fee waivers and expense reimbursements. Performance returns would be lower without applicable fee waivers and expense reimbursements.
All Fund performance shown assumes the reinvestment of dividends and capital gains and the effect of the Fund’s expenses.
Updated performance information is available on the Fund’s website at www.invesco.com/us.
The bar chart does not reflect sales loads. If it did, the annual total returns shown would be lower.
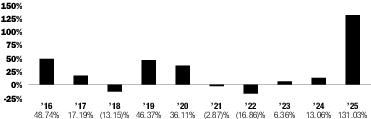
| Class A | Period Ended | Returns |
| Year-to-date | June 30, 2026 | -10.53% |
| Best Quarter | June 30, 2020 | 62.78% |
| Worst Quarter | June 30, 2022 | -32.41% |
| | Inception Date | 1 Year | 5 Years | 10 Years |
| Class A | | | | |
| Return Before Taxes | 7/19/1983 | 118.36 % | 16.22 % | 20.38 % |
| Return After Taxes on Distributions | | 118.12 | 15.76 | 19.64 |
| Return After Taxes on Distributions and Sale of Fund Shares | | 70.22 | 12.87 | 17.16 |
| | ||||
| Class C | 11/1/1995 | 128.30 | 16.65 | 20.33 |
| | ||||
| Class R | 3/1/2001 | 130.58 | 17.25 | 20.75 |
| | ||||
| Class Y | 9/7/2010 | 131.58 | 17.83 | 21.36 |
| | ||||
| Class R5 | 5/24/2019 | 131.73 | 17.93 1 | 21.34 1 |
| | ||||
| Class R6 | 10/26/2012 | 131.89 | 18.00 | 21.56 |
| | ||||
| Philadelphia Gold and Silver Index (reflects no deduction for fees, expenses or taxes) | | 152.80 | 20.94 | 23.94 |
| | ||||
| MSCI ACWI ex USA® Index (Net) (reflects reinvested dividends net of withholding taxes, but reflects no deduction for fees, expenses or other taxes) | | 32.39 | 7.91 | 8.41 |
| | ||||
1
Performance shown on or prior to the inception date is that of the predecessor fund's Class A shares at net asset value and includes the 12b-1 fees applicable to that class. Although invested in the same portfolio of securities, Class R5 shares' returns of the Fund will be different from Class A shares' returns of the predecessor fund as they have different expenses.
After-tax returns are calculated using the historical highest individual federal marginal income tax rates and do not reflect the impact of state and local taxes. Actual after-tax returns depend on an investor's tax situation and may differ from those shown, and after-tax returns shown are not relevant to investors who hold their Fund shares through tax-advantaged arrangements, such as 401(k) plans, 529 college savings plans or individual retirement accounts. After-tax returns are shown for Class A shares only and after-tax returns for other classes will vary.
The bar chart and performance table provide an indication of the risks of investing in the Fund. The bar chart shows changes in the performance of the Fund from year to year as of December 31. The performance table compares the Fund’s performance to that of a broad measure of market performance and one or more additional indices with characteristics relevant to the Fund. The Fund's past performance (before and after taxes) is not necessarily an indication of its future performance.
Fund performance reflects any applicable fee waivers and expense reimbursements. Performance returns would be lower without applicable fee waivers and expense reimbursements.
All Fund performance shown assumes the reinvestment of dividends and capital gains and the effect of the Fund’s expenses.
Updated performance information is available on the Fund's website at www.invesco.com/us.
The bar chart does not reflect sales loads. If it did, the annual total returns shown would be lower.
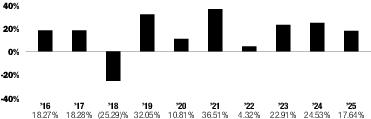
| Class A | Period Ended | Returns |
| Year-to-date | June 30, 2026 | 34.69% |
| Best Quarter | December 31, 2020 | 41.02% |
| Worst Quarter | March 31, 2020 | -44.59% |
| | Inception Date | 1 Year | 5 Years | 10 Years |
| Class A | | | | |
| Return Before Taxes | 6/21/1999 | 11.16 % | 19.37 % | 13.99 % |
| Return After Taxes on Distributions | | 8.87 | 16.42 | 11.46 |
| Return After Taxes on Distributions and Sale of Fund Shares | | 8.15 | 14.74 | 10.62 |
| | ||||
| Class C | 6/21/1999 | 15.81 | 19.81 | 13.98 |
| | ||||
| Class R | 4/17/2020 | 17.27 | 20.41 1 | 14.34 1 |
| | ||||
| Class Y | 8/12/2005 | 17.95 | 21.02 | 14.93 |
| | ||||
| Class R6 | 2/7/2017 | 18.06 | 21.18 | 15.04 2 |
| | ||||
| Russell 2000® Value Index (reflects no deduction for fees, expenses or taxes) | | 12.59 | 8.88 | 9.27 |
| | ||||
| S&P 500® Index (reflects no deduction for fees, expenses or taxes) | | 17.88 | 14.42 | 14.82 |
| | ||||
1
Performance shown prior to the inception date is that of the Fund's Class A shares at net asset value restated to reflect the higher 12b-1 fees applicable to Class R shares. Although invested in the same portfolio of securities, Class R shares' returns of the Fund will be different from Class A shares' returns of the Fund as they have different expenses.
2
Performance shown prior to the inception date is that of the Fund's Class A shares at net asset value and includes the 12b-1 fees applicable to that class. Although invested in the same portfolio of securities, Class R6 shares' returns of the Fund will be different from Class A shares' returns of the Fund as they have different expenses.
After-tax returns are calculated using the historical highest individual federal marginal income tax rates and do not reflect the impact of state and local taxes. Actual after-tax returns depend on an investor's tax situation and may differ from those shown, and after-tax returns shown are not relevant to investors who hold their Fund shares through tax-advantaged arrangements, such as 401(k) plans, 529 college savings plans or individual retirement accounts. After-tax returns are shown for Class A shares only and after-tax returns for other classes will vary.
The bar chart and performance table provide an indication of the risks of investing in the Fund. The bar chart shows changes in the performance of the Fund from year to year as of December 31. The performance table compares the Fund’s performance to that of a broad measure of market performance and one or more additional indices with characteristics relevant to the Fund. The Fund's past performance (before and after taxes) is not necessarily an indication of its future performance.
Fund performance reflects any applicable fee waivers and expense reimbursements. Performance returns would be lower without applicable fee waivers and expense reimbursements.
All Fund performance shown assumes the reinvestment of dividends and capital gains and the effect of the Fund’s expenses.
Updated performance information is available on the Fund's website at www.invesco.com/us.
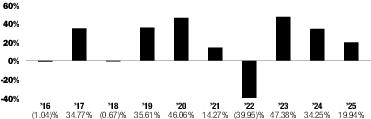
| Investor Class | Period Ended | Returns |
| Year-to-date | June 30, 2026 | 47.09% |
| Best Quarter | June 30, 2020 | 32.62% |
| Worst Quarter | June 30, 2022 | -23.56% |
| | Inception Date | 1 Year | 5 Years | 10 Years |
| Investor Class | | | | |
| Return Before Taxes | 1/19/1984 | 19.94 % | 10.24 % | 15.63 % |
| Return After Taxes on Distributions | | 12.93 | 6.96 | 12.95 |
| Return After Taxes on Distributions and Sale of Fund Shares | | 15.07 | 7.46 | 12.40 |
| | ||||
| Class A | 3/28/2002 | 13.24 | 8.88 | 14.86 |
| | ||||
| Class C | 2/14/2000 | 18.16 | 9.30 | 14.82 |
| | ||||
| Class R1 | 9/30/2025 | 19.54 | 9.84 | 15.22 |
| | ||||
| Class Y | 10/3/2008 | 20.11 | 10.39 | 15.80 |
| | ||||
| Class R5 | 12/21/1998 | 20.16 | 10.45 | 15.93 |
| | ||||
| Class R6 | 4/4/2017 | 20.26 | 10.53 | 15.91 2 |
| | ||||
| S&P North American Technology Sector Index (reflects no deduction for fees, expenses or taxes) | | 27.82 | 18.02 | 22.54 |
| | ||||
| S&P 500® Index (reflects no deduction for fees, expenses or taxes) | | 17.88 | 14.42 | 14.82 |
| | ||||
1
Performance shown prior to the inception date is that of the Fund's Class A shares at net asset value restated to reflect the higher 12b-1 fees applicable to Class R shares. Although invested in the same portfolio of securities, Class R shares' returns of the Fund will be different from Class A shares' returns of the Fund as they have different expenses.
2
Performance shown prior to the inception date is that of the Fund's Class A shares at net asset value and includes the 12b-1 fees applicable to that class. Although invested in the same portfolio of securities, Class R6 shares' returns of the Fund will be different from Class A shares' returns of the Fund as they have different expenses.
After-tax returns are calculated using the historical highest individual federal marginal income tax rates and do not reflect the impact of state and local taxes. Actual after-tax returns depend on an investor's tax situation and may differ from those shown, and after-tax returns shown are not relevant to investors who hold their Fund shares through tax-advantaged arrangements, such as 401(k) plans, 529 college savings plans or individual retirement accounts. After-tax returns are shown for Investor Class shares only and after-tax returns for other classes will vary.
The bar chart and performance table provide an indication of the risks of investing in the Fund. The bar chart shows changes in the performance of the Fund from year to year as of December 31. The performance table compares the Fund’s performance to that of a broad measure of market performance and one or more additional indices with characteristics relevant to the Fund. The Fund's past performance (before and after taxes) is not necessarily an indication of its future performance.
Fund performance reflects any applicable fee waivers and expense reimbursements. Performance returns would be lower without applicable fee waivers and expense reimbursements.
All Fund performance shown assumes the reinvestment of dividends and capital gains and the effect of the Fund’s expenses.
Updated performance information is available on the Fund's website at www.invesco.com/us.
The bar chart does not reflect sales loads. If it did, the annual total returns shown would be lower.
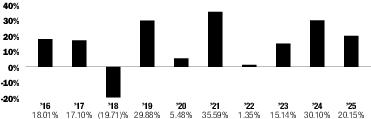
| Class A | Period Ended | Returns |
| Year-to-date | June 30, 2026 | 24.05% |
| Best Quarter | December 31, 2020 | 31.50% |
| Worst Quarter | March 31, 2020 | -38.65% |
| | Inception Date | 1 Year | 5 Years | 10 Years |
| Class A | | | | |
| Return Before Taxes | 6/25/2001 | 13.53 % | 18.51 % | 13.51 % |
| Return After Taxes on Distributions | | 11.01 | 16.43 | 11.93 |
| Return After Taxes on Distributions and Sale of Fund Shares | | 9.84 | 14.58 | 10.79 |
| | ||||
| Class C | 6/25/2001 | 18.23 | 18.96 | 13.50 |
| | ||||
| Class R | 5/23/2011 | 19.87 | 19.55 | 13.88 |
| | ||||
| Class Y | 3/23/2005 | 20.45 | 20.15 | 14.44 |
| | ||||
| Class R5 | 5/23/2011 | 20.49 | 20.20 | 14.56 |
| | ||||
| Class R6 | 4/4/2017 | 20.59 | 20.30 | 14.56 1 |
| | ||||
| Russell Midcap® Value Index (reflects no deduction for fees, expenses or taxes) | | 11.05 | 9.83 | 9.78 |
| | ||||
| S&P 500® Index (reflects no deduction for fees, expenses or taxes) | | 17.88 | 14.42 | 14.82 |
| | ||||
1
Performance shown prior to the inception date is that of the Fund's Class A shares at net asset value and includes the 12b-1 fees applicable to that class. Although invested in the same portfolio of securities, Class R6 shares' returns of the Fund will be different from Class A shares' returns of the Fund as they have different expenses.
After-tax returns are calculated using the historical highest individual federal marginal income tax rates and do not reflect the impact of state and local taxes. Actual after-tax returns depend on an investor's tax situation and may differ from those shown, and after-tax returns shown are not relevant to investors who hold their Fund shares through tax-advantaged arrangements, such as 401(k) plans, 529 college savings plans or individual retirement accounts. After-tax returns are shown for Class A shares only and after-tax returns for other classes will vary.