Aug. 27, 2026
The Fund’s investment objective is long-term growth of capital.
This table describes the fees and expenses that you may pay if you buy, hold and sell shares of the Fund.
The table and Examples below do not reflect any transaction fees that may be charged by financial intermediaries or commissions that a shareholder may be required to pay directly to its financial intermediary when buying or selling Class Y or Class R6 shares. You may qualify for sales charge discounts if you and your family invest, or agree to invest in the future, at least $50,000 in the Invesco Funds. More information about these and other discounts is available from your financial professional and in the section “Shareholder Account Information – Initial Sales Charges (Class A Shares Only)” on page A-3 of the prospectus and the section “Purchase, Redemption and Pricing of Shares – Purchase and Redemption of Shares” on page L-1 of the statement of additional information (SAI).
| Shareholder Fees (fees paid directly from your investment) | |||||
| Class: | A | C | R | Y | R6 |
| Maximum Sales Charge (Load) Imposed on Purchases (as a percentage of offering price) | 5.50 % | None | None | None | None |
| | |||||
| Maximum Deferred Sales Charge (Load) (as a percentage of original purchase price or redemption proceeds, whichever is less) | None1 | 1.00 % | None | None | None |
| | |||||
| Annual Fund Operating Expenses (expenses that you pay each year as a percentage of the value of your investment) | |||||
| Class: | A | C | R | Y | R6 |
| Management Fees | 0.62 % | 0.62 % | 0.62 % | 0.62 % | 0.62 % |
| | |||||
| Distribution and/or Service (12b-1) Fees | 0.25 | 1.00 | 0.50 | None | None |
| | |||||
| Other Expenses | 0.18 | 0.18 | 0.18 | 0.18 | 0.06 |
| | |||||
| Acquired Fund Fees and Expenses | 0.02 | 0.02 | 0.02 | 0.02 | 0.02 |
| | |||||
| Total Annual Fund Operating Expenses | 1.07 | 1.82 | 1.32 | 0.82 | 0.70 |
| | |||||
| 1 | A contingent deferred sales charge may apply in some cases. See “Shareholder Account Information-Contingent Deferred Sales Charges (CDSCs).” |
This Example is intended to help you compare the cost of investing in the Fund with the cost of investing in other mutual funds.
The Example assumes that you invest $10,000 in the Fund for the time periods indicated and then redeem all of your shares at the end of those periods. This Example does not include commissions and/or other forms of compensation that investors may pay on transactions in Class Y and Class R6 shares. The Example also assumes that your investment has a 5% return each year and that the Fund’s operating expenses remain the same.
Although your actual costs may be higher or lower, based on these assumptions, your costs would be:
|
|
1 Year
|
3 Years
|
5 Years
|
10 Years
|
|
Class A
|
$653 |
$872 |
$1,108 |
$1,784 |
|
|
||||
|
Class C
|
$285 |
$573 |
$985 |
$1,940 |
|
|
||||
|
Class R
|
$134 |
$418 |
$723 |
$1,590 |
|
|
||||
|
Class Y
|
$84 |
$262 |
$455 |
$1,014 |
|
|
||||
|
Class R6
|
$72 |
$224 |
$390 |
$871 |
|
|
||||
You would pay the following expenses if you did not redeem your shares:
|
|
1 Year
|
3 Years
|
5 Years
|
10 Years
|
|
Class A
|
$653 |
$872 |
$1,108 |
$1,784 |
|
|
||||
|
Class C
|
$185 |
$573 |
$985 |
$1,940 |
|
|
||||
|
Class R
|
$134 |
$418 |
$723 |
$1,590 |
|
|
||||
|
Class Y
|
$84 |
$262 |
$455 |
$1,014 |
|
|
||||
|
Class R6
|
$72 |
$224 |
$390 |
$871 |
|
|
||||
The Fund pays transaction costs, such as commissions, when it buys and sells securities (or “turns over” its portfolio). A higher portfolio turnover rate may indicate higher transaction costs and may result in higher taxes when Fund shares are held in a taxable account. These costs, which are not reflected in annual fund operating expenses or in the Example, affect the Fund’s performance. During the most recent fiscal year, the Fund’s portfolio turnover rate was 79% of the average value of its portfolio.
The Fund invests, under normal circumstances, at least 80% of its net assets (plus any borrowings for investment purposes) in securities of small capitalization value companies, and in derivatives and other instruments that have economic characteristics similar to such securities. Value companies are those that Invesco Advisers, Inc. (Invesco or the Adviser), the Fund's investment adviser, believes are undervalued. The Fund focuses on equity securities of such companies, the principal type of which the Fund invests is common stock.
For purposes of the Fund's 80% investment policy, the Fund considers a small-capitalization value company to be one that (i) has a market capitalization, no larger than the market capitalization of the largest capitalized company included in the Russell 2000® Index during the most recent 11-month period (based on month-end data) plus the most recent data during the current month, and (ii) is included in at least one of the Russell 3000® Value Index, S&P 1500® Value Index, or Bloomberg 3000® Value Index; or is classified as “value” by a third party financial data provider; or has a 1-year price-to-book (P/B) ratio or 1-year price-to-sales (P/S) ratio that is below the equity market median, as represented by the S&P 500® Index. A company’s “market capitalization” is the value of its outstanding stock.
The Fund may invest up to 15% of its net assets in real estate investment trusts (REITs).
The Fund may invest up to 25% of its net assets in securities of foreign issuers, including securities of issuers located in emerging market countries, i.e., those that are generally in the early stages of their industrial cycles, and depositary receipts.
The Fund can invest in derivative instruments including forward foreign currency contracts, futures contracts and options.
The Fund can use forward foreign currency contracts to seek to hedge against adverse movements in the foreign currencies in which portfolio securities are denominated or otherwise manage exposure to foreign currency exchange risk.
The Fund can use futures contracts to seek exposure to certain asset classes.
The Fund can use options to seek investment return or to mitigate risk and to hedge against adverse movements in the foreign currencies in which portfolio securities are denominated.
Derivatives and other instruments that provide investment exposure to the investments subject to the 80% investment policy stated above and derivatives that provide investment exposure to one or more market risk factors associated with such investments may be included in the Fund’s 80% investment policy.
The Fund emphasizes a value style of investing. In selecting securities, the portfolio managers emphasize the following characteristics, although not all investments will have these attributes:
■
Buy businesses trading at a significant discount to the portfolio managers’ estimate of intrinsic value. The portfolio managers believe intrinsic value represents the fair economic worth of the business.
■
Emphasize quality businesses with potential to grow intrinsic value over time. The portfolio managers primarily seek established issuers which they believe have solid growth prospects, the ability to earn an attractive return on invested capital and a management team that exhibits intelligent capital allocation skills.
The portfolio managers will consider selling a security if a more attractive investment opportunity is identified, if a security is trading near or above the portfolio managers’ estimate of intrinsic value or if there is a fundamental deterioration in business prospects that results in inadequate upside potential to estimated intrinsic value.
The portfolio managers seek to achieve strong long-term performance by constructing a diversified portfolio that they believe offers value content greater than the broad market, as measured by the portfolio’s aggregate discount to the portfolio managers’ estimated intrinsic value of the portfolio. The investment process is fundamental in nature and focused on individual issuers as opposed to macroeconomic forecasts or specific industry exposure. The portfolio construction process is intended to preserve and grow the estimated intrinsic value of the Fund’s portfolio rather than mirror the composition or sector weights of any benchmark.
The bar chart and performance table provide an indication of the risks of investing in the Fund. The bar chart shows changes in the performance of the Fund from year to year as of December 31. The performance table compares the Fund’s performance to that of a broad measure of market performance and one or more additional indices with characteristics relevant to the Fund. The Fund's past performance (before and after taxes) is not necessarily an indication of its future performance.
Fund performance reflects any applicable fee waivers and expense reimbursements. Performance returns would be lower without applicable fee waivers and expense reimbursements.
All Fund performance shown assumes the reinvestment of dividends and capital gains and the effect of the Fund’s expenses.
Updated performance information is available on the Fund's website at www.invesco.com/us.
The bar chart does not reflect sales loads. If it did, the annual total returns shown would be lower.
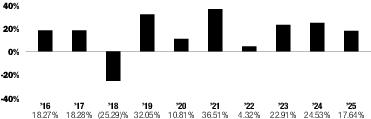
| Class A | Period Ended | Returns |
| Year-to-date | June 30, 2026 | 34.69% |
| Best Quarter | December 31, 2020 | 41.02% |
| Worst Quarter | March 31, 2020 | -44.59% |
| | Inception Date | 1 Year | 5 Years | 10 Years |
| Class A | | | | |
| Return Before Taxes | 6/21/1999 | 11.16 % | 19.37 % | 13.99 % |
| Return After Taxes on Distributions | | 8.87 | 16.42 | 11.46 |
| Return After Taxes on Distributions and Sale of Fund Shares | | 8.15 | 14.74 | 10.62 |
| | ||||
| Class C | 6/21/1999 | 15.81 | 19.81 | 13.98 |
| | ||||
| Class R | 4/17/2020 | 17.27 | 20.41 1 | 14.34 1 |
| | ||||
| Class Y | 8/12/2005 | 17.95 | 21.02 | 14.93 |
| | ||||
| Class R6 | 2/7/2017 | 18.06 | 21.18 | 15.04 2 |
| | ||||
| Russell 2000® Value Index (reflects no deduction for fees, expenses or taxes) | | 12.59 | 8.88 | 9.27 |
| | ||||
| S&P 500® Index (reflects no deduction for fees, expenses or taxes) | | 17.88 | 14.42 | 14.82 |
| | ||||
1
Performance shown prior to the inception date is that of the Fund's Class A shares at net asset value restated to reflect the higher 12b-1 fees applicable to Class R shares. Although invested in the same portfolio of securities, Class R shares' returns of the Fund will be different from Class A shares' returns of the Fund as they have different expenses.
2
Performance shown prior to the inception date is that of the Fund's Class A shares at net asset value and includes the 12b-1 fees applicable to that class. Although invested in the same portfolio of securities, Class R6 shares' returns of the Fund will be different from Class A shares' returns of the Fund as they have different expenses.
After-tax returns are calculated using the historical highest individual federal marginal income tax rates and do not reflect the impact of state and local taxes. Actual after-tax returns depend on an investor's tax situation and may differ from those shown, and after-tax returns shown are not relevant to investors who hold their Fund shares through tax-advantaged arrangements, such as 401(k) plans, 529 college savings plans or individual retirement accounts. After-tax returns are shown for Class A shares only and after-tax returns for other classes will vary.